Abstract
For assessment of the insulation performance of high-voltage (HV) equipment installed in extra-high-voltage (EHV) systems, switching impulse voltage tests are performed in an HV testing laboratory. The waveform parameters of the switching impulse voltages are defined by peak voltage (Up), time to crest (Tp), and time to half (T2) according to IEC 60060-1. In this paper, a new, simplified, and accurate approach used for determination of the waveform parameters of the switching impulse voltages is presented. The formula used in the evaluation of Tp was derived from analytically simulated two-exponential waveforms, where Tp and T2 are in the ranges of 20 μs to 300 μs and 1000 μs to 4000 μs, respectively. The accuracy of the proposed approach was validated by the waveforms collected from the test waveform data generator (TDG) provided by IEC 61083-2, simulations, and experiments. It is found that the accuracy of the proposed approach is relatively higher than the expressions provided by IEC 60060-1 and previously developed. The proposed method is an alternative and useful approach for evaluating the waveform parameters of the standard switching impulse voltage.
1. Introduction
The main causes of insulation failures in high-voltage equipment are overvoltages due to lightning and switching operations in high-voltage (HV) energy transmission and distribution systems. Therefore, the international standards [1,2,3,4,5] suggest performing impulse voltage tests on HV equipment to confirm its insulation performance. The standard lightning and switching impulse voltages can be generated by a simple resistor and capacitor circuit [6]. Switching overvoltages are caused by switching operations of circuit breakers and disconnecting switches in HV power systems, and the insulation performance of HV equipment under switching overvoltages has still not been completely studied [7,8,9]. Switching overvoltages produce high electrical field stresses with quite a long time period (several milliseconds) on the insulation of the HV equipment and can possibly cause insulation failures. Thus, according to IEC standards [4], the insulation performance of HV equipment operating at a system voltage of not less than 300 kV must be confirmed using a switching impulse voltage test.
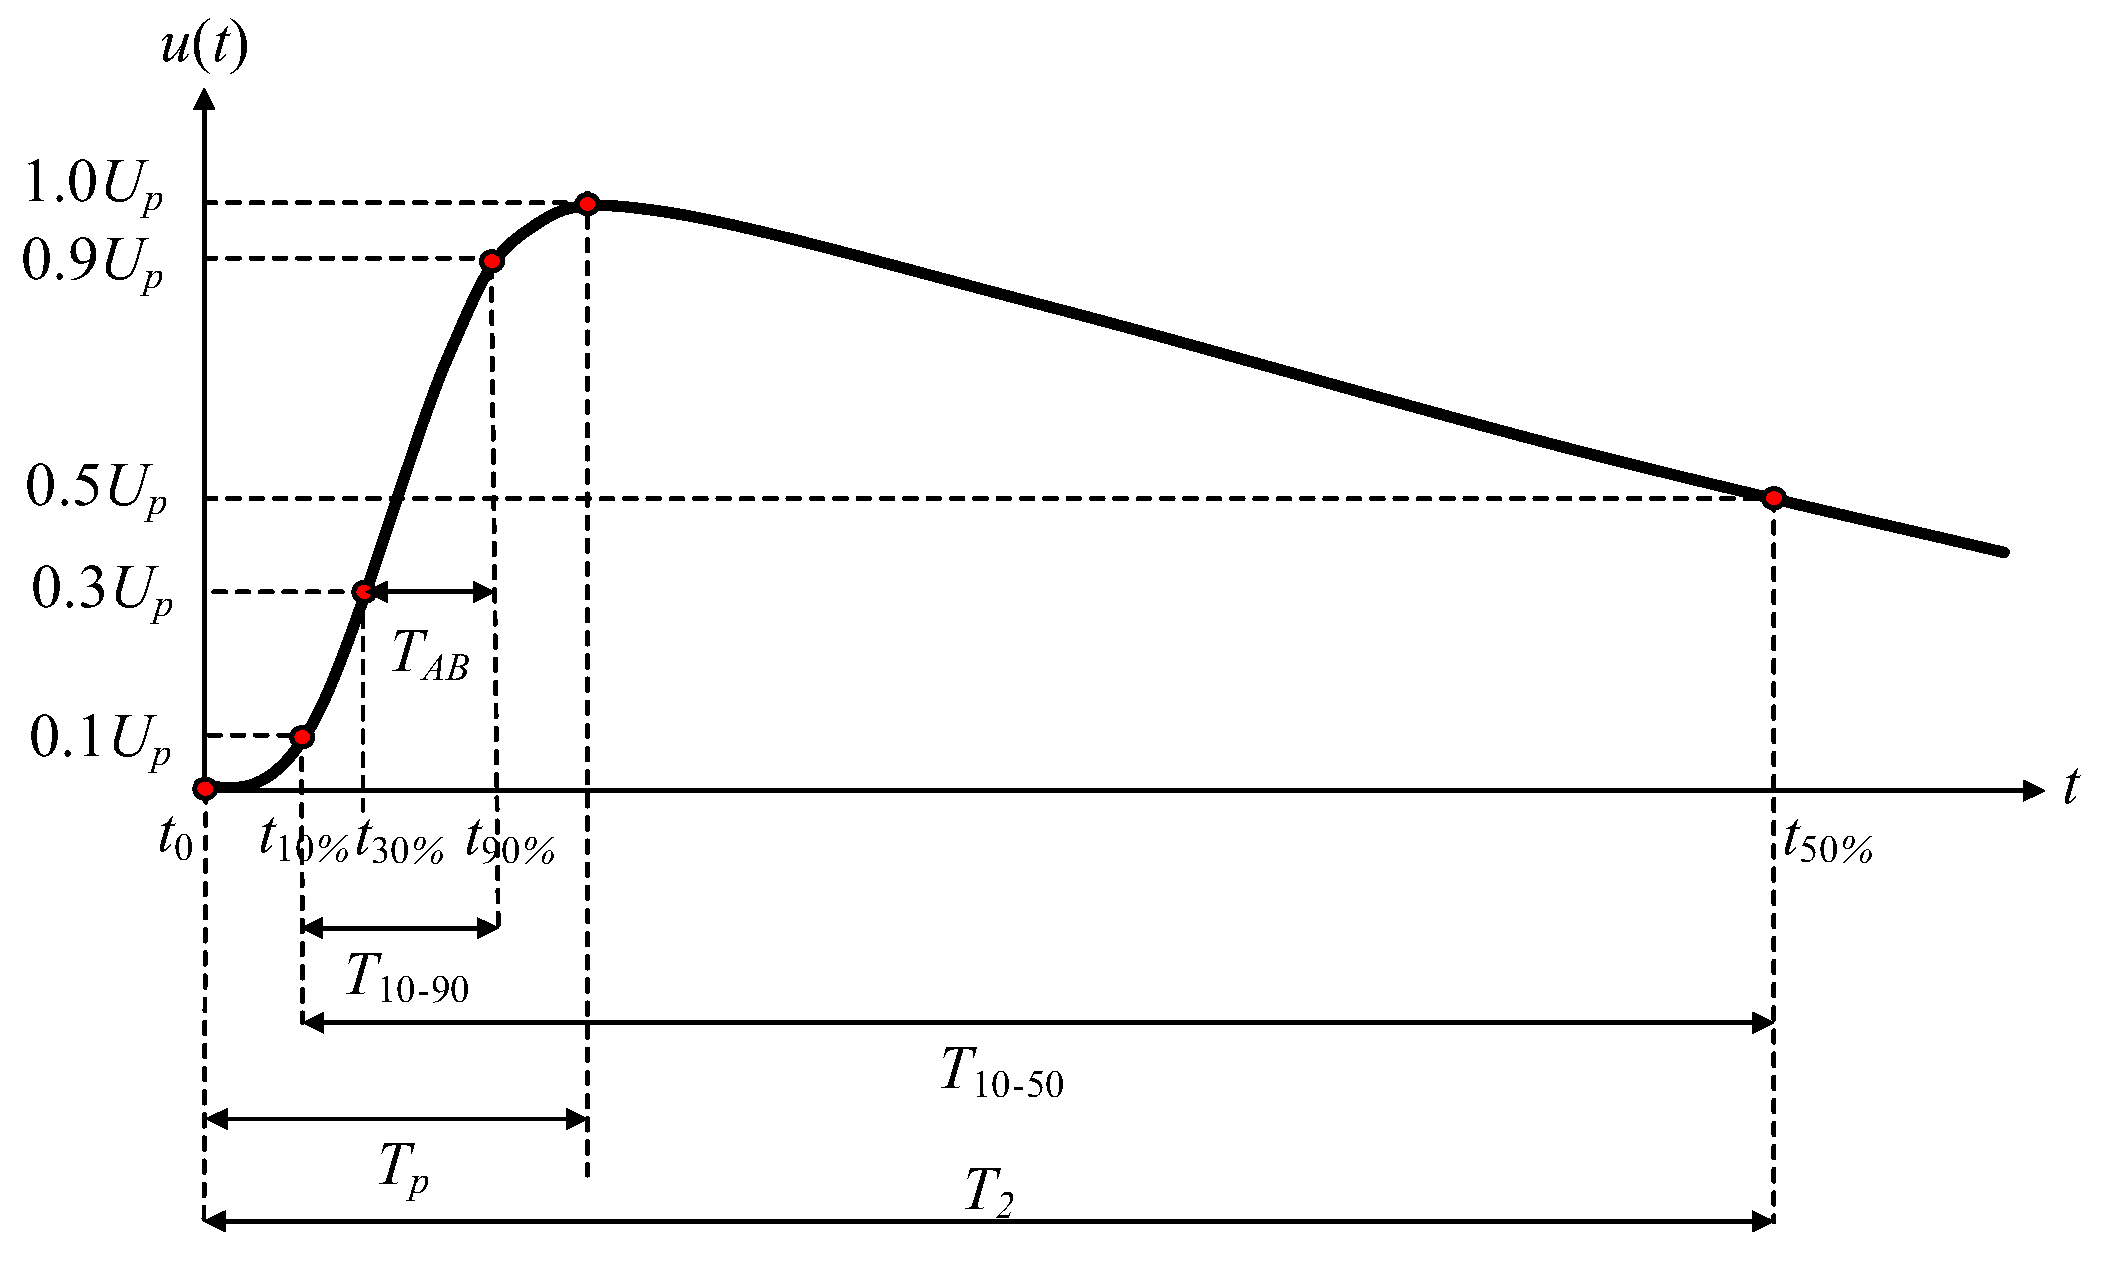
In impulse voltage tests, the software used for the evaluation of the impulse waveform parameters must be assessed for accuracy using the waveform generated by the test data generator (TDG) program attached to IEC 61083-2 [10]. The evaluation of the lightning and switching impulse voltage waveform parameters has been widely studied [11,12,13,14,15,16,17]. In the switching impulse voltage tests, the waveform parameters must be adjusted as per the standard requirements [1,2,3,4,5]. As illustrated in Figure 1, the time to crest (Tp), the time to half (T2), and the peak voltage (Up) shall be 250 μs ± 20%, 2500 μs ± 60%, and the specified value depending on the system voltage with a tolerance of ±3%, respectively. T2 is defined as the duration time from the actual origin time (t0) to the time (t50%) at 50% of the peak voltage at the tail part of the waveform. T2 can be determined by proper search and interpolation algorithms. Up can be determined by searching for the maximum value for the positive waveform or the minimum value for the negative waveform after the offset voltage is removed from the considered waveform. However, there are some difficulties in determining t0 and Tp due to noise superimposing on the recorded waveform. In addition, Tp cannot be determined precisely due to noise and a long duration time around the peak voltage. According to the standard [1], Tp can be calculated by Equation (1), where K and TAB are defined as Equations (2) and (3).
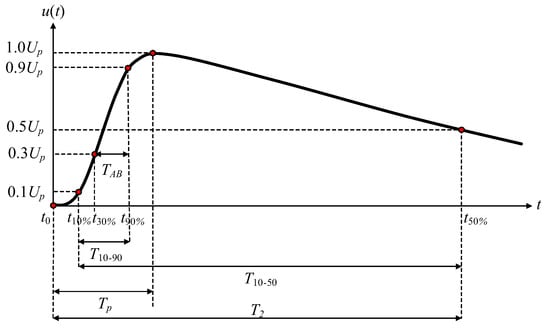
Figure 1.
Switching impulse voltage waveform and the waveform parameters.
For determination of Tp, however, it was reported that Tp determined by Equation (1) is accurate in only some cases where the times to crest and the times to half are close to 250 μs and 2500 μs, respectively. There is some research which presents approaches for the determination of the accurate time to crest [16]. The analytical formulas for estimating the waveform parameters Tp, T2, and Up were proposed in [16]. Tp is also determined from TAB and the estimated starting point of the considered waveform. The formulas can estimate the waveforms derived from simulated two-exponential waveforms precisely, but deviations in the parameters are increased in the cases of experimental waveforms. In [17], two-exponential fitting based on a non-linear regression on the waveform data around the crest value was employed to estimate the waveform parameters accurately. Since this method requires software for estimation of the parameters, it is not useful for test engineers for determination of the waveform parameters when compared with the standard and previously developed formulas.
In this paper, a practical approach for the determination of the waveform parameters of the switching impulse voltage was developed. A simple, but relatively accurate approach for the determination of t0 is proposed. Furthermore, the accurate formula used in the evaluation of Tp was derived from the analytically simulated two-exponential waveforms, where Tp and T2 are in the ranges of 20 μs to 300 μs and 1000 μs to 4000 μs, respectively. The waveforms collected from the standard [10], simulations and experiments were utilized for verification of the proposed approach. The proposed approach provides relatively high accuracy when compared with those calculated by the standard [1] and the previously developed formula [16]. This paper is organized as follows. Section 1 introduces the problem of evaluation of the waveform parameters of the switching impulse voltages in HV tests and performs the literature review. Section 2 describes an approach for the analytical generation of switching impulse voltages on the basis of the two-exponential function employed for the development of the new expressions. The development of a new and accurate expression for the determination of the waveform parameters is also presented. The proposed expressions and their verification are presented in Section 3. At the end of this paper, the conclusions are addressed.
2. Development of the Approach for Evaluation of the Switching Impulse Voltage Parameters
The new accurate approach for evaluation of the switching impulse voltage parameters is developed from the waveform parameters of the impulse voltage waveforms in the form of a two-exponential function, as given in Equation (4). It is quite straightforward to determine Tp and T2 from the known τ1 and τ2. From Equation (4), Tp can be calculated analytically by Equation (5), but there is no analytical expression of T2; it can be calculated by Equation (6) using a numerical approach. A simple Newton–Raphson algorithm [18] is an effective method used in this paper.
However, accurate τ1 and τ2 computed from Tp and T2 are required for the development of the proposed approach. In this section, the effective approach for determination of τ1 and τ2 from Tp and T2 will be presented in Section 2.1, and the analytical formula for the required waveform parameters will be presented in Section 2.2.
2.1. Analytical Generation of Switching Impulse Waveforms
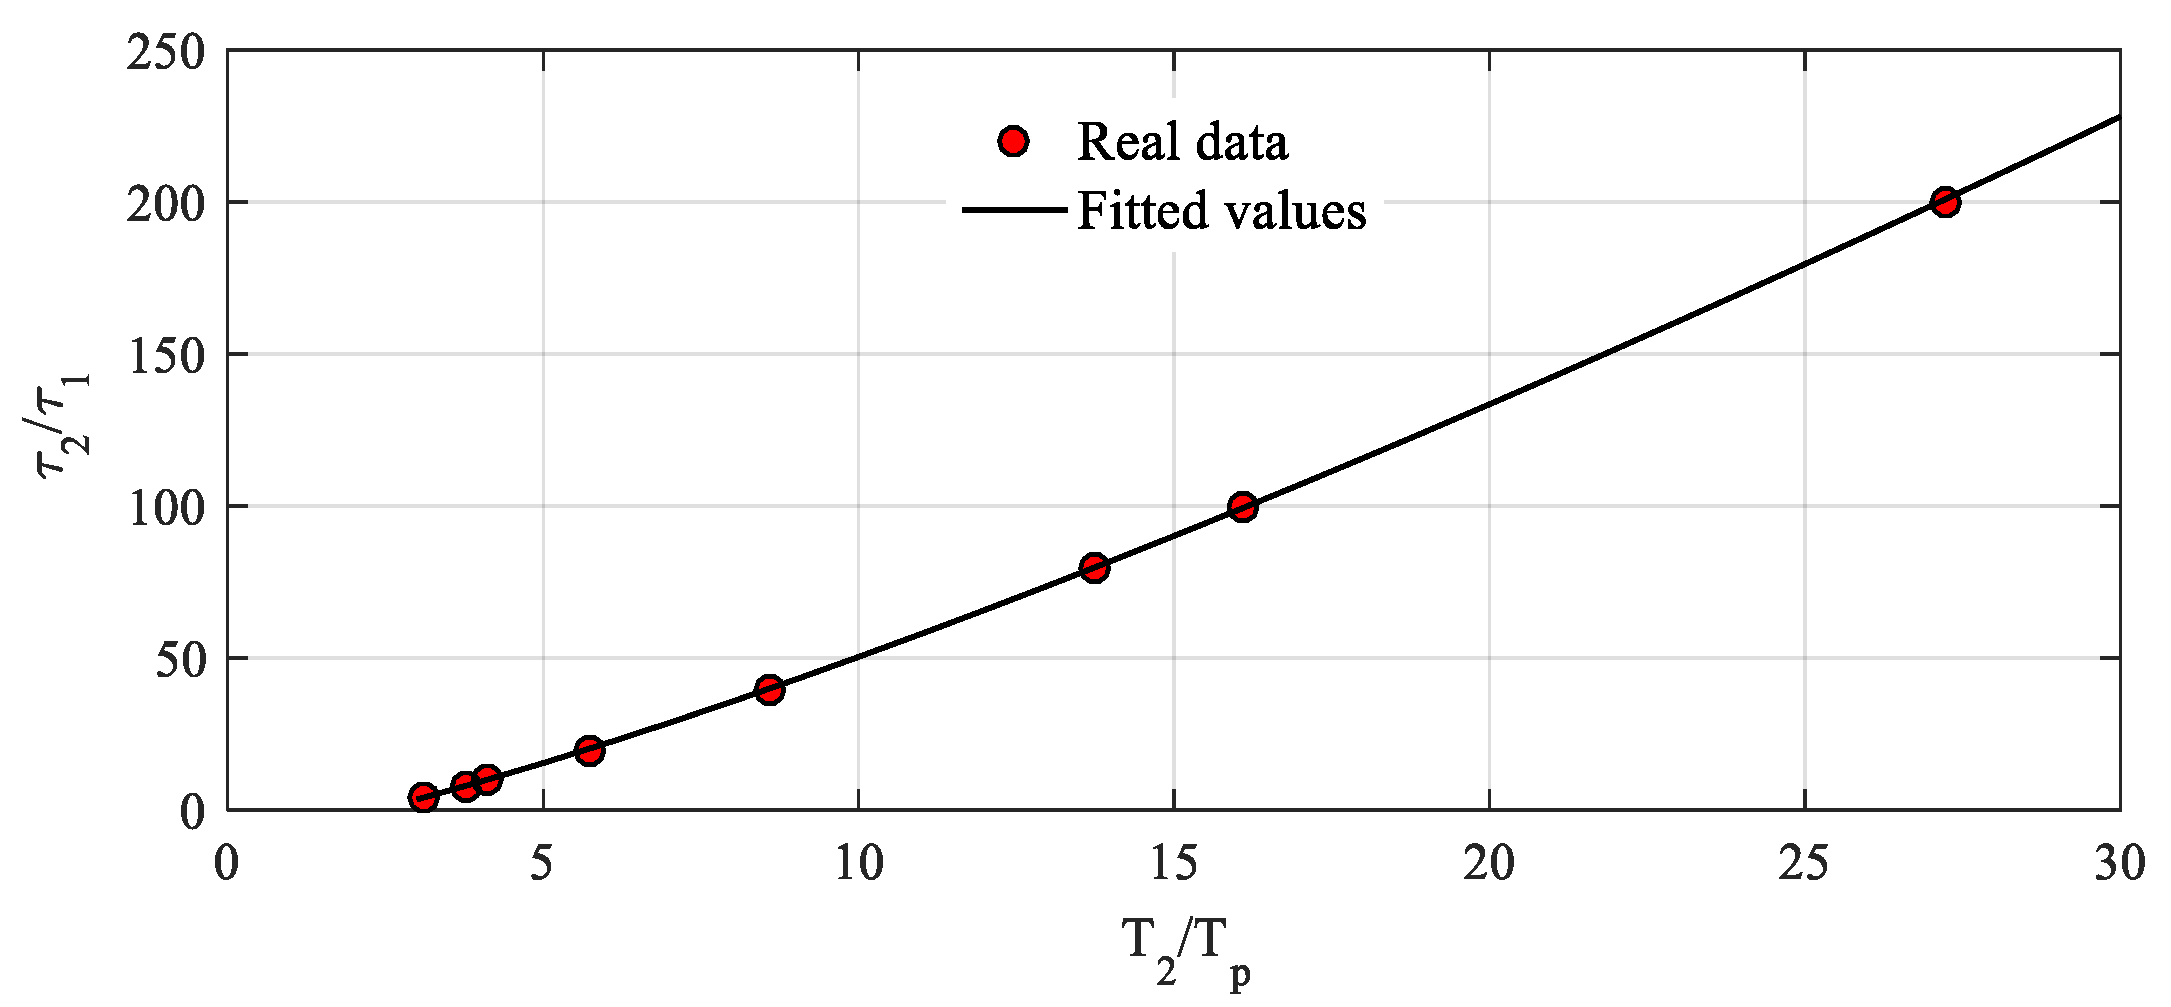
For generation of the accurate waveform in the form of a two-exponential function described by T2 and Tp, it is necessary to know the accurate time constants of τ1 and τ2. In this paper, a time normalization technique was utilized to reduce the number of variables, and the secant method [18] was employed to determine the solution or the required time parameters. It is noticed that the ratio of T2 to Tp (T2/Tp) has a monotonic relation with the ratio of τ2 to τ1 (τ2/τ1), as expressed in Figure 2, of which the range covers Tp of 20 μs to 300 μs and T2 of 1000 μs to 4000 μs. Therefore, the relation of T2/Tp and τ2/τ1 can be represented as functions in Equations (7) and (8).
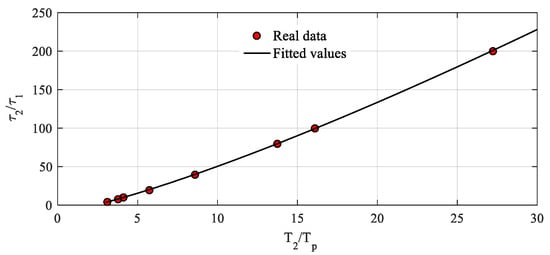
Figure 2.
τ2/τ1 as the function of T2/Tp and the fitting curve.
In this paper, the normalized base was selected to be τ1, and all normalized time parameters (τ1n, τ2n, T2n, and Tpn) are given by Equation (9).
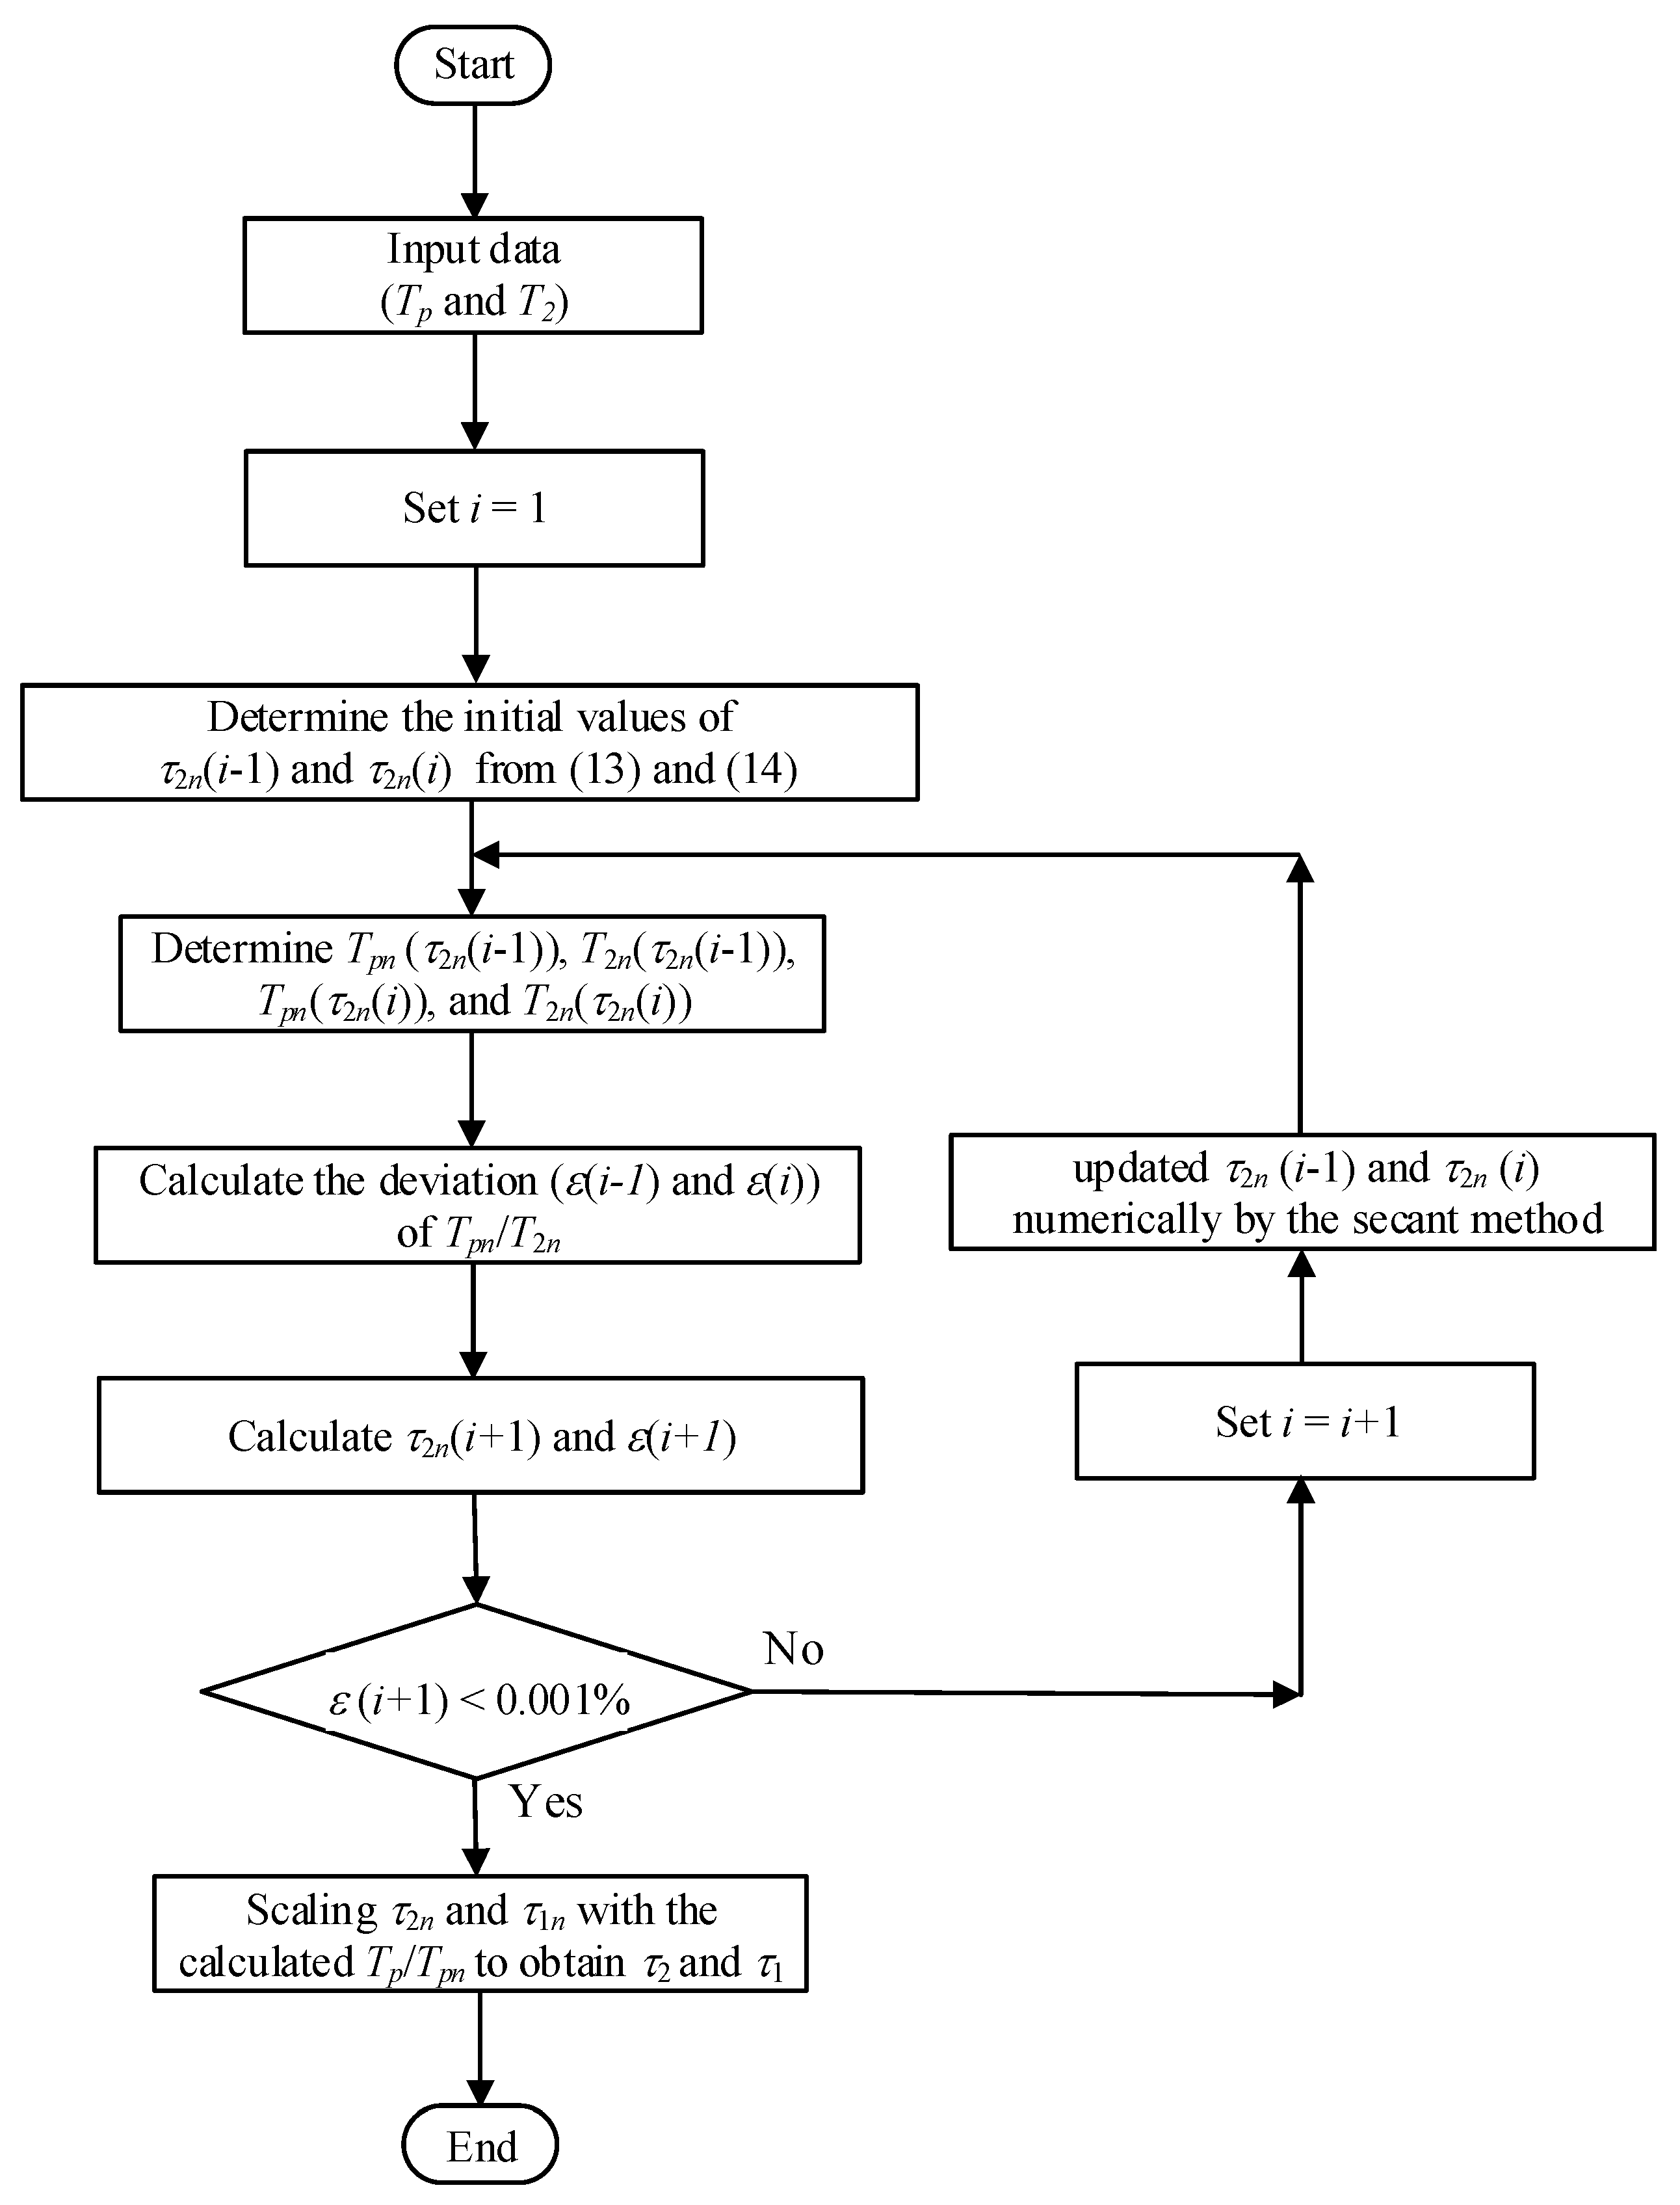
The procedure for determination of τ1 and τ2 from the input variable of T2 and Tp is presented in the flowchart shown in Figure 3.
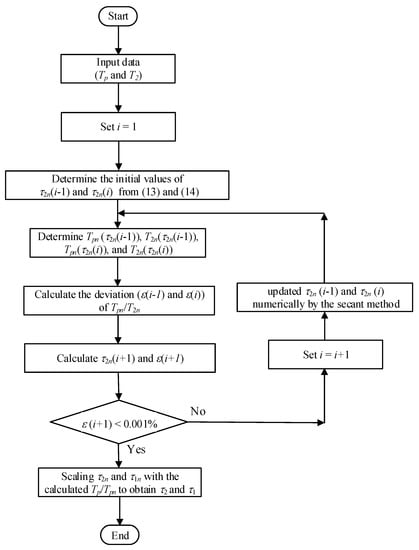
Figure 3.
Algorithm used for generation of the impulse switching waveform with the specified T2 and Tp.
From Equation (10), the secant method is employed to find the solutions of τ2n from Tpn/T2n, which equals Tp/T2. The goal of the secant method is to determine τ2n where the deviation (ε) of Tpn/T2n is minimized, and the deviation goal was set to be 0.001%. Equation (11) can be utilized to calculate the deviation ε(i) of the solution of the ith iteration, where T2n(τ2n(i)) is the normalized parameter calculated by the Newton–Raphson algorithm [18] at τ2n(i), and Tpn(τ2n(i)) is calculated by the analytical formula expressed by Equation (5). From the calculated ε(i), (τ2n(i + 1)) is calculated by Equation (12). τ2n is calculated repetitively until the deviation goal is reached.
The secant method requires the initial values of τ2n(0) and τ2n(1). From the relation of T2/Tp and τ2/τ1 in Figure 3, the initial values are set as given by Equations (13) and (14).
With the initial values in Equations (13) and (14), only two or three iterations are required to reach the deviation goal. Finally, τ1 and τ2 can be determined from Equation (9) with the known Tp and Tpn, which can be calculated by Equation (5). Using the proposed method for the determination of τ1 and τ2 from the specified T2 and Tp, the switching impulse voltage waveforms with Tp from 10 μs to 300 μs and T2 from 1000 μs to 4000 μs can be precisely generated analytically.
From the calculated τ2/τ1 determined by T2/Tp using the proposed method, a numerical curve fitting based on a Levenberg–Marquardt algorithm [19] was employed and the formula of the fitting curve given in Equation (15) was obtained. It is noted that the formula can be used for the initial values in the secant method. In fact, the formula is quite accurate and the maximum deviation of the value from the formula and the actual value is less than 0.5%. However, if more accurate results are required, it is recommended to utilize the proposed method, as it is used in the paper with a deviation of less than 0.001%.
2.2. The New Approach for Evaluation of the Switching Impulse Voltage Parameters
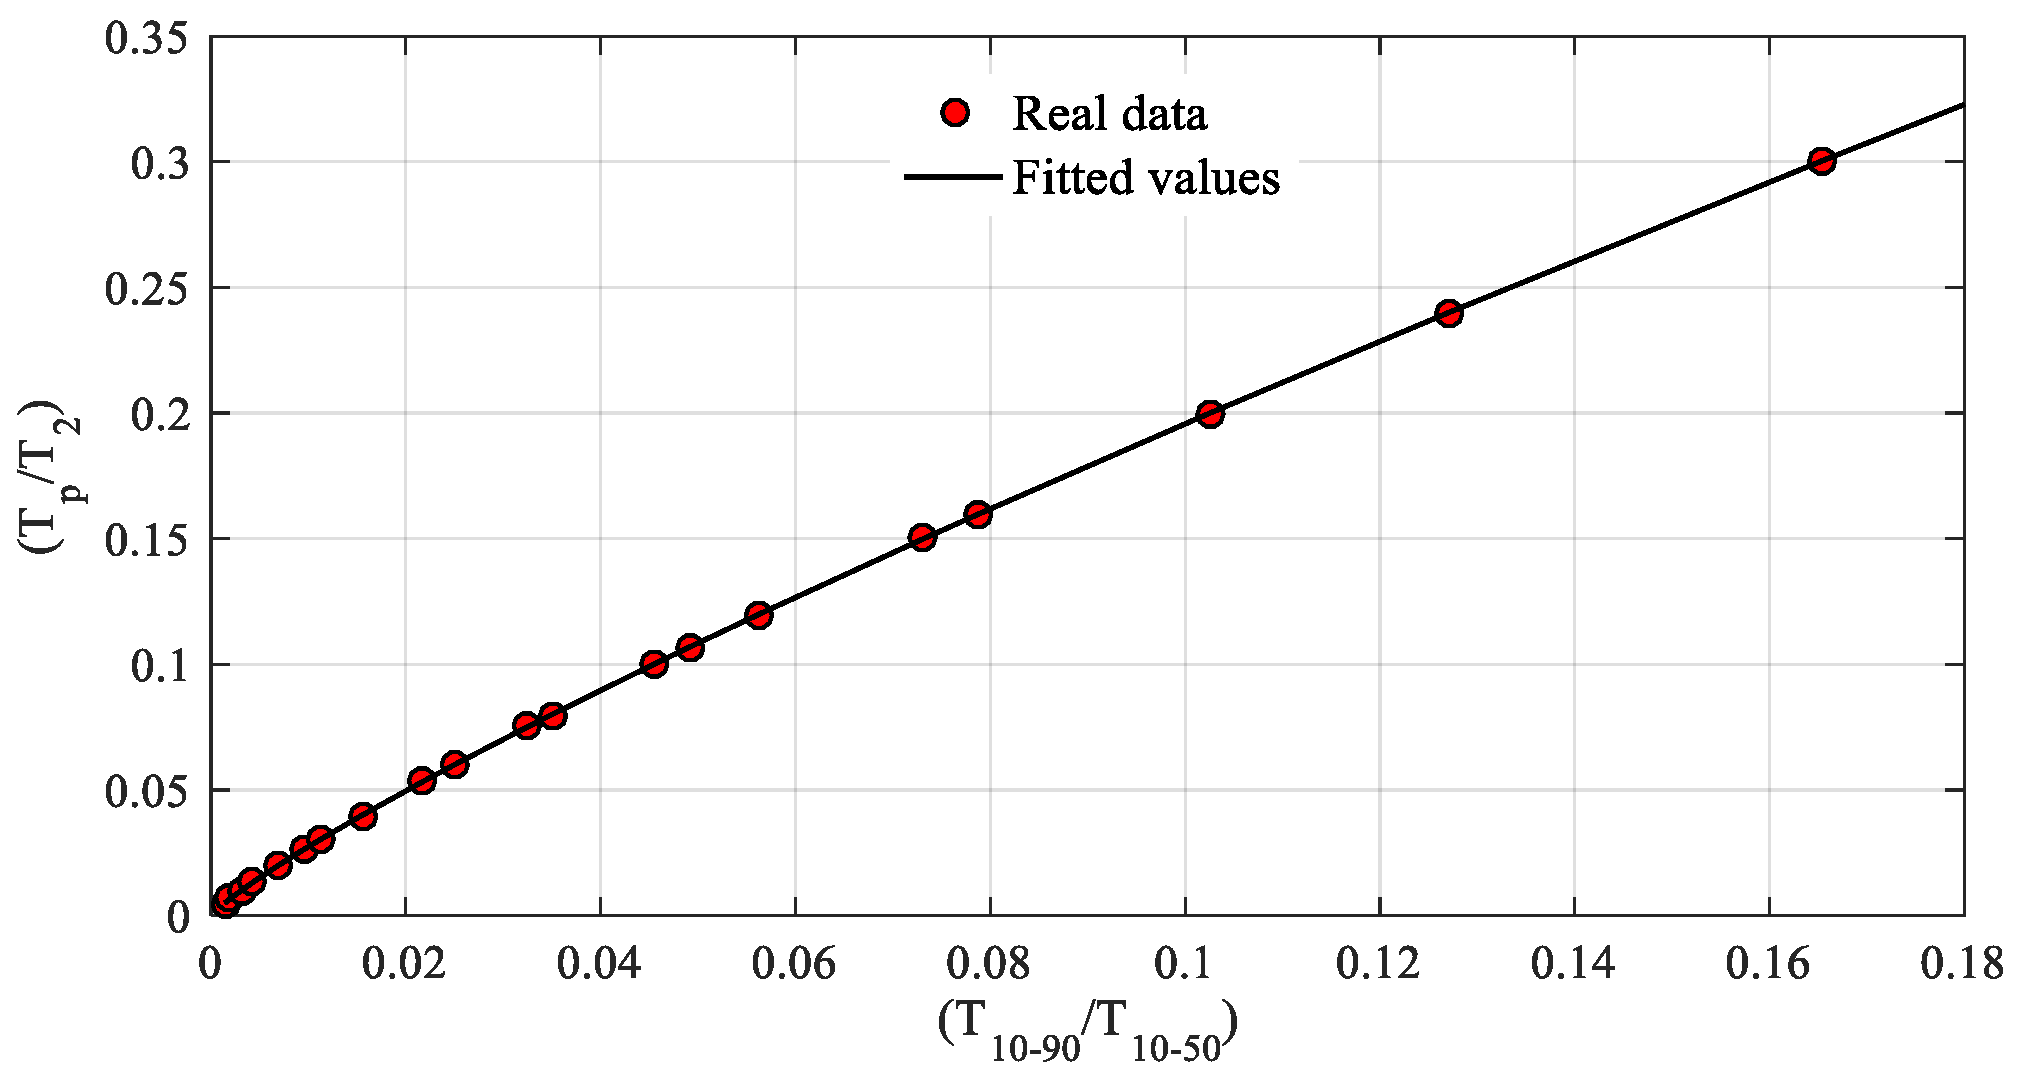
In the proposed method, analytical switching impulse voltage waveforms generated by the approach presented in Section 2.1 were utilized for development of the formula used for time to crest estimation. The time parameters, i.e., t10%, t90%, and t50% shown in Figure 1, are calculated by the Newton–Raphson method due to no analytical solution, and Tp and T2 are considered in the ranges of 20 μs to 300 μs and 1000 μs to 4000 μs, respectively, which cover the waveform parameters used in the practical tests. t0 is zero. It is found that Tp/T2 has a monotonic relation with T10–50/T10–90, as shown in Figure 4, and parameters used for calculation of such proportions can be calculated by Equations (16)–(18).

Figure 4.
Real data and fitted values of Tp/T2 versus T10–50/T10–90.
From the data of Tp/T2 and T10–50/T10–90, the fitting curve can be determined by a non-linear regression based on a Levenberg–Marquardt algorithm [19]. The expression of the fitted curve is given as Equation (19). From Equation (19) and the required T2, Tp can be calculated by Equation (20). Up can also be determined by searching for the crest voltage of the considered waveform. It is noted that the approach for the crest voltage determination is the same as those of the standard and previously developed methods [1,16].
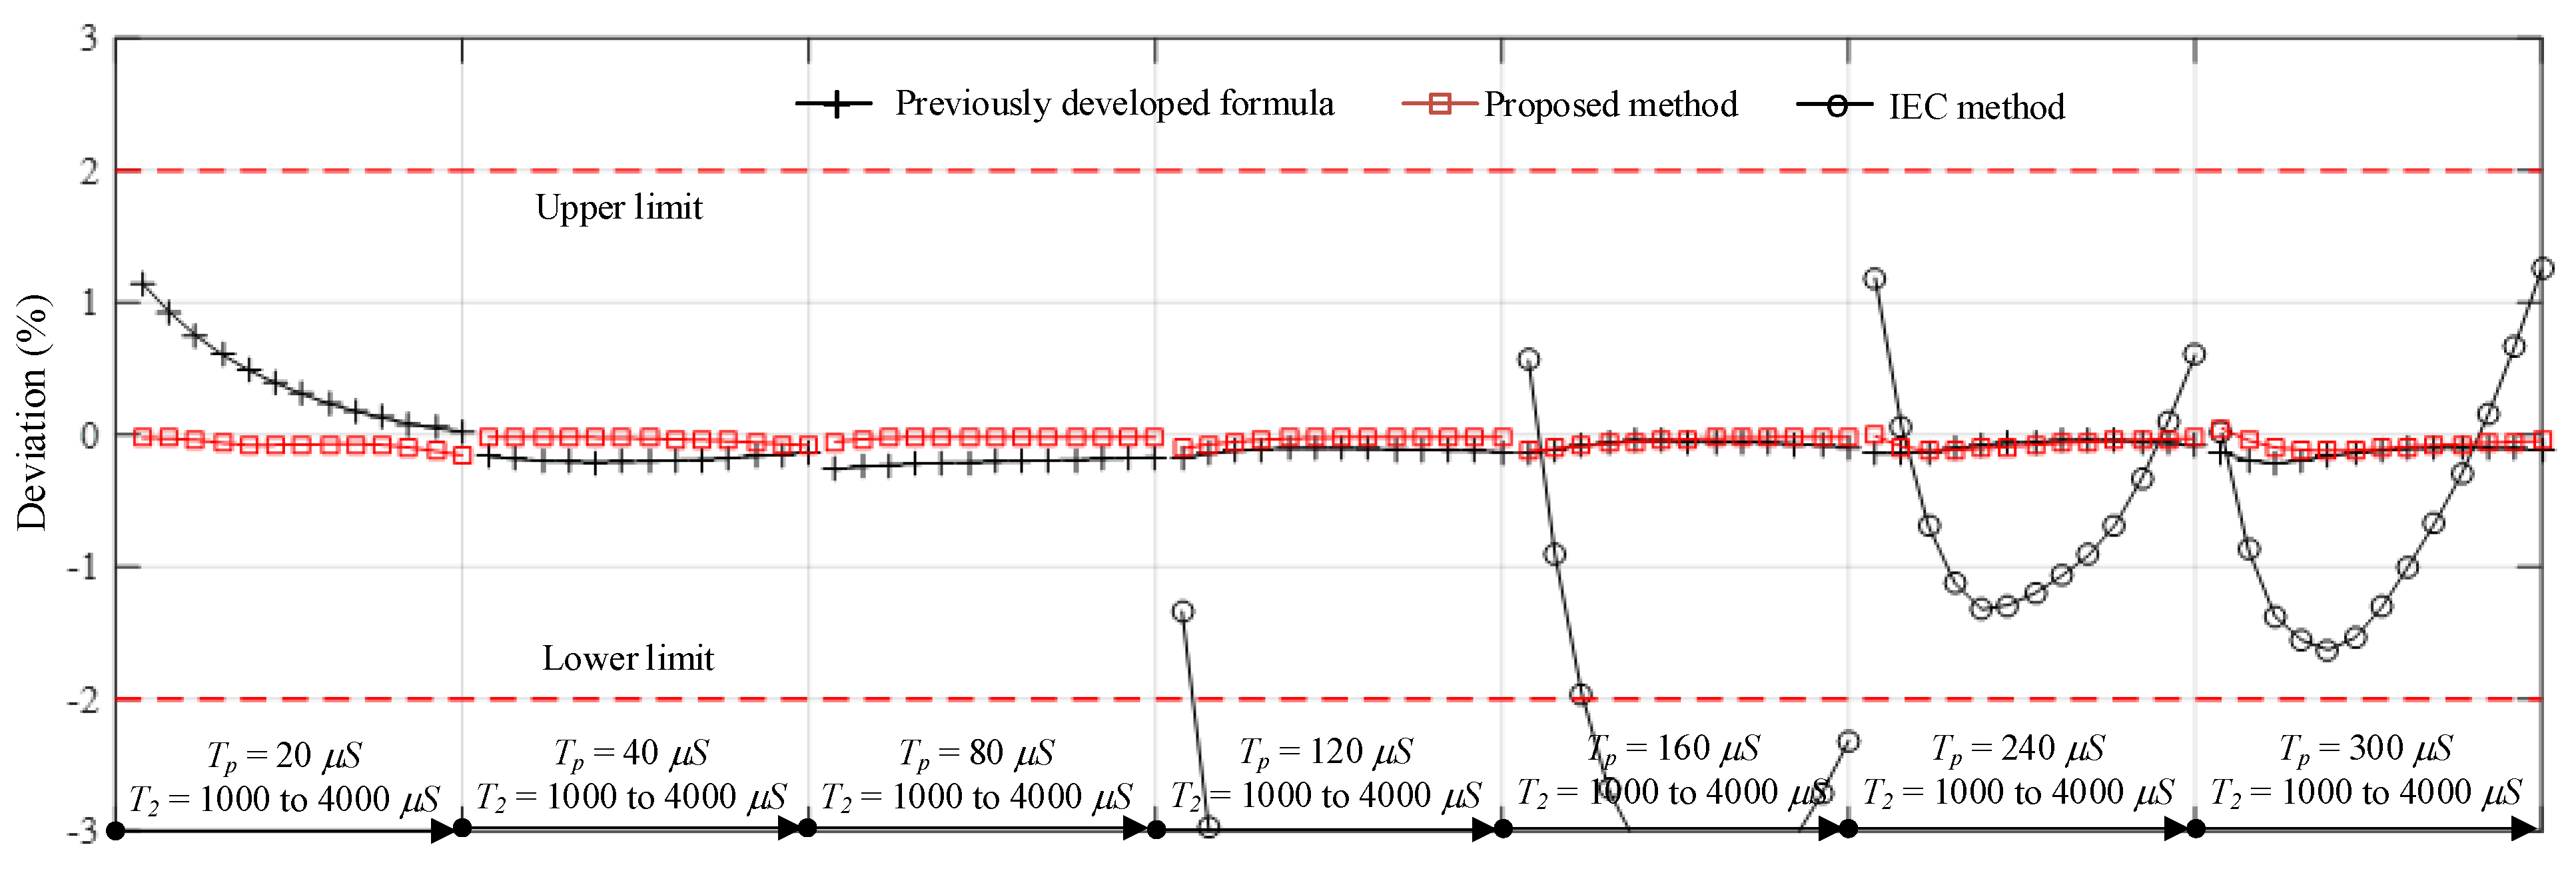
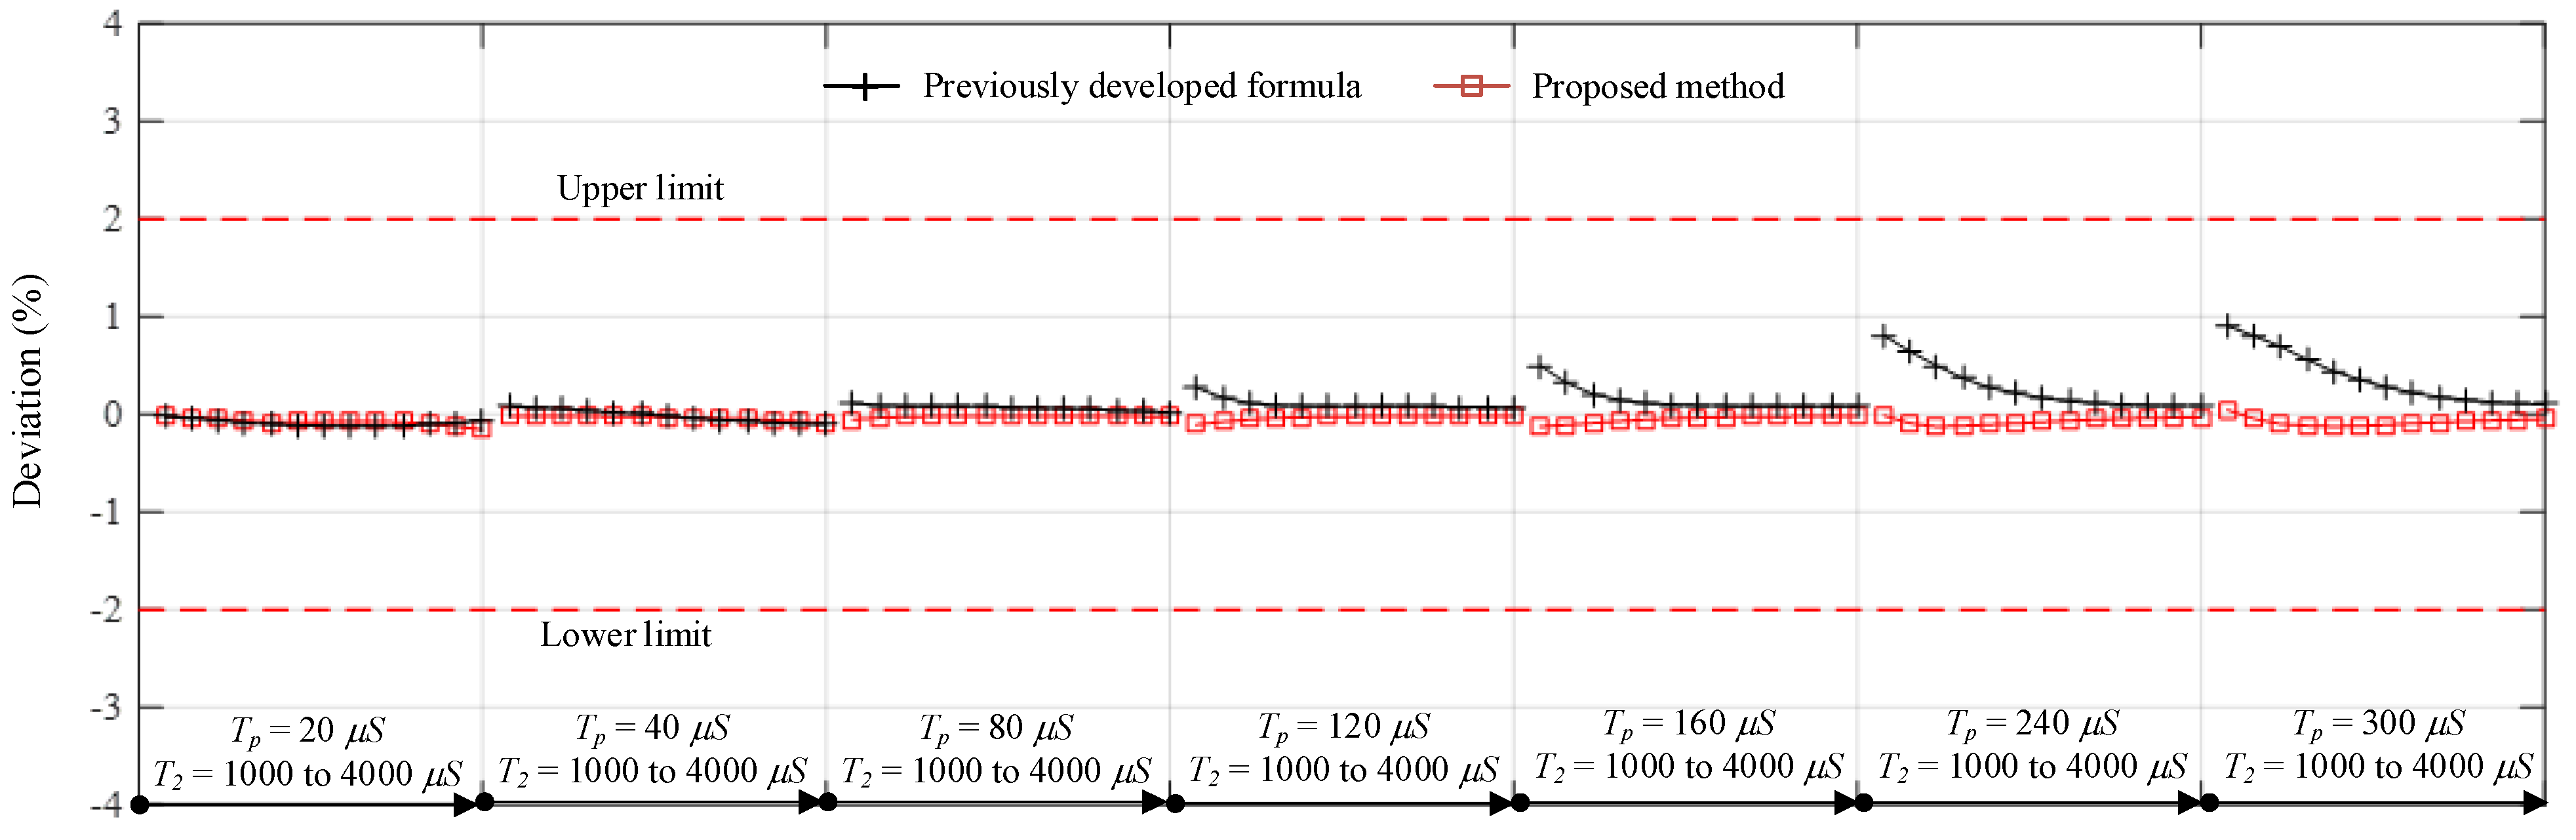
Comparisons of the times to crest computed by the proposed, standard, and previously developed formulas [1,16] are presented in Figure 5 and Figure 6. It is noticed that the proposed formula provides the best accuracy with a maximum deviation of 0.156%, whereas the standard and previously developed formulas [1,16] provide maximum deviations of 25.778% and 1.147%, respectively. From the results of all test cases, the previously developed and proposed formula can provide Tp within the acceptable limits defined by the standard [10]. The standard formula is accurate in cases of the waveform with time to crest close to the standard time to peak (250 μs). The shorter the Tp is, the higher the deviation is. Additionally, as shown in Figure 7 the proposed approach for the T2 determination also provides promising accuracy when it is compared with the previously developed formula [1]. The maximum deviations of the proposed and previously developed formulas are 0.165% and 0.98%, respectively.
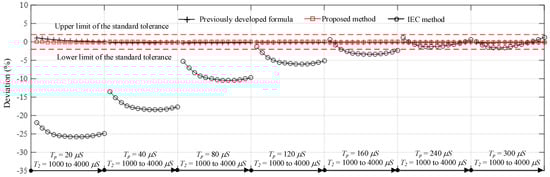
Figure 5.
Comparisons of the computed times to crest by the proposed, standard, and previously developed formulas [1,16] and the standard tolerance [10].
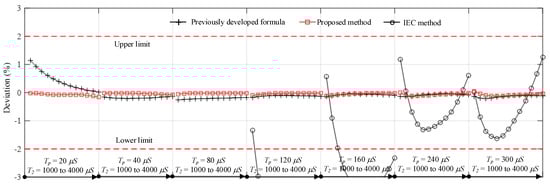
Figure 6.
Zoom-in results of Figure 5.
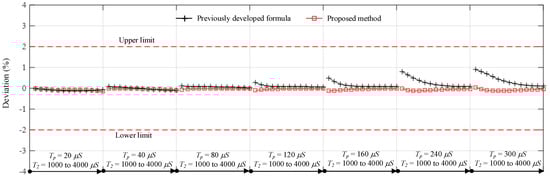
Figure 7.
Comparisons of the computed T2 by the proposed and previously developed formulas [16] and the standard tolerance [10].
3. Verification of the Proposed Method
By using the presented approach for determination of the waveform parameters, the offset voltage is removed and the time parameters are determined. t0 can be estimated by searching for the time at which the voltage is less than 0.1% of the peak voltage, and the approach for searching starts from the peak voltage in reversed order. The other time parameters, i.e., t10%, t90%, and t50% shown in Figure 1, are calculated by the Newton–Raphson method due to no analytical solutions. Then, using such time parameters, T10–50/T10–90 is calculated by Equations (17) and (18) and substituted in Equation (19) to obtain Tp/T2. Eventually, T2 is calculated by Equation (16), Tp is determined from Tp/T2 with the known T2, and Up is determined by the crest value of the considered waveform.
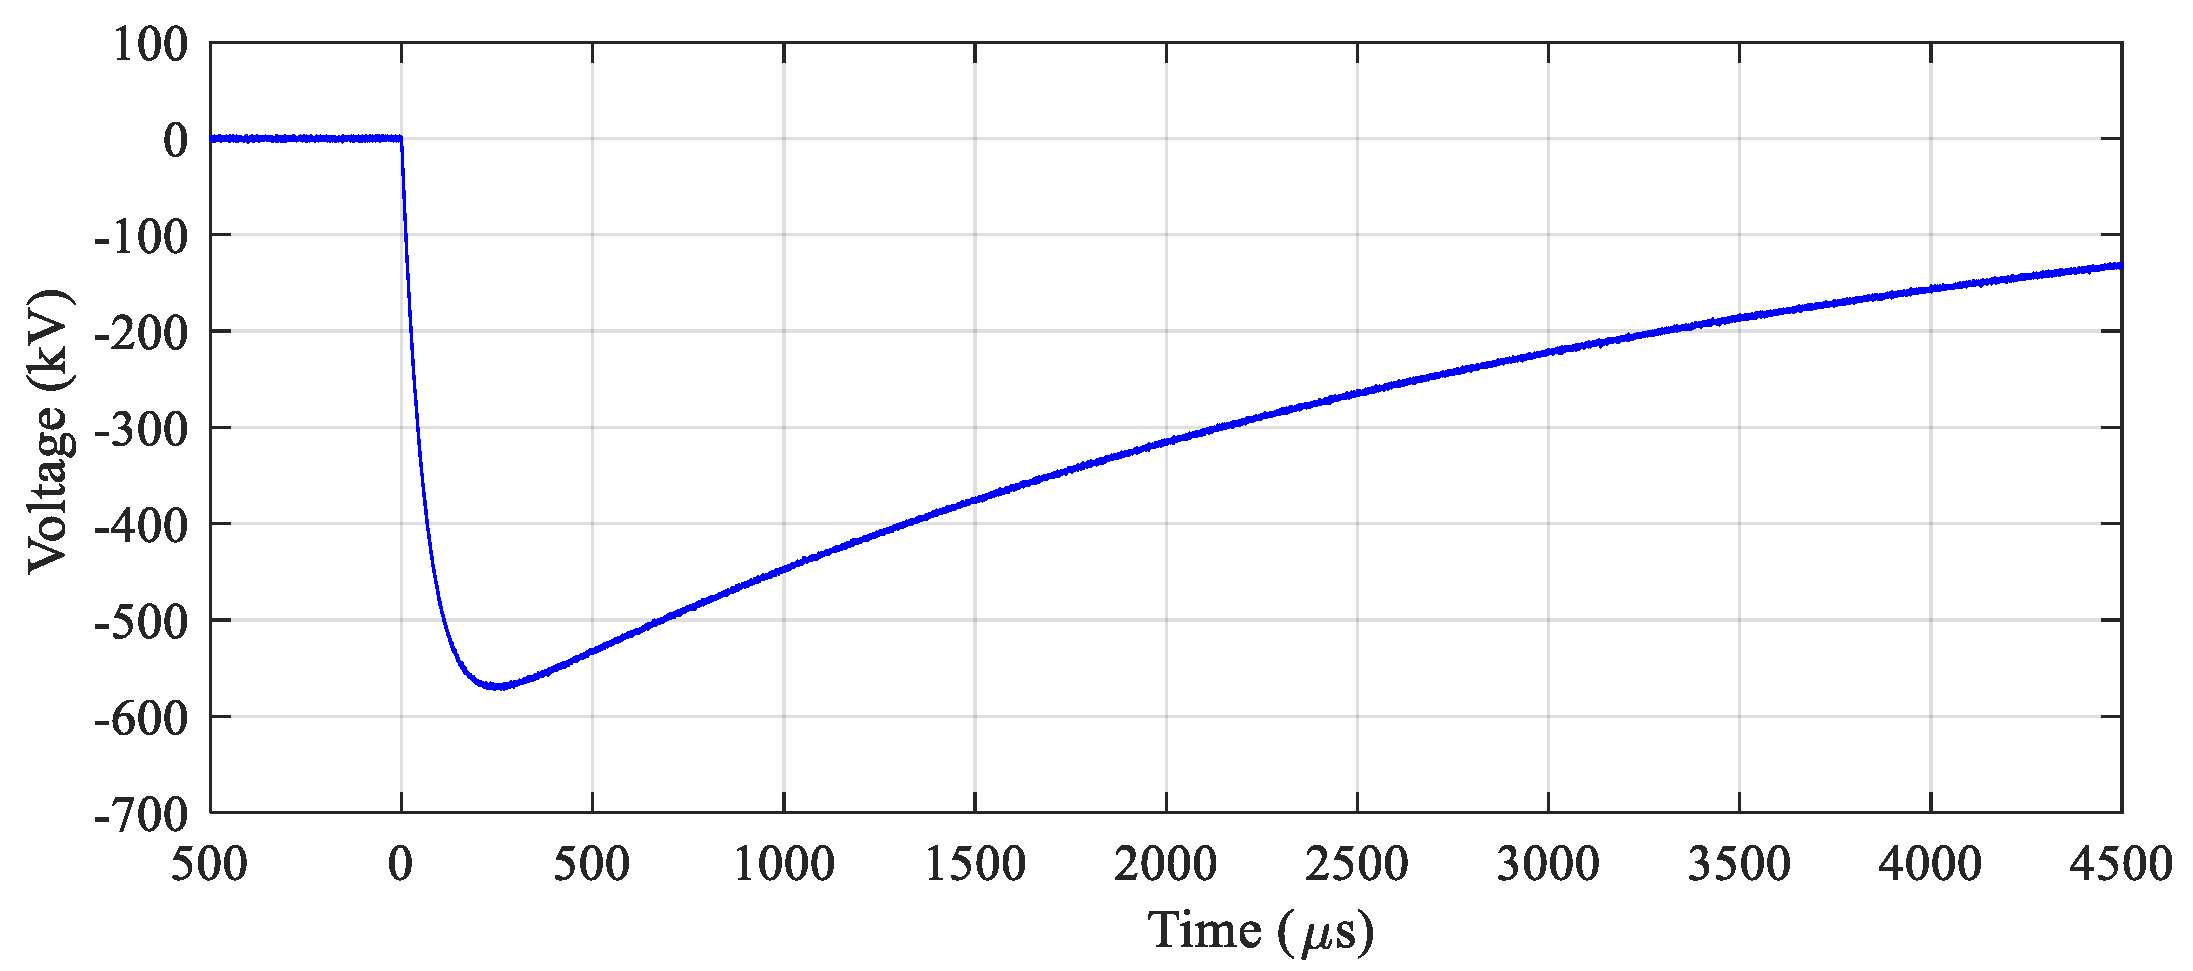
The proposed method is verified by the waveform parameter evaluation of waveforms composed of four groups collected from (1) analytically simulated two-exponential waveforms used in the method development; (2) IEC 61083-2 [10], composed of SI-A1 to SI-A3 (simulation waveforms) and SI-M1 and SI-M2 (waveforms measured in experiments); (3) simulations with and without additional noise signal (SI-X1 and SI-X2), and (4) experiments (SI-X3 and SI-X4). The example experimental waveform is presented in Figure 8. Additionally, the accuracy of the proposed method is compared with those of the standard and previously developed methods [1,16] as expressed in Table 1 and Table 2. It is to be mentioned that the reference values in the cases of SI-X3 and SI-X4 have been collected from commercial software [20]. The approved measuring system, composed of a 1500 kV voltage divider, a measuring cable, and a 12-bit digital recorder, was utilized to measure the switching impulse voltage in the experiments.
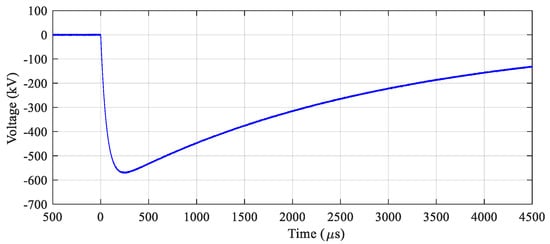
Figure 8.
Switching impulse voltage waveform in the Case SI-X3.

Table 1.
Reference and calculated values, acceptable limits, and deviations of Tp.
Table 2.
Reference and calculated values, acceptable limits, and deviations of T2 and Up.
From the test results of the evaluation of the waveform parameters, it is clear that the accuracy of the proposed method is relatively higher than that of the standard and previously developed methods. All waveform parameters determined by the proposed method are within the standard tolerances [1,10]. The deviations of Tp in the cases of the waveforms, simulated by two-exponential function, provided by the standard, additional simulation with and without noise signal, and collected from the experiments are within 0.156%, 1.34%, 1.45%, and 2.00%, respectively. The deviations of T2 of the waveforms from simulation and measured experimentally are within 0.06% and 1.60%, respectively. In cases of the waveforms from simulation and measured experimentally, the deviations of Up are within 0.005% and 0.48%, respectively.
4. Conclusions
This paper presents an effective approach for the analytical generation of the switching impulse waveforms with the required Tp and T2. From the generated waveforms, a new, simplified, and accurate approach for the waveform parameters determination of the switching impulse voltages has been developed and verified successfully by simulated and experimental waveforms. Using the developed analytical formula, the proportion of T10–50 and T10–90 is employed to determine the time to crest (Tp) precisely. The deviation of Tp calculated by the proposed formula is very small and within the standard tolerance for both simulated and experimental waveforms. The proposed technique has the largest deviations of +1.45% and +2.00% for the simulated and experimental waveforms, respectively, whereas the maximum error according to the standard formula [1] is −26.4% for the simulated waveforms and −4.81% for the experimental waveforms, and the maximum deviations determined by the previously developed formula [16] are +1.89% for the simulated waveforms and −8.78% for the experimental waveforms. Furthermore, the proposed approach provides the small deviations of T2 and Up and also falls within the standard tolerances. It can be concluded that the presented approach is superior to the approaches proposed by the IEC standard and a previously developed formula for the determination of waveform parameters of switching impulse voltages from simulations and experiments.
Funding
This research was funded by National Research Council of Thailand.
Institutional Review Board Statement
Not applicable.
Informed Consent Statement
Not applicable.
Data Availability Statement
Not applicable.
Acknowledgments
The authors would like to give special acknowledgement to the School of Engineering, King Mongkut’s Institute of Technology Ladkrabang, for providing the facilities for this research work, and the National Research Council of Thailand for financial support.
Conflicts of Interest
The author declare no conflict of interest.
References
- IEC 60060-1. High-Voltage Test Techniques–Part 1: General Definitions and Test Requirements, 3rd ed.; IEC: Geneva, Switzerland, 2010. [Google Scholar]
- IEC 60060-2. High-Voltage Test Techniques–Part 2: Measuring Systems, 3rd ed.; IEC: Geneva, Switzerland, 2010. [Google Scholar]
- IEC 60060-3. High-Voltage Test Techniques–Part 3: Definitions and Requirements for On-Site Testing, 1st ed.; IEC: Geneva, Switzerland, 2006. [Google Scholar]
- IEC 60071-1. Insulation Co-Ordination–Part 1: Definitions, Principles and Rules, 8th ed.; IEC: Geneva, Switzerland, 2011. [Google Scholar]
- IEEE Standard 4TM-2013. IEEE Standard for High-Voltage Testing Techniques; Institute of Electrical and Electronics Engineers (IEEE): Piscataway, NJ, USA, 2013. [Google Scholar]
- Kuffel, E.; Zaengl, W.S.; Kuffel, J. High Voltage Engineering: Fundamentals, 2nd ed.; Newnes: Oxford, UK, 2000. [Google Scholar]
- Zhimin, Y.; Kai, Y.; Shihang, W.; Yajun, Z.; Jianying, L.; Fang, Y. Electrical tree in silicone rubber: Roles of silicone grease and switching impulses. IEEE Trans. Dielectr. Electr. Insul. 2020, 27, 829–836. [Google Scholar]
- Pradhan, A.K.; Tenbohlen, S. Estimation of moisture content in oil-impregnated pressboard through analyzing dielectric response current under switching impulse. IEEE Trans. Dielectr. Electr. Insul. 2021, 28, 938–945. [Google Scholar] [CrossRef]
- Pradhan, A.K.; Tenbohlen, S. A new approach to estimate activation energy of oil-impregnated pressboard stressed under switching impulse at different temperatures. IEEE Trans. Dielectr. Electr. Insul. 2021, 28, 1162–1170. [Google Scholar] [CrossRef]
- IEC 61083-2. Instruments and Software Used for Measurement in High-Voltage and High Current Tests–Part 2: Requirements for Software for Tests with Impulse Voltages and Currents, 2nd ed.; IEC: Geneva, Switzerland, 2013. [Google Scholar]
- Gockenbach, E. Impact of new lightning and switching impulse definitions on the test results for insulation systems. In Proceedings of the 2005 International Symposium on Electrical Insulating Materials, Kitakyushu, Japan, 5–9 June 2005; pp. 792–795. [Google Scholar]
- Okabe, S.; Tsuboi, T.; Takami, J. Evaluation of Κ-factor based on insulation characteristics under non-standard lightning impulse waveforms. IEEE Trans. Dielectr. Electr. Insul. 2009, 16, 1124–1126. [Google Scholar] [CrossRef]
- Pattanadech, N.; Yutthagowith, P. Fast curve fitting algorithm for parameter evaluation in lightning impulse test technique. IEEE Trans. Dielectr. Electr. Insul. 2015, 22, 2931–2936. [Google Scholar] [CrossRef]
- Yutthagowith, P.; Pattanadech, N. Improved Least-Square Prony Analysis Technique for Parameter Evaluation of Lightning ImpulseVoltage and Current. IEEE Trans. Power Deliv. 2016, 31, 271–277. [Google Scholar] [CrossRef]
- Yutthagowith, P.; Kitwattana, K.; Kunakorn, A. Fast and effective technique in evaluation of lightning impulse voltage parameters. J. Electr. Eng. Technol. 2021, 16, 459–467. [Google Scholar] [CrossRef]
- Božidar, F.; Dalibor, F. A new method for estimation of time parameters of standard and non-standard switching impulse voltages. Int. J. Electr. Power Energy Syst. 2018, 96, 126–131. [Google Scholar]
- Andreas, N.; Anders, B.; Jari, H. An improved method for switching-impulse evaluation. In Proceedings of the 2012 Conference on Precision electromagnetic Measurements, Washington, DC, USA, 1–6 July 2012; pp. 20–21. [Google Scholar]
- Chapra, S.C.; Canale, R.P. Numerical Methods for Engineers, 5th ed.; McGraw-Hill: Singapore, 2006. [Google Scholar]
- Marquardt, D. An algorithm for least-squares estimation of nonlinear parameters. Siam J. Appl. Math. 1963, 11, 431–441. [Google Scholar] [CrossRef]
- User Manual for Digital Impulse Measuring Systems, Transient Recorders and Evaluating Systems, Downloaded in January 2022. Available online: http://www.strauss-mess.de/dokumente/WinTRAS-KAL-E.pdf (accessed on 8 January 2022).

Publisher’s Note: MDPI stays neutral with regard to jurisdictional claims in published maps and institutional affiliations. |
© 2022 by the author. Licensee MDPI, Basel, Switzerland. This article is an open access article distributed under the terms and conditions of the Creative Commons Attribution (CC BY) license (https://creativecommons.org/licenses/by/4.0/).