Article

Hydrogen Production from Enzymatic Hydrolysates of Alkali Pre-Treated Giant Reed (Arundo donax L.)

1
CREA—Council for Agricultural Research and Economics, Research Centre for Animal Production and Aquaculture, Via Beccastecca 345, 41018 San Cesario sul Panaro, Italy
2
CREA—Council for Agricultural Research and Economics, Research Centre for Agriculture and Environment, Via di Corticella 133, 40128 Bologna, Italy
*
Author to whom correspondence should be addressed.
Energies 2022, 15(13), 4876; https://doi.org/10.3390/en15134876
Submission received: 31 May 2022 / Revised: 22 June 2022 / Accepted: 30 June 2022 / Published: 2 July 2022
(This article belongs to the Special Issue Biomass and Waste as Feedstocks for Biofuel Production)

Abstract

:
The perennial rhizomatous grass giant reed (Arundo donax L.) can be exploited to produce hydrogen by dark fermentation. This implies a high availability of simple sugars, like glucose and xylose, and, thus, a pre-treatment is necessary to remove lignin and expose the holocellulose to enzymatic attack. This study aimed at evaluating the hydrogen production from giant reed hydrolysates. Giant reed dry meal was pre-treated with diluted NaOH (1.2% weight/weight), then the solid fraction was separated from the alkaline black liquor by filtration, enzymatically hydrolyzed with a cellulase blend (Cellic CTec2), and fermented in mesophilic batch conditions with a microbial consortium derived from pig slurry. The impact on hydrogen yield of initial pH was evaluated by comparing the hydrogen production from hydrolysates with not adjusted (5.3) or adjusted initial pH (8.7) using NaOH or alkaline black liquor. The highest hydrogen yield, 2.0 mol/mol of hexoses, was obtained with alkaline initial pH 8.7, regardless of how the pH adjustment was managed. The yield was 39% higher than that obtained in reactors with initial pH 5.3. In conclusion, thermo-alkaline pre-treatment followed by enzymatic saccharification and initial pH adjustment at 8.7 with the black liquor remaining after pre-treatment is a promising strategy to produce hydrogen from giant reeds in dark fermentation.

1. Introduction

In recent years, the perspective of H2 utilization as an energy carrier is spreading, in transportation or stationary applications, after eventual conversion to electricity utilizing fuel cells. H2 advantages are its lower heating value (120 MJ kg−1) which is the highest among the fuels, and the absence of polluting emissions [1]. Currently, hydrogen is mostly obtained from fossil sources like natural gas, oil and naphtha, or coal by steam reforming or gasification [2]. Hydrogen can also be obtained from water by electrolytic processes or from renewable sources like biomass, by chemical or physical methods, like gasification or pyrolysis [3]. However, all these processes need a primary source of energy. Recently, there has been a growing interest in the biological production of hydrogen [4] and, in particular, by dark fermentation (DF). This technology does not require high energy or chemical inputs and it utilizes smaller reactor volumes, in comparison with the volumes and surface extensions required in photo-biological H2 production. The DF greatest limit is the low H2 yield, which is reported in the range 0.9–3.3 mol/mol hexose from pure carbohydrates [5], although a yield of 5.77 mol/mol hexose using an over-producing engineered strain of hyperthermophilic T. maritima, was recently achieved [6]. The H2 production by DF can be an order of magnitude larger than by other biological processes [4], such as direct and indirect bio-photolysis, and photo-fermentation; furthermore, the energy conversion efficiency can be improved by integrating DF with anaerobic digestion, producing methane [7,8].
Substrates rich in monosaccharides are ideal for H2 production in DF [9]. Lignocellulosic materials represent interesting feedstocks to obtain fermentable monosaccharides like pentoses and hexoses [10], after opportune processing, since they are available worldwide at low cost, both as agricultural and agro-industrial waste, or as dedicated energy crops [11]. Among these, the perennial rhizomatous grass giant reed (Arundo donax L.), is considered one of the most promising energy crops in warm temperate zones [12]. In these zones, indeed, giant reeds can reach a dry biomass yield of up to 49 t ha−1, much higher than those obtainable from other energy crops, such as Miscanthus [13]. Giant reed clumps are widespread in the wild in Mediterranean regions. Giant reed stands can be easily established providing high biomass yields when properly managed [14,15]. Due to its high adaptability to different soils, the giant reed can also be cultivated on marginal lands, poorly suited to annual row crops.
Lignocellulosic feedstocks are composed of cellulose linked in microfibrils by strong hydrogen bonds and embedded in a matrix of hemicellulose, pectin, and lignin, closely associated in a complex crystalline structure [16]. To release fermentable sugars from this kind of material, a pre-treatment step is required to expose the holocellulose followed by enzymatic hydrolysis, which is necessary to enhance the sugar concentration after the pre-treatment [3]. This process is already applied to industrial bioethanol production from 2G biomass [17]. However, by replacing the yeasts with H2-producing bacteria, the process can be converted from bioethanol to bio-H2 production, with all the advantages of using H2 already described above. Furthermore, H2 can be used either to generate energy via fuel cells or as a fuel for hydrogen vehicles [6]. A variety of pretreatment methods are described in the literature: from biological to physical, physicochemical, and chemical [18,19,20], with different effects on the lignocellulosic substrate and different impacts on the subsequent enzymatic hydrolysis step. In previous works, giant reed biomass pretreated by alkaline pretreatments produced fermentable sugars at high yields [21,22]. In addition, it is recognized that alkaline pretreatments produce few inhibitors for the subsequent steps [22,23]. Moreover, alkaline pre-treatments can be carried out at a relatively low temperature and pressure, with obvious advantages [24]. More recently, enzymatic hydrolysis after alkaline pre-treatment, gave superior sugar yield (up to 1.75 folds) using NaOH compared to Ca(OH)2 [25]. However, a detoxification step could be required before the enzymatic hydrolysis to remove inhibitors possibly generated in the black liquor during the pre-treatment [3]. After alkaline pre-treatment, the black liquor is still alkaline and could be used to adjust the initial pH of DF. The pH plays a key role in the DF process [26] and recently it was reported that initial alkaline pH enhanced H2 yield in DF from a lactose-rich substrate [27]. In that study, initial pH 8.7 was identified as optimum to reach the highest H2 production. At the initial alkaline pH, the best environmental conditions for the activity of H2-producing bacteria were promoted [9]. Since Clostridia and Enterobacter are the major producers of H2 in DF [28] and since they can ferment several sugars, initial alkaline pH could also increase H2 production in DF from glucose-like rich substrates.
However, the introduction of black liquor into the DF reactor could be detrimental, due to its inhibitory compounds (i.e., polyphenols) [29].
Previously, a high inhibitory effect on DF by compounds released after pre-treatment of giant reed by steam explosion was reported [30,31]. Careful successive adaptation of the inoculum improved H2 yield from steam-exploded giant reed [32].
As far as we are aware, little is known about H2 production by DF of alkali-pretreated giant reeds. In this study, the effects on H2 production by DF of a thermo-alkaline pre-treatment of giant reed biomass with NaOH, followed by enzymatic saccharification, were evaluated. The impact of initial pH and possible inhibitors released by the pre-treatment was assessed. In addition, the possibility of re-cycling the alkaline residual liquor discarded after the pre-treatment in DF was also evaluated.

2. Materials and Methods

2.1. Feedstock

Giant reed meal was obtained from winter-harvested aboveground biomass collected on a field crop established at the CREA experimental farm, located at Anzola dell’ Emilia (Bologna, Northern Italy, Lat. 44°32′ N, Long. 11°11′ E, 38 m a.s.l.). The meal was obtained after milling and sieving (<1.5 mm) the aboveground oven-dried plant organs, i.e., stems and leaves [33]. Samples were stored at room temperature in plastic bags until use.

2.2. Experimental Design

The experiments were performed according to a completely randomised experimental design [34] comparing three DF conditions of giant reed hydrolysates: (i) initial pH 5.3 (not adjusted, hereinafter Not-adj); (ii) initial pH 8.7 (adjusted with NaOH, hereinafter NaOH-adj); (iii) initial pH 8.7 (adjusted with alkaline black liquor addition, hereinafter Liq-adj). As a control, not treated and not hydrolysed giant reed meal, pH 8.7 adjusted with NaOH, was also included, (hereinafter C). All treatments were performed in triplicate.
A total of 12 experimental units were set up and utilised in DF experiments.

2.3. Pre-Treatment, Fibre Recovery, Hydrolysis and Sugar Content Determination

Giant reed meal was pre-treated as previously described [22]. Briefly, the meal was added to dilute alkali (final NaOH 1.2% weight/weight, w/w) up to a concentration of 10% w/w, then the slurry was pre-treated at 121 °C, 20 min, in glass bottles (600 g slurry per bottle, in triplicates).
The pre-treated solid fraction was partially separated from the black liquor by filtration and both the two fractions were recovered. The solid fraction was gently washed with distilled water under vacuum until a clear filtrate was obtained. Washing was aimed at removing possible inhibitors for the following fermentation step. Then, this solid fraction was saccharified (pH 5.0, at 50 °C for 144 h) as a slurry at 7.0% w/w, with a mix of commercial enzymes (Cellic CTec2, SAE0020, Sigma-Aldrich, St. Louis, MO, USA) at a cellulase load of 25 filter paper units per gram of dry weight (FPU/g DW), as detailed in a previous paper [22]. After the saccharification, the hydrolysed biomass was centrifuged, and the supernatant was recovered for the following DF, while the pellet was discarded. Sugar-rich hydrolysates (the recovered supernatants) were opportunely diluted by adding a few millilitres of sterile distilled water to obtain a concentration equal to 50 g/L of equivalent sugars (according to the DNS assay described below).
The supernatant was analysed for reducing sugar content by the 3,5-dinitrosalicylic acid (DNS) method [35] adapted for 96-well microplates, in duplicate [36]. The assay was performed in citrate buffer 50 mM, pH 4.8, 5 min, 95 °C. Pure glucose, as well as a mix of glucose and xylose (1:1), and dilutions of a control enzyme mix, were included, as standards.
All the recovered fractions of interest (pre-treated solids, black liquor and hydrolysate supernatant) were weighted. Samples of pre-treated solids and black liquor were oven-dried at 60 °C for quantification on a dry weight basis.

2.4. Dark Fermentation

Dark fermentation for H2 production was carried out in laboratory static mesophilic batch conditions [27] in 118 mL reactors.
Each reactor (treatment) contained 30 mL of hydrolysate (1.5 g of sugars). In the case of Not-adjusted reactors, the hydrolysate was used as it was (pH 5.3), and the pH in the reactors was not adjusted. In the other reactors, the initial pH was adjusted to 8.7 with 0.5 mL 32% NaOH solution (NaOH-adj reactors) or 5 mL of alkaline black liquor (Liq-adj reactors). Control reactors (C) were fed with 1.5 g VS untreated giant reed hydrated with 30 mL potassium phosphate-buffered medium [33], as hydration medium (HM).
The hexose equivalent content in each reactor (8.33 × 10⁻³ mol/reactor) was calculated by dividing the amount of sugar per reactor (g/reactor) by 180 (g/mol hexose). Note that the theoretical hydrogen and acetate yields per mol of carbon are equal for glucose and xylose [37].
The headspace of the reactors was gassed with 100% N2, to ensure the initial anaerobiosis conditions, and then each reactor was inoculated with 5 mL of inoculum. The inoculum used (40.2 ± 0.02 g VS L−1) was a non-selected or pre-treated mixed inoculum, prepared as described in a previous paper [38], using pig slurry as raw material.
The control (C) was prepared in the same way. Reactors containing only inoculum and HM were also included as blanks to subtract the endogenous H2 production.
Reactors were plugged using butyl rubber stoppers and aluminium seals and then they were incubated for 14 days at 35 °C. The DF was carried out in two cycles of 7 days; at the end of the first cycle, the pH of each reactor was brought back to its initial value utilizing an appropriate volume of NaOH solution (3 mL) or black liquor (7 mL) depending on the treatment. This change in the reactor’s volume was considered in the calculations of biogas production. The pH resetting at the end of the first cycle was intended to favour further fermentation of residual substrates. This procedure had been previously adopted [39]. After the end of the second cycle, a reiterated pH correction was performed to check if it was possible to stimulate the DF once again.
The biogas production (volume and composition) was measured according to [40], as previously described [41]. Briefly, biogas was collected daily using 100-mL glass syringes. Hydrogen, CO2, and CH4 concentrations were determined as described below (par. 2.5).
The cumulative volume of H2 was calculated by adding the volumes of gas collected in the syringe to that accumulated in the reactor headspace. Gas volume was reported at standard conditions (STP) of temperature (273 K) and pressure (101 kPa). The cumulative hydrogen production was finally determined after subtraction of the hydrogen produced by the inoculum.
Max Rate is the highest measured daily rate of H2 production per gram of volatile solids added.
The maximum content of H2 in the biogas during the first or second cycle of DF (%H2 MAX1, %H2 MAX2) was the highest percentage of H2 detected in the biogas.

2.5. Analytical Methods

Biogas composition (H2, CH4, and CO2) in the reactor headspace was analysed using a MicroGC Agilent 3000 gas chromatograph, equipped with 2 columns: Molsieve and Plot U; detector: TCD. Carrier gas: argon.
Total solids (TS), VS, ash, and pH of the oven-dried, milled and sieved biomass of giant reed and the washed pre-treated materials were determined according to standard procedures [42]. Total solids were determined gravimetrically after thermal treatment at 105 °C at a constant weight. Volatile solids were determined as the difference between TS and ash which was determined after incineration in a muffle furnace at 550 °C for 10 h. The pH was determined using a Crimson Titromatic 1S pH-meter; in the case of giant reed meal, it was determined after suspension, 2-h stirring and sedimentation of 1.1 g dry matter in 50 mL distilled water.
Total C and total N were determined in duplicate using CHN Truspec elemental analyzer (Leco).
Fibre fractions (neutral detergent fibre, NDF; acid detergent fibre, ADF; and lignin, ADL) of samples dried at 60 °C at constant weight were determined according to [43]. The hemicellulose content was estimated as the difference between NDF and ADF; cellulose as the difference between ADF and ADL.
Total polyphenols were determined as described previously [44]. Acetic acid concentration was determined using a GC-2010 PRO (Shimadzu) gas-chromatograph, equipped with a Nukol™ capillary column (Supelco, cat. No. 24107), 30 m × 0.25 mm ID, 0.25 μm film thickness; detector: FID; carrier gas: Helium; total flow rate: 68.6 mL min−1; split 100; oven programmed temperature: 100 °C (1 min) to 194 °C at 8 °C min−1, 194 °C for 4 min. Samples were prepared as previously described [27]. To quantify the acetic acid concentration, 2,2-dimethylbutyric acid (Sigma-Aldrich) was used as an internal standard [45]. Peak identification was based on the comparison of the unknown peak retention times with the retention times of a commercial volatile free acid standard mix (46975-U Supelco).

2.6. Statistical Analysis

All the statistical analyses were performed using PAST 4.10 software, Hammer Ø., Oslo, Norway [46]. Factors and factor interaction effects were considered significant at p < 0.05. The Tukey Honestly Significant Difference (HSD) at p = 0.05 was used to compare the treatment mean values.

3. Results

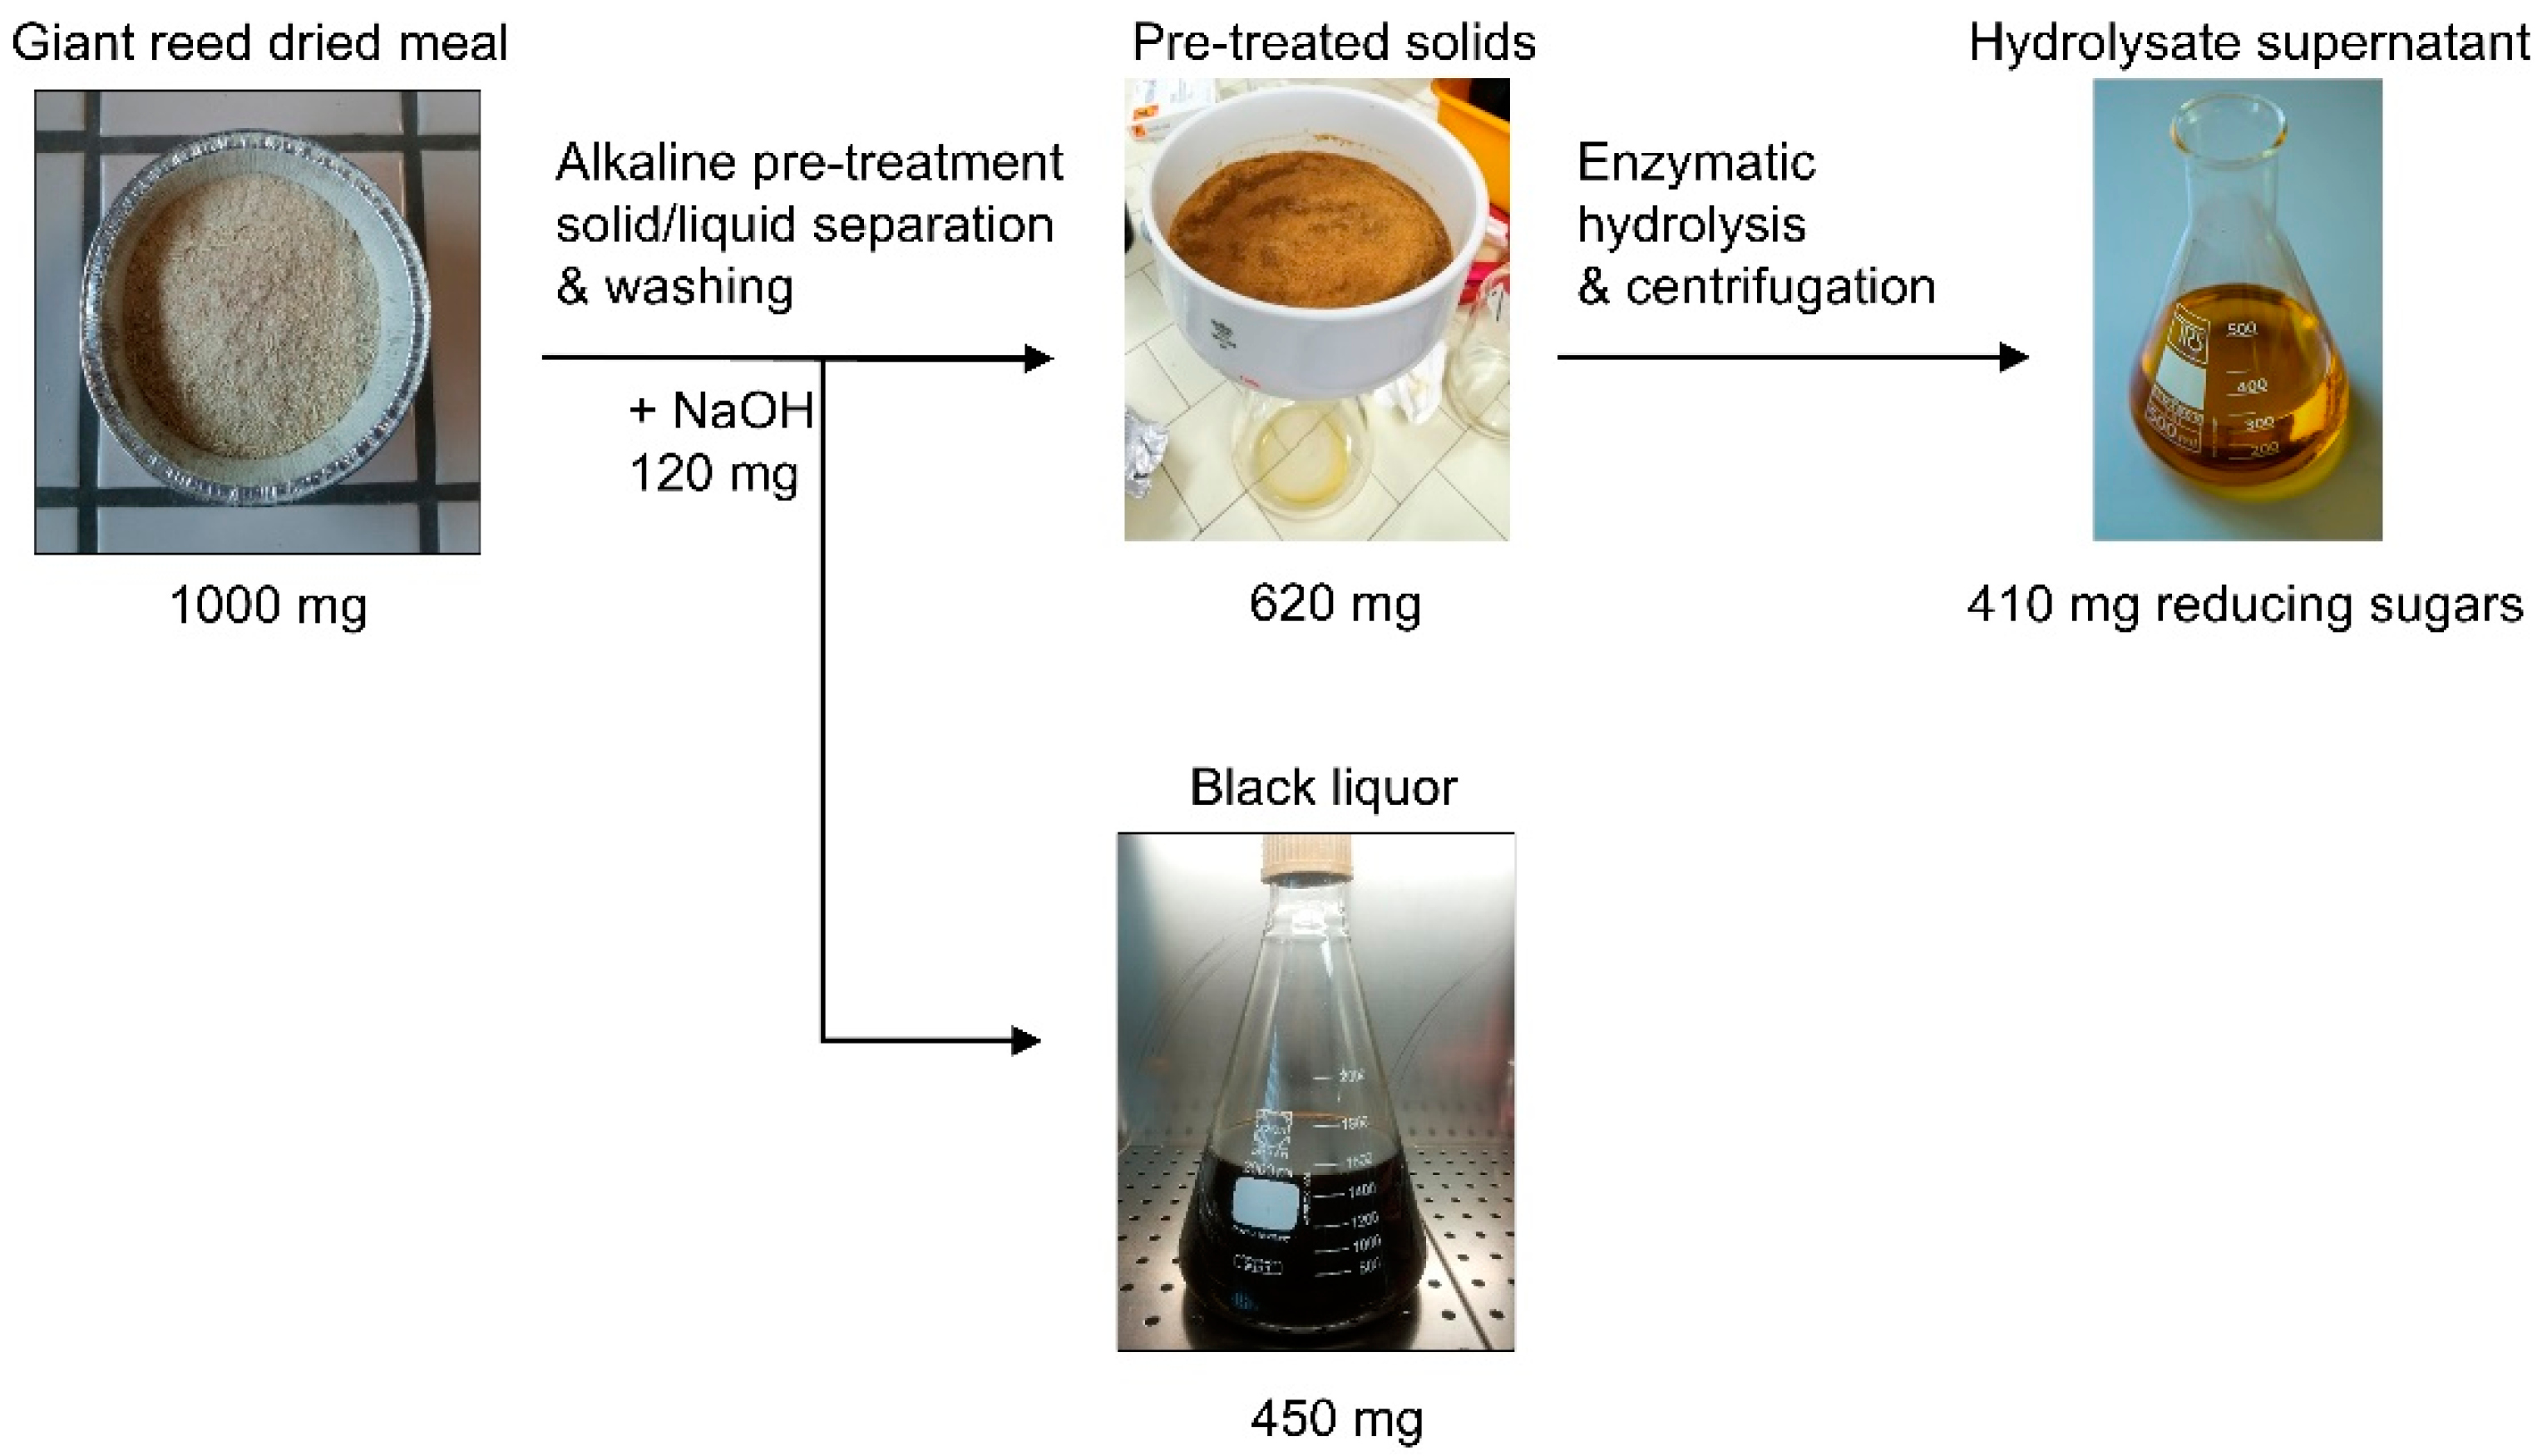
3.1. Biomass Fractionation Yields Following the Pre-Treatment

The different steps of the dry giant reed meal treatment from the alkaline pre-treatment up to the enzymatic hydrolysis are illustrated in Figure 1.
After the thermo-alkaline pre-treatment, 620 mg DW of solids per 1000 mg DW of the meal were recovered, which yielded on average 410 mg DW of reducing sugars after enzymatic hydrolysis. A conspicuous amount of liquefied biomass, together with residual NaOH, for a total of 450 mg DW, ended up in the liquid fraction (black liquor).

3.2. Composition of the Materials Utilised in Dark Fermentation

Table 1 shows the composition of all the materials utilized in DF. Hydrolysate supernatant and black liquor displayed similar TS content of around 6%, the former had a higher VS content and mostly contained reducing sugars, the latter had a higher ash content and a lower VS content (50%), in particular polyphenols derived from the lignin de-structuring and acetic acid (Table 1). Both giant reed meal and the hydrolysates were slightly acidic, while the black liquor was strongly alkaline (pH > 11). due to residual NaOH content from the giant reed alkaline pre-treatment.

3.3. Dark Fermentation Kinetics and Parameters

Figure 2 shows the cumulative H2 production obtained from the differently prepared giant reed hydrolysates, in comparison with not treated and not hydrolyzed control (C). The dark fermentation proceeded in two cycles of 7 days; at the end of the first cycle, the pH of each reactor was brought back to its initial value utilizing an appropriate volume of NaOH solution or black liquor depending on the treatment (pH resetting) restarting DF.
It should be noted that Liq-adj reactors contained the same amount of sugar as the other treatments but a higher amount of VS (Table 2), due to the VS content of the black liquor derived from pre-treated biomass solubilization (12 mL in total added for the pH adjustments).
In general, H2 production increased steadily without any lag for all the hydrolysates, while it was almost negligible for the control, where, instead, methanogenic fermentation occurred (data not shown).
At the end of the first cycle, the highest cumulative H2 production levels were obtained in NaOH-adj or Liq-adj reactors. The H2 production curves almost overlapped and reached a plateau at 4 days of incubation.
After pH resetting, the second cycle of DF started with a similar profile in all treatments, although in this cycle higher values for NaOH-adj reactors were recorded compared to Liq-adj reactors. The production curve of Not-adj reactors always remained below the other two treatments with pH adjustment. The production from Not-adj reactors was also more variable compared to the other treatments.
Noteworthy is the fact that a substantial fraction of the total cumulative H2 production was obtained during the second cycle: 48%, 40%, and 36% for NaOH-adj, Liq-adj and Not-adj reactors, respectively.
After the end of the second DF cycle, a further pH resetting did not produce any recovery of the hydrogen production (not shown).
The alkaline pre-treatment followed by enzymatic hydrolysis significantly increased the cumulated H2 production per gram of VS in all conditions, compared to C (not pretreated nor hydrolyzed) (Figure 2, Table 2). The pH adjustment at 8.7 of the hydrolysates determined significant increases of 14–36% in the cumulated H2 production per gram of VS, compared to not-adjusted reactors (pH 5.3). The highest cumulated H2 value per gram of VS was obtained in NaOH-adj reactors (pH 8.7) with an absolute value of 237 mL H2 g−1 VS while in Liq-adj reactors a statistically significant lower value (−16%) was observed (199 mL H2 g−1 VS).
It should be noted that, while the absolute amount of reducing sugars was the same in all hydrolysate-containing reactors (1.5 g per reactor), Liq-adj reactors also contained 0.4 g VS from the liquor itself (that was added in non-negligible volumes to adjust the reactor pH) up to a total of 1.9 g VS (Table 2). These liquor-derived VS (Table 1) represent 21% of the total VS added in these reactors. Thus, Liq-adj reactors contained more VS, compared to NaOH-adj or Not-adj reactors, despite having the same amount of sugar as the other hydrolysate-containing reactors.
The amount of reducing sugars was negligible in not-treated and not-hydrolyzed giant reed control and these reactors displayed very low cumulated H2 production per gram VS (Table 2).
The maximum daily rate of H2 production (max Rate) was 56, 52 and 55 mL H2 STP d−1 g−1 VS, respectively, for Liq-adj, NaOH-adj, and Not-adj reactors, with a significant increase, compared to C: notably, the highest max Rate was observed for Liq-adj reactors, and it was significantly higher compared to that of NaOH-adj reactors.
The pH at the end of the first cycle of dark fermentation (day 7, before pH resetting) converged to acidic values (4.4–4.6) in hydrolysate-containing reactors irrespective of their initial pH or kind of adjustment. On the contrary, it was neutral in C reactors, where methanogenesis occurred (data not shown). The maximum content of H2 in the biogas ranged between 55–58% during the first cycle, and between 48–50% during the second cycle of DF in hydrolysate-containing reactors without significant difference, due to their initial pH or kind of pH adjustment. A significantly lower H2 content (10%) was observed for the C reactors during the first cycle.
At the end of the second cycle of the DF, the pH converged again to acidic values (4.5–4.7) in hydrolysate-containing reactors without significant differences among treatments.

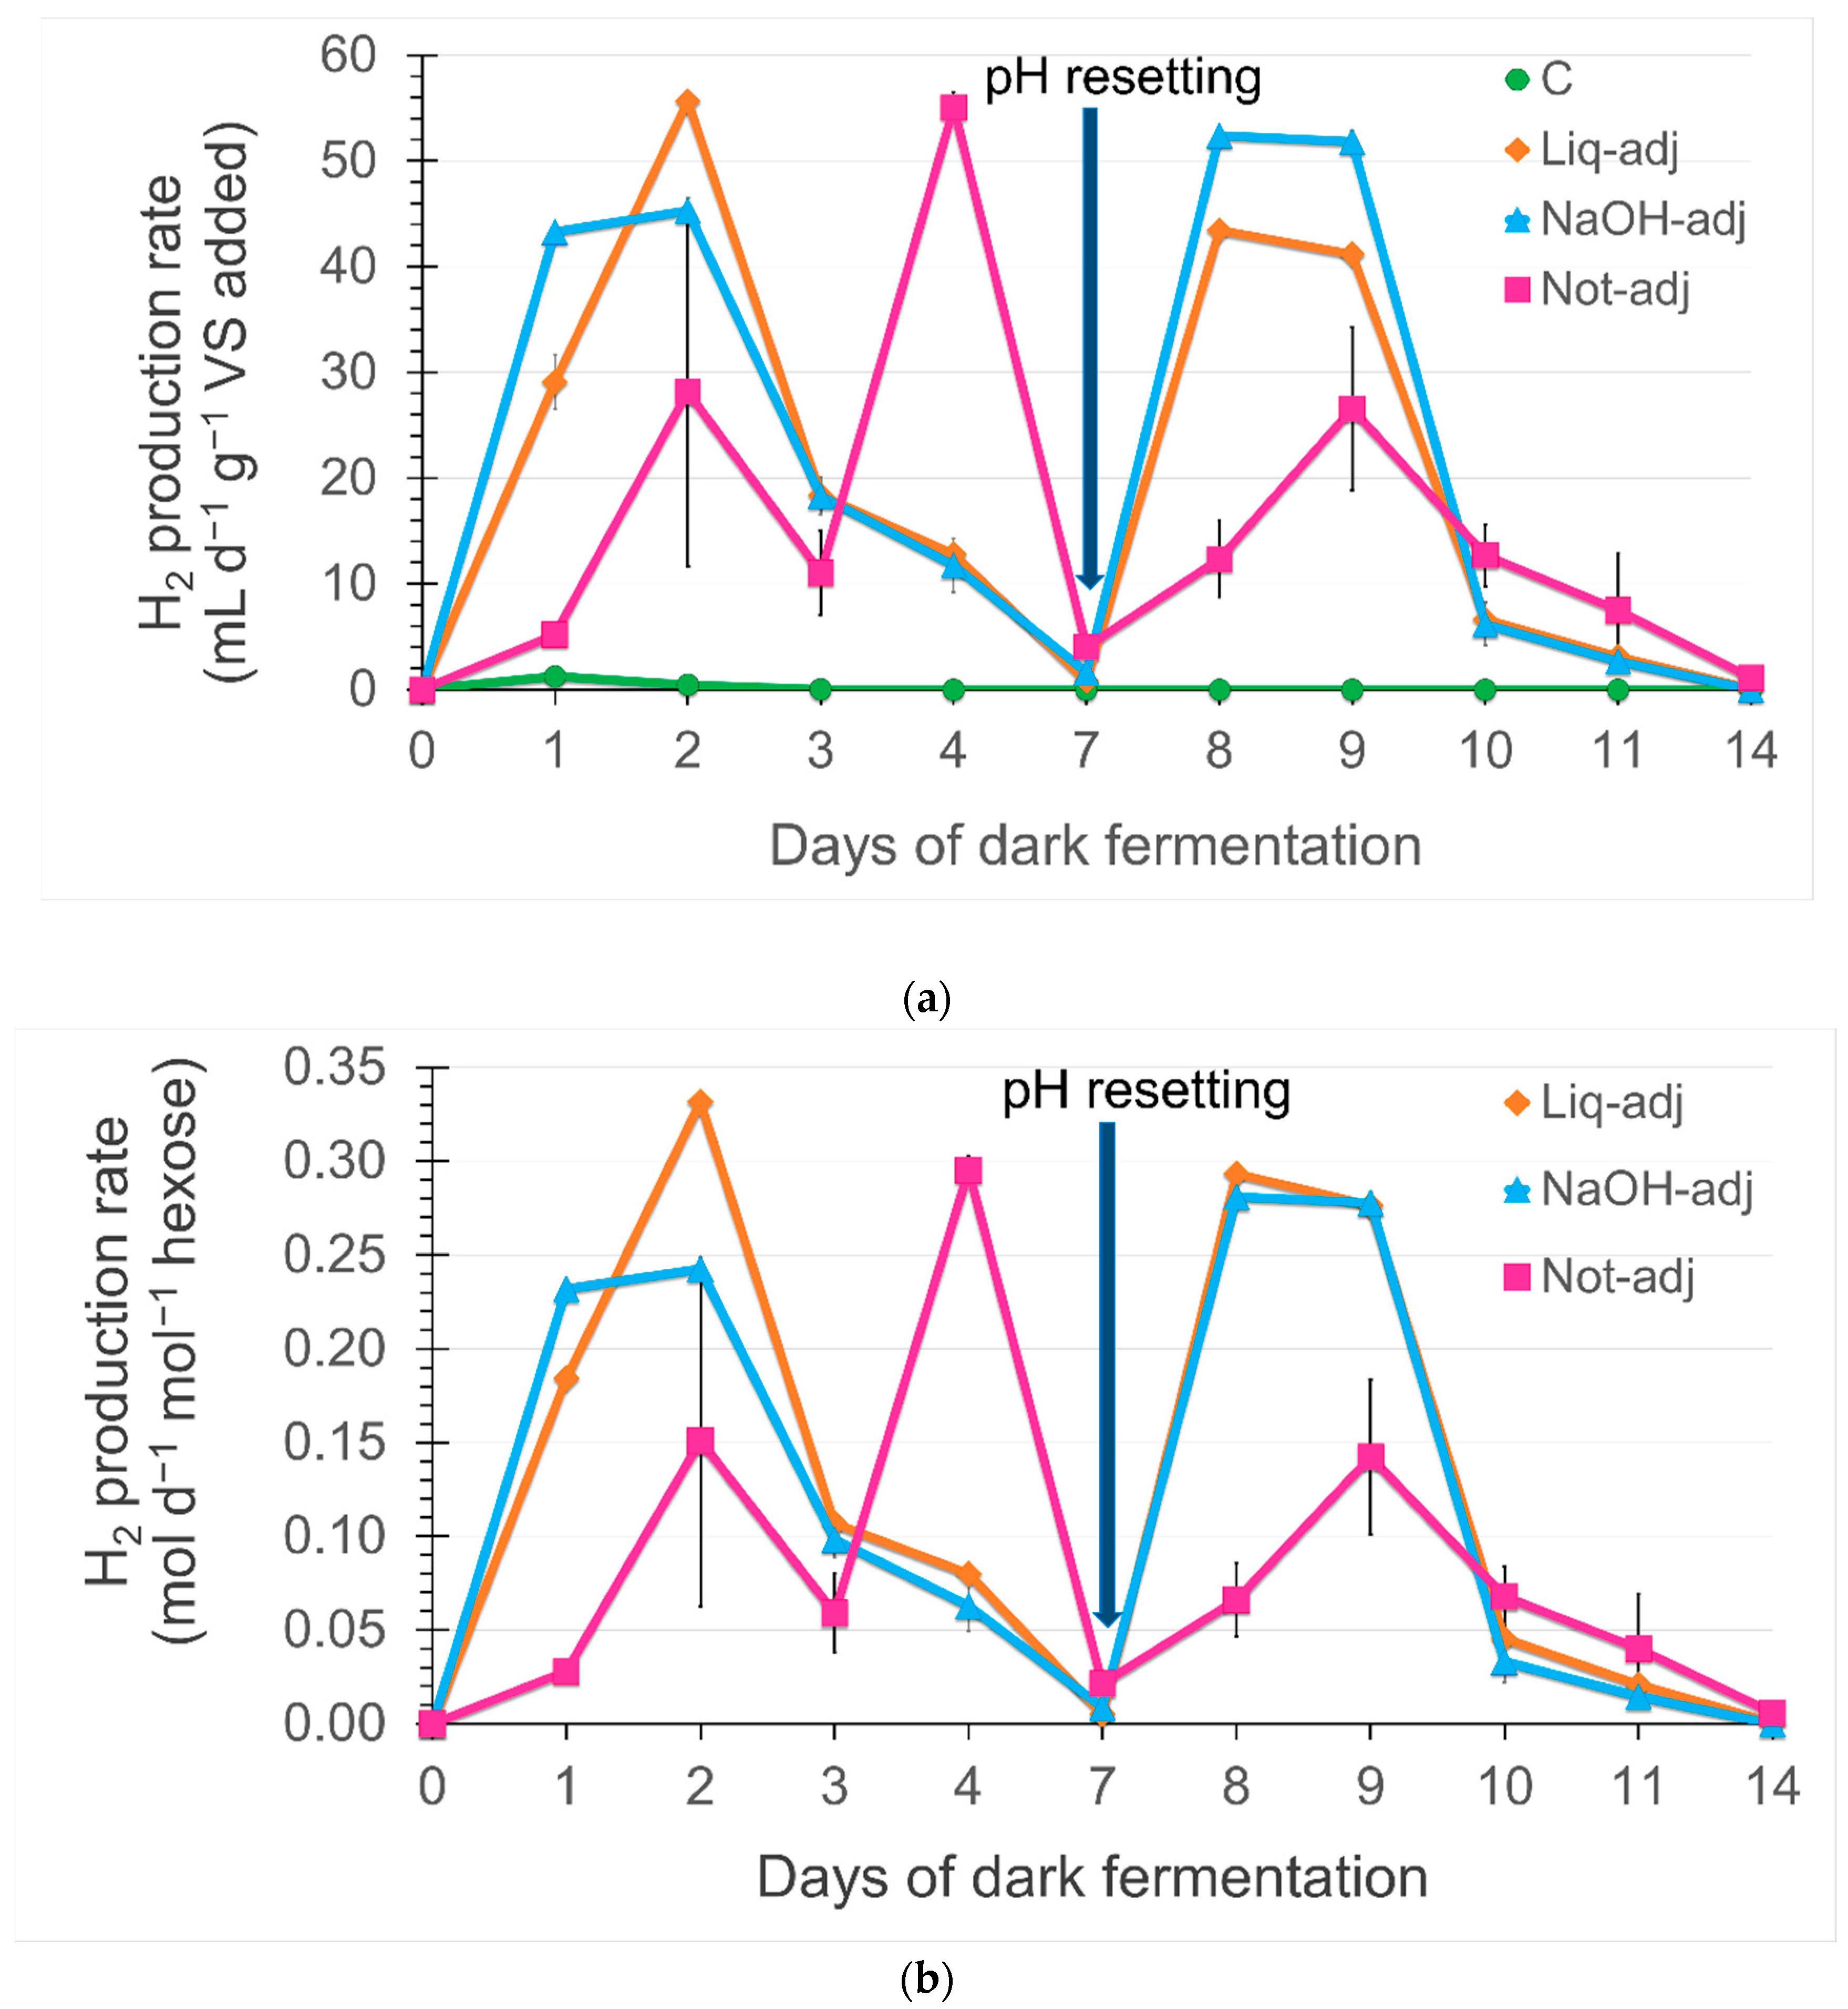
3.4. Time-Course of the Daily Rate of H2 Accumulation in Dark Fermentation

Figure 3 shows the daily rate of H2 accumulation (R) in DF per gram of VS (panel a) and per mole of reducing sugars in hexose equivalents (panel b) present in the reactor.
In panel (a), the time-course of the values of R for the control was steady and close to zero, R being very little from day two onward. On the contrary, two major DF cycles were visible for the hydrolysate-containing reactors with a major peak in each cycle. Not-adj reactors displayed a significantly lower R profile in the second cycle compared to the other treatments.
In both DF cycles, the H2 accumulation was very fast since R was significantly different from zero on both days 1 and 8 of DF i.e., H2 production started within one day in both DF cycles.
Notably, the maximum R-value for each treatment/cycle was reached at different times depending on the treatment and the DF cycle: (i) Not-adj reactors required four and two days to reach the maximum R-value after the start of the first and second cycles, respectively; (ii) NaOH-adj and Liq-adj reactors reached the maximum R-value faster than Not-adj reactors i.e., at two days and one day from the start of the first and second cycles, respectively. In general, the maxima were reached faster in the second cycle than in the first one. The maximum R-values per gram VS were 45, 56, 55 and 52, 43, 27 for NaOH-adj, Liq-adj, and Not-adj reactors, in the first and second cycles, respectively. In particular, during the first DF cycle, NaOH-adj reactors showed a significantly lowest value (45) if compared with the other treatments; on the contrary, in the second cycle, Not-adj reactors showed the lowest value (27).
Notably, during the first cycle, the Liq-adj reactors reached a higher R-value than NaOH-adj reactors even though there was a one-day shift (R-value 33% lower on day 1 and 23% higher on day 2). During the second cycle, Liq-adj and NaOH-adj profiles were similar in shape but the maximum R-value per gram VS was significantly lower in Liq-adj than in NaOH-adj reactors (−21%). However, it should be noted that, although having the same sugar load as in NaOH-adj, Liq-adj reactors contained a significantly higher amount of VS (liquor carry over) depressing the R rate per gram VS, and particularly doing so after resetting the pH.
It would seem that the initial pH, and the type of pH correction, significantly affect the max Rate and cumulated H2 production per g of VS. To isolate the effects of the black liquor addition on the H2 rate production, the R rate per mole of hexose was also reported (Figure 3b). In this case, during the second cycle, NaOH-adj and Liq-adj reactors showed an almost overlapping profile.
The maximum R-values per mole of hexose were 0.24, 0.33, 0.29 and 0.28, 0.30, 0.14 for NaOH-adj, Liq-adj, and Not-adj reactors, in the first and second cycles, respectively.
In the first DF cycle, Liq-adj reactors showed the statistically highest R-value (0.33), whereas in the second cycle no significant difference was observed with respect to NaOH-adj reactors. Not-adj reactors showed the lowest value in the second cycle and were halved with respect to the other reactors.

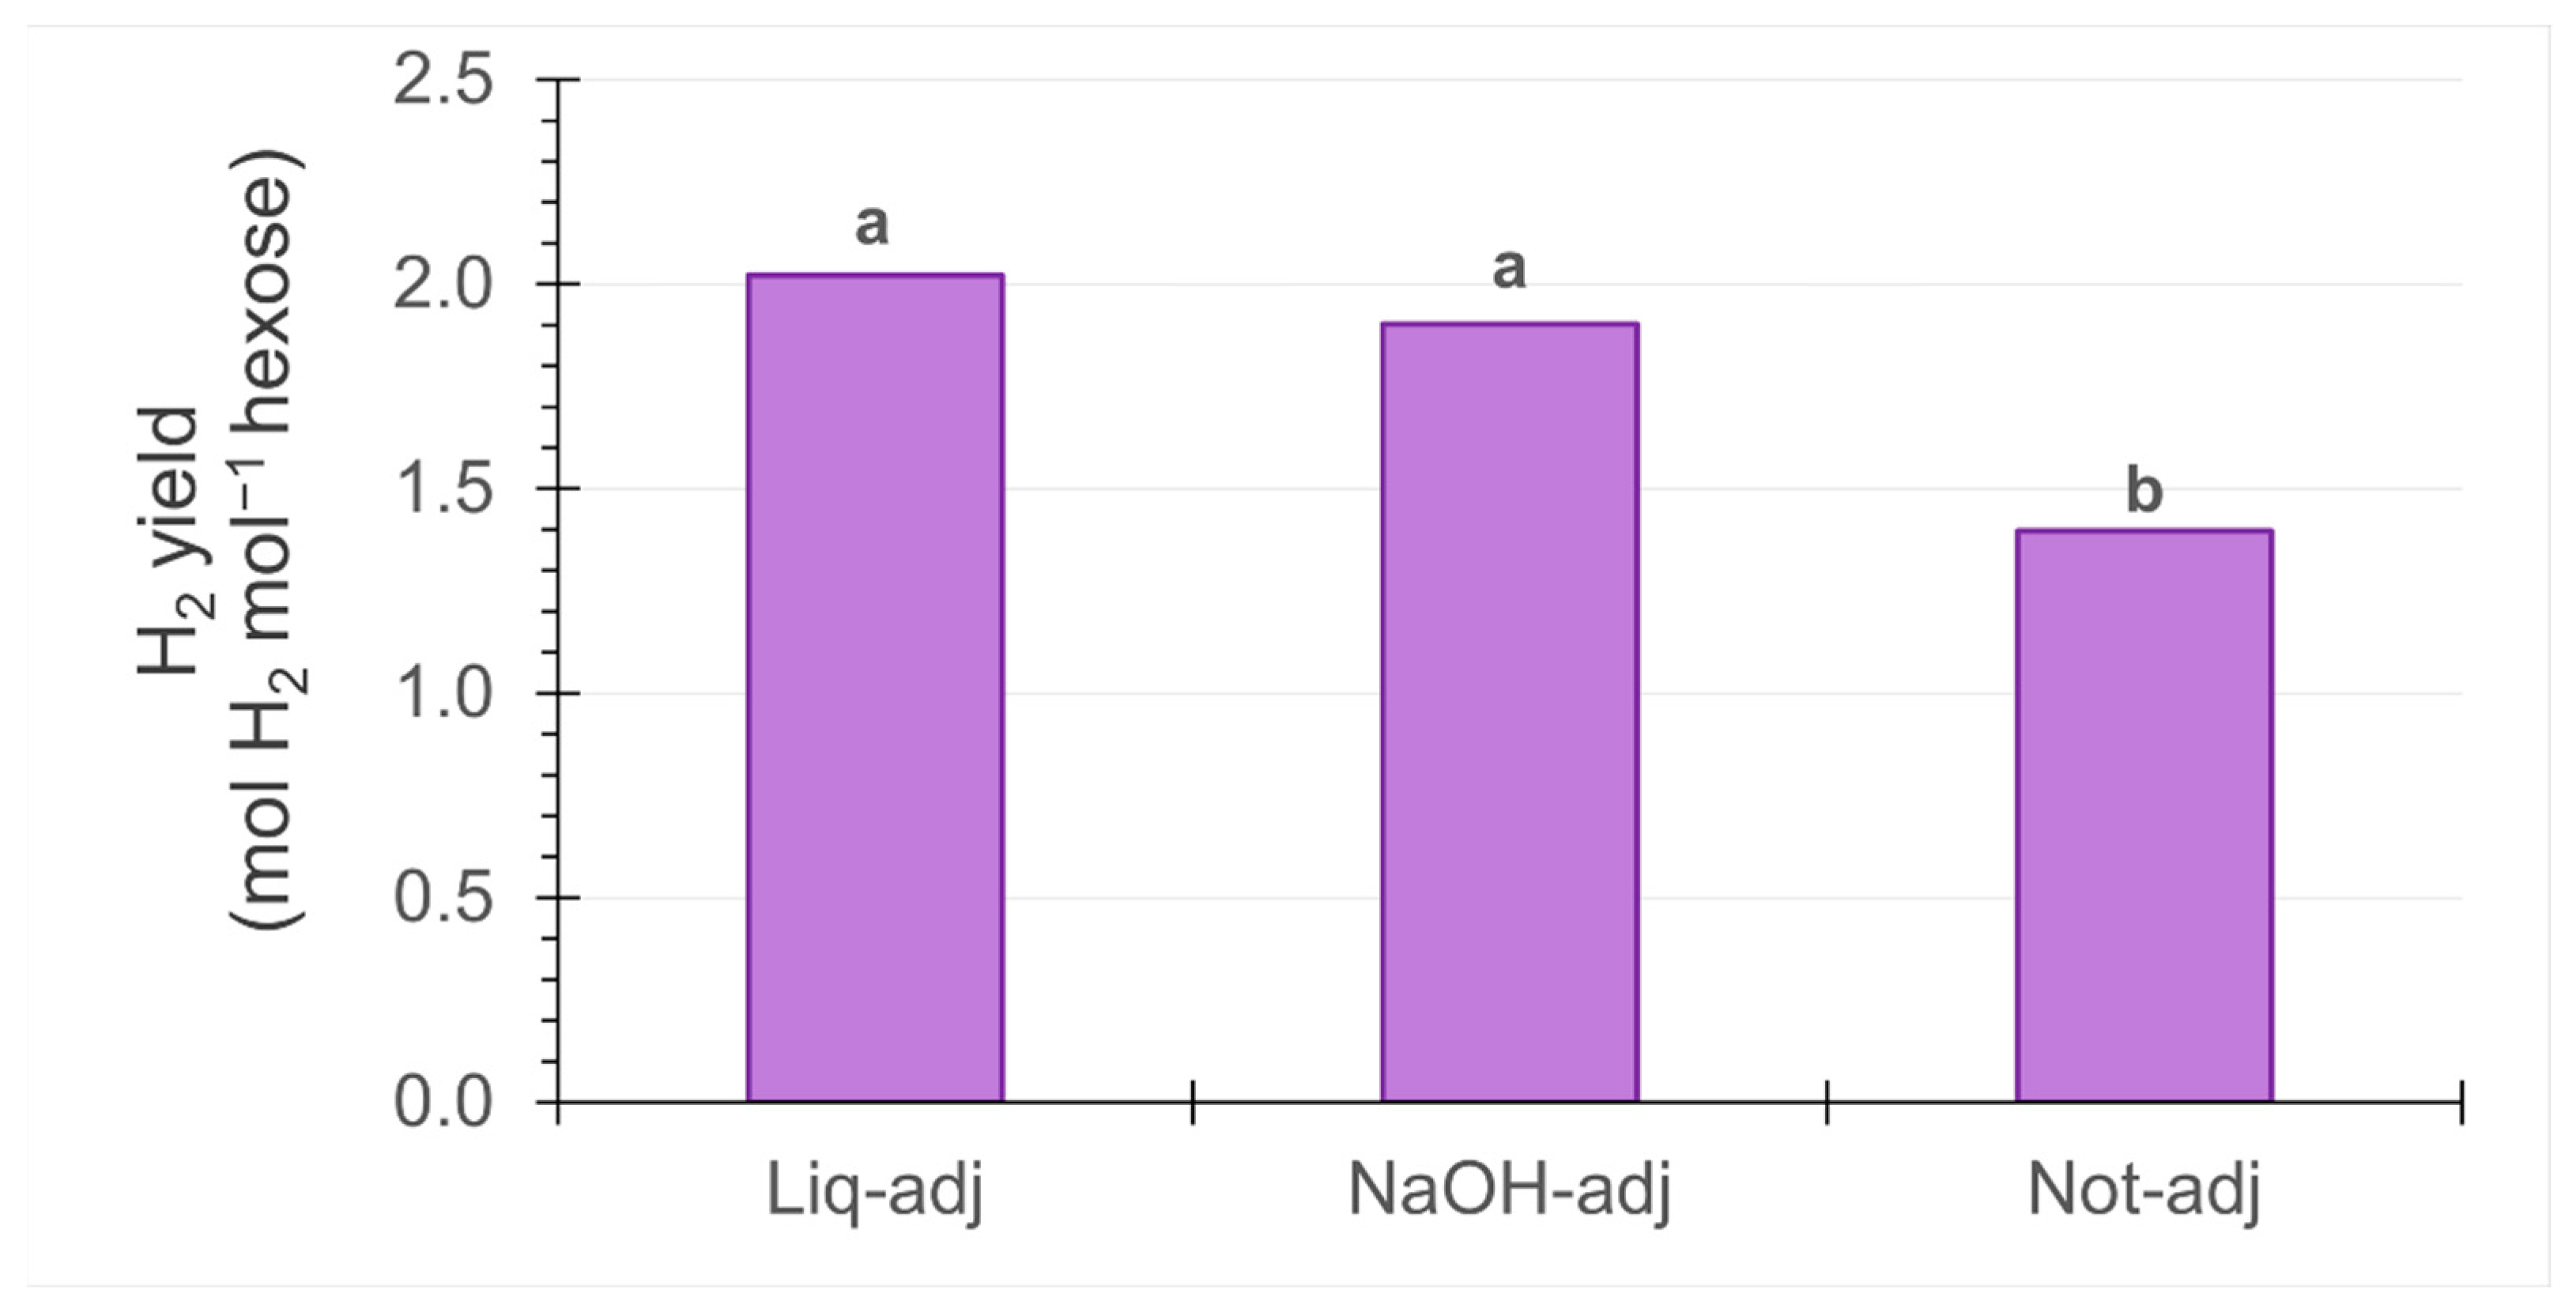
3.5. Hydrogen Yield Per Mole of Hexose in Dark Fermentation

To evaluate the influence of black liquor on H2 production, the cumulated H2 production per mole of hexose from giant reed hydrolysates for the different treatments was reported (Figure 4).
The highest absolute yield value was observed for Liq-adj, reactors (2.0 mol H2/mol hexose). However, the value observed for NaOH-adj reactors (1.9 mol H2/mol hexose) was not statistically different. The statistically significant lowest yield (1.4 mol H2/mol hexose) was obtained in Not-adj reactors. The initial alkaline pH (8.7) caused an increase of 39% in the hydrogen yield per mole of hexose compared to pH 5.3, without any detrimental effect due to the use of residual black liquor as an alkali source.

4. Discussion

4.1. Biomass Fractionation Yields Following the Pre-Treatment

As previously observed giant reed is a rather recalcitrant substrate and requires a pre-treatment to partially remove lignin and enhance enzymatic hydrolysis to obtain fermentable sugars [47] suitable for DF. However, after the alkali pre-treatment a substantial amount of biomass was liquefied (black liquor) as expected [22,48]. Black liquor re-utilization in the process to adjust pH could improve the overall yield and the sustainability of the process, reducing waste.
The sugar yield obtained in this study from the hydrolysis of the solid pre-treated biomass (410 mg/g) was consistent with previous reports, ranging between 380–489 mg/g [21,22,49].

4.2. Composition of the Materials Utilized in Dark Fermentation

Dark fermentation is more sensitive than anaerobic digestion to furanic and phenolic compounds [29]. Thus, the high content of polyphenols found in the black liquor (Table 1) could hamper H2 production. Phenolic compounds can have a considerable inhibitory effect on fermentation because they are generally toxic to microorganisms, even at low concentrations. However, at very low concentrations, some phenolic compounds may improve fermentation kinetics [50,51] since Clostridium spp. (typically H2 producers) provide for their degradation [29].
Black liquor also contains significant amounts of acetic acid (Table 1), which originated from the hemicellulose degradation due to the pre-treatment [29]. Giant reed has, in fact, a relatively high content of acetylated hemicellulose (3.7–4.8% acetate eq. on a DW basis) [52,53,54] that can be easily de-acetylated in alkaline conditions releasing acetic acid. Moreover, this acid can also be generated from the cleavage of xylose [55]. Several authors found acetic acid after the chemical pre-treatment of giant reed with concentrations ranging between 3.2–11 g/L, depending on solid content and treatment severity [54,56,57]. Notably, acetic acid can have an inhibitory or stimulatory effect on DF, depending on pH, concentration, and microorganisms [58,59]

4.3. Dark Fermentation Kinetics and Parameters

The kinetics of H2 production from hydrolysates reached a plateau within 96 h (first DF cycle) (Figure 2). Relatively faster kinetics was observed by other authors for giant reed hydrolysates, reaching a plateau within 72 h [30,31,32]. However, those authors worked with a significantly lower initial sugar concentration (5–20 g/L).
One of the most relevant parameters that influence H2 production in DF is pH [26] and the optimal pH for H2 production from carbohydrates is in the range of 5.2–7.0, depending on raw materials, microbial populations, and operational conditions [51]. When biomass hydrolysates were used, the optimal initial pH for H2 production was found to be dependent on inoculum source: 6.5–7.0 with enrichment cultures from cow dung compost, 5.5 with Clostridium butyricum, and 8.0 with dairy manure bacteria [51].
The dark fermentation of hydrolysates of steam-exploded giant reed carried out at initial pH 5.9 with a mixed culture from an anaerobic digestion plant, allowed cumulative H2 production to double, thanks to a progressive adaptation of the consortium [32]. Notably, the present study’s comparison between acidic versus alkaline initial pH highlighted the superior performance of the latter, in the presence of higher sugar concentration than that used in ref. [32] (50 g/L versus 5 g/L of sugars, respectively). The usefulness of alkaline initial pH was already highlighted in a previous study on a substrate with a similar sugar concentration (51 g/L lactose), comparing initial pH in the range 4–10 [27]. Those authors found that H2 production started only when pH fell below 6. However, it was much higher in the reactors with initial alkaline pH. Alkaline conditions allowed an optimal selection and activity of the microbial consortium, favouring H2-producing Clostridia and Enterobacteria [9] which are among the most efficient H2 producers [60].
Notably, the pH resetting at the end of the first DF cycle facilitated a restart of H2 production in the second DF cycle, significantly increasing the overall yield (Figure 2) as previously reported for scotta permeate [39]. In the case of alkaline pH, the H2 production rate was also restored. The re-use of the discarded alkaline black liquor as pH corrector did not exert any inhibition phenomena on DF, notwithstanding its considerable acetate and polyphenol content, which are generally considered to be potential inhibitors. Interestingly, no methanogenesis was recorded, notwithstanding acetic acid’s ability to induce acetoclastic methanogenesis. Methanogens are considered the main H2-consuming microorganisms [29]. In particular, Methanosarcina spp. can produce CH4 via acetoclastic and hydrogenotrophic pathways [61].
Some polyphenolic compounds may improve fermentation kinetics at very low concentrations [51]. In the present study, a delay in the H2 accumulation rate was observed on day 1 of DF. However, this initial inhibition was resolved within 48 h. In a previous study, the start of anaerobic digestion of the giant reed was also affected by black liquor addition [33].
With phenol concentrations up to 1 g/L, no negative effects on DF of wastewater by C. butyricum were reported, whereas at 1.5 g/L a complete DF inhibition was observed [29]. Based on Table 1, it can be calculated that the concentration of polyphenols in the Liq-adj reactors at the start of the first cycle was 1.75 g/L (70 mg in 40 mL reaction volume), whereas polyphenolic load at the start of the second cycle was 2 g/L (98 mg in 47 mL reaction volume). However, no inhibitory effects were detected in the DF process, except for a slight delay at the start of the first DF cycle. In the second DF cycle, on the other hand, no delay was observed. It is known that an adaptation of the microbial community to phenolic compounds can alleviate inhibitory effects [29], which could explain the lack of inhibition in the second DF cycle, whereas the initial pH 8.7 could play a key role in alleviating the initial inhibition since it was previously reported that it created favourable environmental conditions for Clostridia [9], which are the main polyphenolic compound degraders [29].
Finally, liquor could also contain other fermentable compounds, like, for instance, cellulose and oligomers from hemicellulose degradation, which could have contributed to stimulating the growth of Clostridia [62].
The initial alkaline pH obtained with liquor or NaOH was clearly beneficial in terms of final cumulated H2 calculated per gram of VS, if compared to DF performed with acidic initial pH (Table 2). The positive effect of alkaline pH on H2 production has been previously reported [27,63]. However, the significant VS carry-over of low (or no) hydrogen-yielding compounds in the liquor in Liq-adj reactors may explain the relatively lower performance per VS gram of these latter compared to NaOH-adj reactors. The lack of detrimental effect on the maximum rate of H2 production in Liq-adj reactors could be explained by the fast recovery from initial inhibition clearly visible on day 1 (Figure 3). The observed cumulated H2 values per gram of VS (up to 237 mL H2 STP g−1 VS) were higher than the values previously reported by other authors performing DF experiments with lignocellulosic hydrolysates. Some authors reviewed H2 yields from different lignocellulosic hydrolysates corresponding to 20–140 mL/g at high VS concentration (VS range 20–40 g/L) [64]. More recently H2 yield corresponding to over 200 mL/g VS was achieved with hydrolysed sugar beet pulp [65]. The high H2 yield observed in the present study can be explained by the very high sugar content per gram VS of the hydrolysate.
The H2 concentrations in the biogas observed in this work (48–58%) were lower than those reported by other authors utilizing giant reed hydrolysates (69–75%) [30,31,32]. However, these authors worked with significantly lower initial sugar concentrations (5–20 g/L) and with thermally pre-treated inocula and/or were enriched in H2-producing bacteria. Both these latter conditions favoured a high percentage of H2 in the biogas. Pre-treatment and enrichment in H2-producing bacteria eliminated most of the H2-consuming microorganisms, but also those that consume sugar by producing CO2 but not H2 [26]. On the other hand, a low sugar concentration may lead to slow acidification. The acidification of the medium promotes a metabolic pathway shift [66] from acetic acid (Equation (1)) to butyric acid (Equation (2)) pathway [67]:
C 6 H 12 O 6 + 2 H 2 O 2 CH 3 COOH + 2 CO 2 + 4 H 2
C 6 H 12 O 6 CH 3 CH 2 CH 2 COOH + 2 CO 2 + 2 H 2
The butyric acid metabolic pathway is activated to counteract pH drop and, therefore, it is favoured at pH below 6 [68]; whereas the metabolic pathway of Equation (1) allows for biogas richer in H2. If the metabolic shift is delayed or avoided, it is obvious that the % H2 in the biogas remains high. Indeed, under similar conditions of initial sugar concentration to the present study, H2 production via acetic and butyric acid pathways coexisted from the beginning of the exponential H2 production phase [27]. This co-production at initial alkaline pH was also reported more recently on DF of brewery spent grains at a similar organic load (47 g/L) [67] with 58% of maximum H2 concentration in the biogas. At 28 g/L sugar concentration, with Miscanthus hydrolysate fermented by Thermotoga neapolitana, H2 and CO2 production of 82 and 62 mmol/L, respectively, were reported [69], which corresponded to a 57% H2 concentration in the biogas, thus, a value consistent with our experiment performed at high sugar concentration.

4.4. Daily Rate of H2 Accumulation in Dark Fermentation

Concerning the daily rate of H2 accumulation (R), the comparison of panel (a) with panel (b) of Figure 3, shows that the initial pH adjustment (8.7) was always beneficial compared to not adjusting the initial pH (5.3), giving rise to a faster rise to maximum in both cycles and higher maxima in the second. Notably, the pH correction with liquor did not negatively affect the R-values per mole of hexose, if compared to pH correction with NaOH. In fact, in both cycles, the highest R-values were obtained in Liq-adj reactors (0.34 and 0.30 moles of H2 per mole of hexose per day in the first and second cycle, respectively).
Based on data reported by other authors [32] concerning DF of steam-exploded giant reed hydrolysate, a rate R of 1.6 moles of H2 per mole of hexose per day could be calculated, which was higher than what we found in this study. It must be taken into account that in the previous work, that value was recorded after an inoculum enrichment process. Furthermore, the hydrolysate was supplemented with nutrient solution and minimal medium. Besides, it must be considered that the inoculum-to-substrate ratio (ISR) was higher than that used in the current study. These conditions enhanced the maximum R value. In the present study, conversely, the hydrolysate was used without additives and was inoculated with an ISR = 0.13 because, using non-selected mixed inoculum, the aim was to keep the methanogens content low, considering the origin of the inoculum (pig slurry).
A maximum volumetric H2 productivity (Q) of 5.4–6.2 mmol/L/h in reactors containing 28 g/L of sugars from alkaline-pretreated Miscanthus hydrolysates during DF with Caldicellulosiruptor saccharolyticus and T. neapolitana, was reported [69] corresponding to 0.83–0.96 moles of H2 per mole of hexose per day, respectively. Furthermore, Q values were almost halved and H2 yields strongly decreased by utilizing 28 g/L sugars instead of 14 g/L [69]. However, it must be considered that in that study the DF was carried out in thermophilic conditions, which favour the kinetics of H2 accumulation [70]. Furthermore, these values were obtained with pure cultures and in very particular conditions, such as controlled pH and the headspace of the reactors constantly flushed with N2 to remove H2 by lowering the partial pressure of H2.
Thus, the comparatively lower rates observed in our study may be explained by the very high initial sugar concentration used [64], as well as the non-adequate ISR possibly slowing down the process. However, all the conditions reported in the various studies were very peculiar. In more similar conditions, as in [27], the maximum daily rate was consistent with the R max reported in this study.

4.5. Hydrogen Yield Per Mole of Hexose in Dark Fermentation

The addition of alkaline black liquor to adjust pH did not interfere with the cumulated H2 production per mole of hexose, indicating a lack of inhibitory effect on DF. Thus, the black liquor can be advantageously re-used instead of NaOH to adjust pH and obtain a significant H2 yield increase.
The H2 yields per mole of hexose from different lignocellulosic hydrolysates were generally below 1.8 and tended to be lower for high sugar concentrations [64]. In the present study, H2 yield reached 2 mol/mol hexose, which was higher than those reported by Toscano et al. [30] (0.17–0.3 mol H2/mol hexose) or by Ausiello et al. [31] (1.14 mol H2/mol hexose), using hydrolysates from steam-exploded giant reed (10 and 20 g/L initial sugars, respectively) obtained with thermally pre-treated or thermally pre-treated and enriched inoculum.
The yields reported in this study are consistent with those previously obtained using giant reed hydrolysate (2.59 mol H2/mol hexose), after three consecutive steps of inoculum adaptation and low sugar concentration (5 g/L) [32] on supplemented hydrolysate. In the current study, such high yields were obtained notwithstanding the high initial sugar concentration, only adjusting the initial pH to an alkaline value (8.7), without any inoculum adaptation. These findings are of the same order of magnitude as those obtained previously under similar conditions on lactose (51 g/L) at initial pH 8 and per moles of hexose-equivalent consumed [27].

5. Conclusions

The opportunity to combine thermo-alkaline pre-treatment with saccharification and to adjust initial pH to alkaline values to improve H2 production from giant reed, was highlighted. In particular, when the initial pH was adjusted with alkaline black liquor residues after biomass pre-treatment, no inhibitory effect was observed. Thus, the alkaline black liquor can be recycled in the DF process, instead of being discarded. The integration of DF with other technologies, such as anaerobic digestion, could allow valorizing DF effluent, rich in organic acids, closing the loop to produce more energy. In this case, the high acetate content in the black liquor would be added to the volatile fatty acids produced in DF and could be conveniently exploited in anaerobic digestion.

Author Contributions

Conceptualization, C.V., S.C., R.M. and S.G.; methodology, C.V., S.C., R.M. and S.G.; validation, C.V. and S.C.; formal analysis, R.M. and E.C.; investigation, C.V. and S.C.; resources, S.G. and R.M.; data curation, C.V.; writing—original draft preparation, C.V. and S.C.; writing—review and editing, C.V., S.C., R.M. and S.G.; visualization, C.V.; supervision, R.M. and S.G.; project administration, R.M. and S.G.; funding acquisition, R.M. and S.G. All authors have read and agreed to the published version of the manuscript.

Funding

This research was funded by the Italian Ministry of Agricultural, Food and Forestry Policies (MiPAAF) under the AGROENER project (D.D. n. 26329, 1 April 2016) http://agroener.crea.gov.it (accessed on 1 April 2022).

Data Availability Statement

Data is contained within the article. The raw data utilized in this study are available on request from the corresponding author.

Acknowledgments

Authors wish to thank Anna Orsi for laboratory analyses and assistance.

Conflicts of Interest

The authors declare no conflict of interest. The funders had no role in the design of the study; in the collection, analyses, or interpretation of data; in the writing of the manuscript, or in the decision to publish the results.

References

  1. McAllister, S.; Chen, J.-Y.; Fernandez-Pello, A.C. Fundamentals of Combustion Processes; Springer: New York, NY, USA, 2011; pp. 227–241. [Google Scholar] [CrossRef]
  2. Kalamaras, C.M.; Efstathiou, A.M. Hydrogen production technologies: Current state and future developments. Conf. Pap. Sci. 2013, 2013, 690627. [Google Scholar] [CrossRef] [Green Version]
  3. Bhatia, S.K.; Jagtap, S.S.; Bedekar, A.A.; Bhatia, R.K.; Rajendran, K.; Pugazhendhi, A.; Rao, C.V.; Atabani, A.E.; Kumar, G.; Yang, Y.H. Renewable biohydrogen production from lignocellulosic biomass using fermentation and integration of systems with other energy generation technologies. Sci. Total Environ. 2021, 765, 144429. [Google Scholar] [CrossRef] [PubMed]
  4. Delvar, M.A.; Wang, J. Numerical investigation of pH control on dark fermentation and hydrogen production in a microbioreactor. Fuel 2021, 292, 120355. [Google Scholar] [CrossRef]
  5. Balachandar, G.; Khanna, N.; Das, D. Biohydrogen production from organic wastes by dark fermentation. In Biohydrogen, 1st ed.; Pandey, A., Chang, J.-S., Hallenbeck, P., Larroche, C., Eds.; Elsevier: Amsterdam, The Netherlands, 2013; pp. 103–144. [Google Scholar] [CrossRef]
  6. Singh, R.; Tevatia, R.; White, D.; Demirel, Y.; Blum, P. Comparative kinetic modeling of growth and molecular hydrogen overproduction by engineered strains of Thermotoga maritima. Int. J. Hydrogen Energy 2019, 44, 7125–7136. [Google Scholar] [CrossRef] [Green Version]
  7. Corneli, E.; Dragoni, F.; Adessi, A.; De Philippis, R.; Bonari, E.; Ragaglini, G. Energy conversion of biomass crops and agroindustrial residues by combined biohydrogen/biomethane system and anaerobic digestion. Bioresour. Technol. 2016, 211, 509–518. [Google Scholar] [CrossRef]
  8. Zhang, Z.; Li, Y.; Zhang, H.; He, C.; Zhang, Q. Potential use and the energy conversion efficiency analysis of fermentation effluents from photo and dark fermentative bio-hydrogen production. Bioresour. Technol. 2017, 245, 884–889. [Google Scholar] [CrossRef]
  9. Vasmara, C.; Pindo, M.; Micheletti, D.; Marchetti, R. Initial pH influences microbial communities composition in dark fermentation of scotta permeate. Int. J. Hydrogen Energy 2018, 43, 8707–8717. [Google Scholar] [CrossRef]
  10. Srivastava, N.; Srivastava, M.; Malhotra, B.D.; Gupta, V.K.; Ramteke, P.W.; Silva, R.N.; Shukla, P.; Dubey, K.K.; Mishra, P.K. Nanoengineered cellulosic biohydrogen production via dark fermentation: A novel approach. Biotechnol. Adv. 2019, 37, 107384. [Google Scholar] [CrossRef]
  11. Scordia, D.; Testa, G.; Cosentino, S.L. Perennial grasses as lignocellulosic feedstock for second-generation bioethanol production in Mediterranean environment. Ital. J. Agron. 2014, 9, 84–92. [Google Scholar] [CrossRef]
  12. Fike, J.H.; Parrish, D.J.; Fike, W.B. Sustainable cellulosic grass crop production. In Biofuel Crop Sustainability, 1st ed.; Singh, B.P., Ed.; John Wiley & Sons: Chichester, UK, 2013; pp. 109–164. [Google Scholar] [CrossRef]
  13. Ge, X.M.; Xu, F.Q.; Vasco-Correa, J.; Li, Y.B. Giant reed: A competitive energy crop in comparison with miscanthus. Renew. Sustain. Energy Rev. 2016, 54, 350–362. [Google Scholar] [CrossRef] [Green Version]
  14. Ceotto, E.; Castelli, F.; Moschella, A.; Diozzi, M.; Di Candilo, M. Cattle slurry fertilization to giant reed (Arundo donax L.): Biomass yield and nitrogen use efficiency. Bioenergy Res. 2015, 8, 1252–1262. [Google Scholar] [CrossRef]
  15. Ceotto, E.; Vasmara, C.; Marchetti, R.; Cianchetta, S.; Galletti, S. Biomass and methane yield of giant reed (Arundo donax L.) as affected by single and double annual harvest. Glob. Chang. Biol. Bioenergy 2021, 13, 393–407. [Google Scholar] [CrossRef]
  16. Van Dik, J.S.; Pletschke, B. A review of lignocellulose bioconversion using enzymatic hydrolysis and synergistic cooperation between enzymes—Factors affecting enzymes, conversion and synergy. Biotechnol. Adv. 2012, 30, 1458–1480. [Google Scholar] [CrossRef] [PubMed]
  17. Sharma, B.; Larroche, C.; Dussap, C.G. Comprehensive assessment of 2G bioethanol production. Bioresour. Technol. 2020, 313, 123630. [Google Scholar] [CrossRef]
  18. Cianchetta, S.; Di Maggio, B.; Burzi, P.L.; Galletti, S. Evaluation of selected white-rot fungal isolates for improving the sugar yield from wheat straw. Appl. Biochem. Biotechnol. 2014, 173, 609–623. [Google Scholar] [CrossRef]
  19. Mosier, N.; Wyman, C.; Dale, B.; Elander, R.; Lee, Y.Y.; Holtzapple, M.; Ladisch, M. Features of promising technologies for pretreatment of lignocellulosic biomass. Bioresour. Technol. 2005, 96, 673–686. [Google Scholar] [CrossRef]
  20. Singh, J.; Suhag, M.; Dhaka, A. Augmented digestion of lignocellulose by steam explosion, acid and alkaline pretreatment methods: A review. Carbohydr. Polym. 2015, 117, 624–631. [Google Scholar] [CrossRef]
  21. Cianchetta, S.; Nota, M.; Polidori, N.; Galletti, S. Alkali pre-treatment and enzymatic hydrolysis of Arundo donax for single cell oil production. Environ. Eng. Manag. J. 2019, 18, 1693–1701. [Google Scholar]
  22. Cianchetta, S.; Polidori, N.; Vasmara, C.; Ceotto, E.; Marchetti, R.; Galletti, S. Single cell oil production from hydrolysates of alkali pre-treated giant reed: High biomass-to-lipid yields with selected yeasts. Ind. Crops Prod. 2022, 178, 114596. [Google Scholar] [CrossRef]
  23. McIntosh, S.; Vancov, T. Optimisation of dilute alkaline pretreatment for enzymatic saccharification of wheat straw. Biomass Bioenergy 2011, 35, 3094–3103. [Google Scholar] [CrossRef]
  24. Kim, J.S.; Lee, Y.Y.; Kim, T.H. A review on alkaline pretreatment technology for bioconversion of lignocellulosic biomass. Bioresour. Technol. 2016, 199, 42–48. [Google Scholar] [CrossRef] [PubMed]
  25. Salakkam, A.; Plangklang, P.; Sittijunda, S.; Kongkeitkajorn, M.B.; Lunprom, S.; Reungsang, A. Bio-hydrogen and methane production from lignocellulosic materials. In Biomass for Bioenergy-Recent Trends and Future Challenges, 1st ed.; Abomohra, A.E., Ed.; IntechOpen: London, UK, 2019. [Google Scholar] [CrossRef] [Green Version]
  26. Vasmara, C.; Marchetti, R. Initial pH influences in-batch hydrogen production from scotta permeate. Int. J. Hydrogen Energy 2017, 42, 14400–14408. [Google Scholar] [CrossRef]
  27. Wang, J.; Yin, Y. Biohydrogen Production from Organic Wastes; Springer Nature: Singapore, 2017; pp. 69–121. [Google Scholar] [CrossRef]
  28. Monlau, F.; Sambusiti, C.; Barakat, A.; Quéméneur, M.; Trably, E.; Steyer, J.P.; Carrère, H. Do furanic and phenolic compounds of lignocellulosic and algae biomass hydrolyzate inhibit anaerobic mixed cultures? A comprehensive review. Biotechnol. Adv. 2014, 2, 934–951. [Google Scholar] [CrossRef] [PubMed]
  29. Toscano, G.; Zuccaro, G.; Ausiello, A.; Micoli, L.; Turco, M.; Pirozzi, D. Production of hydrogen from giant reed by dark fermentation. Chem. Eng. 2014, 37, 331–336. [Google Scholar] [CrossRef]
  30. Ausiello, A.; Micoli, L.; Pirozzi, D.; Toscano, G.; Turco, M. Biohydrogen production by dark fermentation of Arundo donax for feeding fuel cells. Chem. Eng. Trans. 2015, 43, 385–390. [Google Scholar] [CrossRef]
  31. Ausiello, A.; Micoli, L.; Turco, M.; Toscano, G.; Florio, C.; Pirozzi, D. Biohydrogen production by dark fermentation of Arundo donax using a new methodology for selection of H2-producing bacteria. Int. J. Hydrogen Energy 2017, 42, 30599–30612. [Google Scholar] [CrossRef]
  32. Jiang, D.; Ge, X.; Zhang, T.; Chen, Z.; Zhang, Z.; He, C.; Zhang, Q.; Li, Y. Effect of alkaline pretreatment on photo-fermentative hydrogen production from giant reed: Comparison of NaOH and Ca(OH)2. Bioresour. Technol. 2020, 304, 123001. [Google Scholar] [CrossRef]
  33. Vasmara, C.; Cianchetta, S.; Marchetti, R.; Ceotto, E.; Galletti, S. Potassium Hydroxide Pre-Treatment Enhances Methane Yield from Giant Reed (Arundo donax L.). Energies 2021, 14, 630. [Google Scholar] [CrossRef]
  34. Hinkelmann, K.; Kempthorne, O. Design and Analysis of Experiments: Introduction to Experimental Design, 2nd ed.; Wiley-Interscience: New York, NY, USA, 2007; Volume 1, p. 631. [Google Scholar] [CrossRef]
  35. Miller, G.L. Use of dinitrosalicylic acid reagent for determination of reducing sugar. Anal. Chem. 1959, 31, 426–428. [Google Scholar] [CrossRef]
  36. Cianchetta, S.; Galletti, S.; Burzi, P.L.; Cerato, C. A novel microplate-based screening strategy to assess the cellulolytic potential of Trichoderma strains. Biotechnol. Bioeng. 2010, 107, 461–468. [Google Scholar] [CrossRef]
  37. Kádár, Z.; de Vrije, T.; van Noorden, G.E.; Budde, M.A.; Szengyel, Z.; Réczey, K.; Claassen, P.A. Yields from glucose, xylose, and paper sludge hydrolysate during hydrogen production by the extreme thermophile Caldicellulosiruptor saccharolyticus. Appl. Biochem. Biotechnol. 2004, 113–116, 497–508. [Google Scholar] [CrossRef]
  38. Vasmara, C.; Cianchetta, S.; Marchetti, R.; Galletti, S. Biogas production from wheat straw pre-treated with ligninolytic fungi and co-digestion with pig slurry. Environ. Eng. Manag. J. 2015, 14, 1751–1760. Available online: http://www.eemj.icpm.tuiasi.ro/pdfs/vol14/no7/Full/28_1073_Vasmara_14.pdf (accessed on 1 April 2022). [CrossRef]
  39. Marchetti, R.; Vasmara, C. Co-digestion of deproteinized dairy waste with pig slurry: Effect of recipe and initial pH on biogas and volatile fatty acid production. BioEnergy Res. 2020, 13, 643–658. [Google Scholar] [CrossRef]
  40. Owen, W.F.; Stuckey, D.C.; Healy, J.B., Jr.; Young, L.Y.; McCarty, P.L. Bioassay for monitoring biochemical methane potential and anaerobic toxicity. Water Res. 1979, 13, 485–492. [Google Scholar] [CrossRef]
  41. Vasmara, C.; Marchetti, R. Biogas production from biodegradable bioplastics. Environ. Eng. Manag. J. 2016, 15, 2041–2048. [Google Scholar] [CrossRef]
  42. American Public Health Association (APHA). Standard Methods for the Examination of Water and Wastewater, 18th ed.; American Public Health Association: Washington, DC, USA, 1992. [Google Scholar]
  43. Van Soest, P.J.; Robertson, J.B.; Lewis, B.A. Methods for dietary fiber, neutral-detergent fiber and non-starch polysaccharides in relation to animal nutrition. J. Dairy Sci. 1991, 74, 3583–3597. [Google Scholar] [CrossRef]
  44. Vasmara, C.; Marchetti, R. Spent coffee grounds from coffee vending machines as feedstock for biogas production. Environ. Eng. Manag. J. 2018, 17, 2813–2821. Available online: http://www.eemj.icpm.tuiasi.ro/pdfs/vol17/full/no10/12_108_Vasmara_18.pdf (accessed on 1 April 2022).
  45. Vasmara, C.; Marchetti, R.; Carminati, D. Wastewater from the production of lactic acid bacteria as feedstock in anaerobic digestion. Energy 2021, 229, 120740. [Google Scholar] [CrossRef]
  46. Hammer, Ø.; Harper, D.A.T.; Ryan, P.D. PAST: Paleontological statistics software package for education and data analysis. Palaeontol. Electron. 2001, 4, 1–9. Available online: https://palaeo-electronica.org/2001_1/past/past.pdf (accessed on 1 April 2022).
  47. Cianchetta, S.; Bregoli, L.; Galletti, S. Microplate-based evaluation of the sugar yield from giant reed, giant Miscanthus and switchgrass after mild chemical pre-treatments and hydrolysis with tailored Trichoderma enzymatic blends. Appl. Biochem. Biotechnol. 2017, 183, 876–892. [Google Scholar] [CrossRef]
  48. Jiang, D.; Ge, X.; Zhang, Q.; Li, Y. Comparison of liquid hot water and alkaline pretreatments of giant reed for improved enzymatic digestibility and biogas energy production. Bioresour. Technol. 2016, 216, 60–68. [Google Scholar] [CrossRef] [PubMed] [Green Version]
  49. Lemões, J.S.; e Silva, C.F.L.; Avila, S.P.F.; Montero, C.R.S.; e Silva, S.D.D.A.; Samios, D.; Peralba, M.D.C.R. Chemical pretreatment of Arundo donax L. for second-generation ethanol production. Electron. J. Biotechnol. 2018, 31, 67–74. [Google Scholar] [CrossRef]
  50. Panagiotopoulos, I.A.; Bakker, R.R.; de Vrije, T.; van Niel, E.W.J.; Koukios, E.G.; Claassen, P.A.M. Exploring critical factors for fermentative hydrogen production from various types of lignocellulosic biomass. J. Jpn. Inst. Energy 2011, 90, 363–368. [Google Scholar] [CrossRef] [Green Version]
  51. Panagiotopoulos, I.A. Dark fermentative hydrogen production from ligno-cellulosic biomass. In Production of Hydrogen from Renewable Resources. Biofuels and Biorefineries, 1st ed.; Fang, Z., Smith, R., Jr., Qi, X., Eds.; Springer: Dordrecht, The Netherlands, 2015; Volume 5, pp. 3–40. [Google Scholar] [CrossRef]
  52. Komolwanich, T.; Tatijarern, P.; Prasertwasu, S.; Khumsupan, D.; Chaisuwan, T.; Luengnaruemitchai, A.; Wongkasemjit, S. Comparative potentiality of Kans grass (Saccharum spontaneum) and Giant reed (Arundo donax) as lignocellulosic feedstocks for the release of monomeric sugars by microwave/chemical pretreatment. Cellulose 2014, 21, 1327–1340. [Google Scholar] [CrossRef]
  53. Scordia, D.; Cosentino, S.L.; Lee, J.W.; Jeffries, T.W. Dilute oxalic acid pretreatment for biorefining giant reed (Arundo donax L.). Biomass Bioenergy 2011, 35, 3018–3024. [Google Scholar] [CrossRef]
  54. Torrado, I.; Bandeira, F.; Shatalov, A.A.; Carvalheiro, F.; Duarte, L.C. The impact of particle size on the dilute acid hydrolysis of giant reed biomass. Electron. J. Energy Environ. 2014, 2, 9–17. [Google Scholar]
  55. Davidek, T.; Gouezec, E.; Devaud, S.; Blank, I. Origin and yields of acetic acid in pentose-based Maillard reaction systems. Ann. N. Y. Acad. Sci. 2008, 1126, 241–243. [Google Scholar] [CrossRef] [Green Version]
  56. Shatalov, A.A.; Morais, A.R.C.; Duarte, L.C.; Carvalheiro, F. Selective single-stage xylan-to-xylose hydrolysis and its effect on enzymatic digestibility of energy crops giant reed and cardoon for bioethanol production. Ind. Crops Prod. 2017, 95, 104–112. [Google Scholar] [CrossRef]
  57. Scordia, D.; Cosentino, S.L.; Lee, J.W.; Jeffries, T.W. Bioconversion of giant reed (Arundo donax L.) hemicellulose hydrolysate to ethanol by Scheffersomyces stipitis CBS6054. Biomass Bioenergy 2012, 39, 296–305. [Google Scholar] [CrossRef]
  58. Mars, A.E.; Veuskens, T.; Budde, M.A.W.; van Doeveren, P.F.N.M.; Lips, S.J.; Bakker, R.R.; de Vrije, T.; Claassen, P.A.M. Biohydrogen production from untreated and hydrolyzed potato steam peels by the extreme thermophiles Caldicellulosiruptor saccharolyticus and Thermotoga neapolitana. Int. J. Hydrogen Energy 2010, 35, 7730–7737. [Google Scholar] [CrossRef]
  59. Cao, G.; Ren, N.; Wang, A.; Lee, D.-J.; Guo, W.; Liu, B.; Feng, Y.; Zhao, Q. Acid hydrolysis of corn stover for biohydrogen production using Thermoanaerobacterium thermosaccharolyticum W16. Int. J. Hydrogen Energy 2009, 34, 7182–7188. [Google Scholar] [CrossRef]
  60. Singh, N.; Sarma, S. Biological routes of hydrogen production: A critical assessment. In Handbook of Biofuels, 1st ed.; Sahay, S., Ed.; Academic Press: London, UK, 2022; Volume 1, pp. 419–434. [Google Scholar] [CrossRef]
  61. De Vrieze, J.; Hennebel, T.; Boon, N.; Verstraete, W. Methanosarcina: The rediscovered methanogen for heavy duty biomethanation. Bioresour. Technol. 2012, 112, 1–9. [Google Scholar] [CrossRef] [PubMed]
  62. Du, Y.; Zou, W.; Zhang, K.; Ye, G.; Yang, J. Advances and applications of Clostridium co-culture systems in biotechnology. Front. Microbiol. 2020, 11, 560223. [Google Scholar] [CrossRef] [PubMed]
  63. Lee, Y.J.; Miyahara, T.; Noike, T. Effect of pH on microbial hydrogen fermentation. J. Chem. Technol. Biotechnol. 2002, 77, 694–698. [Google Scholar] [CrossRef]
  64. Nissilä, M.E.; Lay, C.H.; Puhakka, J.A. Dark fermentative hydrogen production from lignocellulosic hydrolyzates—A review. Biomass Bioenergy 2014, 67, 145–159. [Google Scholar] [CrossRef]
  65. Cieciura-Włoch, W.; Borowski, S.; Domański, J. Dark fermentative hydrogen production from hydrolyzed sugar beet pulp improved by iron addition. Bioresour Technol. 2020, 314, 123713. [Google Scholar] [CrossRef]
  66. Khanal, S.K.; Chen, W.H.; Li, L.; Sung, S. Biological hydrogen production: Effects of pH and intermediate products. Int. J. Hydrogen Energy 2004, 29, 1123–1131. [Google Scholar] [CrossRef]
  67. Sarkar, O.; Rova, U.; Christakopoulos, P.; Matsakas, L. Influence of initial uncontrolled pH on acidogenic fermentation of brewery spent grains to biohydrogen and volatile fatty acids production: Optimization and scale-up. Bioresour. Technol. 2021, 319, 124233. [Google Scholar] [CrossRef]
  68. Grzelak, J.; Œlêzak, R.; Krzystek, L.; Ledakowicz, S. Effect of pH on the production of volatile fatty acids in dark fermentation process of organic waste. Ecol. Chem. Eng. 2018, 25, 295. [Google Scholar] [CrossRef] [Green Version]
  69. de Vrije, T.; Bakker, R.R.; Budde, M.A.W.; Lai, M.H.; Mars, A.E.; Claassen, P.A.M. Efficient hydrogen production from the lignocellulosic energy crop Miscanthus by the extreme thermophilic bacteria Caldicellulosiruptor saccharolyticus and Thermotoga neapolitana. Biotechnol. Biofuels 2009, 2, 12. [Google Scholar] [CrossRef] [Green Version]
  70. Pradhan, N.; Dipasquale, L.; d’Ippolito, G.; Panico, A.; Lens, P.N.; Esposito, G.; Fontana, A. Hydrogen production by the thermophilic bacterium Thermotoga neapolitana. Int. J. Mol. Sci. 2015, 16, 12578–12600. [Google Scholar] [CrossRef] [PubMed] [Green Version]
Figure 1. Workflow of the giant reed meal treatment steps, from alkaline pre-treatment to enzymatic hydrolysis. The amounts of the recovered fractions of interest are reported on a dry weight (DW) basis.
Energies 15 04876 g001
Figure 2. Measurements of the cumulative H2 production per gram of volatile solids during dark fermentation of differently prepared giant reed hydrolysates: Not-adj (not adjusted initial pH 5.3, pink squares); NaOH-adj (NaOH-adjusted initial pH 8.7, blue triangles); Liq-adj (black liquor-adjusted initial pH 8.7, orange diamonds); C (not treated and not hydrolyzed giant reed control, NaOH-adjusted initial pH 8.7, green circles). The downward vertical arrow indicates the time of pH resetting of all reactors to their initial value with NaOH or black liquor depending on the treatment. Vertical bars represent the standard deviation (n = 3).
Energies 15 04876 g002
Figure 3. Daily rate of H2 accumulation (R) in dark fermentation of differently prepared giant reed hydrolysates, i.e., Not-adj (not adjusted initial pH 5.3, pink squares); NaOH-adj (NaOH-adjusted initial pH 8.7, blue triangles); Liq-adj (black liquor-adjusted initial pH 8.7, orange diamonds); C represents the not treated and not hydrolyzed giant reed (control, NaOH adjusted pH 8.7, green circles): (a) Daily rate of H2 accumulation per g VS; (b) Daily rate of H2 accumulation per mole of hexose. The downward vertical arrow indicates the time of pH resetting of all reactors to their initial value with NaOH or black liquor depending on the treatment. Vertical bars represent the standard deviation (n = 3).
Energies 15 04876 g003
Figure 4. Cumulated H2 production per mole of hexose from giant reed hydrolysates with different initial pH.; Liq-adj: black liquor-adjusted initial pH 8.7; NaOH-adj: NaOH-adjusted initial pH 8.7; Not-adj: not adjusted initial pH 5.3; Means with different letters differ significantly at p < 0.05 according to Tukey’s Honestly Significant Difference test.
Energies 15 04876 g004
Table 1. Composition of the materials utilised in dark fermentation.
TraitGiant Reed MealHydrolysate SupernatantBlack LiquorInoculum
Total solids (TS), %98.21 (0.4)6.03 (0.02)6.43 (0.02)6.33 (0.30)
Volatile solids (VS), %92.90 (0.2)5.04 (0.02)3.22 (0.03)4.02 (0.02)
Volatile solids, % TS95845064
Ash, %5.31 (0.23)0.99 (0.01)3.21 (0.02)2.31 (0.29)
pH5.80 (0.02)5.32 (0.01)11.12 (0.01)7.60 (0.01)
Cellulose, % TS39.11 (0.3)n.d.2.38 (0.11)3.62 (0.85)
Hemicellulose, % TS23.14 (0.3)n.d.n.d.0.66 (0.07)
Lignin, % TS11.67 (0.1)n.d.4.16 (0.08)3.78 (0.89)
Acetic acid, g L−1n.d.n.d.10.48 (0.3)0.43 (0.02)
Total polyphenols, % TS0.05 (0.02)n.d.21.77 (0.2)n.d.
Reducing sugars, g L−1n.d.50.35 (0.2)tracen.d.
n.d.: not detected.
Table 2. Two-cycle dark fermentation parameters of the hydrogen production from giant reed hydrolysates in comparison with not treated and not hydrolyzed control.
Dark Fermentation Parameter 2
Treatment 1Initial pHTotal VS
Added
Reducing SugarsCumulated H2Max Rate1Max Rate2Day 7
pH
H2
MAX1 conc.
H2 MAX2
conc.
Final pH
g/Reactorg/ReactormL H2 STP g−1 VSmL H2 STP d−1 g−1
VS
mL H2 STP d−1 g−1 VS %%
Liq-Adj8.71.91.5199 b 356 a43 b4.6 a58 a48 a4.5 a
NaOH-Adj8.71.51.5237 a45 b52 a4.4 a55 a50 a4.6 a
Not-Adj5.31.51.5174 c55 a27 c4.5 a53 a49 a4.7 a
C8.71.5trace2 d1 c0 d7.2 b10 b0 b7.2 b
1 Liq-adj: hydrolysate with black liquor-adjusted initial pH (8.7); NaOH-adj: hydrolysate with NaOH-adjusted initial pH (8.7); Not-adj: hydrolysate with not adjusted initial pH (5.3); C: not treated and not hydrolyzed control, NaOH adjusted initial pH (8.7). 2 Total VS added: volatile solids in first + second cycle; Cumulated H2: cumulated H2 production per gram of volatile solids at the end of the dark fermentation; max Rate1, max Rate2: maximum measured daily rate of H2 production per gram of volatile solids during the first or second cycle of dark fermentation; pH before resetting: at the end of the first cycle of dark fermentation; %H2 MAX1, %H2 MAX2: maximum content of H2 in the biogas during the first or second cycle of dark fermentation. 3 Means sharing common letters are not significantly different at p = 0.05 according to Tukey’s Honestly Significant Difference test.
Publisher’s Note: MDPI stays neutral with regard to jurisdictional claims in published maps and institutional affiliations.

