Article

Numerical Investigation of Flow and Heat Transfer in Rectangular Microchannels with and without Semi-Elliptical Protrusions

1
College of Power and Energy Engineering, Harbin Engineering University, Harbin 150001, China
2
Institute of Fluid Mechanics, Karlsruhe Institute of Technology, Kaiserstra ße 10, Bldg. 10.23., 76131 Karlsruhe, Germany
*
Author to whom correspondence should be addressed.
Energies 2022, 15(13), 4927; https://doi.org/10.3390/en15134927
Submission received: 17 April 2022 / Revised: 18 June 2022 / Accepted: 28 June 2022 / Published: 5 July 2022
(This article belongs to the Special Issue New Insights of Gas Turbine Cooling Systems)

Abstract

:
Micro-cooling is a growing trend in the field of turbine blade cooling. Technical difficulties in the experiments of large-aspect-ratio rectangular microchannels that are commonly used in the turbine blades cause the rareness of related literature. In this study, the flow characteristics and heat transfer performance of the microchannels with and without semi-ellipsoidal protrusions, whose height is 0.6 mm and width is 9 mm, are numerically investigated. In the microchannel without protrusions, when 2214 < Re < 3589, the velocity has a Λ-shaped distribution, resulting in a Λ-shaped Nu distribution on the wall. When Re > 3760, it is worth noting that from the sidewall to the middle of the channel, Nu first decreases and then increases. In the microchannel with protrusions, when Re < 1214, the turbulence formed by the protrusion is almost all behind it and does not spread to both sides. When 1214 < Re < 2374, the turbulence caused by the protrusions gradually spreads to the middle and both sides of the channel with the increase in Re. When 2374 < Re < 3815, the turbulence caused by two columns of protrusions meet in the middle of the channel and forms stronger turbulence downstream. When Re > 3815, the flow is all turbulent. The protrusions enhance the irreversibility of heat transfer and friction. The performance evaluation criteria (PEC) increases first and then decreases with Re and the maximum value is 1.80 at Re = 2004. In this work, the details that are difficult to obtain in experiments are fully analyzed to provide suggestions for the design of micro-cooling structures in gas turbine blades.

1. Introduction

The research craze for microchannels began in the 1980s due to the cooling requirements of integrated circuits (IC). In 1981, Tuckerman and Pease [1] built the first microchannel heatsink and proved its huge potential for IC cooling. There is no strict limit on the size of the microchannel [2,3,4], and the rules of division may change in the future [3]. Celata [4] considered that a channel with a hydraulic diameter of 0.1 mm to 1 mm can be considered as a microchannel. Microchannels with a hydraulic diameter of about 1 mm can be used as the cooling channels inside the turbine blades. In recent years, the cooling of gas turbines has been developing from macro- to micro-cooling. The micro-cooling in turbine blades is mostly performed by the rectangular microchannels, which typically occur in turbine blades along with impingement cooling or film cooling, as shown in Figure 1, or as independent channels close to the wall [5]. The application of rectangular microchannels on the turbine blades started late, but due to the simple and easy fabrication of rectangular microchannels, there are many related studies. However, the conclusions reached by some scholars are inconsistent.
Peng et al. [6,7] experimentally studied the flow and heat transfer characteristics of rectangular microchannels with a hydraulic diameter of 0.133–0.367 mm. It was found that as the hydraulic diameter of the channel becomes smaller, the critical Reynolds number for the transition from laminar flow to turbulent flow becomes smaller, and the Reynolds number interval (transition zone) from laminar flow to fully turbulent flow becomes smaller. In addition, the laws of friction factor and Nusselt number in laminar and turbulent regions are different from the traditional formulas. Popescu et al. [8] studied the flow and heat transfer of the working fluid, R124, in rectangular microchannels with a height of 10 mm and a width of 128 μm, 263 μm, and 521 μm. It was found that when the aspect ratio is greater than 80:1, the experimental results are quite different from the predicted results, and the experimental value of the local Nusselt number is about 25% lower than the predicted value. Zhang et al. [9] studied the microchannels with a hydraulic diameter of 0.48 to 0.88 mm and a roughness of 0.29% to 1.06%. The experimental results showed that the critical Reynolds number is between 1200 and 1600, but there is no clear evidence that the critical Reynolds number is directly related to the aspect ratio. As for the friction factor, the entrance effect has obvious influence on it, but the roughness has little influence on it. The fully developed laminar and turbulent friction factor laws are consistent with the traditional theory. Moreover, the roughness and inlet effect both increase the Nusselt number. Gao et al. [10] studied the flow and heat transfer in silicon microchannels with a width of 25 mm and a height of 0.1 to 1 μm, with a roughness of less than 0.1 μm. The resistance characteristics obtained by the experiment are the same as the traditional theory, and the critical Reynolds number is in the range of 3500 to 4000. However, in terms of heat transfer, they reached a different conclusion from the traditional theory. They put forward one of the possible reasons for this situation: when the height and width are relatively large, the use of hydraulic diameter as the characteristic length may not be accurate.
However, many studies [11,12,13] have shown that the traditional theories can accurately predict the flow and heat transfer in microchannels. Lee et al. [14] compared the experimental and numerical results of rectangular microchannels with hydraulic diameters of 318 to 903 μm. The results showed that the traditional empirical correlations and theories can effectively predict the flow and heat transfer in the microchannel. In addition, they proposed that the inlet conditions of the microchannel experiments are complicated, and the inaccurate setup of boundary conditions may be the reason why the traditional theories fail to predict the results of the experiment. Liu and Garimella [15] accurately measured the resistance at the entrance and exit of the microchannel in the experiment. The experimental results are consistent with the numerical simulations, and the critical Reynolds number is about 2000.
Xu et al. [16] studied the flow characteristics of water in silicon and aluminum microchannels. The aluminum microchannels are machined using mechanical methods, and glue is used to connect their cover plates. The silicon channel is manufactured using an etching method with higher precision. The results show that the Po value in the silicon channel is almost the same as the traditional theoretical value, while the Po value in the aluminum channel is smaller than the theoretical value. The difference between the Po values in the two channels increases as the hydraulic diameter decreases. It can be concluded that the influence of manufacturing errors in the microchannel cannot be ignored. Morini [17] and Rosa et al. [18] reviewed the literature related to the microchannels. In addition to the accuracy of measurement and manufacturing, the scaling effects (entrance effects, conjugate heat transfer, viscous heating, electric double layer (EDL) effects, temperature-dependent properties, surface roughness, rarefaction, and compressibility effects), which are often negligible at the macroscopic scale, may have significant impacts on the microflow. They pointed out that the traditional theories and correlations can properly describe microchannels. Moreover, some design suggestions are given. When the scaling effect is negligible, the correlation in the macrochannel can accurately predict the microflow behavior. When the scaling effect is not negligible, the suitable numerical simulations may be the sole alternative to the carefully designed experiments to evaluate the heat transfer rates.
Mokrani et al. [19] precisely designed an experimental scheme for measuring the flow and heat transfer of water in the microchannel with a large aspect ratio. Combined with numerical simulation, the inlet and outlet sections, as well as the placement of heating rods, were carefully designed. In addition, structures such as heat preservation were also designed to avoid sources of error. The paper claimed that this experiment has high accuracy. The results showed that the conventional formulas and correlations that describe the flow and heat transfer in a macrochannel can be directly applied to a microchannel with a height between 50 μm and 500 μm, and the critical Reynolds number is also similar.
It is known from the above that when ignoring the scaling effects, the law of flow and heat transfer in the microchannel can be explained using traditional theories, and reliable results can be given through the computational fluid dynamics (CFD) method [15,18,19,20,21,22,23]. However, a microchannel that completely avoids the entrance effect requires a very long entrance section [18], which is even larger than the microchannel and not often used in practical applications. In addition, the form of the entrance will also affect the flow in the channel [24,25,26]. For example, a channel with a smooth entrance will obtain a larger critical Reynolds number than an abrupt entrance [26]. Therefore, it is of practical significance to study the flow and heat transfer in microchannels with various inlet and outlet sections.
In general, adding spoilers in the microchannels is a commonly used method to enhance heat transfer. Spherical dimples and protrusions have attracted wide attention due to their excellent performance in resistance control. The heat exchangers with dimples have been studied extensively [27,28,29,30,31,32,33,34,35], and their flow structure and heat transfer performance have been deeply analyzed. There are also many studies involving the combination of dimples and protrusions [36,37,38]. Additionally, there is evidence [38] that the combination of dimples and protrusions has better comprehensive heat transfer performance than the dimples only in some cases. Xie et al. [39] studied the flow and heat transfer in a rectangular channel with teardrop dimple/protrusion, and the results showed that the channel with teardrop dimple/protrusion had good heat transfer performance when the Reynolds number was 3000. Few researchers have conducted flow and heat transfer studies on the microchannels with semi-ellipsoidal protrusions.
Turbine blade double-wall cooling tends to use narrow microchannels [40]. However, the common spherical protrusion can only exist in a small volume in the rectangular microchannels with large aspect ratio. When the depth is the same as that of the spherical protrusion, the semi-ellipsoidal protrusion takes up a larger volume and enhances the disturbance. Therefore, this paper studies the flow and heat transfer of microchannels with or without semi-ellipsoidal protrusions with inlet and outlet sections. Emphasis is placed on the analysis of flow structure and heat transfer performance and the connection between them. In addition, turbine blades using water as a coolant are already in the experimental stage and are highly anticipated [41]. Microchannel cooling structures are promising for water-cooled blades. In this work, incompressible water is chosen as the coolant for the generalizability of the conclusions. This work provides reference and theoretical support for the design of microcooled turbine blades.

2. Numerical Method

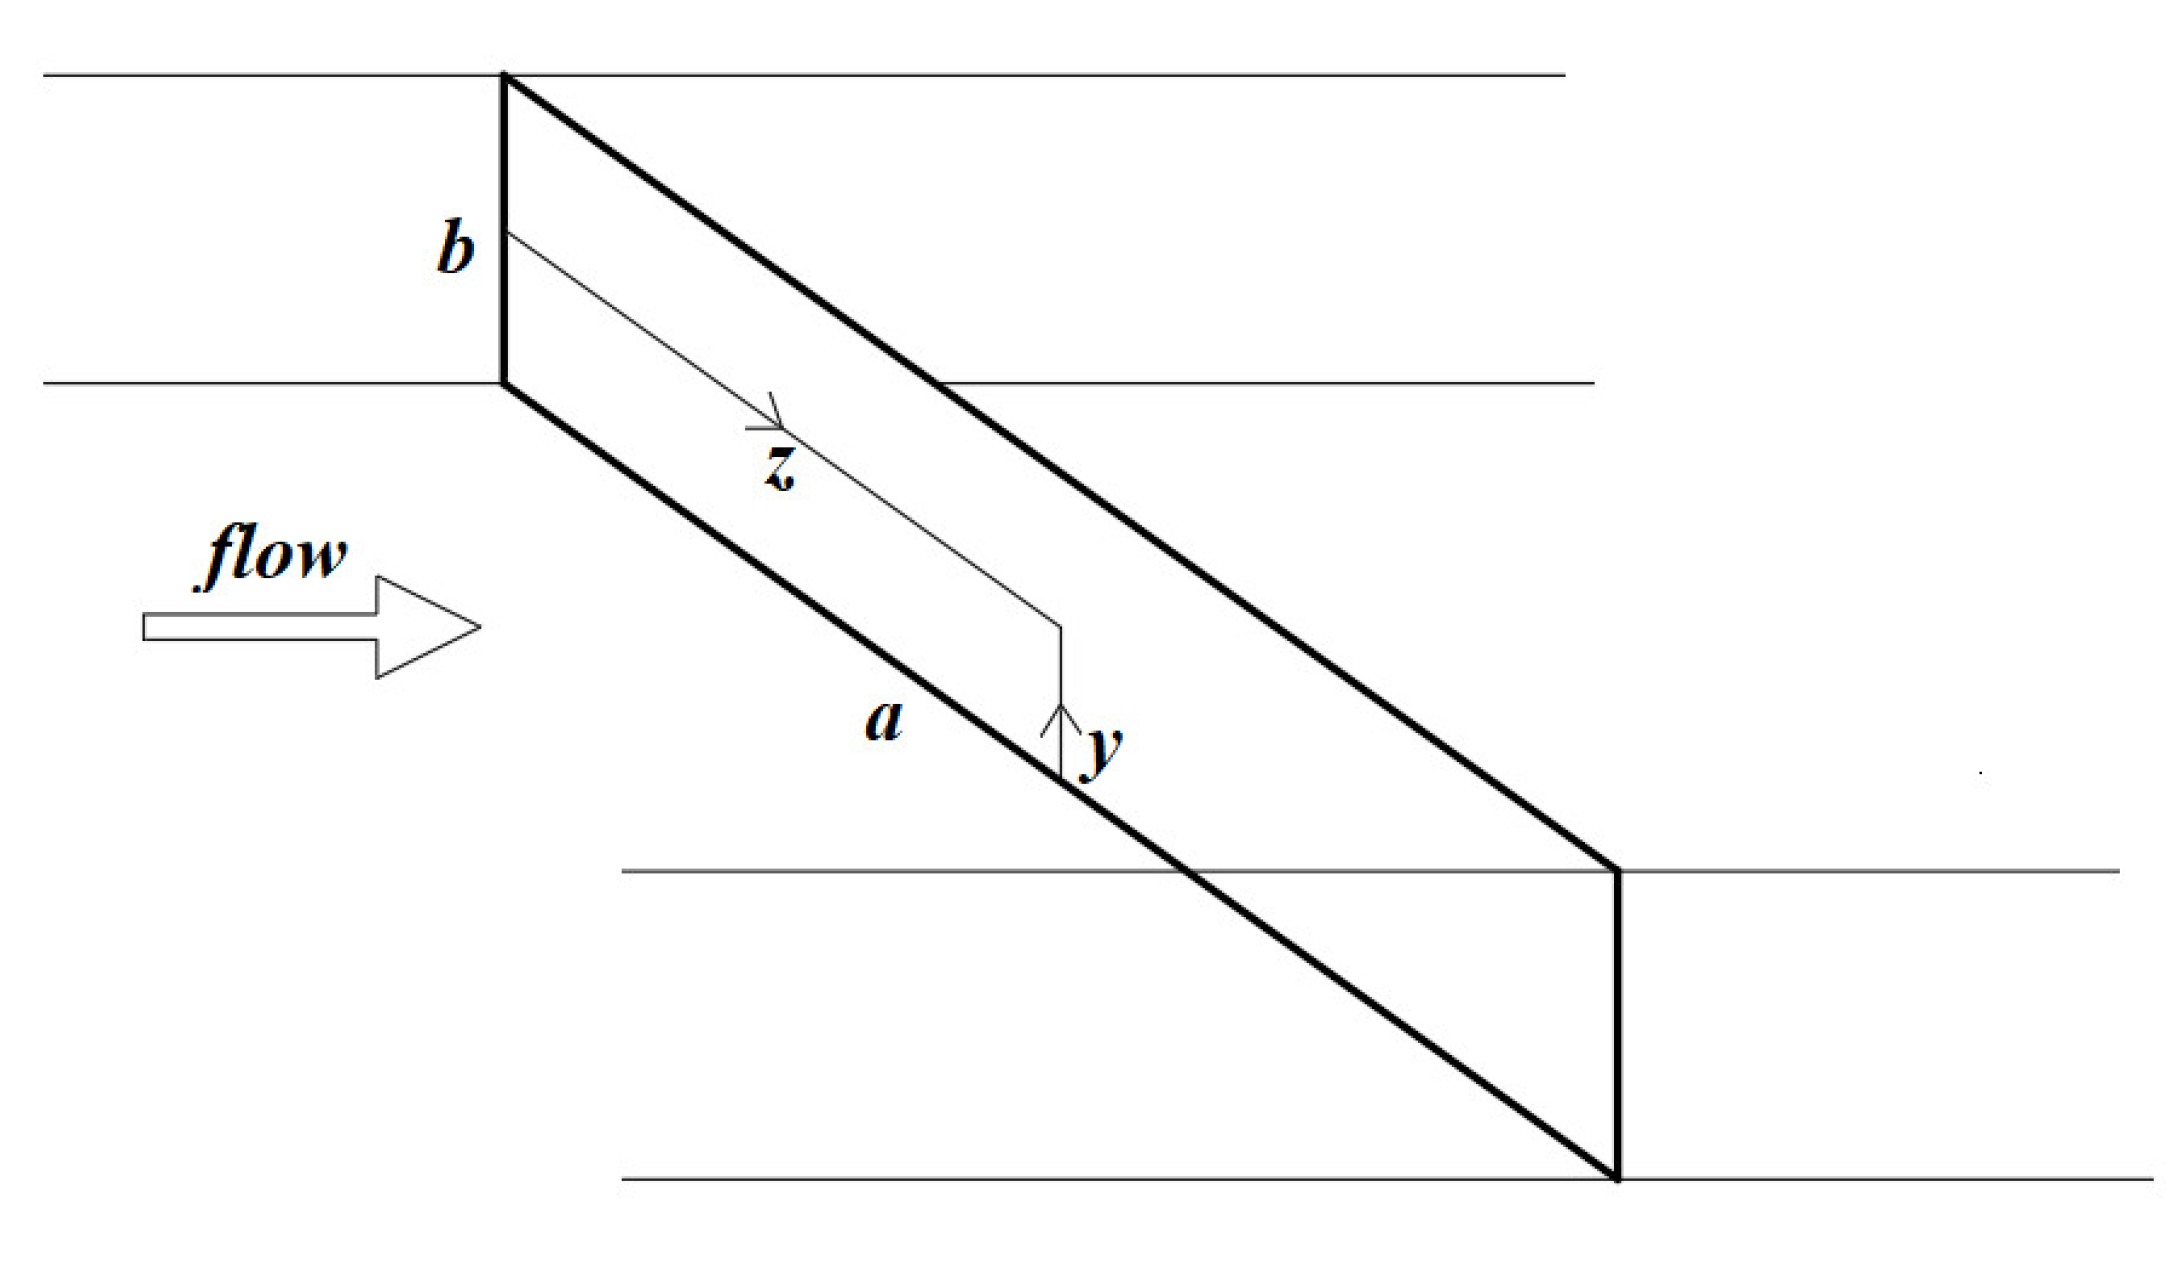
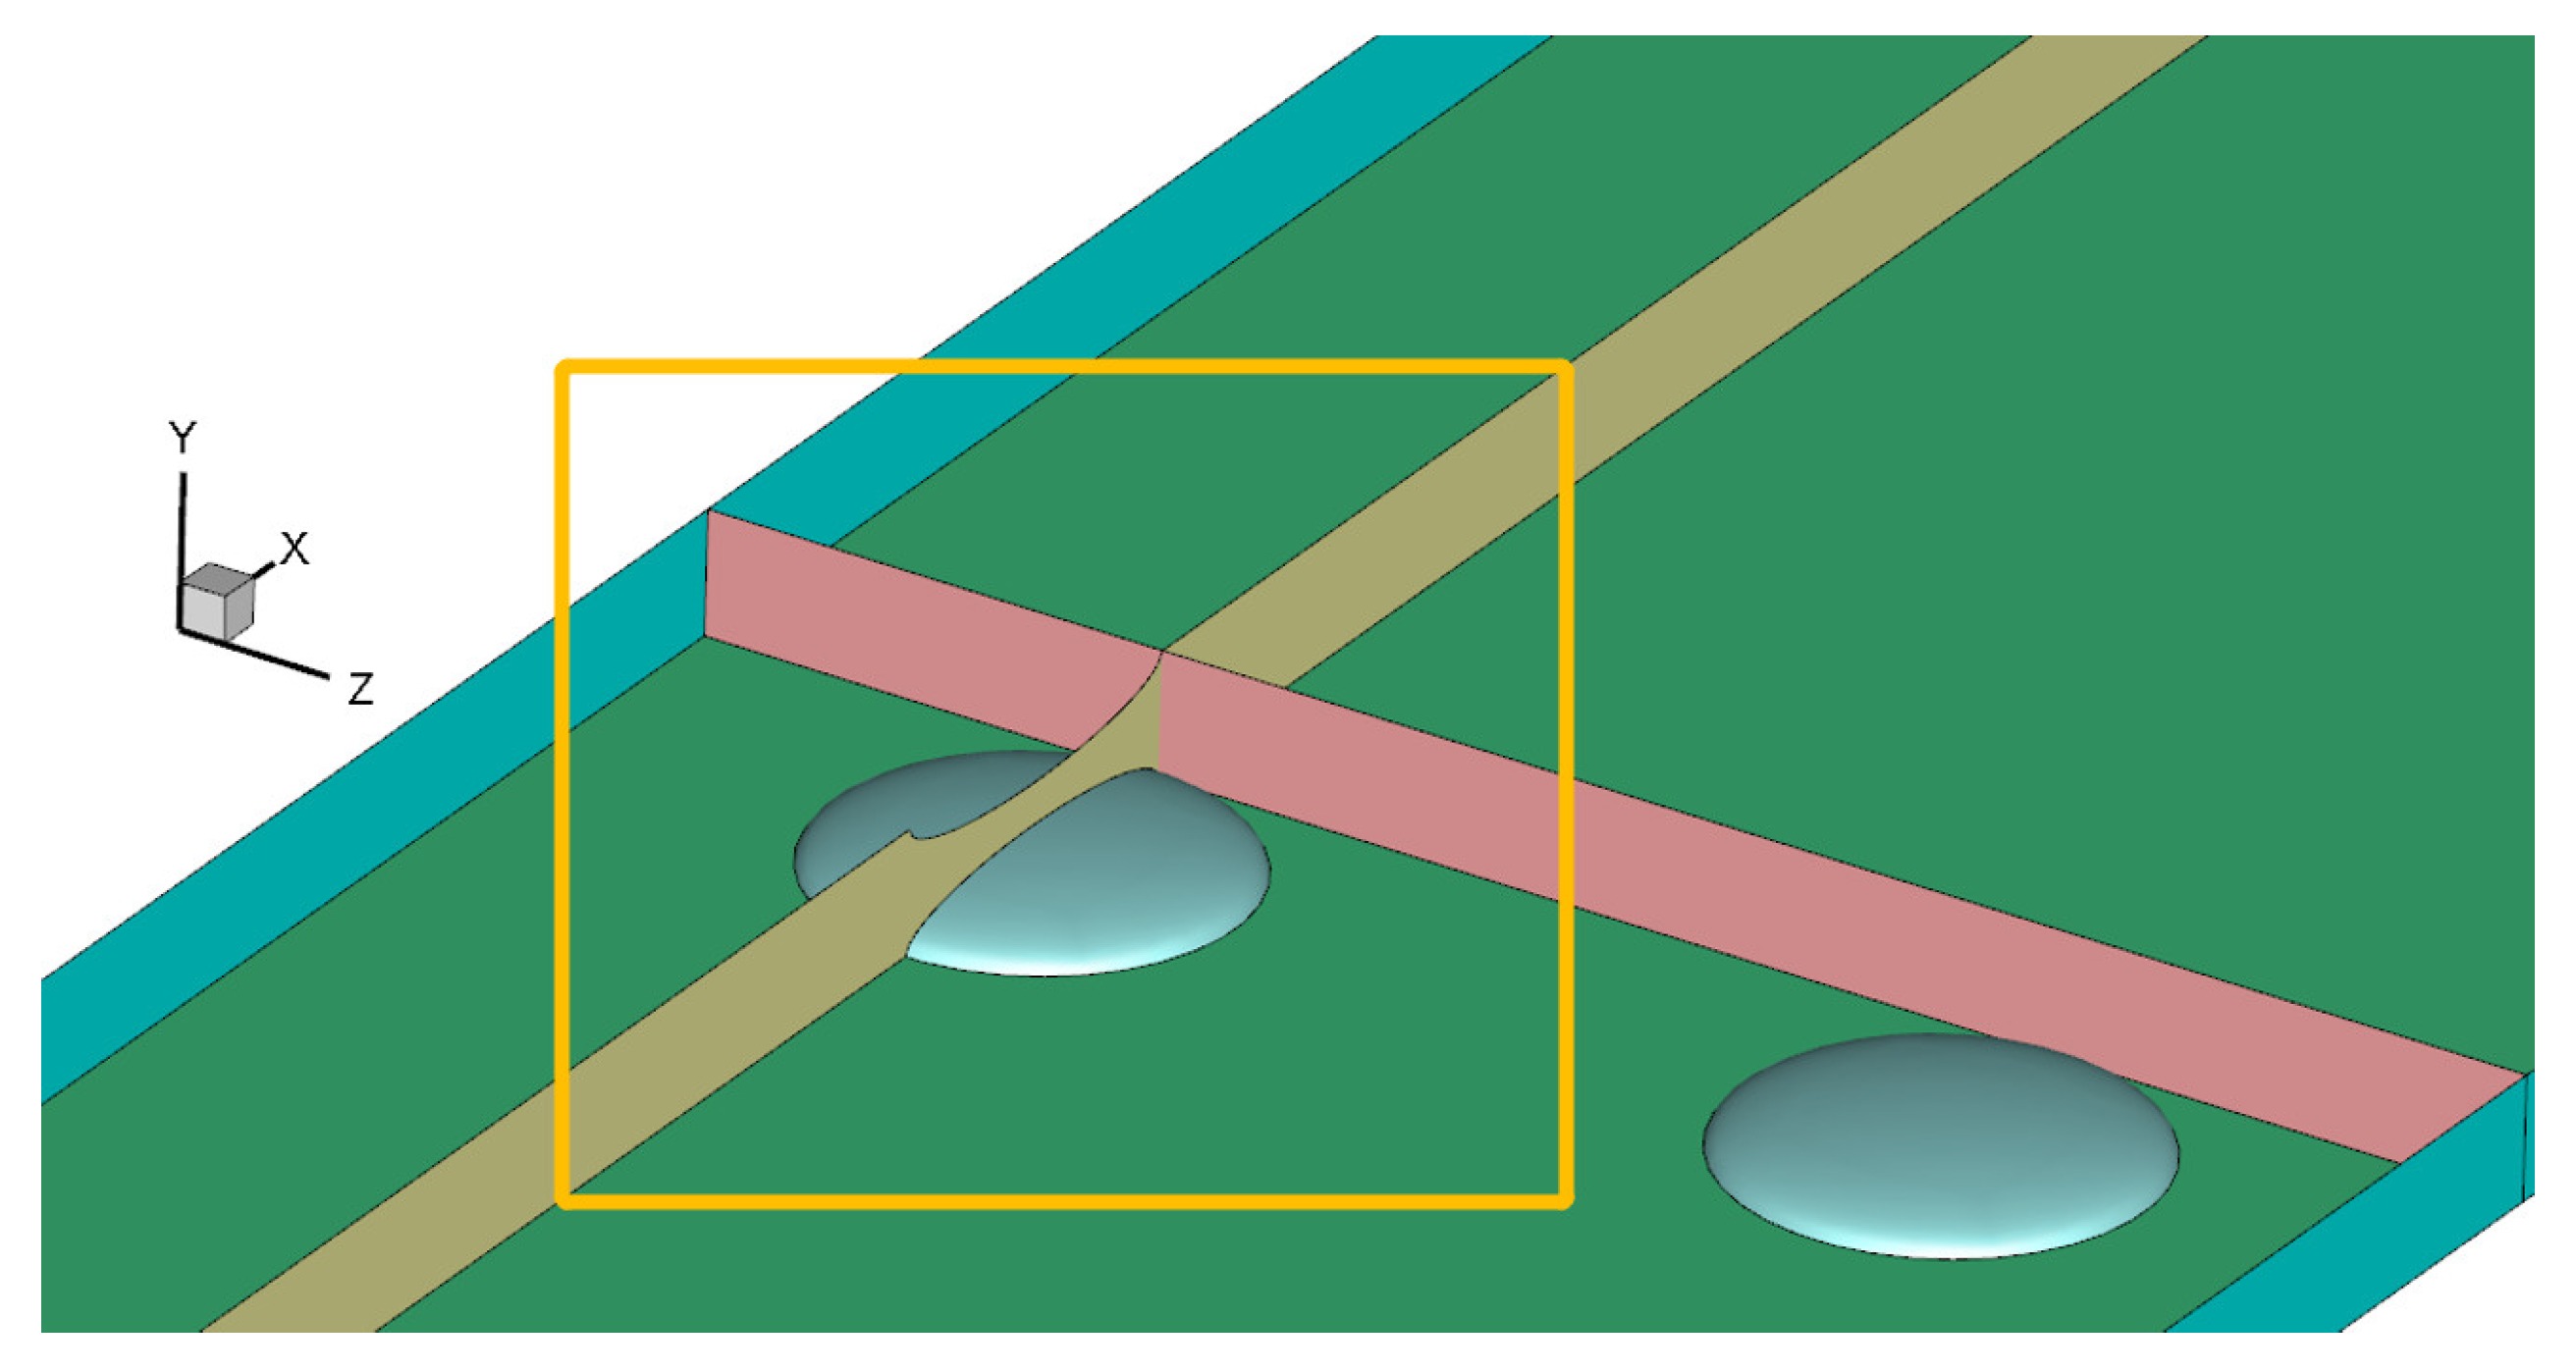
2.1. Physical Model and Boundary Conditions

The microchannel without semi-ellipsoidal protrusions in this study is shown in Figure 2. The dimensions of microchannel are height a = 9 mm, width b = 0.6 mm, and length L = 120 mm. This smooth microchannel is called as the test section in the following sections.
The microchannel with semi-ellipsoidal protrusions has the same size as the microchannel without semi-ellipsoidal protrusions, except that there are symmetrical protrusions on the primary walls and each wall contains two columns of protrusions with each column containing 10 protrusions. In addition, the microchannels with and without semi-ellipsoidal protrusions have extensive inlet and outlet sections as shown in Figure 3. The microchannel without semi-ellipsoidal protrusions is called smooth channel, and the microchannel with semi-ellipsoidal protrusions is called roughened channel. Additionally, the detailed geometric dimensions of the channel with semi-ellipsoidal protrusions are shown in Figure 4. It is worth noting that the semi-ellipsoidal protrusion shows a circle with a diameter of 2 mm (D) on the X-Z plane, and shows a semi-ellipse with a semi-major axis of 1 mm (D/2) and a semi-minor axis of 0.2 mm (h) on the X-Y plane.
The walls of the test section have a uniform and constant temperature at 343 K, and the walls of the inlet section and the outlet section are adiabatic. No-slip boundary condition is employed on all walls. The ambient pressure is 101,325 Pa, the gauge pressure at the outlet is set to 0, and the working condition is adjusted by changing the total pressure at the inlet. Additionally, the maximum average velocity of the inlet is less than 7.25 m/s. In microchannels, the pressure gradient along the flow direction is large, and it is difficult to increase the velocity to a higher level in practical applications. In addition, turbulent flow has been included in the research range (Re < 8128), and the flow and heat transfer law at higher Reynolds numbers can be inferred from the results.
The working fluid, water, flows into the domain along the positive X direction with a bulk temperature of 293 K, under which it has stable density ρ = 998.2 kg/m3, kinematic viscosity ν = 1.003 × 10⁻⁶ m/s2, specific heat Cp = 4182 J/(kg·K) and thermal conductivity λ = 0.6 W/(m·K). In turbine blades or other engineering applications, the flow in microchannels is usually moderately or strongly turbulent. The incoming flow was set with 5% turbulence and a turbulent viscosity ratio of 10, which is a common choice in engineering.

2.2. Data Reduction

The parameters for evaluating flow and heat transfer in the article are defined below. The hydraulic diameter is defined as:
D h = 4 a b 2 ( a + b )
α = b / a
where α is the aspect ratio, 0 < α < 1. The Reynolds number (Re) is defined as:
R e = u in D h v
where uin is the average velocity of the inlet, v is the kinematic viscosity. The local convective heat transfer coefficient is defined as:
h x = λ T n x T w T m
where n indicates the normal direction of the channel wall. Tw is the local wall temperature. Tm is mean temperature, calculated by
T m = V C ρ x V x T x d V C V C ρ x V x d V C
where VC represents the control body. The local Nusselt number is defined as:
N u x = h x D h λ
The average Nusselt number is defined as:
N u = 1 A A N u x d A
where A is the surface of the test section. The friction factor is defined as:
f = Δ P 0.5 ρ u in 2 D h 4 L
where ΔP is the total pressure difference between the inlet and outlet. The performance evaluation criteria (PEC) is defined as:
PEC = N u / N u 0 f / f 0 1 3
where f0 and Nu0 are the friction factor and Nusselt number of the smooth channel. Since the resistance and heat transfer must be considered comprehensively when designing the heat exchangers, PEC is proposed to measure the comprehensive performance.
The local volumetric entropy generation rates ( S g ), accounting for the thermal and friction effects, are, respectively, calculated by [42]:
S g , t h e r m a l = λ + λ t T 2 T x 2 + T y 2 + T z 2
S g , v i s c o u s = μ + μ t T 2 u x 2 + v y 2 + w z 2 + u y + v x 2 + u z + w x 2 + w y + v z 2
where u, v, and w are the velocity components in x, y, and z directions, respectively. μt and λt are the turbulent viscosity (eddy viscosity) and the thermal conductivity, respectively. These parameters are defined by the following equations:
μ t = ρ C μ k 2 ε
λ t = C p μ t Pr t
where C μ = 0.09 .
Local volumetric entropy generation rates can be dimensionless by using the following expression:
N g = S g D h 2 λ
Finally, the nondimensional form of the entropy generation rate per unit depth is calculated by
N = 1 V C V C N g d V C

2.3. Method Validation

There are various rules for the division of microscales [2,3,4]. This work is called microscale and is not divided according to the continuity of the fluid. Although multiscale computational fluid dynamics needs to consider a variety of processing methods, the Navier–Stokes equations can well handle the content that this work wants to discuss [43].
As a steady numerical method, RANS is more convenient and consumes fewer computation resources than other methods. The numerical simulation software ANSYS Fluent 2021R1 is used to accomplish the steady solution. The SIMPLEC (semi-implicit method for pressure-linked equations consistent) algorithm is applied. In this work, the incompressible flow is assumed to be three-dimensional, and gravitational and viscous thermal effects are ignored. The transport equation [42] can be simplified to the following form:
Continuity equation:
u ¯ i x i = 0
Momentum equation:
ρ u ¯ j u ¯ i x j = p ¯ x i + x j μ u ¯ i x j ρ u i u j ¯
Energy equation:
x i ρ u i T ¯ = x i μ Pr + μ t Pr t T ¯ x i
In order to further verify the applicability of laminar and Reynolds stress model (RSM, linear pressure–strain, enhanced wall treatment), the f of the smooth channel shown in Figure 3 with 90 mm inlet and outlet sections was evaluated. Moreover, the selected entrance section does not completely avoid the influence of the entrance. The f is plotted as the function of Re in Figure 5, together with the Shah and London [44]’s correlation for a fully developed laminar flow in rectangular channels,
f = 96 Re 1 1.3553 α + 1.9467 α 2 1.7012 α 3 + 0.9564 α 4 0.2537 α 5
and the correlation given by Kandlikar [25] for the developing turbulent flow is,
f = 0.3716 + 4.06448 L / D h Re * 0.268 0.3293 L / D h
Re * = Re 2 3 + 11 24 α 2 α
where Re* is defined as the laminar-equivalent Reynolds number.
It is shown in Figure 5 that the results obtained by laminar are consistent with Shah and London [44]. It shows that the friction factor of the laminar flow passing through the inlet section is very close to the fully developed laminar flow. In the turbulent region, the friction factor law obtained by RSM is consistent with Kandlikar [25]. Since the turbulence is not fully developed, the calculation results of RSM are reliable. For the roughened channel, there are usually vortices around the protrusions [36,37,38,39,40], and RSM has a stronger advantage than other turbulence models of the RANS method in calculating vortices.
Since the flow state contains transition regions, it is necessary to verify the applicability of the transition model. The viscosity models we use include: k-ω SST (with intermittency transition model), transition k-kl-ω and transition SST. Cioncolini and Santini [45]’s experiment is used as the standard examples. A circular channel with a length of 1.2 m and a radius of 2 mm is used. In order to minimize the influence of the entrance effect, we only count the results that are more than 150 times the diameter from the entrance, that is, the results that are between 0.6 m and 1.2 m from the entrance. To save computational resources, a quarter channel with two symmetrical boundaries is simulated. The y+ near the wall is less than 1, the grid growth rate is less than 1.15, and the number of grids verified by grid independence is 3,450,000. The working fluid is water, which has a uniform velocity distribution at the inlet.
We compare f as a function of Re with the experimental data [45] in Figure 6. In addition, it is also compared with the correlation for a fully developed laminar flow,
f = 64 Re
and the correlation given by Gnielinski [46] for a fully developed turbulent flow.
f = 1 1.82 ln ( Re ) 1.64 2
For the smooth channel, the incoming flow state and wall roughness will affect the flow characteristics in the transition region and the critical Reynolds number. According to Ref. [26], when the aspect ratio of the rectangular channel is 0.1, the critical Reynolds numbers obtained by the smooth entrance and the abrupt entrance are 4400 and 2920. Gao’s [10] experiment has a smooth entrance, and the critical Reynolds number is in the range of 3500 to 4000. Many studies have reported lower critical Reynolds numbers [6,7,9,15]. Ref. [9] reports experimental data in a rectangular channel with an aspect ratio of 0.83. The transition Reynolds number is 1200, a transition peak appears, and the f in the turbulent region is closer to the law of the developing turbulent flow, which is slightly larger than that of the fully developed turbulent flow.
As shown in Figure 6, the critical Reynolds number and f in the turbulent region obtained by k-ω SST are relatively small for the incoming flow of uniform velocity and 5% turbulence intensity, and the results obtained by transition SST are far from the experimental law [45]. The critical Reynolds number obtained by transition k-kl-ω is slightly smaller than that of the experiment [45], and a transition peak appears. The f obtained by transition k-kl-ω is slightly larger than the fully developed turbulent law [46] and is very close to that obtained by RSM at Re about 3647. When the Reynolds number is greater than 2000 and less than 3700, the f law obtained by transition k-kl-ω can be trusted.
To sum up, for the smooth channel, the results obtained by laminar are used when Re < 2000, the results obtained by transition SST are used when 2000 < Re < 3700, and the results obtained by RSM are used when Re > 3700. For the roughened channel, the results obtained by RSM are used in all cases.

2.4. Grid Independence Study

In order to guarantee the computation precision, all-hexahedral mesh is employed and y+ is less than 1. Among all the subjects in the work, the roughened-channel structure is the most complex. Therefore, the grid of the roughened channel is used to verify the grid independence to balance the computation precision and the computation resource under the inlet condition of 80,000 Pa total pressure, as shown in Table 1. It is indicated that the relative differences of f and Nu are 0.168% and 0.201% when the mesh changes from Mesh 3 to Mesh 4. Therefore, the results of the Mesh 3 are considered accurate. The grid numbers of other models have the same level as the current model.

2.5. Length Selection of Inlet Section

The extended inlet section is appended to the microchannel to develop the flow. The normalized friction factor f/f of the test section is plotted in Figure 7 as a function of the normalized length lin (lin = Lin/L) of the inlet section, where f is the friction factor when lin = 4. It can be observed from Figure 7 that the normalized friction factor stops changing drastically since lin is longer than 0.75 (Lin = 90 mm). This indicates that the flow stability has been relatively high, although the flow under some working conditions is not fully developed. We choose the inlet section and outlet section with a length of 90 mm in order to obtain the fully developed flow in the test section.

3. Results and Discussion

3.1. Smooth Channel (Channel without Protrusions)

For the smooth channels, the theory of laminar flow is quite complete. However, studies on transition flows are still not comprehensive. The study of the transition flow in a microchannel with an inlet section of a certain length has practical significance.
The function of the friction factor changing with the Reynolds number can reflect the change of the flow state, as shown in Figure 8. It is shown that the flow state changes at the Reynolds numbers of 2214, 2793, 3133, and 3450, which are also the inflection points of the curve of friction factor versus Reynolds number. This is also reflected in the variation in the averaged Nusselt number with the Reynolds number, as shown in Figure 9.
In order to explore the flow structures and heat transfer in different flow states, the Nusselt number, velocity magnitude, and turbulent kinetic energy contours of the test section are analyzed when the Reynolds number is 2793 and 3133. The surface Nusselt number of the primary wall is shown in Figure 10. The dimensionless velocity magnitude and dimensionless turbulent kinetic energy contours on the middle cross section of the channel in the Y direction are shown in Figure 11 and Figure 12. In order to analyze the variation law of turbulent kinetic energy more clearly, the distribution of dimensionless turbulent kinetic energy at the center of the channel along the flow direction x is shown in Figure 13. Moreover, the distribution of the average turbulent kinetic energy of the normal-to-flow-direction sections along the x axis has a high consistency with the curve in Figure 13.
When the Reynolds number is 2214, the velocity distribution shown in Figure 11 is relatively uniform; however, it is worth noting that the turbulent kinetic energy in Figure 12 is higher near the sidewall at the inlet, although the overall level of the turbulent kinetic energy is lower. The boundary layer thickness starts from 0 at the inlet and gradually thickens with the flow. Turbulence is easily generated when the flow is subjected to large shear forces. The flow near the side wall is susceptible to the shearing effect from three walls (two primary walls and a side wall). Combining Figure 10 and Figure 12, the M-shaped distribution of turbulent kinetic energy causes the distribution of the Nusselt number to also be M-shaped, and the M-shape becomes less pronounced along the flow direction.
When the Reynolds number is greater than 2214 and less than 2793, the distribution of the Nusselt number, velocity, and turbulent kinetic energy is similar to that of the Reynolds number of 2793. Combining with Figure 13, it can be inferred that the generation law of boundary layer and turbulence is consistent in the Reynolds number range of 2214 to 3133. Affected by the factors such as the inlet, it is more likely to form turbulent flow near the side wall, and the turbulent viscosity is much larger than the molecular viscosity, so the resistance near the wall surface becomes larger, which results in the higher flow velocity in the middle of the channel. A flow boundary with a higher velocity is more prone to turbulence. As the flow develops, the turbulent zone near the side walls becomes larger and the velocity magnitude in the middle of the channel becomes higher. Eventually, the turbulent zones will meet in the middle of the channel, resulting in the Λ-shaped distribution of velocity and turbulent kinetic energy shown in Figure 11 and Figure 12. It can be seen from Figure 12c that the turbulent kinetic energy reaches the maximum after the two turbulent regions near the sidewall meeting each other, and the maximum velocity is upstream of the meeting point. The velocity and turbulent kinetic energy of the fluids gradually become uniform after mixing. The distribution of the Nusselt number follows the distribution of the turbulent kinetic energy, except near the inlet, where the influence of thermal boundary layer generation is significant and the Nusselt number is high.
It can be analyzed from Figure 13 that when the Reynolds number is small, before the velocity of the accelerated fluid in the middle of the channel reaches the highest level, the turbulent kinetic energy decreases slightly along the flow, such as when Re = 2793. However, when the Reynolds number is large, the turbulent kinetic energy of the accelerated fluid in the middle of the channel increases along the flow until a Λ shape is formed, such as when Re = 3133.
Therefore, Re = 2214 is the turning point of the velocity distribution and the turbulent kinetic energy distribution from M-shape to Λ-shape. Re = 2793 is the turning point where the distribution of the turbulent kinetic energy along the coordinate x in the test section changes from decreasing all the time to decreasing first and then increasing. Re = 3133 is the turning point where the intersection of the turbulent regions near the sidewall changes from the entrance of the test section to the exit of the test section.
For turbulent flow in smooth channels, the indicators of flow and heat transfer have been extensively studied by experiments such as Ref. [44]. However, for large-aspect-ratio microchannels in this work, it is difficult to detect details in the velocity and temperature fields experimentally and they are rarely reported. The following section will analyze the information that is not easily obtained in experiments such as Reynolds stress, velocity profile, temperature, and eddy viscosity in turbulent flow to help understand flow and heat transfer phenomena.
Figure 14 presents the middle cross section of the channel in the X direction, and the Z and Y directional centerlines on it. Figure 15 shows the distribution of the normalized velocity u ¯ / U max and the Reynolds shear stress component u w ¯ / U max 2 on the normalized coordinate z / ( a / 2 ) on the centerline in the Z direction. Figure 15 shows the distribution of the normalized velocity u ¯ / U max and the Reynolds shear stress component u v ¯ / U max 2 on the normalized coordinate y / ( b / 2 ) on the centerline in the Y direction. Umax is the maximum value of the velocity on the cross section in Figure 14.
The velocity and Reynolds stress component laws shown in Figure 15 and Figure 16 are significantly different near the wall. The flow pattern near y / ( b / 2 ) = 0 is similar to that in a circular tube. The larger the Reynolds number, the faster u ¯ / U max increases from y / ( b / 2 ) = 0 and the peak value of u v ¯ / U max 2 is closer to y / ( b / 2 ) = 0 , which indicates that the thickness of the flow boundary layer decreases with the Reynolds number.
However, it can be seen in Figure 15 that when the Reynolds number is 3760, along the z direction, the u ¯ / U max growth rate at the box-marked interval first decreases and then increases, and the u w ¯ / U max 2 at the corresponding position first decreases and then increases. This situation becomes insignificant as the Reynolds number increases and does not appear in Figure 16. This is because the boundary layer is thicker when the Reynolds number is lower, and the flow near the side wall is more obviously affected by the wall shear stress of the primary walls and the side wall itself.
Figure 17, Figure 18 and Figure 19, respectively show the nondimensional velocity magnitude, temperature, and eddy viscosity contours near the side wall on the middle cross section in the X direction as shown in Figure 14.
It can be observed from Figure 17 that when the Reynolds number is 3760, the velocity growth rate of the area indicated by the black arrow is smaller than that of other locations and the low-velocity location indicated by the arrow is larger than the location closer to the side wall, which are not obvious when the Reynolds number is 8128. When the flow boundary layer becomes thicker, the temperature boundary layer also becomes thicker, which worsens the heat transfer. This can be reflected in Figure 18. When the Reynolds number is 3760, the temperature boundary layer at the location pointed to by the white arrow is thicker than the channel center, and the heat transfer effect is worse. In addition, it can be seen from Figure 19 that the location marked by the black arrow has the largest eddy viscosity on the cross section, and this position becomes closer to the side wall as the Reynolds number increases. It can be clearly seen from Figure 15, Figure 16, Figure 17, Figure 18 and Figure 19 that as the Reynolds number increases, the flow near the side wall is less and less influenced by the wall shear stresses from the primary walls and the side wall.

3.2. Roughened Channel (Channel with Protrusions)

The comparison between the friction factor f and the Nusselt number Nu of the roughened channel and the friction factor f0 and the Nusselt number Nu0 of the smooth channel are shown in Figure 20 and Figure 21. Although not obvious, it can be seen from the function of f and Nu changing with Re that the flow state changes three times at Reynolds numbers of 1214, 2374, and 3815, which are marked by the blue arrows.
When the Reynolds number is less than 1214, the slope of the f curve is very close to that of the f0 curve, while the slope of the Nu curve is obviously greater than that of the Nu0 curve. This indicates that most of the flow in the roughened channel is still laminar, but the protrusions change the flow state of part of the flow and enhance the heat transfer.
When the Reynolds number is greater than 3815, the slope of the curves of f and Nu is almost the same as that of f0 and Nu0. This indicates that most of the flow in the roughened channel is turbulent, and the law of flow and heat transfer is similar to that of the smooth channel.
Figure 22 shows the eddy viscosity on the centerline of the roughened channel in the X direction. For generalization, the nondimensional eddy viscosity is μ0 ( μ 0 = 1000 μ t ρ u i n D h ) and the normalized test section length is l (l = L/90 mm). Reynolds numbers less than 1214 are not shown in Figure 22 due to the low level of eddy viscosity. When the flow states are similar, the eddy viscosity laws are similar. From the overall trend of the curve, the flow state can be divided into four cases by the Reynolds numbers at 1214, 2374, and 3815. The details of the flow state need to be analyzed in conjunction with the turbulent kinetic energy distribution.
Figure 23 shows the nondimensional turbulent kinetic energy contours on the middle cross section of the channel in the Y direction at Reynolds numbers of 2004, 2374, 3441, and 3815. The distribution of turbulent kinetic energy near the protrusion is similar at different Reynolds numbers. The area where the turbulent kinetic energy is larger is located downstream of the protrusion. The turbulent kinetic energy divides into two strands along the flow direction and gradually decreases until it meets the next protrusion.
When the Reynolds number is less than 1214, the flow is almost laminar, and it is difficult for the weak turbulence behind the protrusion to propagate to the middle of the channel. Hence, the slope of the f curve is close to that of the f0 curve in Figure 20.
When the Reynolds number is between 1214 and 2004, as the Reynolds number increases, the fluid mixing gradually becomes stronger and begins to propagate to the middle and side walls of the channel. When the Reynolds number is 2004, almost the entire channel is affected by mixing. In other words, when the Reynolds number increases from 1214 to 2004, the area where the flow state changes is the widest. Hence, the curve of f tends to be flat in Figure 20.
When the Reynolds number is between 2374 and 3441, the mixing meets in the middle of the channel and causes greater mixing, which becomes more obvious as the Reynolds number increases, especially when the Reynolds number is 3441. Downstream from the mixing point, the distribution of eddy viscosity and turbulent kinetic energy is almost the same as that in turbulence. Hence, the slope of the f curve is close to but smaller than the turbulent flow in Figure 20, since only half of the flow is close to turbulent flow.
It is worth noting that the turbulent kinetic energy near the entrance of the test section at Reynolds number of 3441 is different from the others. According to the results, when the Reynolds numbers are 3200 and 3300 in the smooth channel, this situation is caused by the entrance effect.
When the Reynolds number is between 3815 and 7745, the incoming flow is already turbulent. However, the turbulent kinetic energy behind the protrusions is not much higher than the other locations, and the eddy viscosity does not increase significantly as the flow develops. This indicates that in this Reynolds number interval, the protrusions have little influence on the flow state. Hence, the slope of the f curve is close to that of the f0 curve in Figure 20.
Figure 24 shows the streamline distribution with (b) and without (a) velocity magnitude contour near protrusion when the Reynolds number is 1512. At different Reynolds numbers, the flow structure near the protrusions is roughly similar. The flow impacts the front of the protrusion to form a small vortex, then flows to both sides of the protrusion, and then flows to the rear of the protrusion to form two obvious vortices, and finally converges to flow downstream.
Except for the first row, the areas with higher velocity near the other protrusions are the top sides of the protrusions as shown in Figure 24. Since the inlet velocity is relatively uniform, the areas with higher velocity near the first row of protrusions are in the middle of the protrusions instead of on both sides. The fluid passing through the protrusion is divided into three flows behind it, with high-velocity flows on both sides and low-velocity flow in the middle. Before reaching the next row of protrusions, the velocity will not become uniform, and it will still maintain the low-velocity middle and high-velocity sides, as shown in Figure 24.
Figure 25 shows the cross sections of interest of one protrusion in the first row. One is the Z-normal cross section in the middle of the protrusion, and the other is the X-normal cross section at the tail of the protrusion and is tangent to the protrusion. Figure 26 and Figure 27 show the temperature contours and streamlines on the middle and tail sections of the protrusion at different Reynolds numbers.
Although the overall turbulence in the channel is very low when the Reynolds number is lower than 1214, there are still mixing and vortices behind the protrusion, as shown in Figure 24. However, it can be found from Figure 26a that although there are obvious vortices behind the protrusion, the temperature boundary layer at the tail of the protrusion is still thick. This indicates that although the vortex area is larger at a lower Reynolds number, the vortex intensity is very low, so the influence on flow and heat transfer is not obvious.
It is worth noting that the flow shown in Figure 26b is asymmetric, which is due to the common Coanda effect in jets [47,48]. Since gravity is not considered in this work, the instability of turbulence makes the direction of flow asymmetry random. Once this asymmetry is formed, it will exist stably and will not change over time. In this work, when the Reynolds number increases from 468 to 1214, the asymmetry gradually becomes stronger. When the Reynolds number range is from 1214 to 2347, the asymmetry is the most obvious. When the Reynolds number increases from 2347 to 3815, the asymmetry gradually disappears. When the Reynolds number is greater than 3815, there is no asymmetry. This is because as the Reynolds number is increased from 468, the asymmetry is increased by the enhancement in turbulence, and when the Reynolds number is further increased, the asymmetry is reduced by the enhancement in the inertial force.
It can be observed from Figure 27 that the size in the Z direction of the four vortices behind the protrusion decreases when the Reynolds number increases from 468 to 3815. In addition, the structure of the vortex is still loose when the Reynolds number is 468, and the structure of the vortex is compact and basically unchanged when the Reynolds number is greater than 1214. However, as the Reynolds number increases from 3815 to 7745, there is almost no change in the flow structure near the protrusion, as shown in Figure 26 and Figure 27. It is worth noting that the temperature boundary layer difference between the location marked by the white arrow and other locations becomes smaller as the Reynolds number increases, as shown in Figure 27b,c, which is also observed in the smooth channel.
Since the Nusselt number distribution on the primary wall around the downstream protrusions is almost the same as that of the second row, the Nusselt number contours on the primary wall around only the first and second rows of protrusions are shown in Figure 28. Because the distribution of the Nusselt number and the geometry are symmetrical in the Z direction, only half of them is shown.
The large-Nusselt-number areas on the front half of the protrusions and nearby wall are caused by the impact of high-velocity flow. The large-Nusselt-number areas on the rear half of the protrusions and nearby wall are caused by vortexes and mixing.
Figure 29 presents the ratio of the average Nusselt number of the protrusions to the primary wall (Nu1/Nu2) as a function of the Reynolds number.
When the Reynolds number is 468, although the volume of the vortex behind the protrusion is large, its strength is very low, so it is difficult for it to expand directly behind the protrusion, which makes the Nusselt number at the rear of the protrusion and nearby wall very small.
When the Reynolds number increases from 468 to 1214, the strength of the vortex gradually increases and the areas with large Nusselt number appear at the protrusion tail and the nearby wall. The vortex structure and Nusselt number distribution change most dramatically in this Reynolds number range. However, the fluid mixing still has not diffused into the channel deeply. Hence, the Nu1/Nu2 rises with Re.
When the Reynolds number increases from 1214 to 7745, it can be seen from the strong consistency between the Nusselt number distribution and the eddy viscosity distribution that the heat transfer of the primary wall is determined by the vortex and turbulence. The Nusselt number distribution near the protrusions changes a little with the Reynolds number increasing due to the relatively fixed flow structure. However, the Nusselt number of the primary walls increases with the Reynolds number increasing due to the turbulence caused by the protrusions spreading over the channel. When the Reynolds number ranges from 2374 to 3815, although the downstream turbulence is high, the temperature difference between the downstream wall and the fluid is small, so the downstream primary wall Nusselt number is not significantly higher than the upstream. When the Reynolds number is in the range of 3815 to 7745, the flow in the channel is almost totally turbulent, and the effect of the protrusions in enhancing heat transfer becomes smaller. Hence, the Nu1/Nu2 decreases with Re.
Figure 30 shows the variation in the nondimensional frictional entropy production rate of the roughened channel N viscous, the frictional entropy production rate of the smooth channel N viscous, 0 and their ratio N viscous/N viscous, 0 with the Reynolds number. It can be seen that both the nondimensional frictional entropy generation rate and its growth rate increase as the Reynolds number increases. It is worth mentioning that the increase in Reynolds number causes a higher velocity gradient in the flow field, and subsequently creates more viscous entropy generation. The protrusions reduce the flow area and induce eddies, and consequently these regions exert more resistance against the flow and lead to more frictional irreversibility.
Figure 31 shows the variation in the nondimensional thermal entropy production rate of the roughened channel N thermal, the thermal entropy production rate of the smooth channel N thermal, 0 and their ratio N thermal/N thermal, 0 with the Reynolds number. The nondimensional thermal entropy generation rate increases with the Reynolds number and its growth rate is basically constant. The increase in Reynolds number leads to the increase in temperature gradient in the flow field and the increase in irreversibility of heat transfer. This also leads to a lower temperature of the flow at the outlet with the increase in Reynolds number. The impingement flow and vortexes caused by the protrusions all increase the temperature gradient near the wall, resulting in greater irreversibility of heat transfer.
Within the research range, the frictional entropy generation rate accounts for less than 12.5% of the total entropy generation rate, and the proportion grows faster with the increase in the Reynolds number. This indicates that the lower the Reynolds number, the more dominant the thermal entropy production is. Additionally, the laws of the total entropy production and the thermal entropy production are similar. Both N viscous/N viscous, 0 and N thermal/N thermal, 0 increase first and then decrease, and tend to be stable in the turbulent region, but the values are less than 2.2 and remain at a low level. Therefore, the presence of protrusions does not reduce the irreversibility of heat transfer and friction.
Figure 32 shows the variation in the performance evaluation criteria (PEC) with the Reynolds number. The operating point of the smooth channel corresponding to the roughened channel is obtained by the difference method. The maximum PEC is 1.80 when the Reynolds number is 2004. When the Reynolds number is greater than 2004, PEC decreases with the increasing Reynolds number. This is because the mixing in the middle of the channel has a great influence on the downstream resistance loss but has little influence on the downstream Nusselt number distribution. When the Reynolds number is greater than 2980, PEC is less than 1. This is because the higher the degree of turbulence of the incoming flow, the less obvious the turbulent effect of the protrusions is for the channel, and the flow and heat transfer law in the roughened channel and the smooth channel become more and more similar. From the perspective of comprehensive heat transfer, it is recommended to use this roughened channel when the Reynolds number is less than 2696, so that the PEC is greater than 1.

4. Conclusions

In this paper, the flow and heat transfer in the rectangular microchannels with and without semi-ellipsoidal protrusions (smooth channel and roughened channel), applicable to gas turbine blades, are numerically simulated. The microchannel has a height of 0.6 mm, a width of 9 mm, and a length of 120 mm. Apart from the test section, the inlet and outlet sections whose lengths are 90 mm are considered.
In the smooth channel, the Nusselt number, velocity, and turbulent kinetic energy distributions of the transition flow, which are less studied, are discussed to guide practical applications, and the characteristics of turbulent flow that are difficult to obtain in experiments, such as Reynolds stress, eddy–viscosity distribution, etc., are studied to help understand the phenomena of flow and heat transfer.
In the roughened channel, the generation and propagation of turbulence, the flow structure and the heat transfer behavior, as well as eddy viscosity, entropy generation rate, and performance evaluation criteria (PEC) are analyzed. Theoretical support and design suggestions are provided for the microchannel with semi-ellipsoidal protrusions, which is rarely studied.
The main conclusions are as follows:
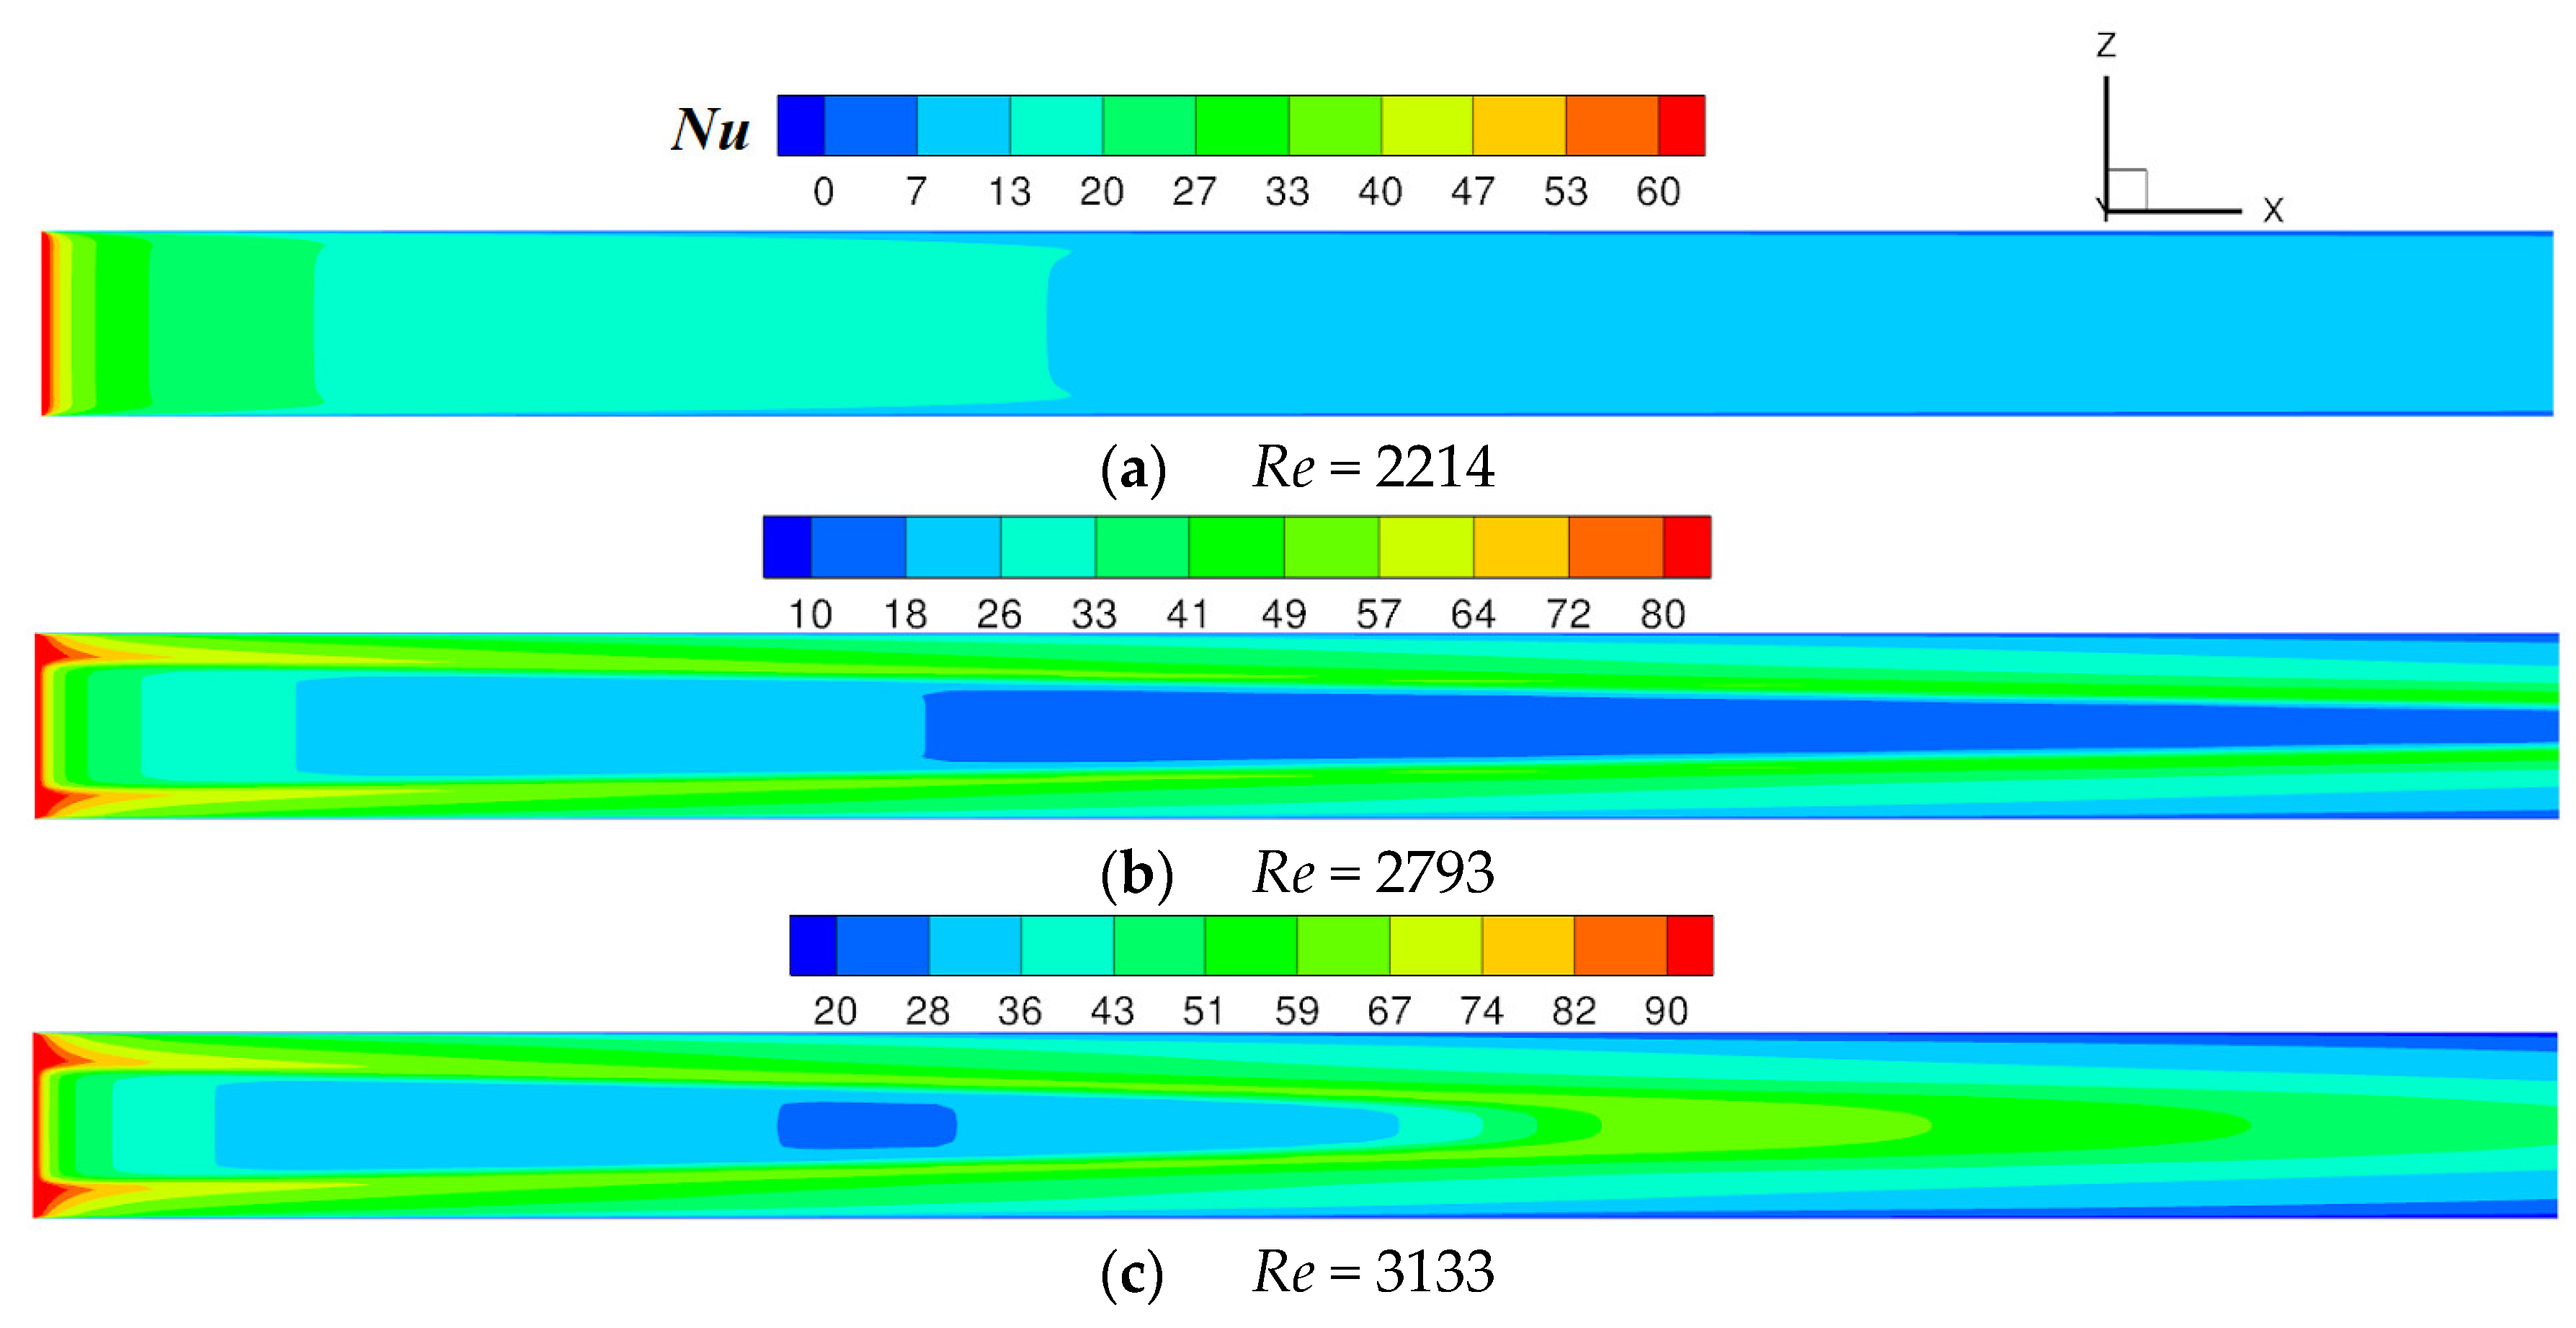
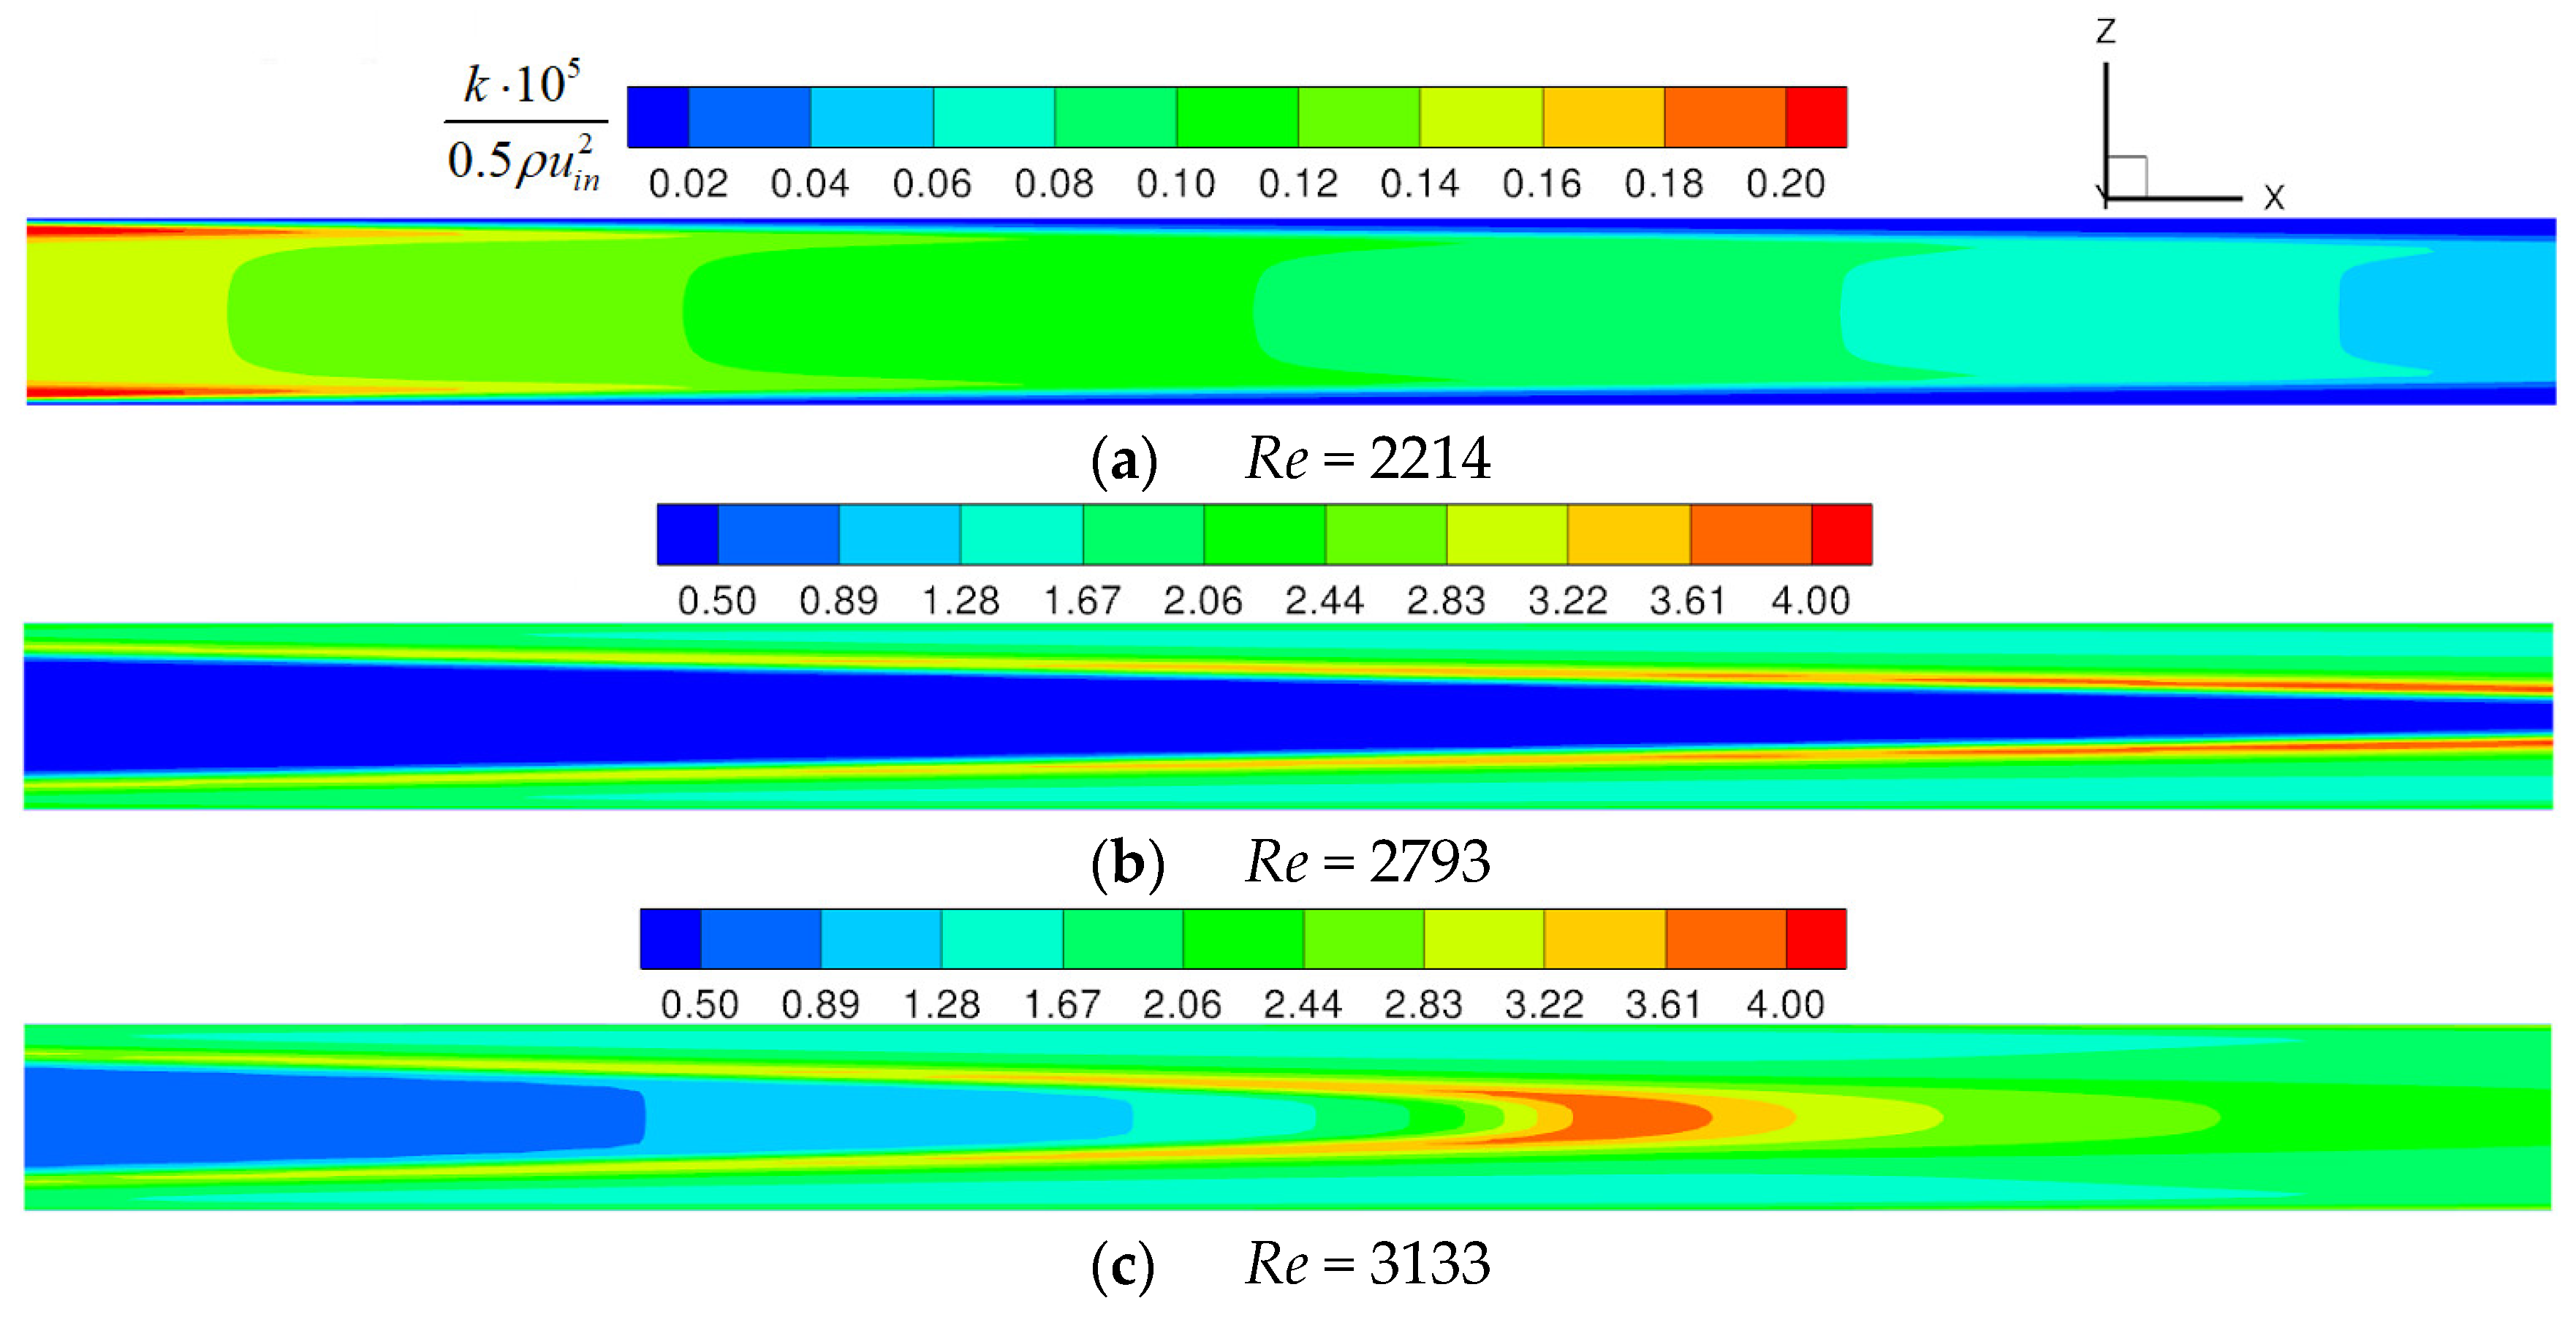
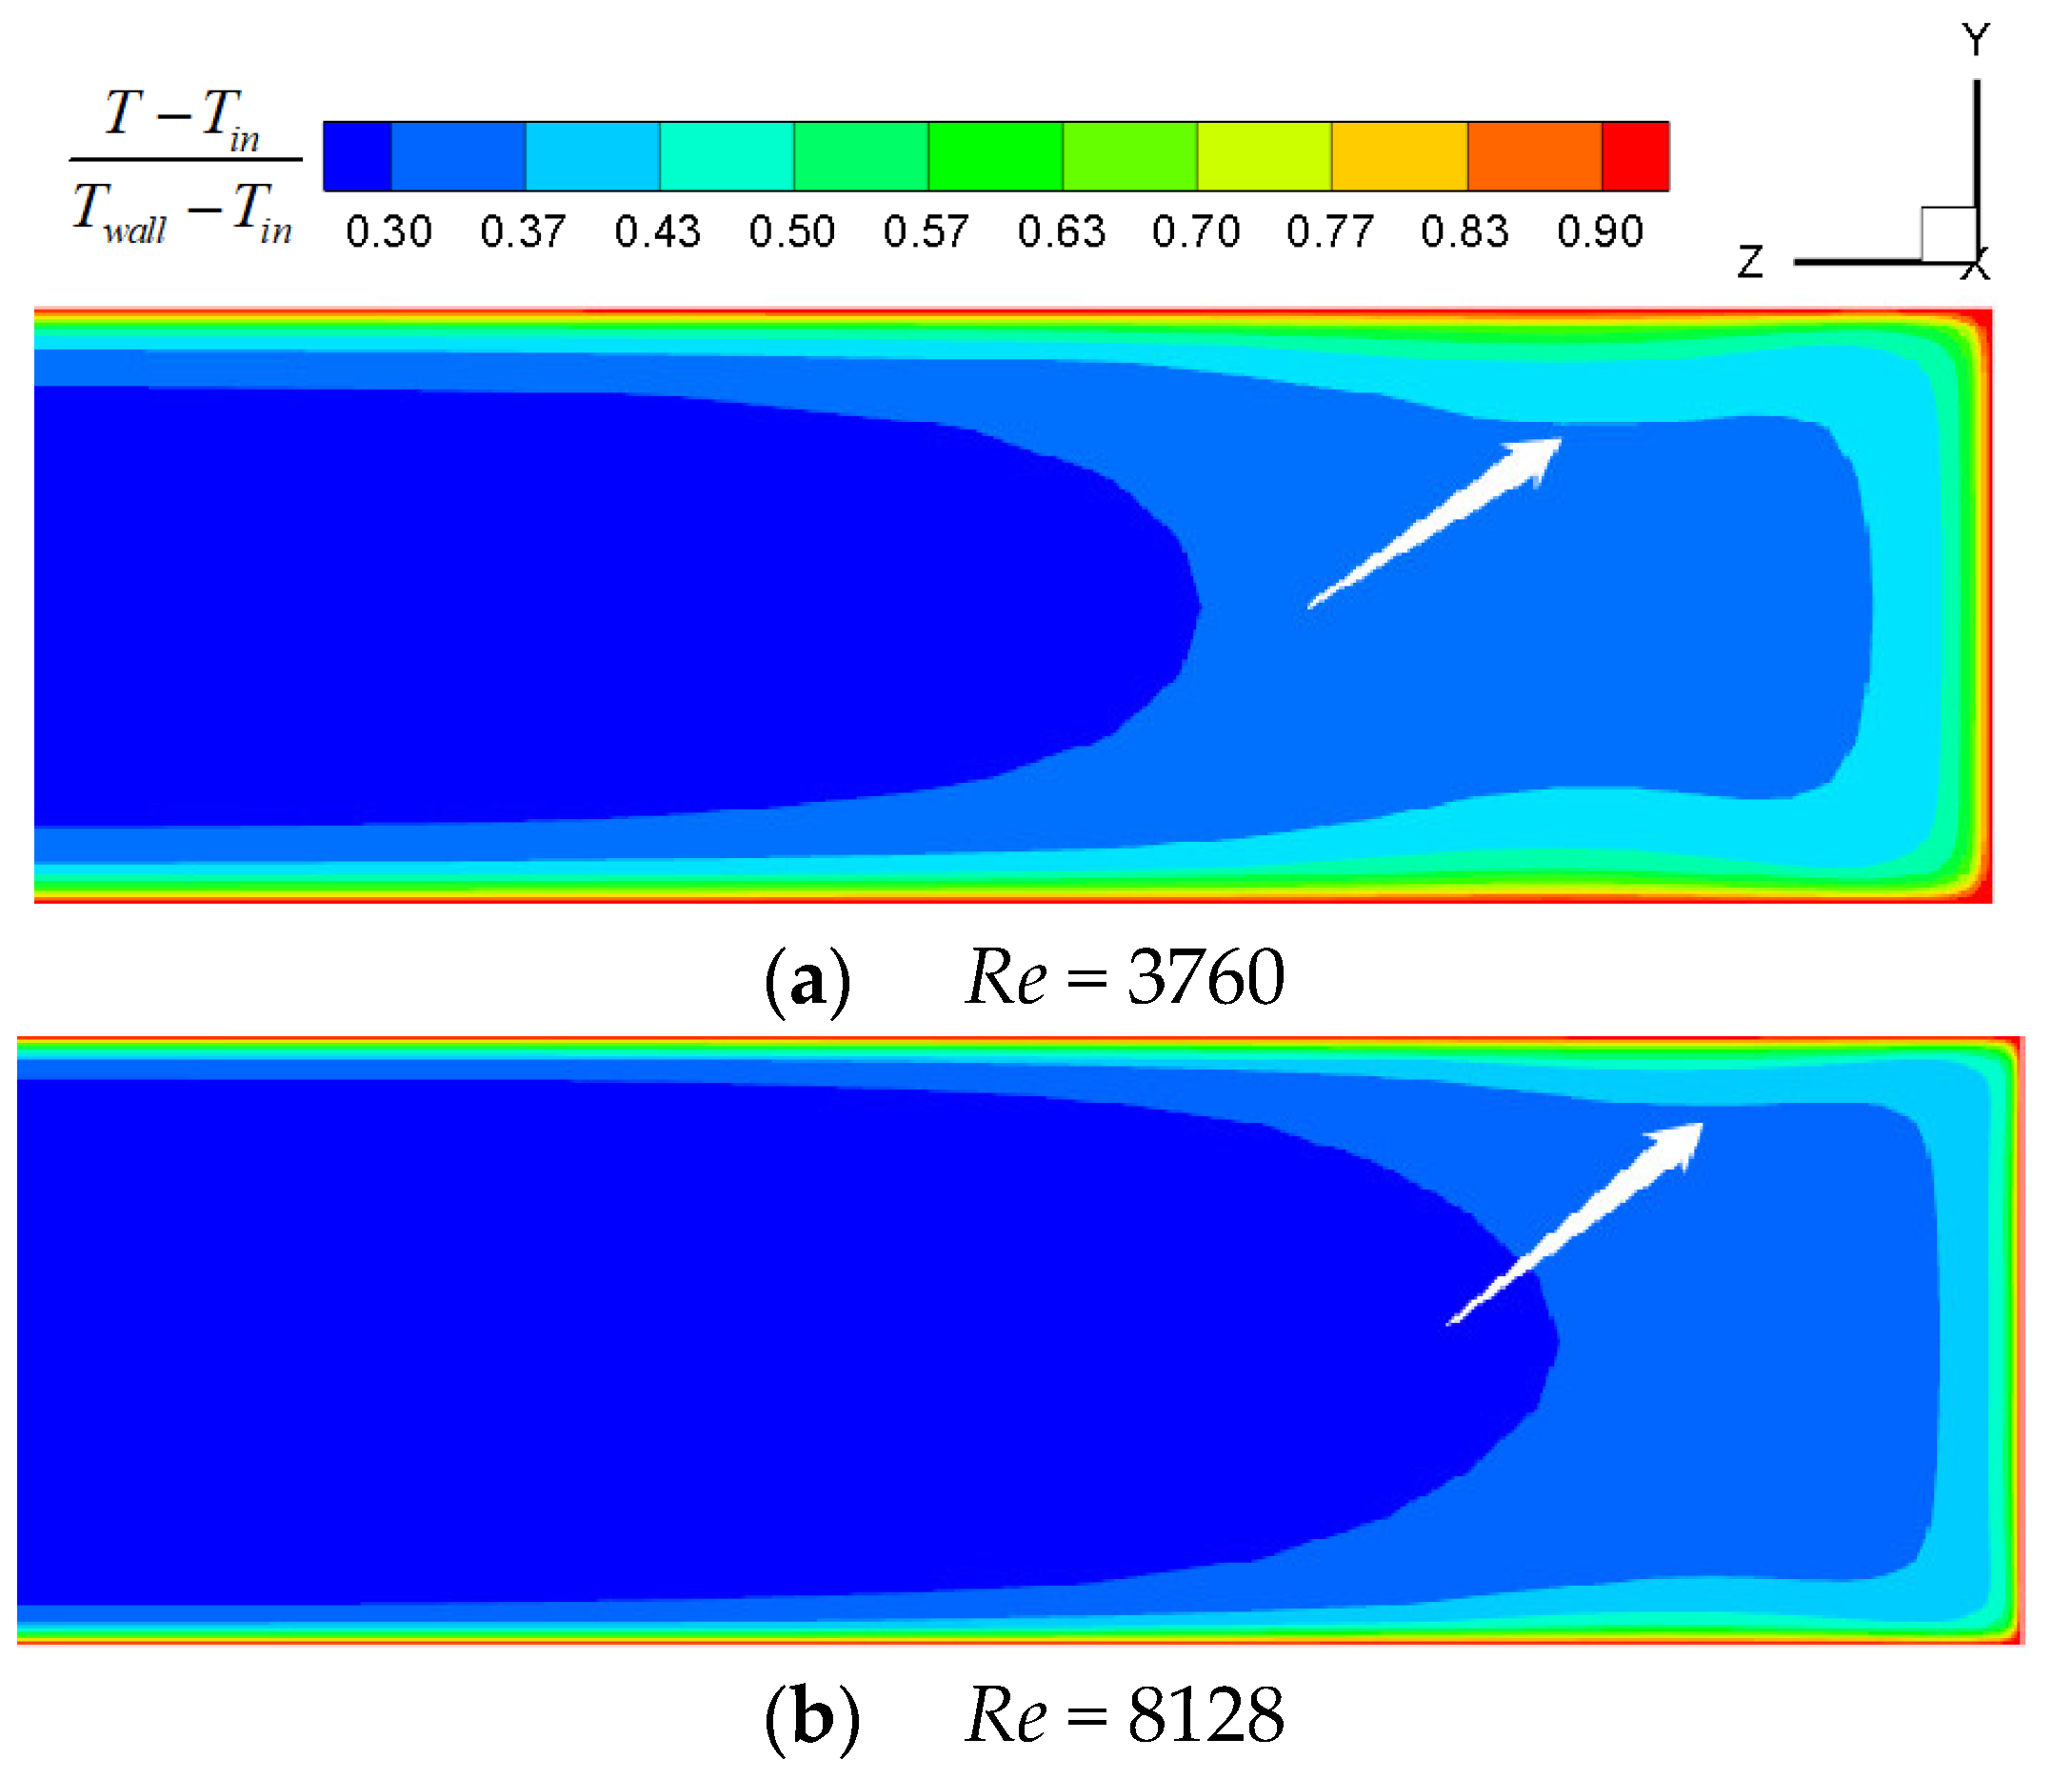
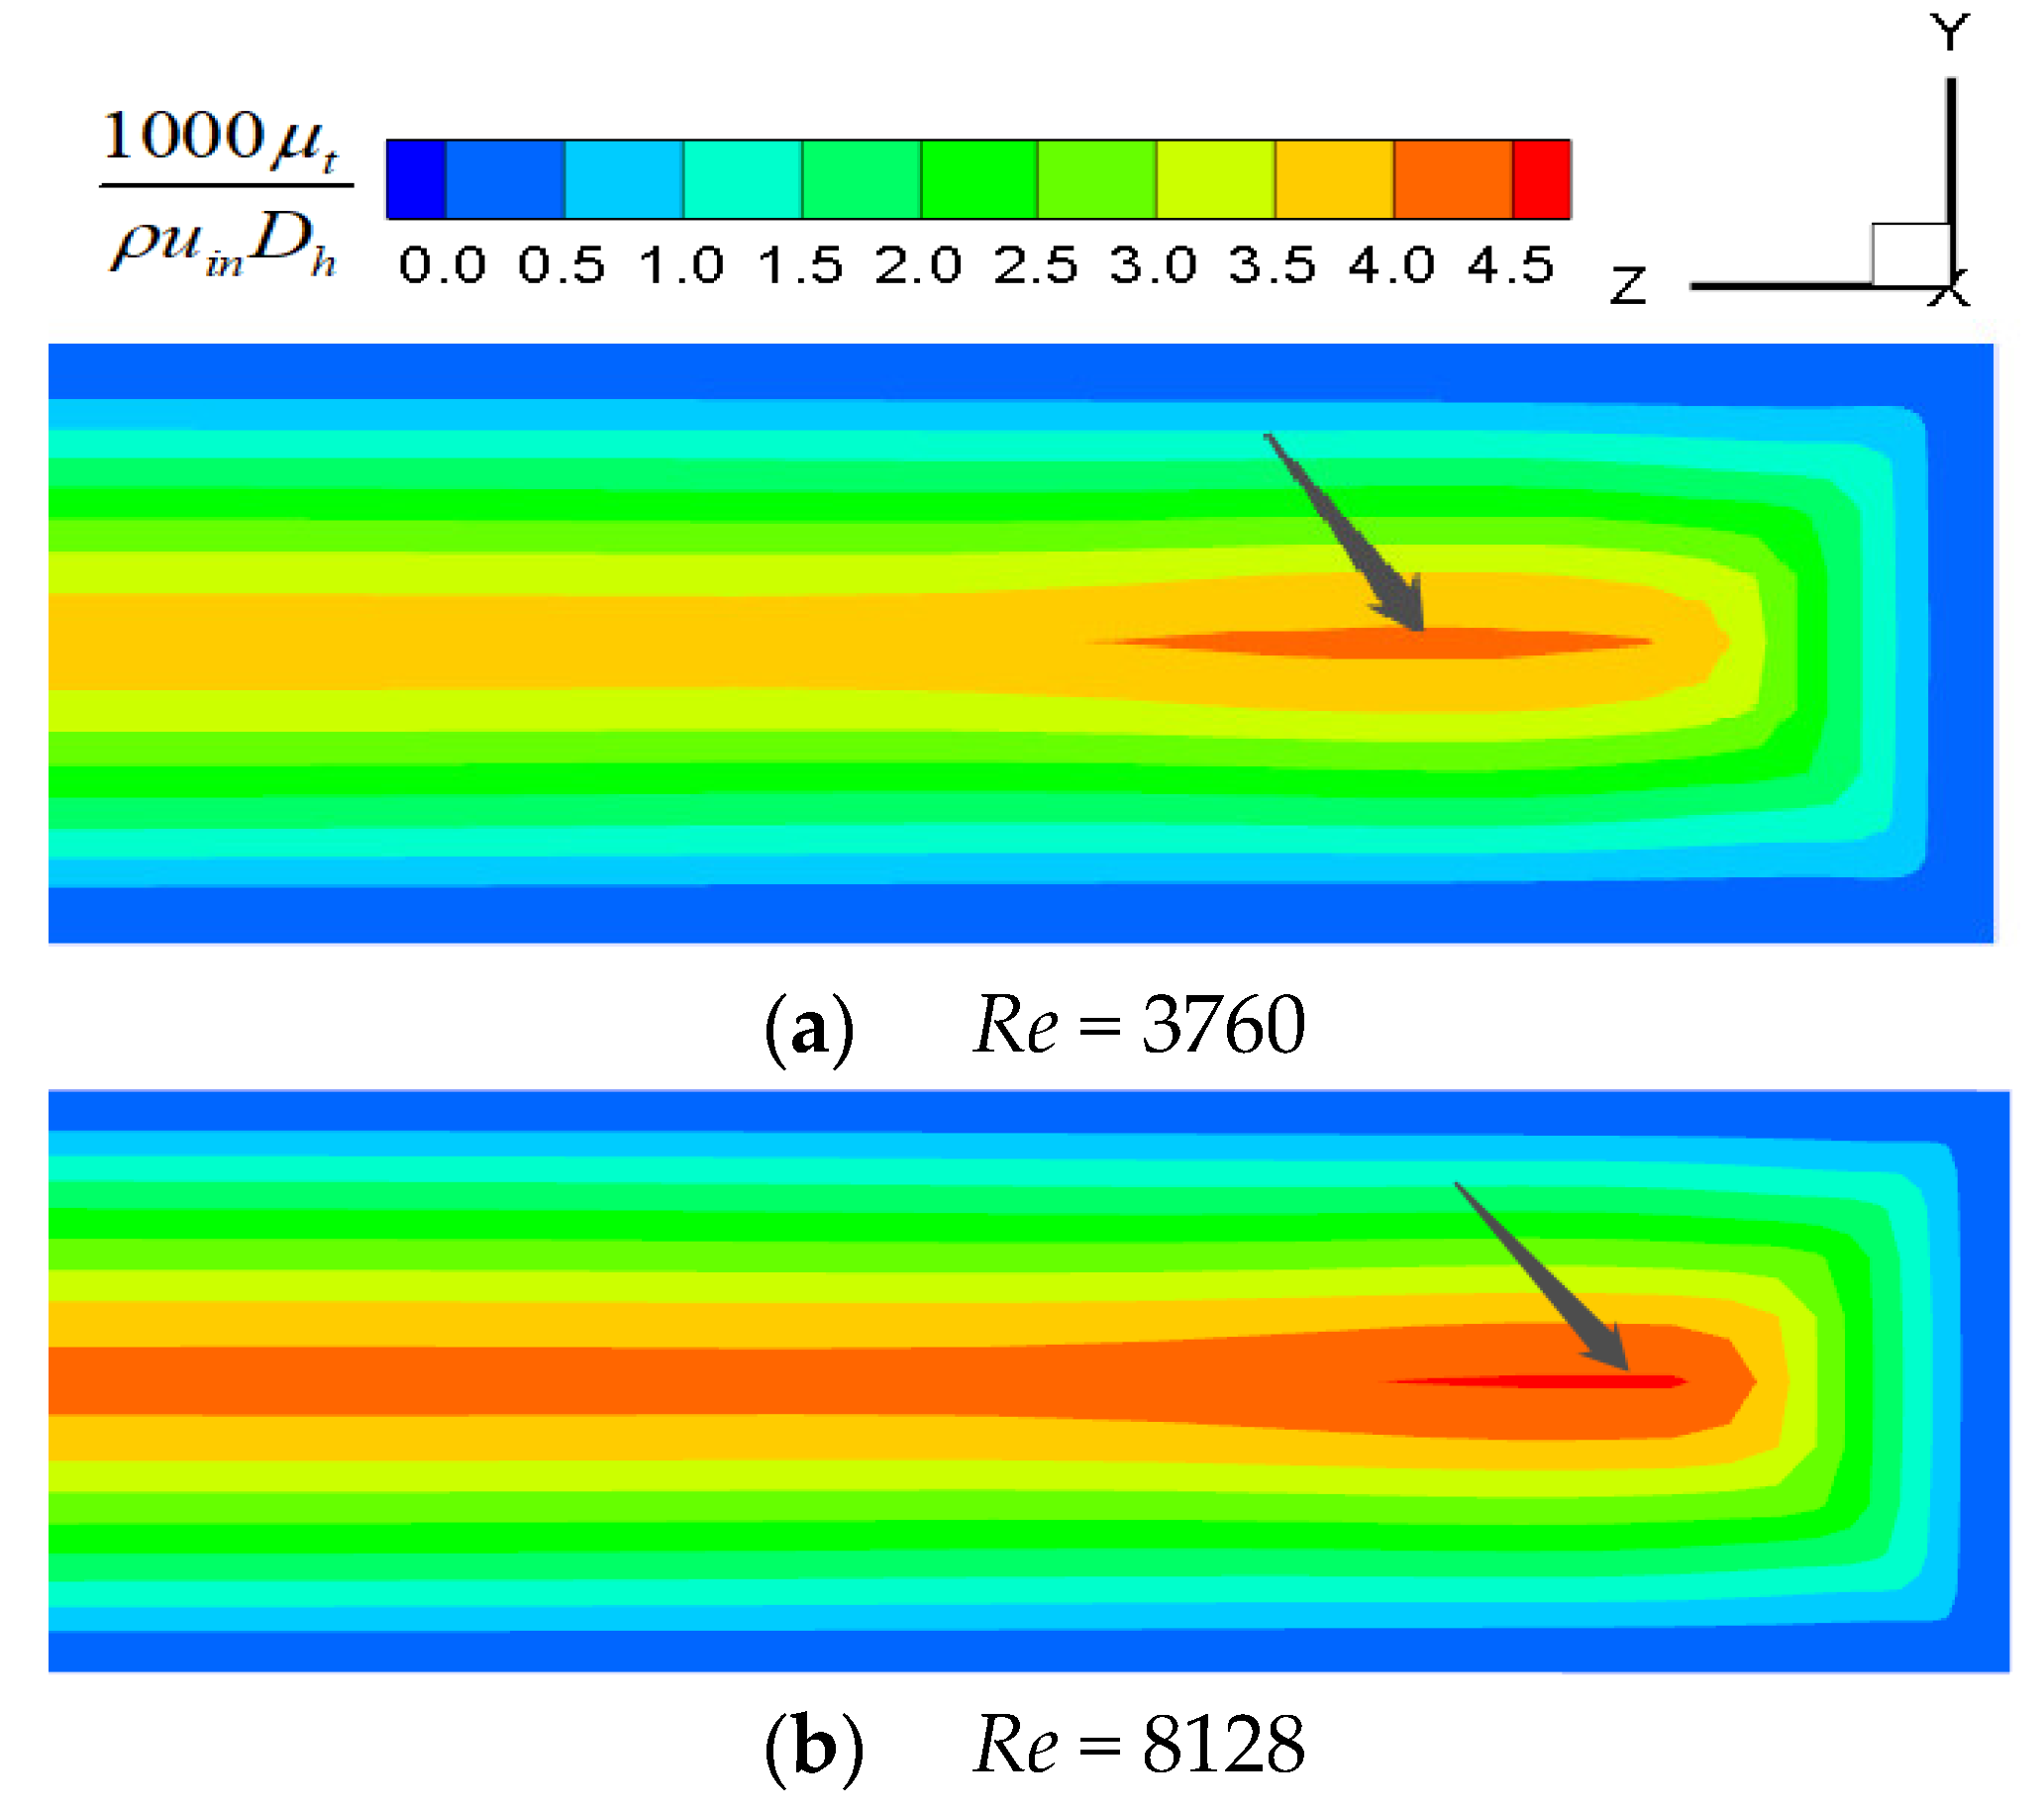
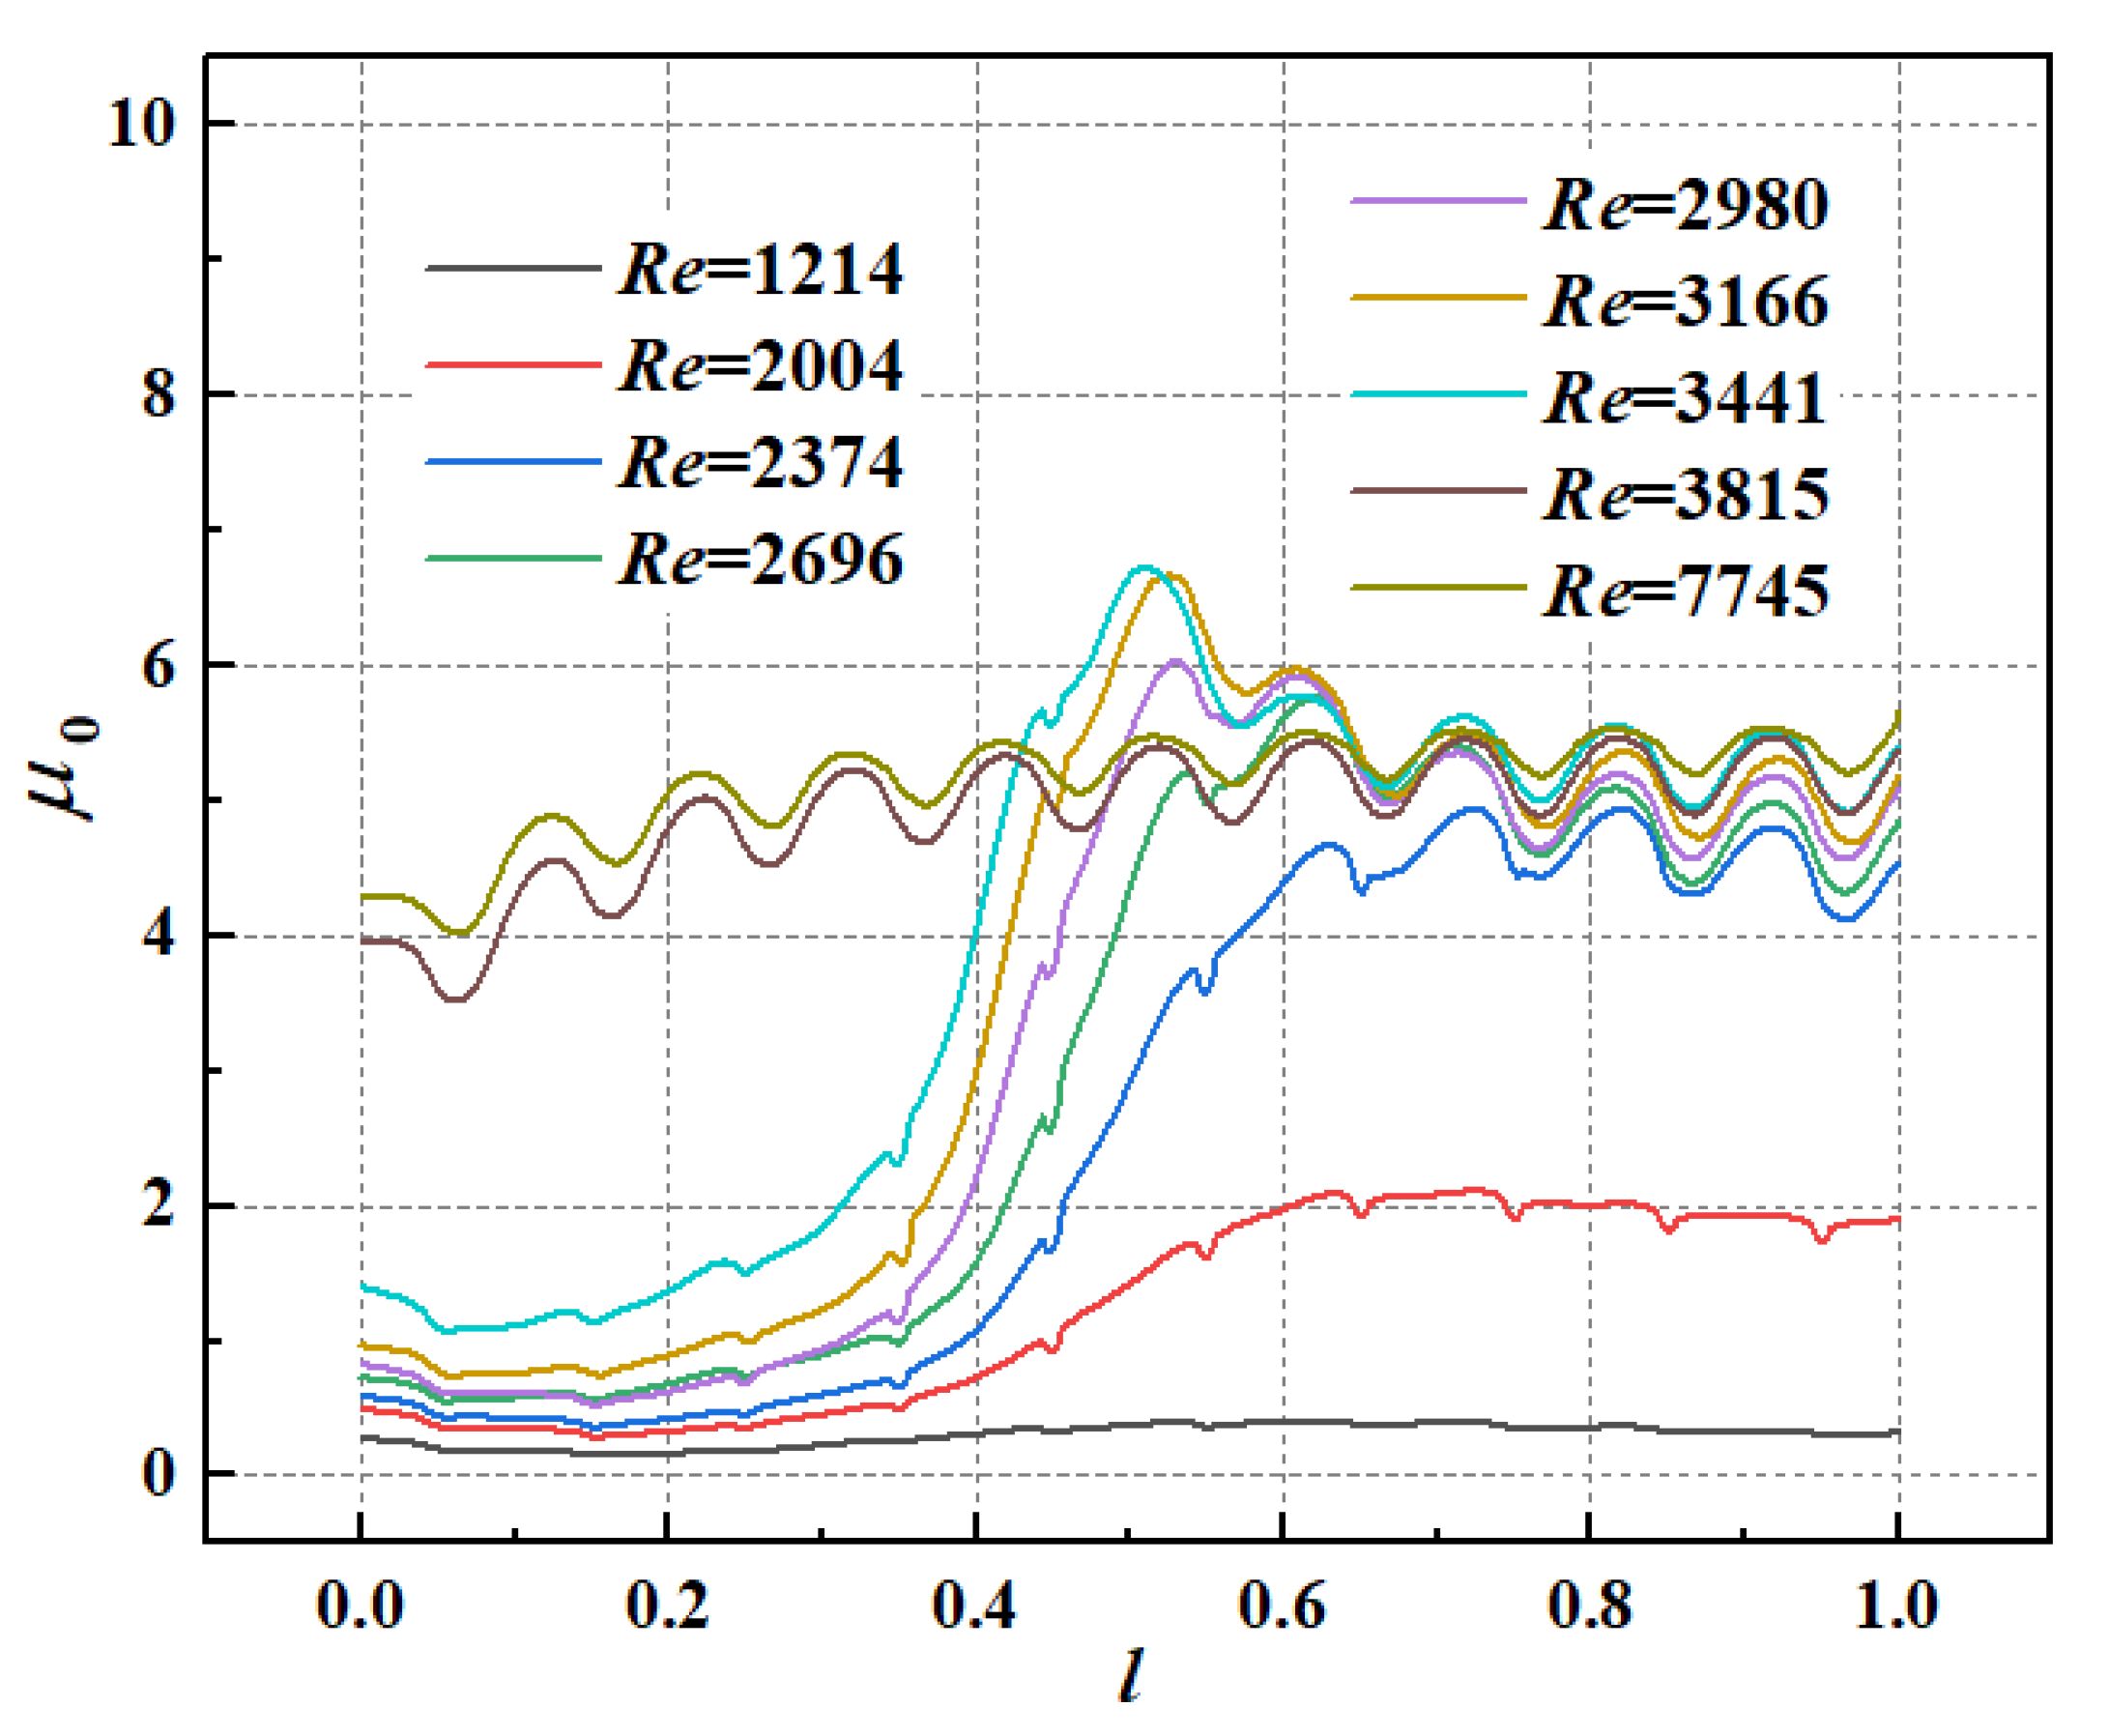
  • In the smooth channel, when 2214 < Re < 3589, the turbulent flow area near the sidewall tends to expand to the middle of the channel, and mixes after meeting in the channel, forming an Λ-shaped velocity and turbulent kinetic energy distribution. The flow and turbulence are uniformly distributed downstream of the mixing point. As the Reynolds number increases, the mixing point is closer to the inlet, approximately reaching the center of the channel when Re = 3133. The heat transfer is significantly affected by the turbulent kinetic energy, showing an Λ-shape distribution and appearing higher at the mixing point. In practical application, attention should be paid to this Λ-shaped nonuniform heat transfer caused by the entrance effect.
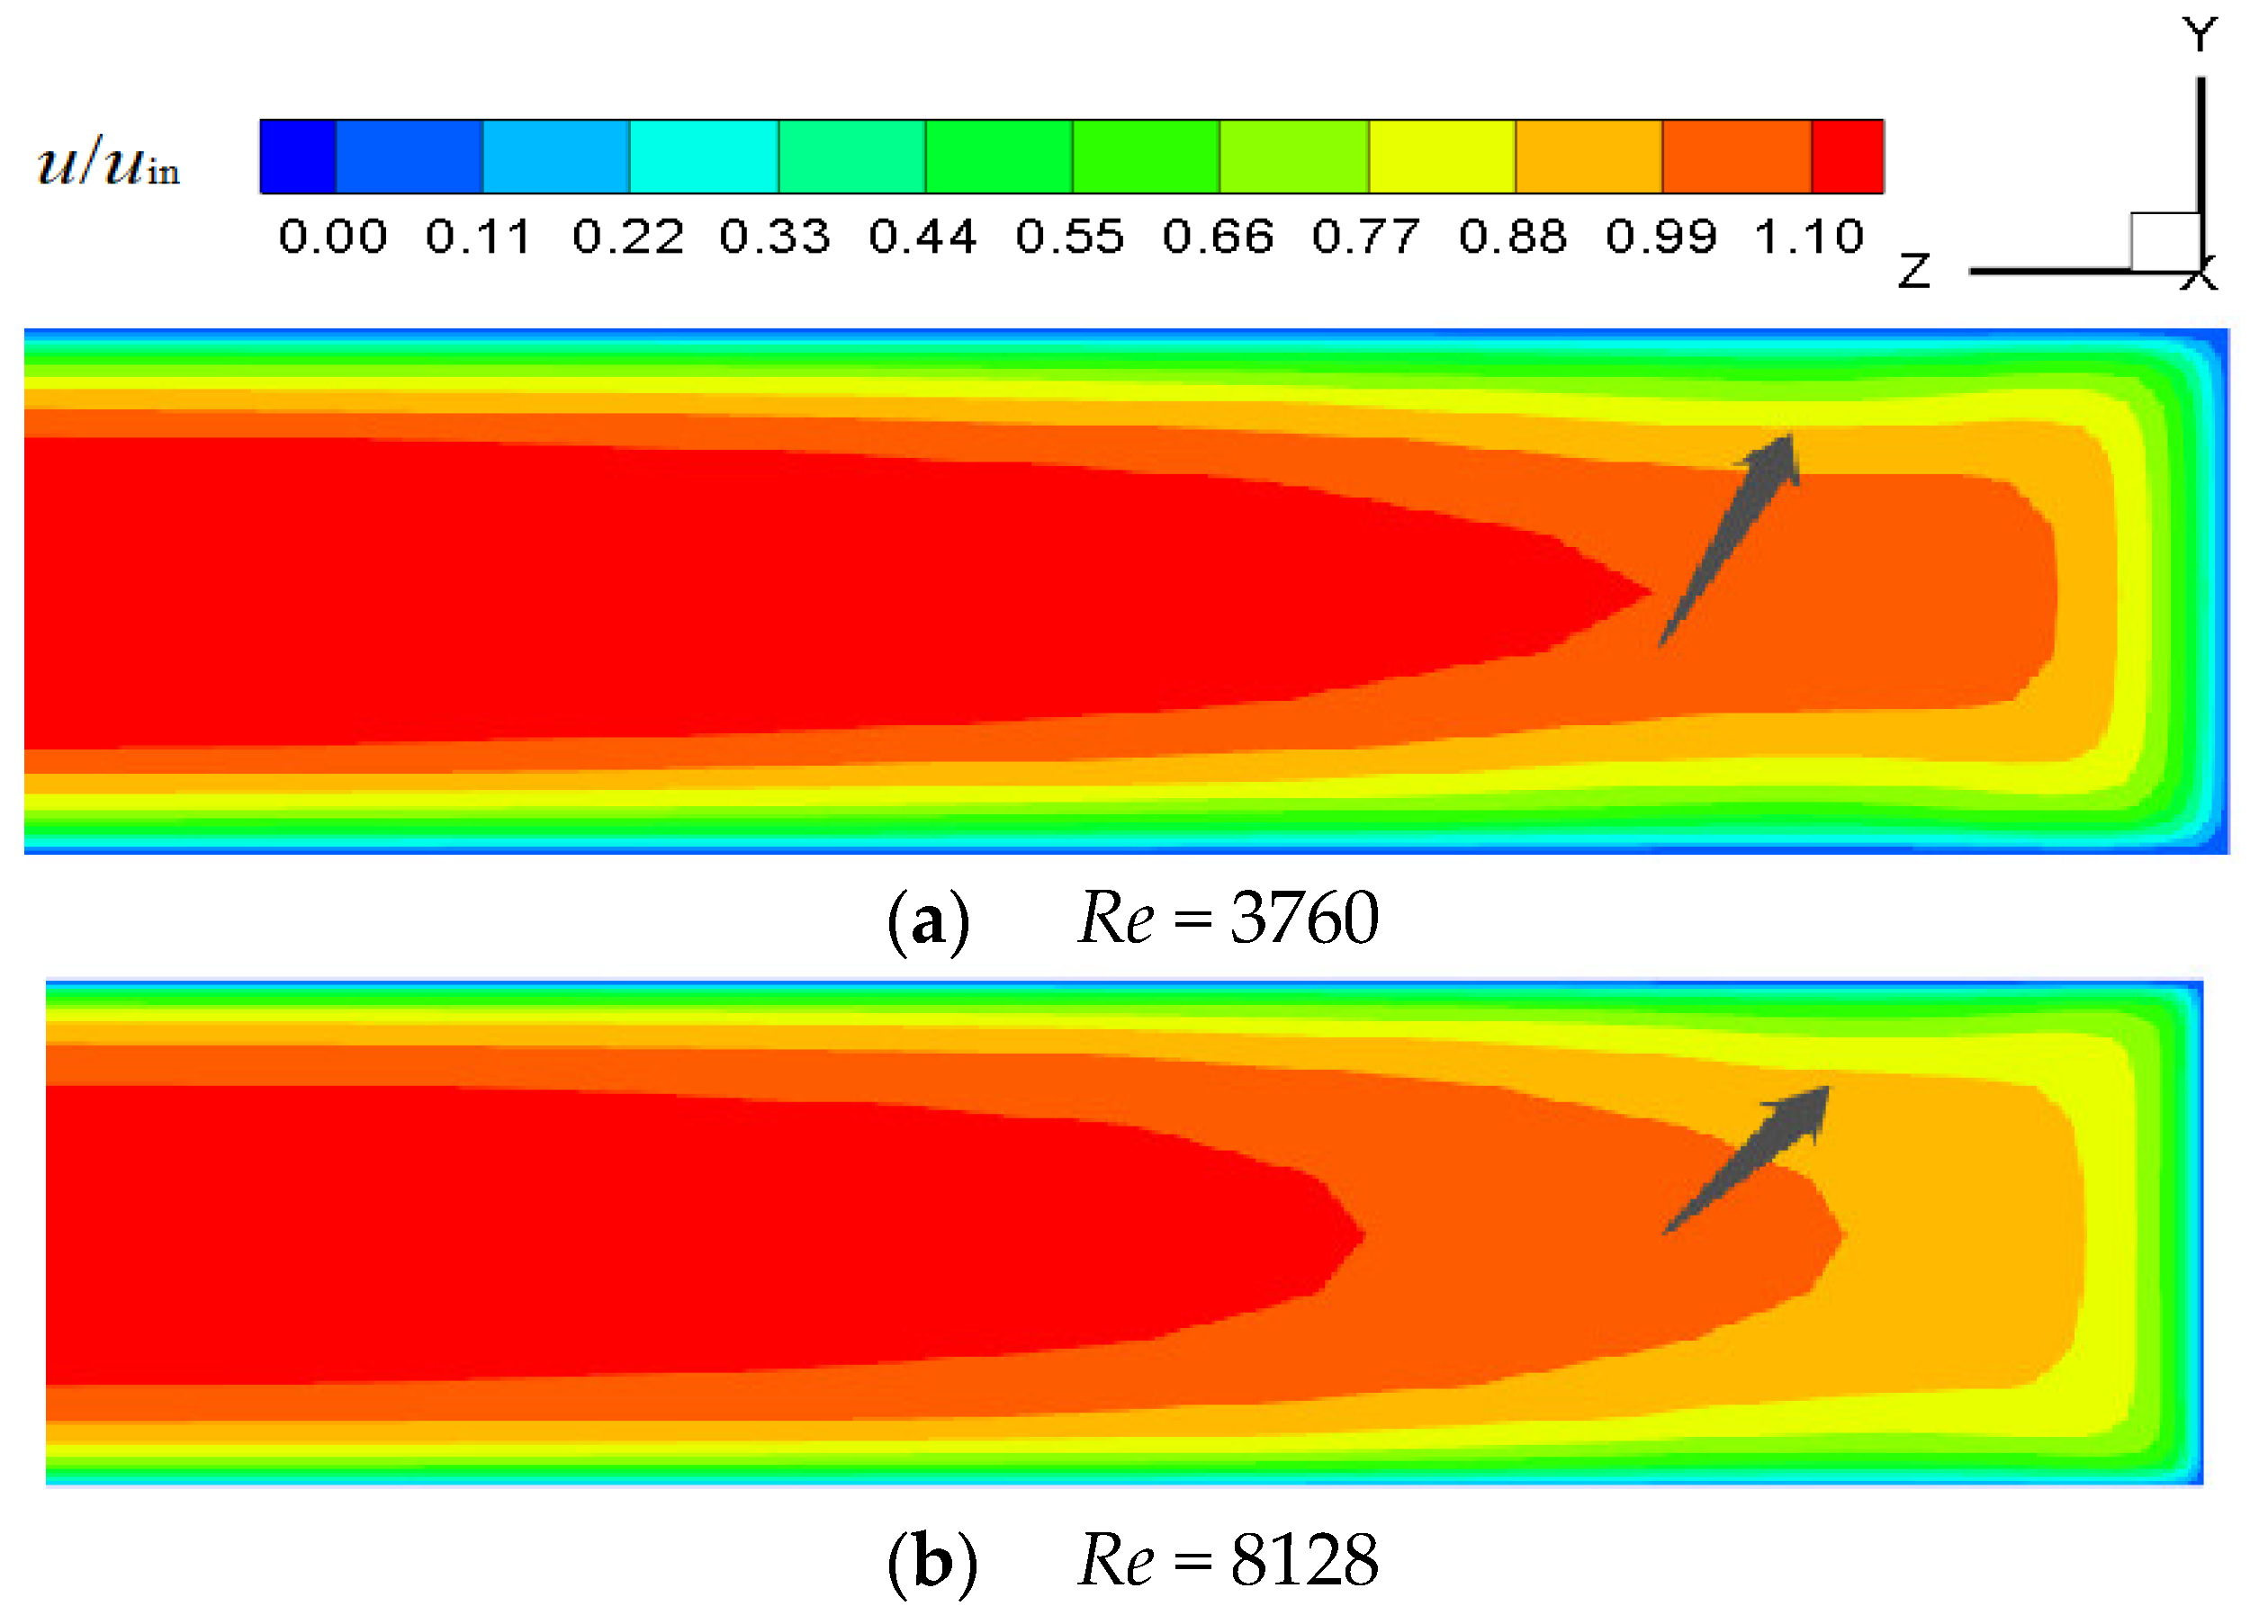
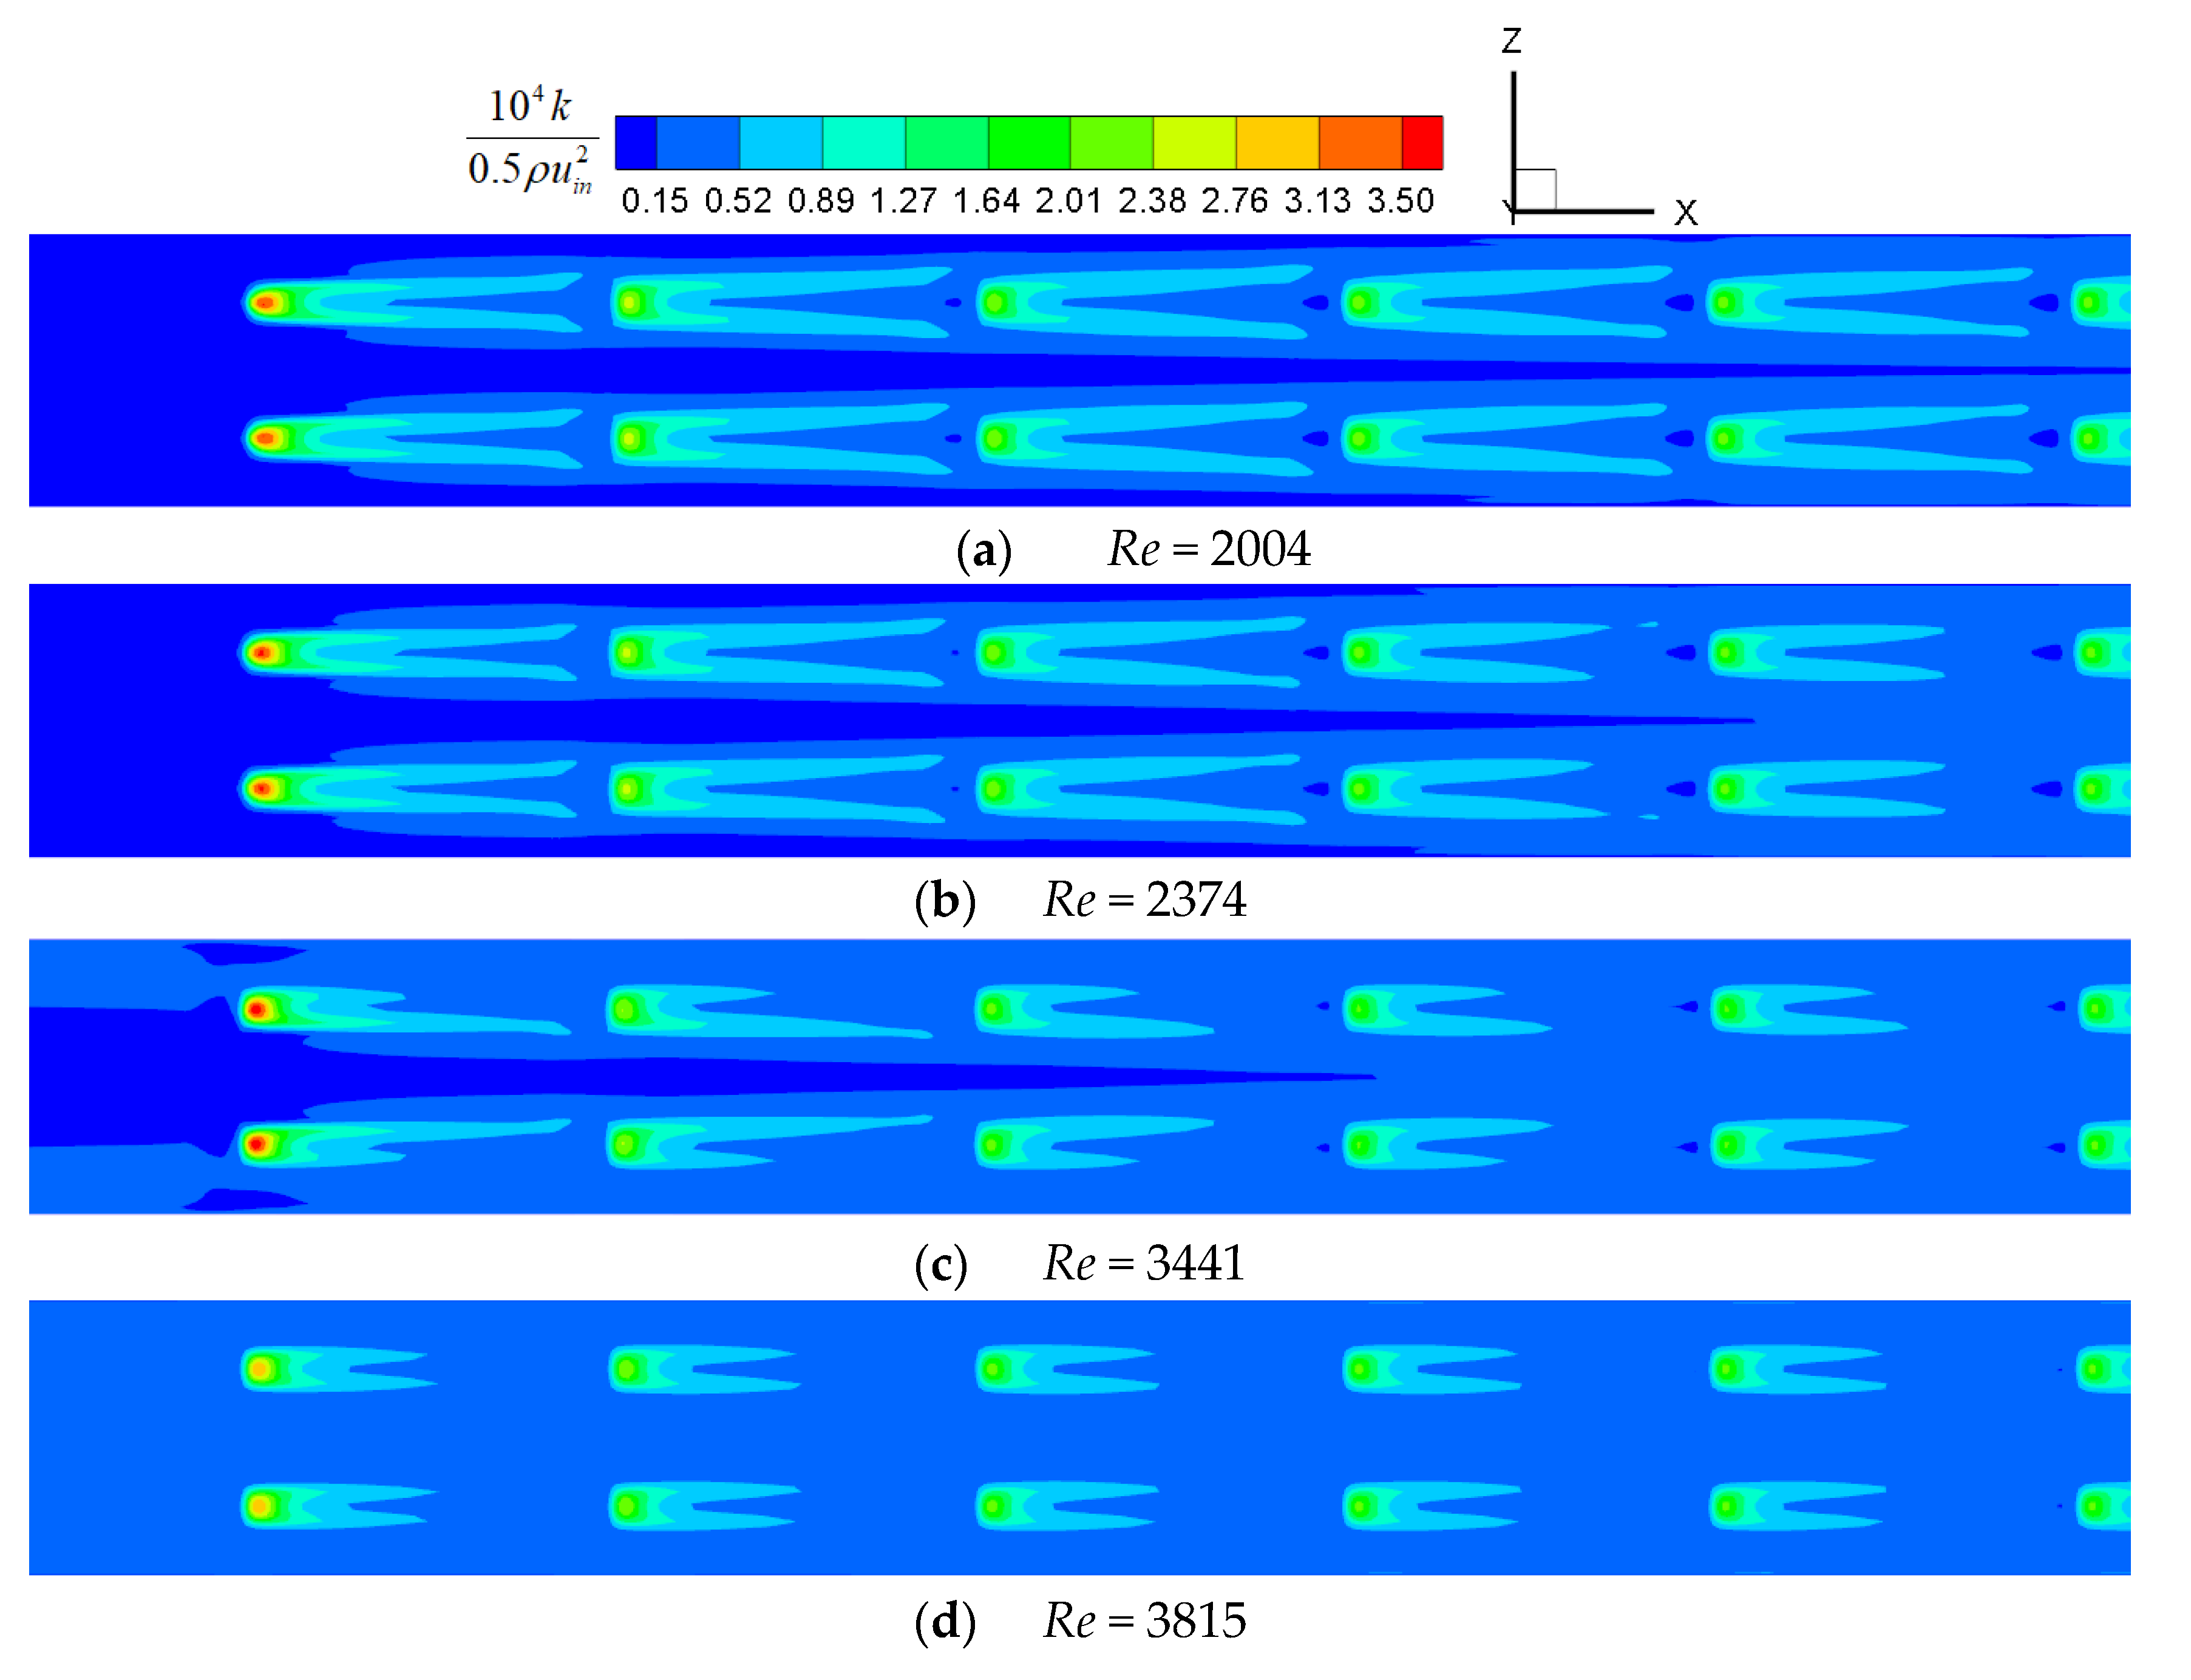
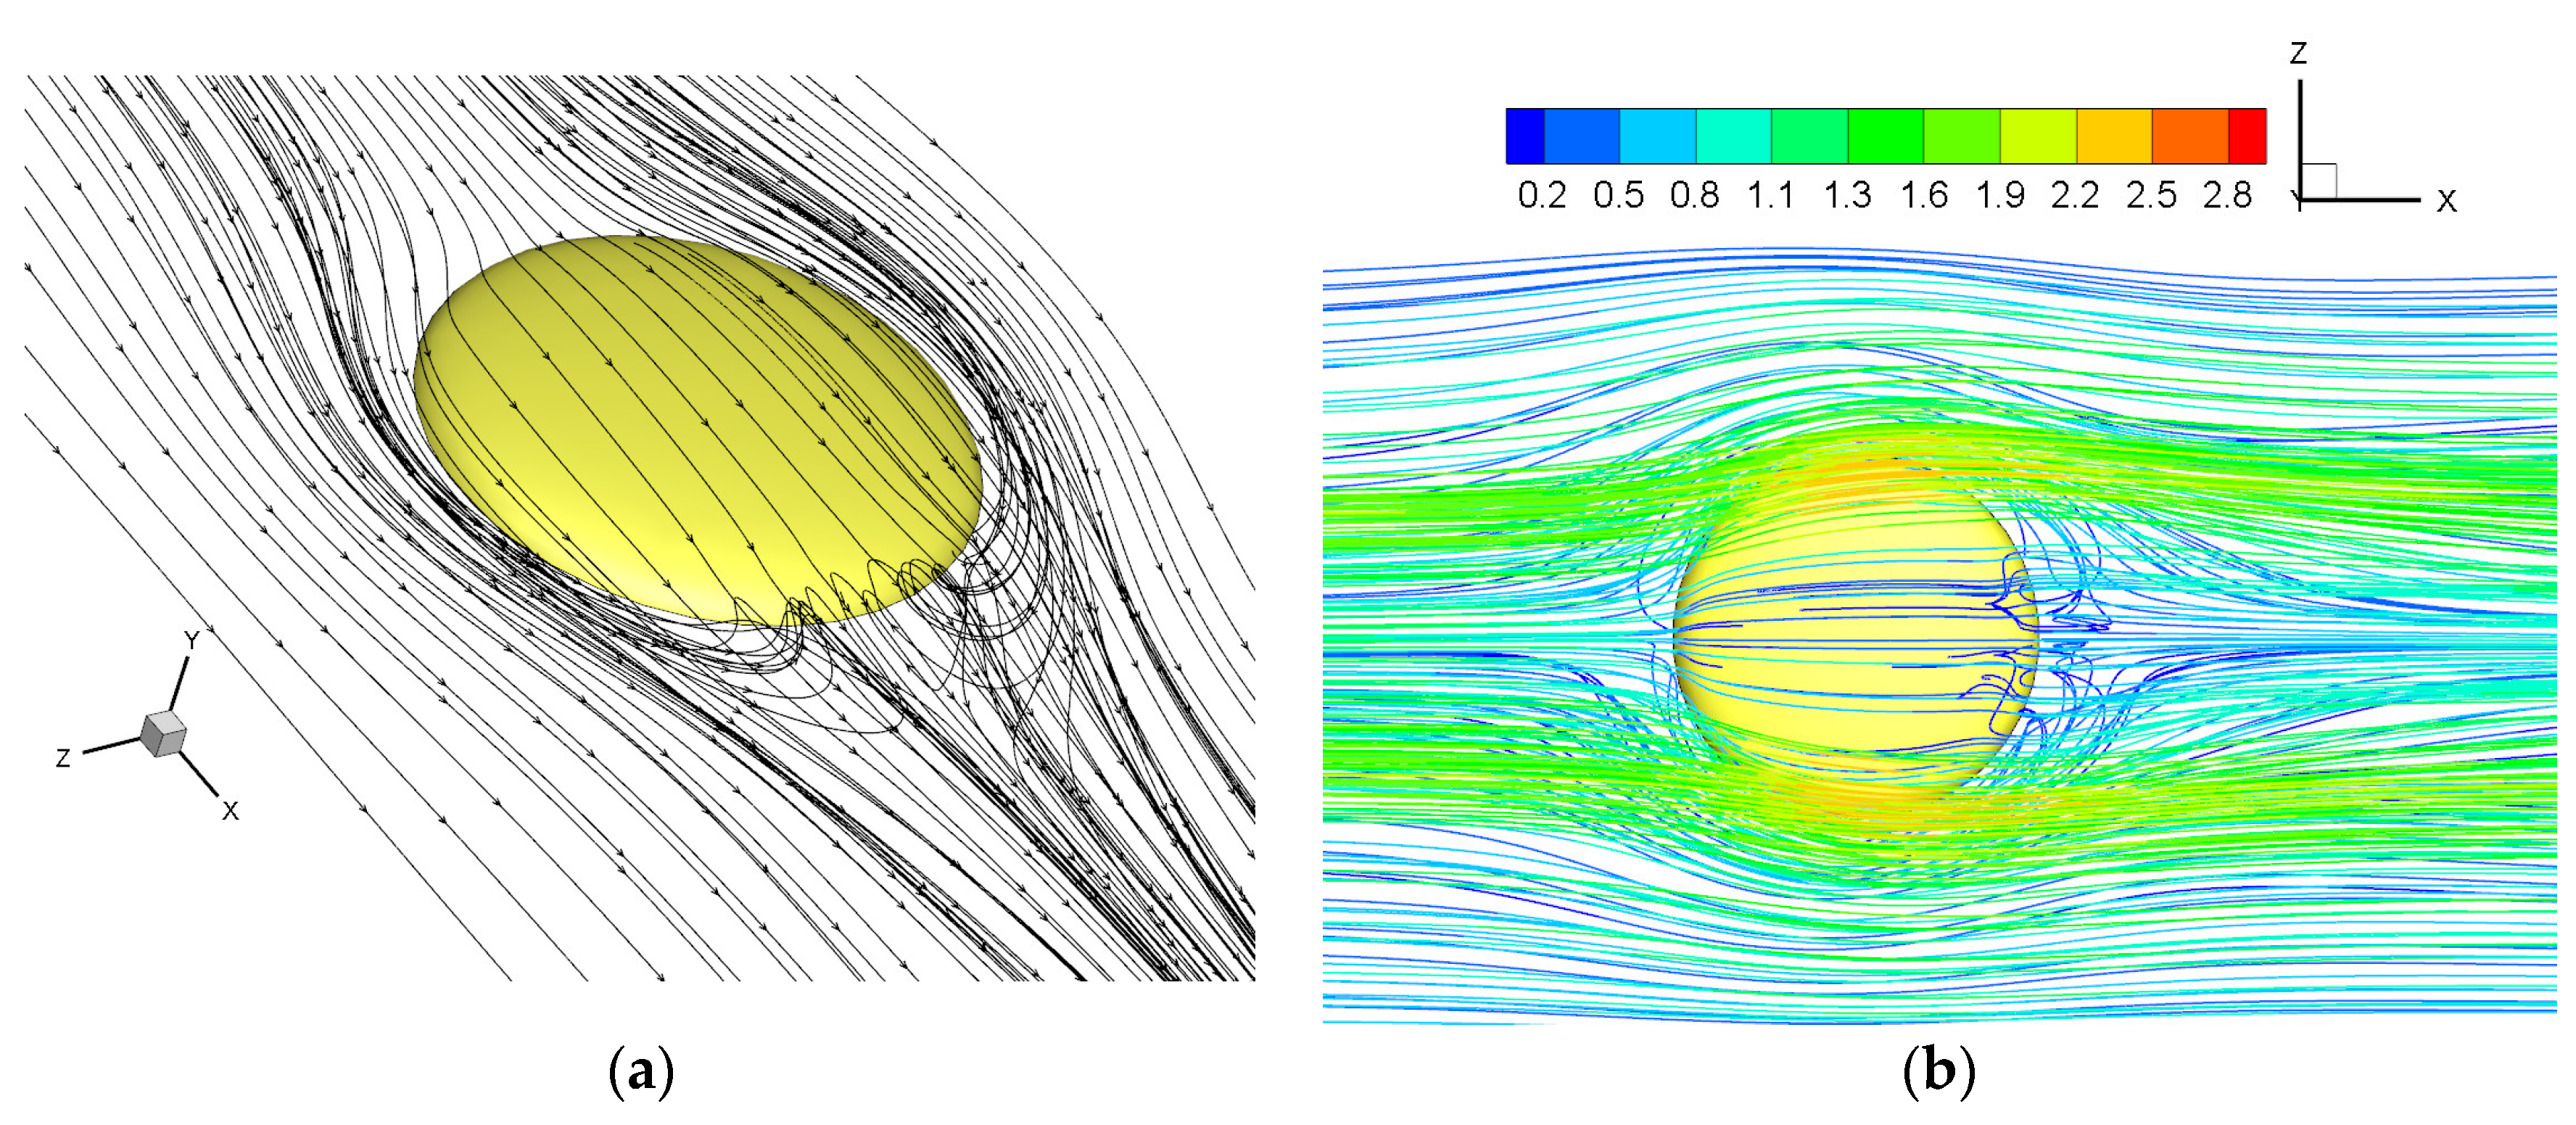
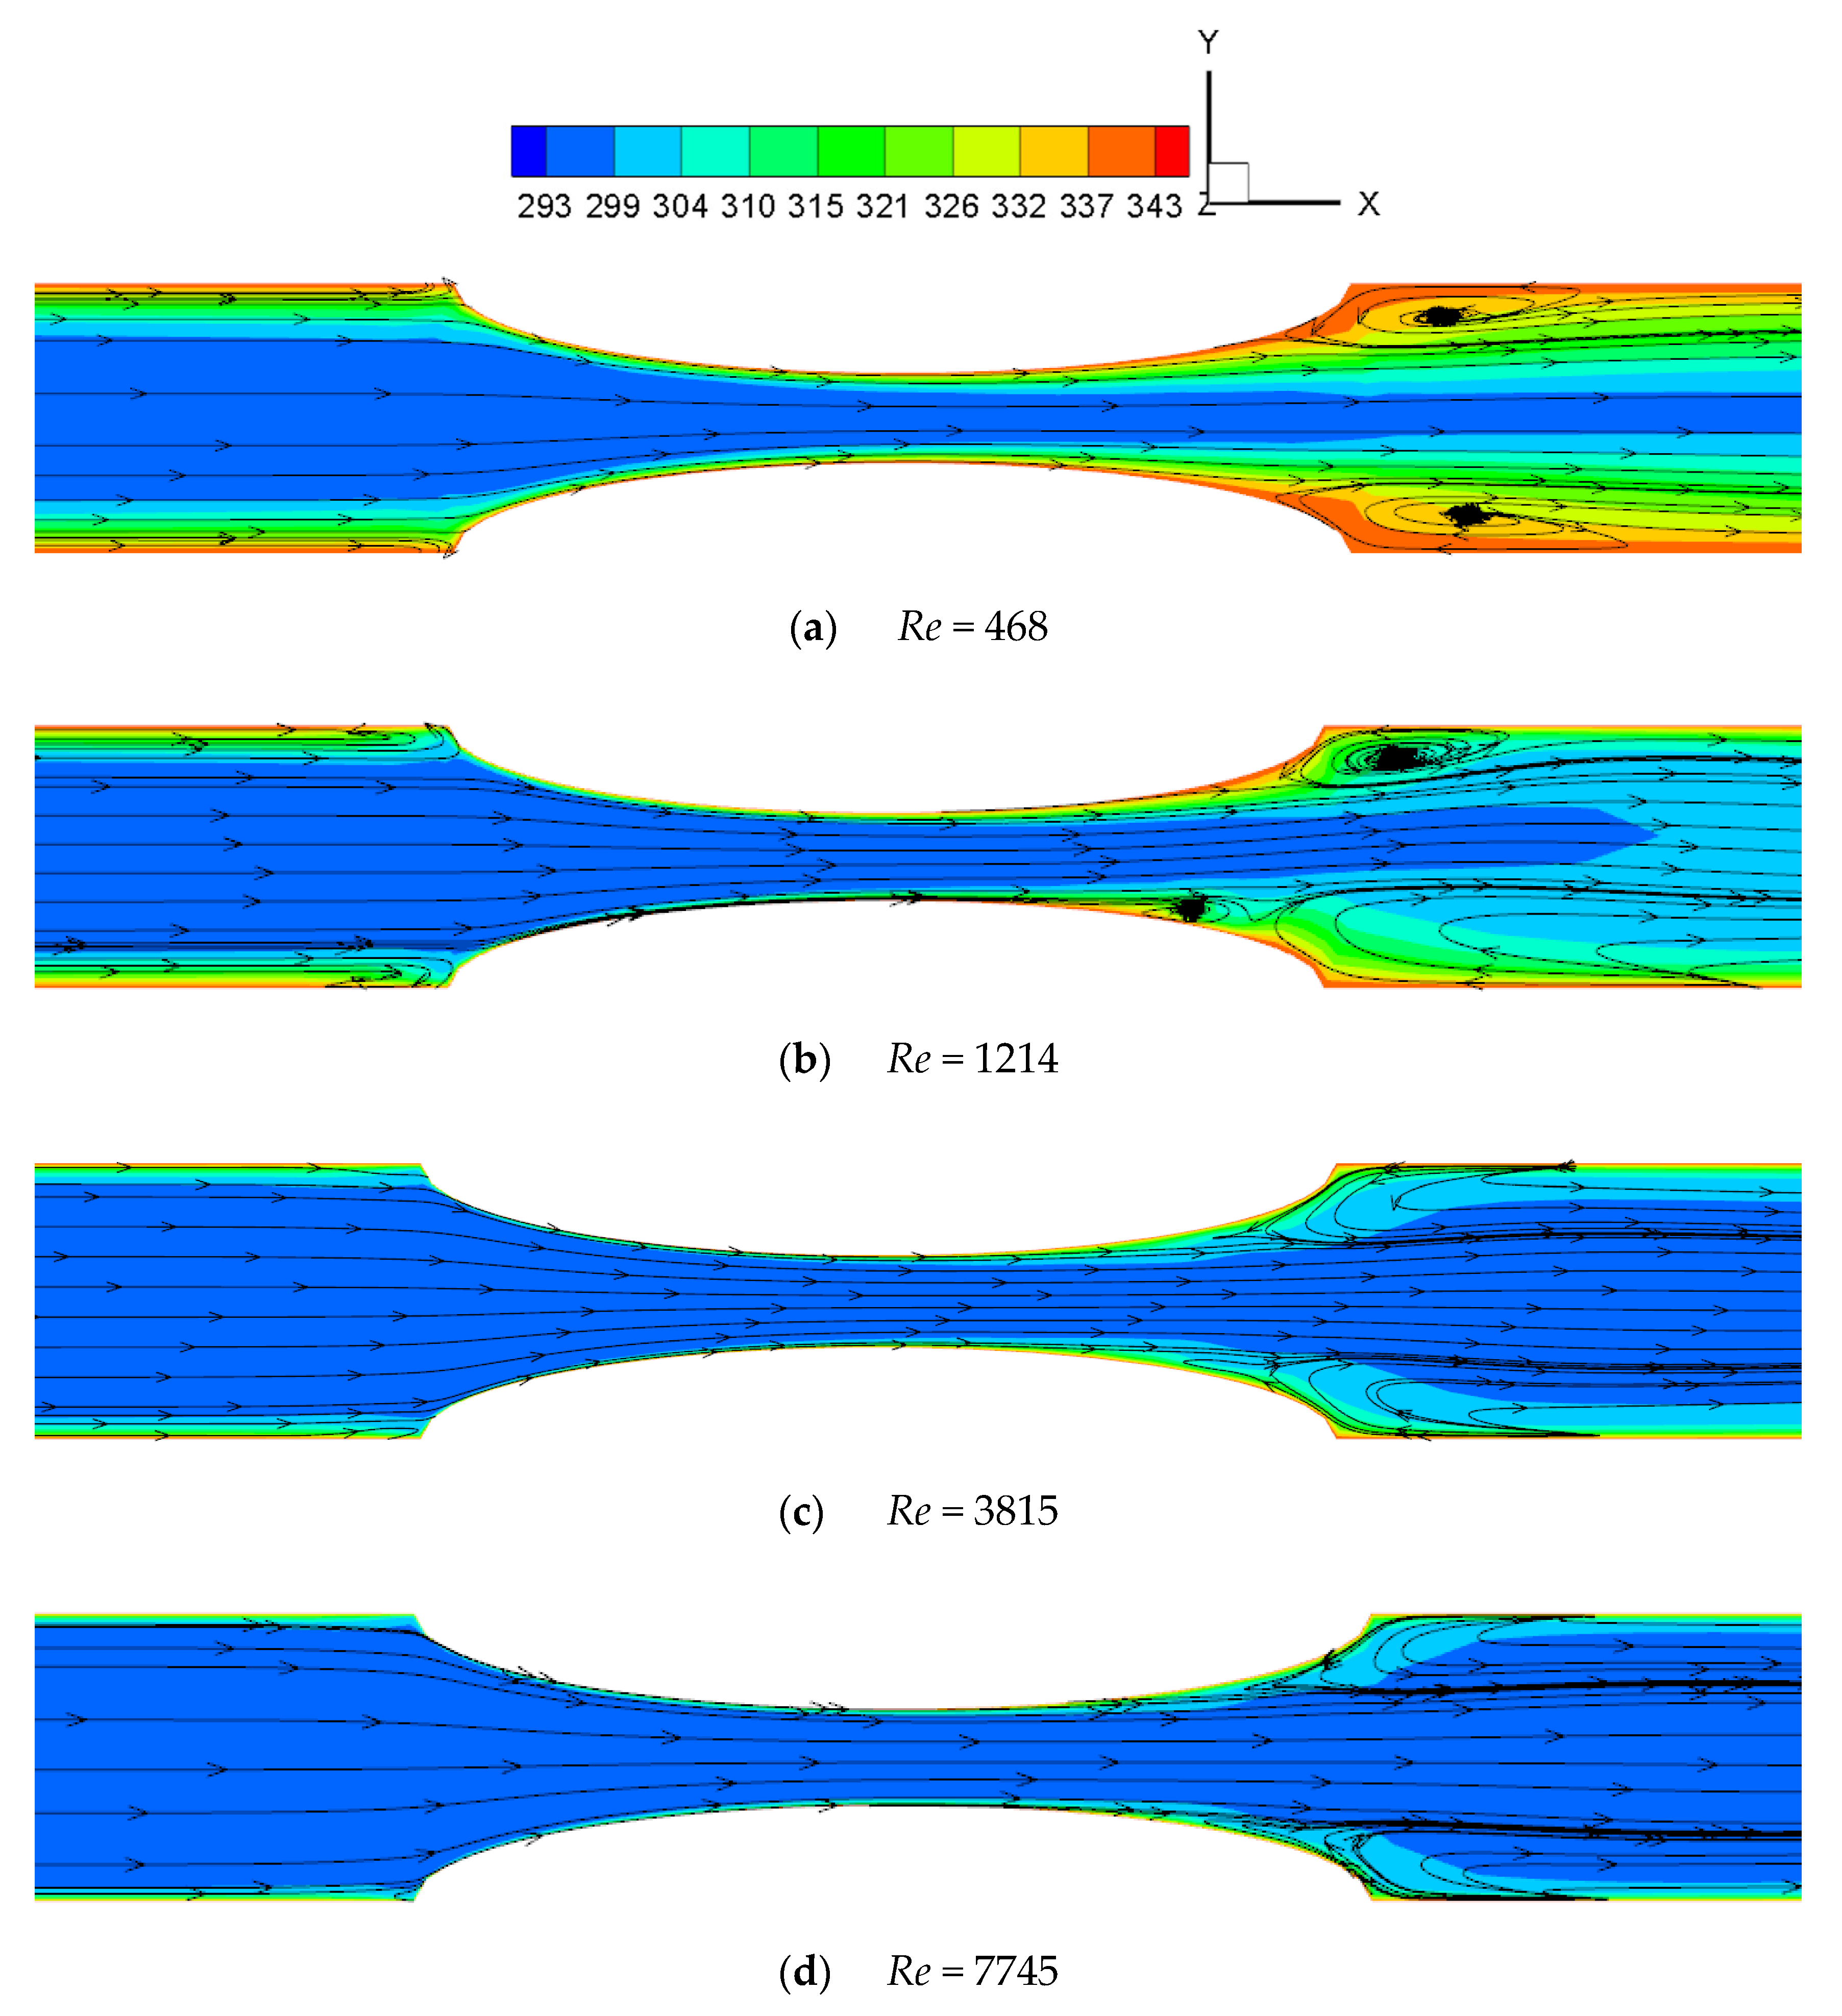
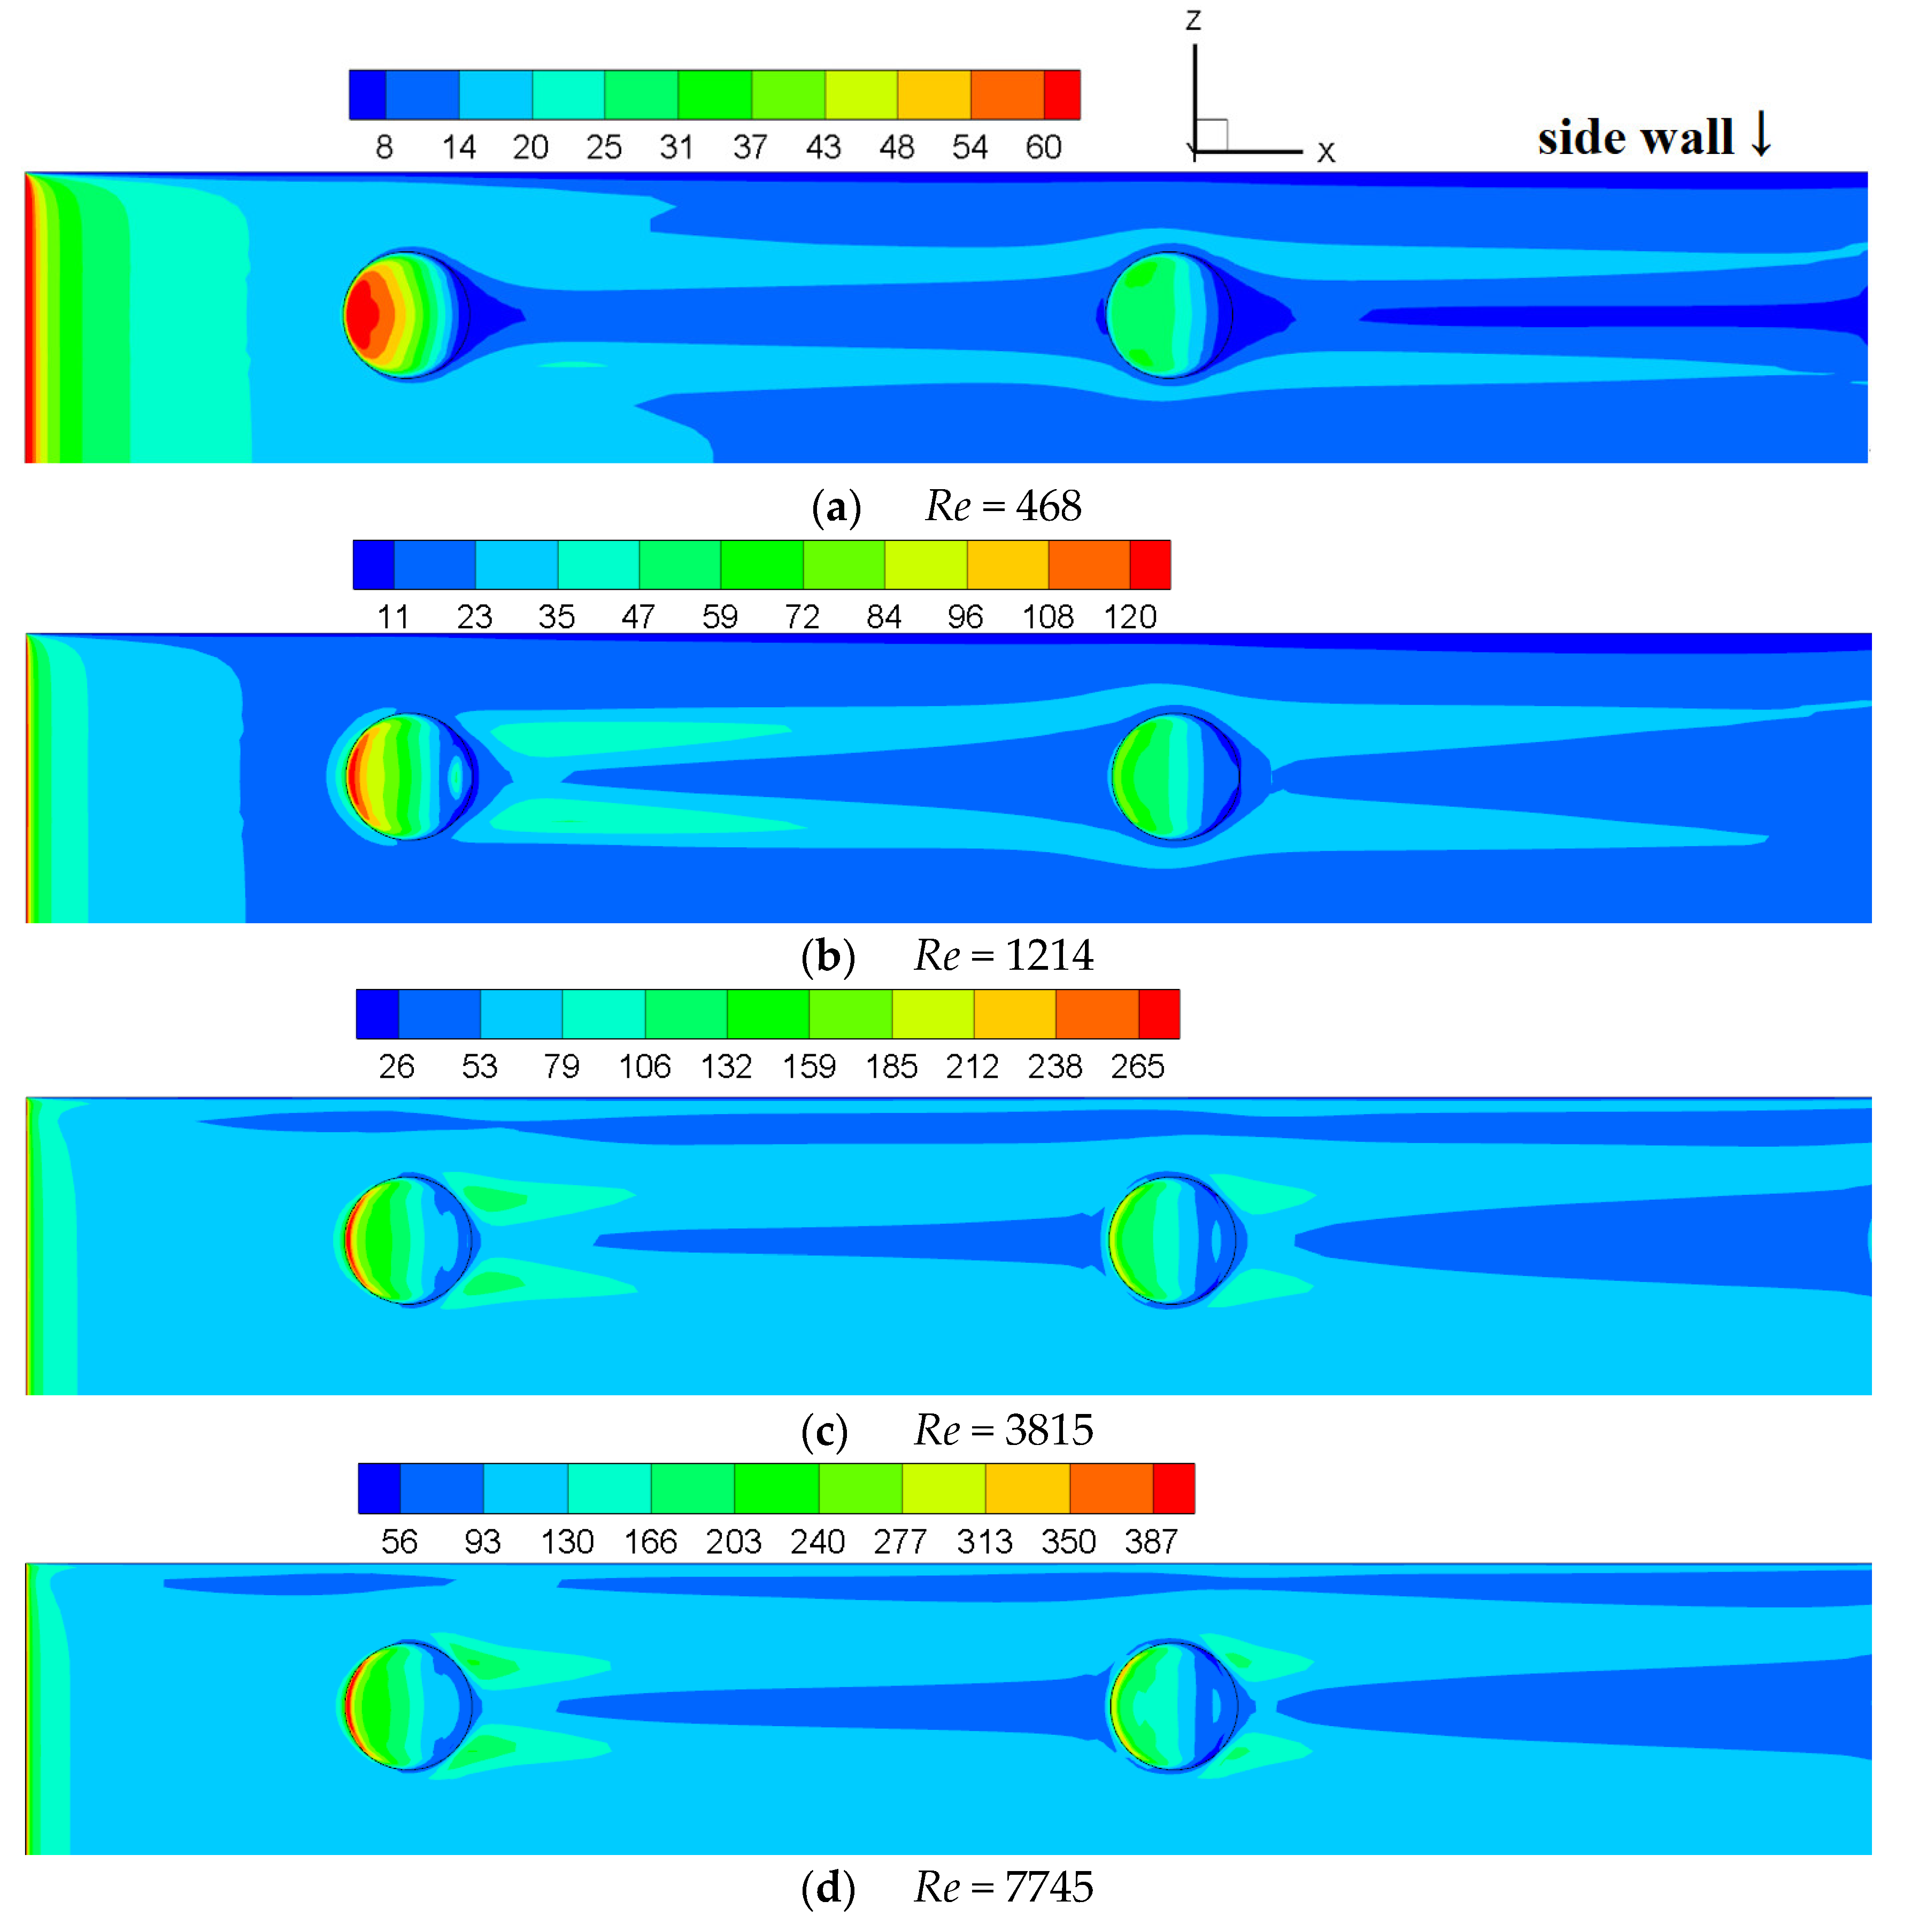
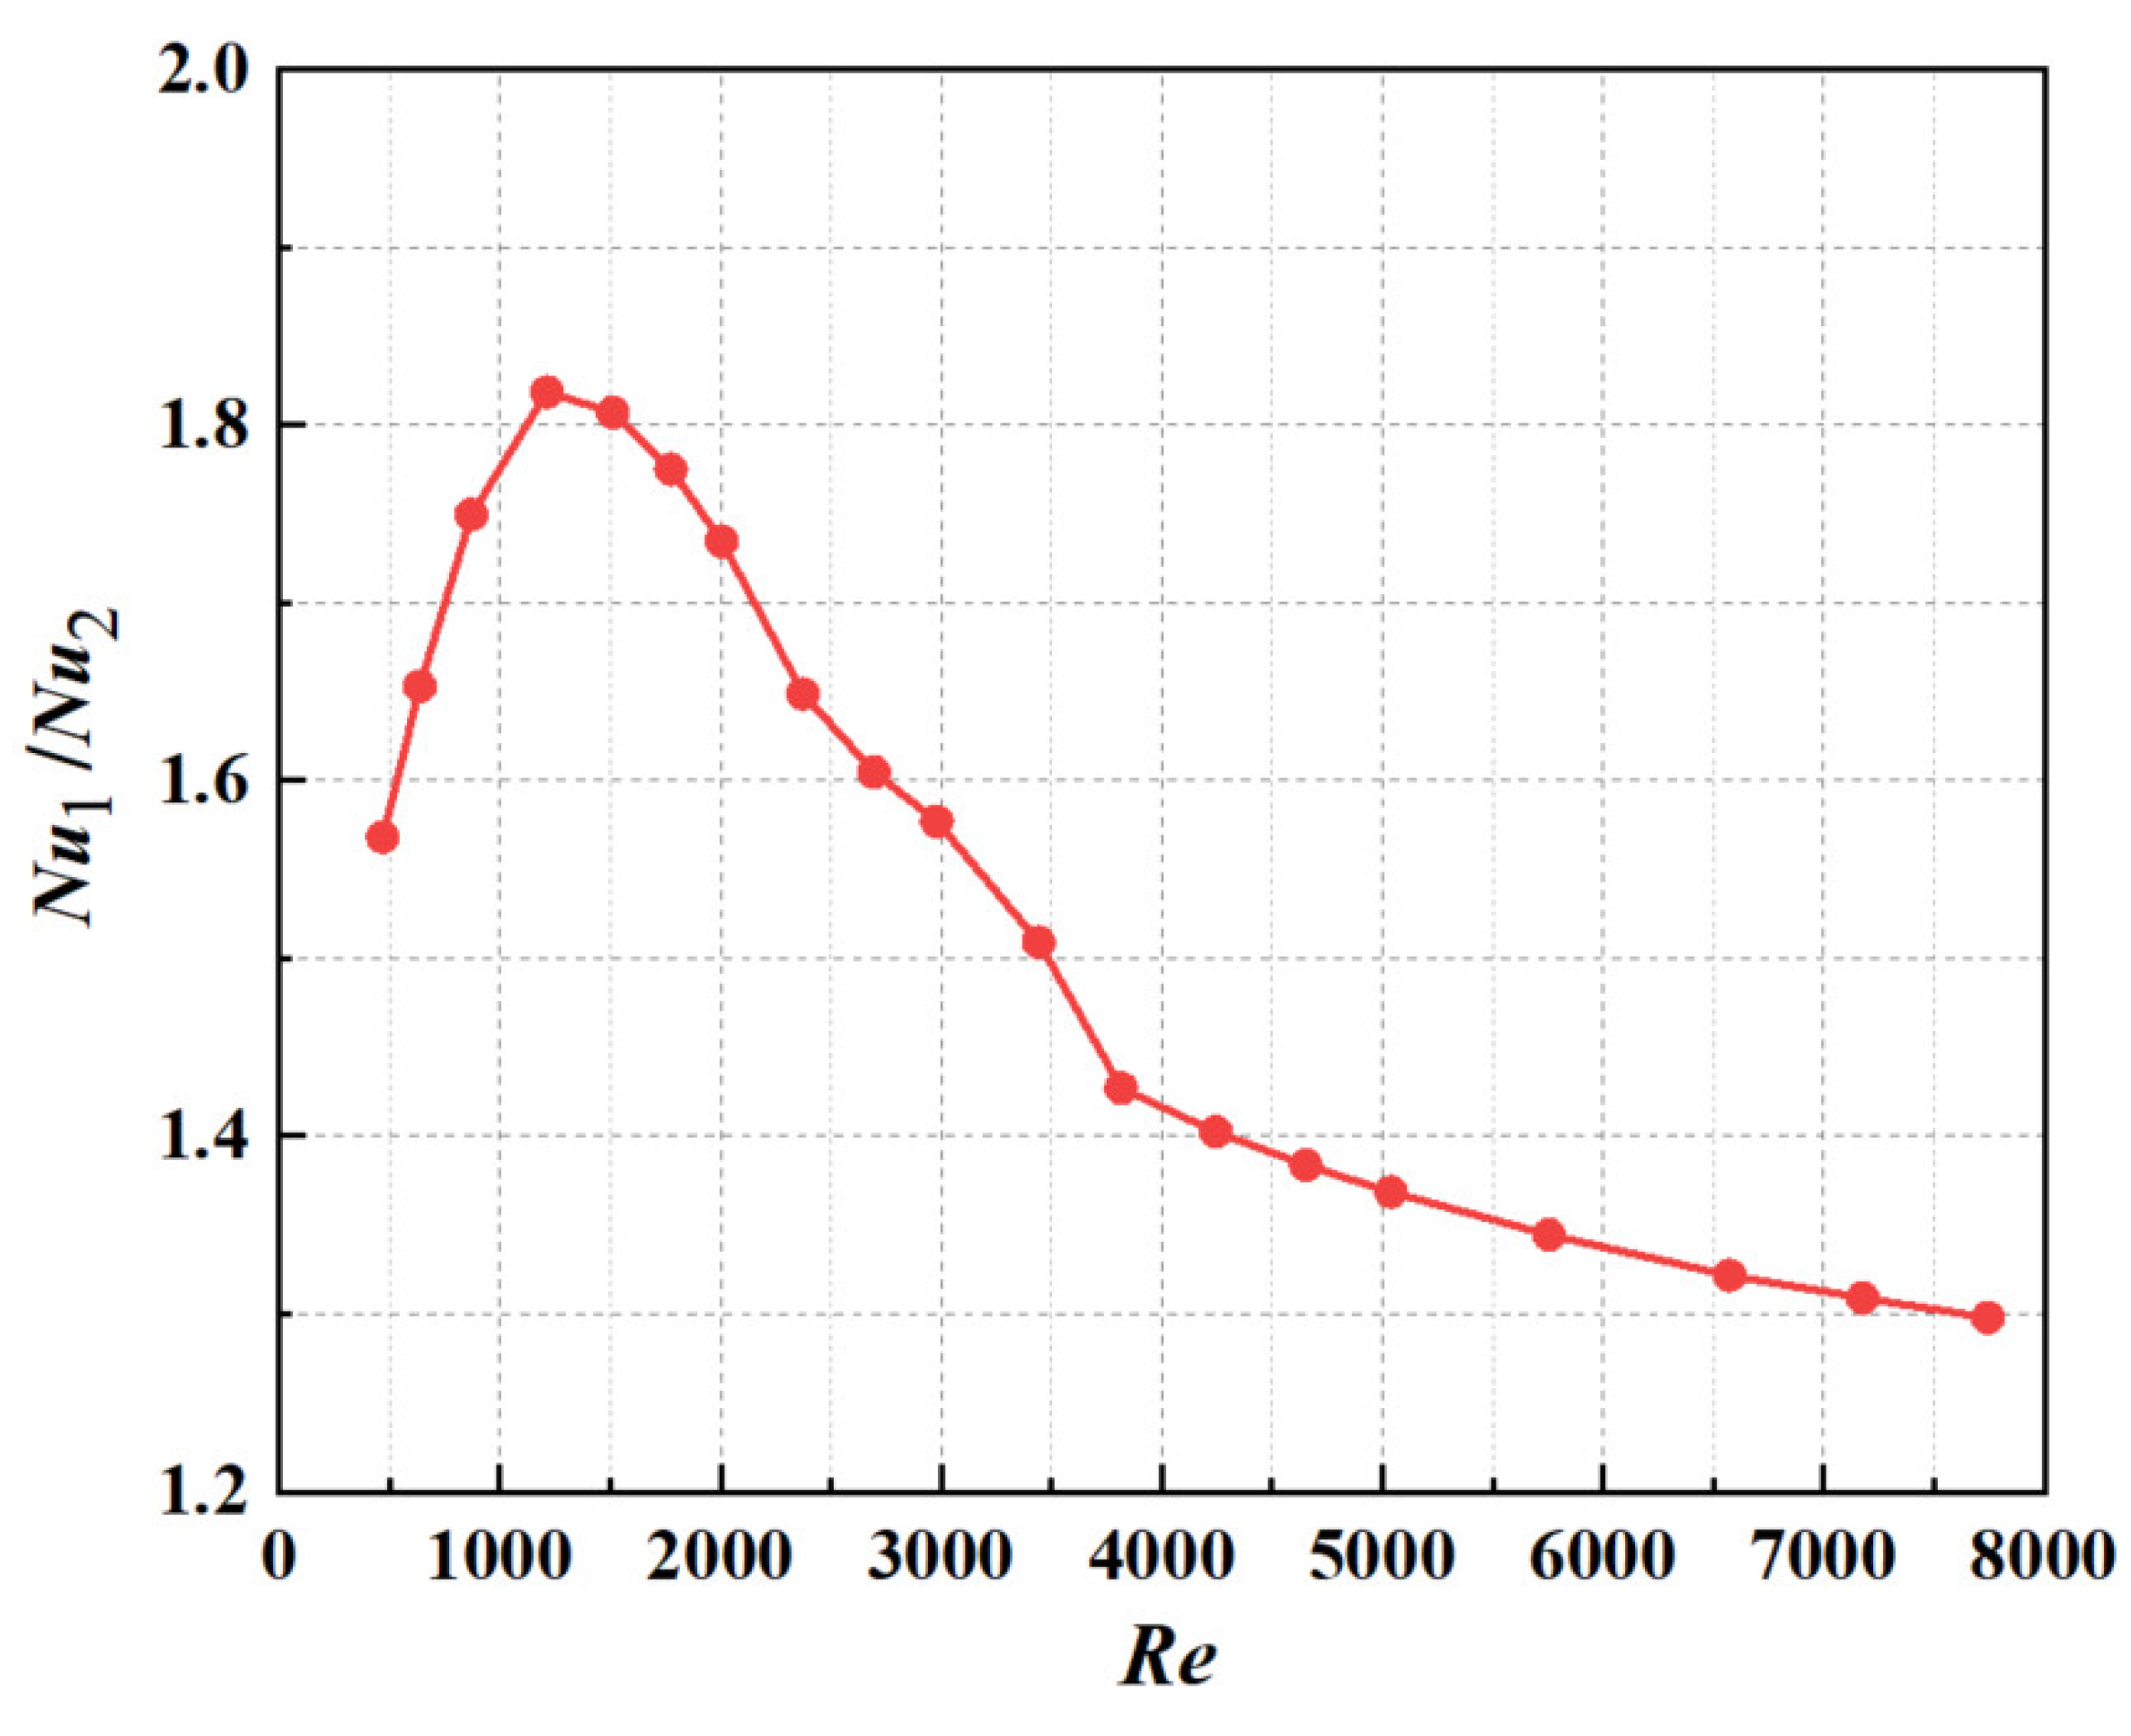
  • In the roughened channel, the flow and heat transfer laws change at Re = 1214, 2374, 3815. When Re < 1214, the turbulence formed by the protrusion is almost all behind it and does not spread to both sides. When 1214 < Re < 2374, the turbulence caused by the protrusions gradually spreads to the middle and both sides of the channel with the increase in Re. When 2374 < Re < 3815, the turbulence caused by the two columns of protrusions meets in the middle of the channel and forms stronger turbulence downstream. When Re > 3815, the flow in the channel is all turbulent. In addition, the Coanda effect exists when Re < 3815, and is the most significant when 1214 < Re < 2374. The Coanda effect causes asymmetry in flow and heat transfer. Users should pay attention to the different heat transfer behaviors near the protrusions at different Re.
  • Near the side wall, there is an area that is significantly affected by the three wall shear stresses and where the eddy viscosity is larger. Near this area, the boundary layer is thicker and the heat transfer is weaker. If the uniformity of heat transfer is pursued in similar microchannels, it is recommended to appropriately adjust the perpendicular corner to a rounded corner or other forms.
  • The thermal entropy generation rate and frictional entropy generation rate of the smooth and roughened channels both increase with the Reynolds number, and the presence of protrusions does not reduce the irreversibility of heat transfer and friction.
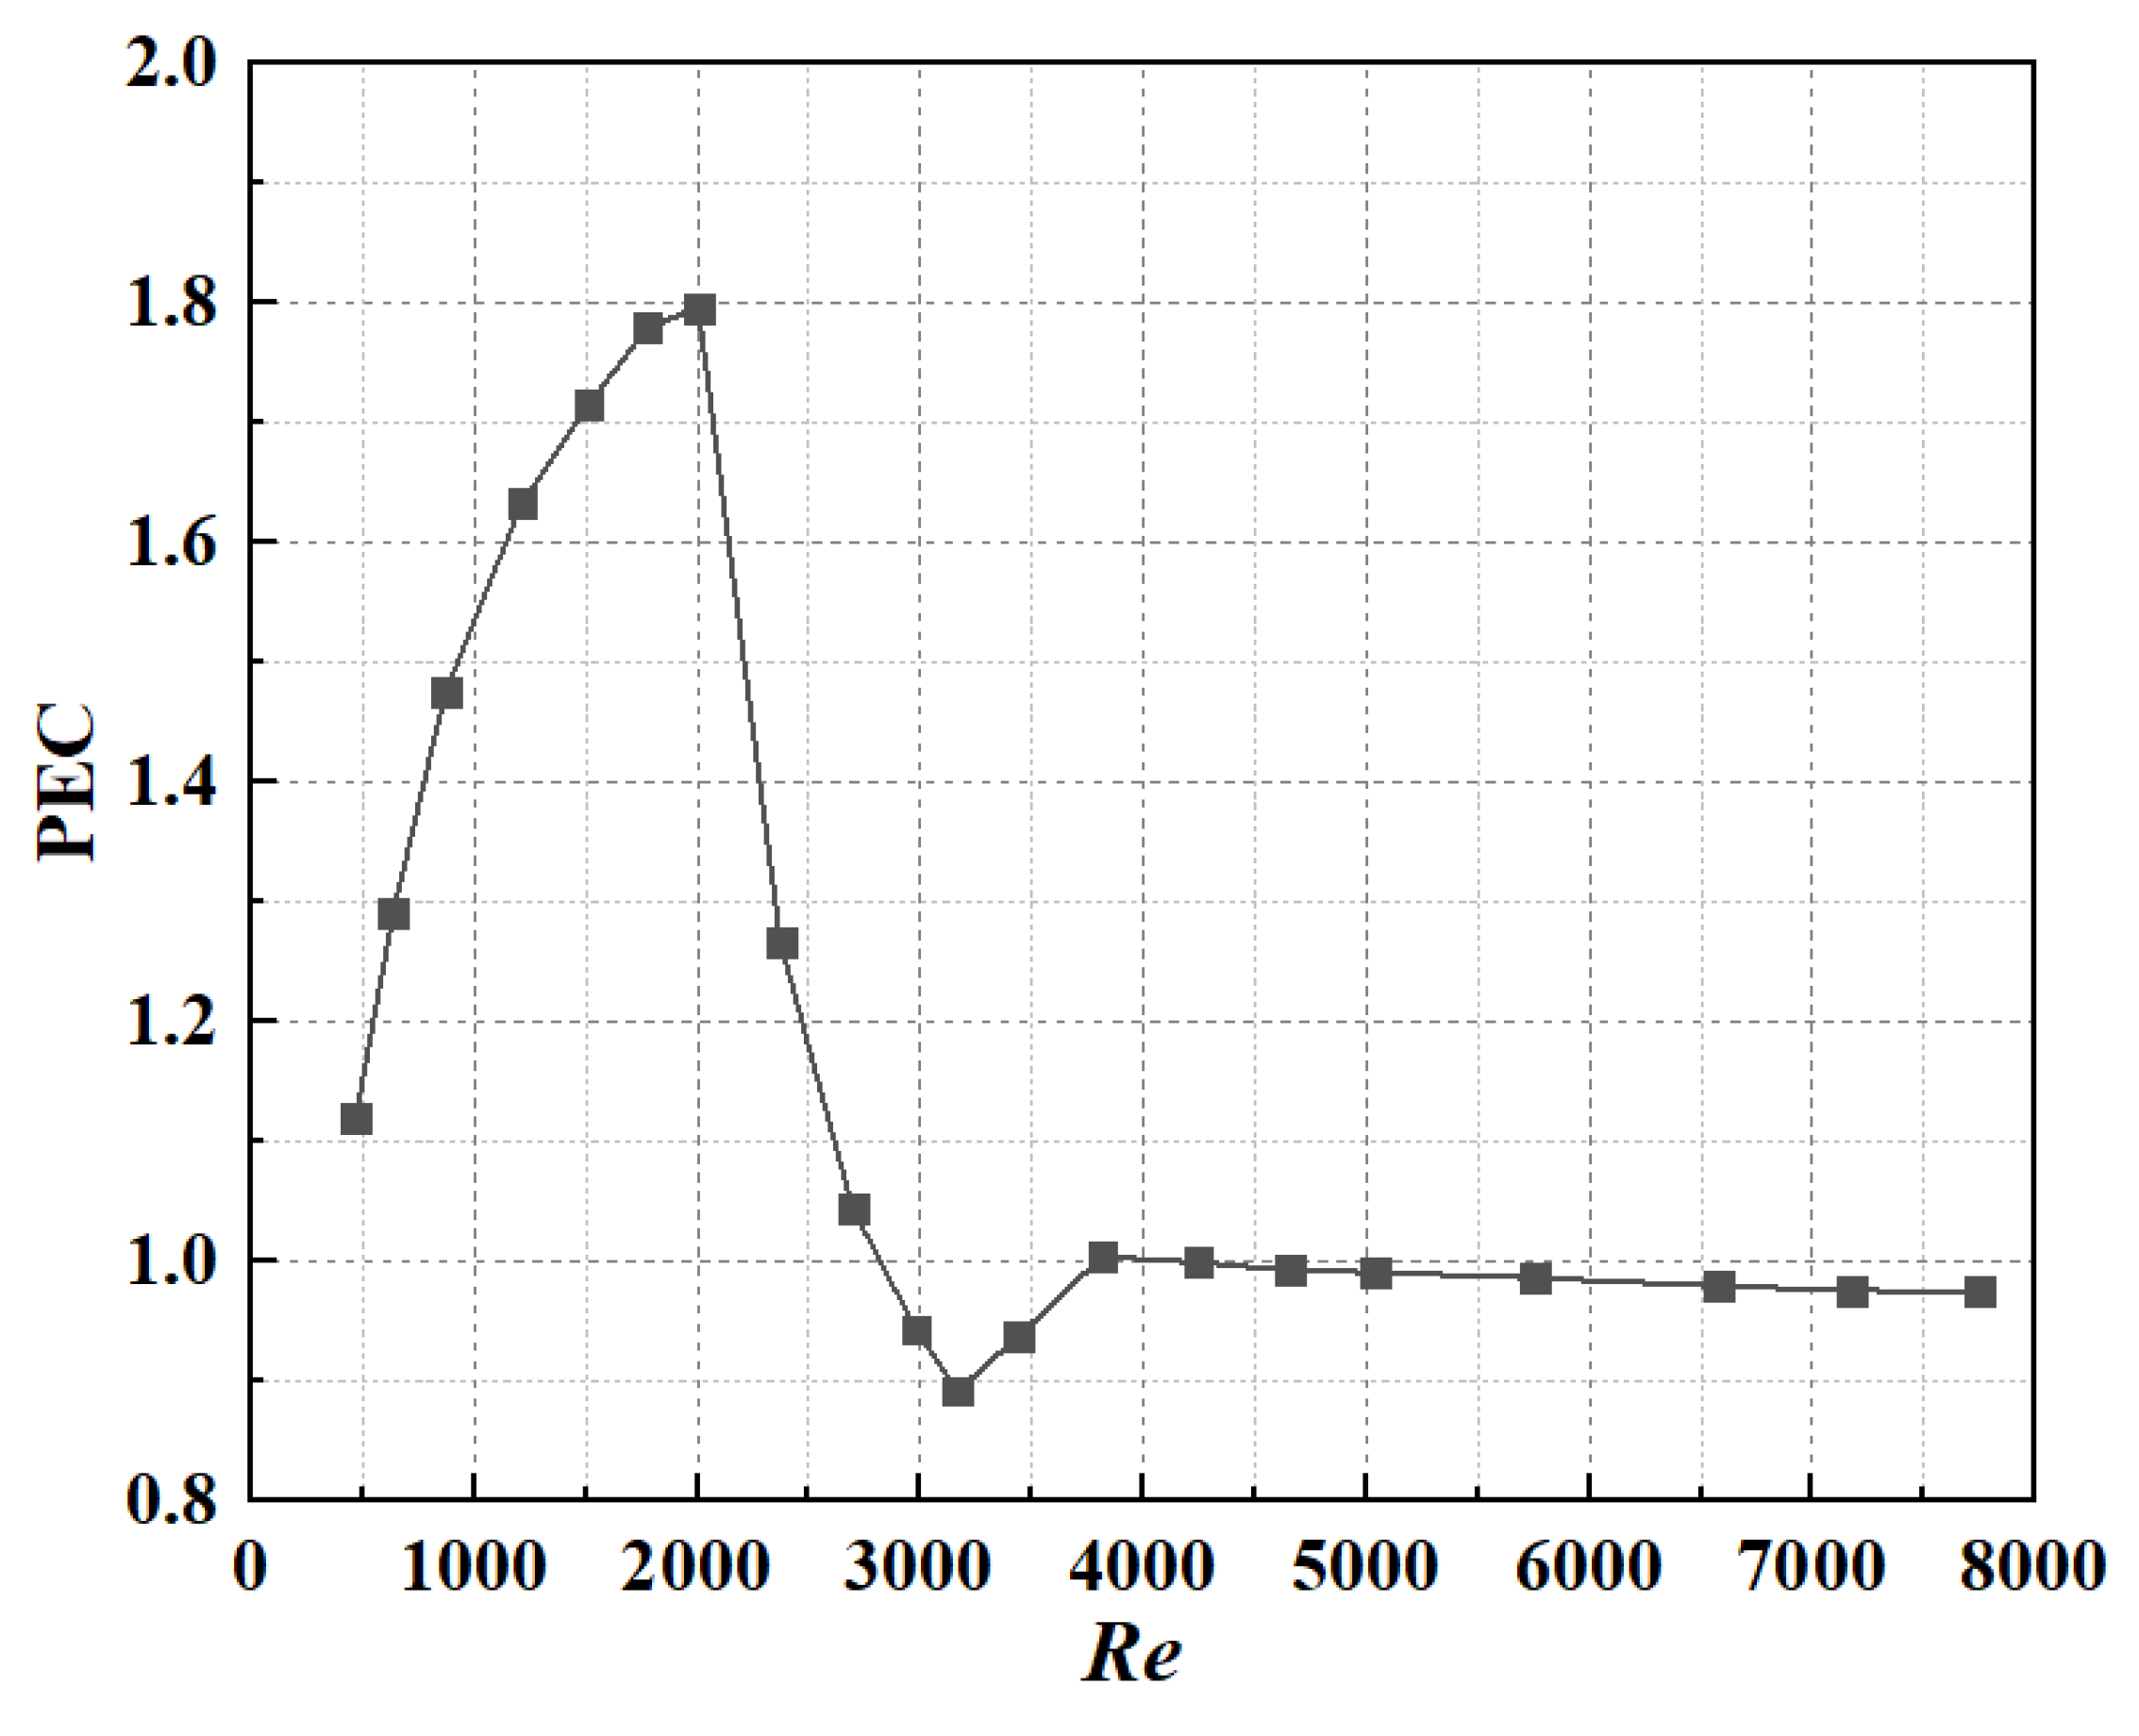
  • The performance evaluation criteria (PEC) increases first and then decreases with Re. The maximum PEC is 1.80 when Re = 2004. From the perspective of comprehensive heat transfer, it is recommended to use this roughened channel when the Reynolds number is less than 2696, so that the PEC is greater than 1.
In this work, there are still issues that need to be further discussed and explored in future work, such as the way the semi-ellipsoids are placed, the distance between the adjacent semi-ellipsoids, the geometric parameters of the semi-ellipsoids, etc. Additionally, the employment of the Coanda effect in microchannels is also worth exploring and can contribute to the development of the microchannel flow and heat transfer.

Author Contributions

Conceptualization, H.S.; Data curation, H.M.; Investigation, H.F.; Methodology, H.F.; Project administration, H.S.; Software, L.Y. and H.M.; Writing—original draft, H.F.; Writing—review & editing, Y.L.; Formal analysis, F.M.; Supervision, F.M. All authors have read and agreed to the published version of the manuscript.

Funding

This research was funded by [Key Laboratory of Thermal Science and Power Engineering of Ministry of Education], [National Science and Technology Major Project] grant number [Y2019-VIII-0013-0174], and [National Science and Technology Major Project] grant number [2017-V-0012-0064]. And The APC was funded by [National Science and Technology Major Project] grant number [Y2019-VIII-0013-0174].

Acknowledgments

This work is financially supported by [Key Laboratory of Thermal Science and Power Engineering of Ministry of Education], [National Science and Technology Major Project] grant number [Y2019-VIII-0013-0174], and [National Science and Technology Major Project] grant number [2017-V-0012-0064].

Conflicts of Interest

The authors declare no conflict of interest.

Nomenclature

athe width of the microchannel, mmPECperformance evaluation criteria, -
bthe height of the microchannel, mmReReynolds number, R e = u in D h v , -
Cpspecific heat, J kg−1·K−1Sgtotal entropy production rate, W K−1
Dthe diameter of protrusions, mmSg, viscousfrictional entropy production rate, W K−1
Dhhydraulic diameter of the channel, mmSg, thermalthermal entropy production rate, W K−1
ffriction factor, -Ttemperature, K
ffriction factor when Lin = 480, -uinthe average velocity of the entrance,
m s−1
Hthe depth of protrusions, mmUmaxmaximum value of velocity, m s−1
hthe surface heat transfer coefficient,
W m−2 K−1
X, Y, Zdimensional directions, -
kturbulent kinetic energy, m2 s−2x, y, zdimensional coordinates, mm
lnondimensionalized length of the channel, -Greek
linnondimensionalized length of the inlet section, -αaspect ratio, α = b / a , -
Lthe length of the microchannel, mmεdissipation rate of turbulent kinetic energy, -
L1the distance between two rows of pits in the direction of flow, mmρdensity, kg m−3
L2the distance between two rows of pits in the vertical direction of flow, mmμdynamic viscosity, kg m−1 s−1
L3the distance between the first pit and the entrance, mmμteddy viscosity, kg m−1 s−1
Linthe length of inlet section, mmμ0nondimensionalized eddy viscosity, -
Loutthe length of outlet section, mmνkinematic viscosity, m s−2
NuNusselt number, -λthe thermal conductivity, W m−1 K−1
Nu1Nusselt number of protrusions, -Superscripts and subscripts
Nu2Nusselt number of primary walls, -time-averaged
Nnondimensional total entropy production rate, -aveaverage value
Nviscousnondimensional frictional entropy production rate, -ininlet
Nthermalnondimensional thermal entropy production rate, -xlocal
ΔPthe pressures difference between the inlet and outlet, Pawwall
PrPrandtl number, -0smooth channel
Prtturbulent Prandtl number, -

References

  1. Tuckerman, D.B.; Pease, R.F.W. High-performance heat sinking for VLSI. IEEE Electron Device Lett. 1981, 2, 126–129. [Google Scholar] [CrossRef]
  2. Bunker, R.S. Gas turbine cooling: Moving from macro to micro cooling. Turbo Expo: Power for Land, Sea, and Air. Am. Soc. Mech. Eng. 2013, 55164, V03CT14A002. [Google Scholar] [CrossRef]
  3. Mehendale, S.S.; Jacobi, A.M.; Shah, R.K. Fluid Flow and Heat Transfer at Micro- and Meso-Scales with Application to Heat Exchanger Design. Appl. Mech. Rev. 2000, 53, 175–193. [Google Scholar] [CrossRef]
  4. Kandlikar, S.G.; Grande, W.J. Evolution of microchannel flow passages—thermohydraulic performance and fabrication technology. Heat Transf. Eng. 2003, 24, 3–17. [Google Scholar] [CrossRef]
  5. Celata, G.P. Heat Transfer and Fluid Flow in Microchannels; Begell House: New York, NY, USA, 2004. [Google Scholar]
  6. Peng, X.F.; Peterson, G.P.; Wang, B.X. Frictional Flow Characteristics of Water Flowing through Rectangular Microchannels. Exp. Heat Transf. 1994, 7, 249–264. [Google Scholar] [CrossRef]
  7. Peng, X.F.; Peterson, G.P.; Wang, B.X. Heat Transfer Characteristics of Water Flowing through Microchannels. Exp. Heat Transf. 1994, 7, 265–283. [Google Scholar] [CrossRef]
  8. Popescu, A.; Welty, J.R.; Pfund, D.; Rector, D. Thermal measurements in rectangular microchannels. In Proceedings of the ASME 2002 International Mechanical Engineering Congress and Exposition, New Orleans, LA, USA, 17–22 November 2002; pp. 277–284. [Google Scholar] [CrossRef]
  9. Zhang, J.; Diao, Y.H.; Zhao, Y.H.; Zhang, Y.N. An experimental study of the characteristics of fluid flow and heat transfer in the multiport microchannel flat tube. Appl. Therm. Eng. 2014, 65, 209–218. [Google Scholar] [CrossRef]
  10. Gao, P.; Le Person, S.; Favre-Marinet, M. Scale effects on hydrodynamics and heat transfer in two-dimensional mini and microchannels. Int. J. Therm. Sci. 2002, 41, 1017–1027. [Google Scholar] [CrossRef] [Green Version]
  11. Qu, W. Experimental and numerical study of pressure drop and heat transfer in a single-phase micro-channel heat sink. Int. J. Heat Mass Transf. 2002, 45, 2549–2565. [Google Scholar] [CrossRef]
  12. Toh, K.C.; Chen, X.Y.; Chai, J.C. Numerical computation of fluid flow and heat transfer in microchannels. Int. J. Heat Mass Transf. 2002, 45, 5133–5141. [Google Scholar] [CrossRef]
  13. Judy, J.; Maynes, D.; Webb, B.W. Characterization of frictional pressure drop for liquid flows through microchannels. Int. J. Heat Mass Transf. 2002, 45, 3477–3489. [Google Scholar] [CrossRef]
  14. Lee, P.-S.; Garimella, S.V.; Liu, D. Investigation of heat transfer in rectangular microchannels. Int. J. Heat Mass Transf. 2005, 48, 1688–1704. [Google Scholar] [CrossRef] [Green Version]
  15. Liu, D.; Garimella, S.V. Investigation of Liquid Flow in Microchannels. J. Thermophys. Heat Transf. 2004, 18, 65–72. [Google Scholar] [CrossRef] [Green Version]
  16. Xu, B.; Ooti, K.T.; Wong, N.T.; Choi, W.K. Experimental investigation of flow friction for liquid flow in microchannels. Int. J. Heat Mass Transf. 2000, 27, 1165–1176. [Google Scholar] [CrossRef]
  17. Morini, G.L. Scaling effects for liquid flows in microchannels. Heat Transf. Eng. 2006, 27, 64–73. [Google Scholar] [CrossRef]
  18. Rosa, P.; Karayiannis, T.G.; Collins, M.W. Single-phase heat transfer in microchannels: The importance of scaling effects. Appl. Therm. Eng. 2009, 29, 3447–3468. [Google Scholar] [CrossRef] [Green Version]
  19. Mokrani, O.; Bourouga, B.; Castelain, C.; Peerhossaini, H. Fluid flow and convective heat transfer in flat microchannels. Int. J. Heat Mass Transf. 2009, 52, 1337–1352. [Google Scholar] [CrossRef]
  20. Sahar, A.M.; Özdemir, M.R.; Fayyadh, E.M.; Wissink, J.; Mahmoud, M.M.; Karayiannis, T.G. Single phase flow pressure drop and heat transfer in rectangular metallic microchannels. Appl. Therm. Eng. 2016, 93, 1324–1336. [Google Scholar] [CrossRef]
  21. Moharana, M.K.; Singh, P.K.; Khandekar, S. Optimum Nusselt Number for Simultaneously Developing Internal Flow Under Conjugate Conditions in a Square Microchannel. J. Heat Transf. 2012, 134, 149–169. [Google Scholar] [CrossRef]
  22. Fedorov, A.G.; Viskanta, R. Three-dimensional conjugate heat transfer in the microchannel heat sink for electronic packaging. Int. J. Heat Mass Transf. 2000, 43, 399–415. [Google Scholar] [CrossRef]
  23. Gamrat, G.; Favre-Marinet, M.; Asendrych, D. Conduction and entrance effects on laminar liquid flow and heat transfer in rectangular microchannels. Int. J. Heat Mass Transf. 2005, 48, 2943–2954. [Google Scholar] [CrossRef] [Green Version]
  24. Sahar, A.M.; Wissink, J.; Mahmoud, M.M.; Karayiannis, T.G.; Ashrul Ishak, M.S. Effect of hydraulic diameter and aspect ratio on single phase flow and heat transfer in a rectangular microchannel. Appl. Therm. Eng. 2017, 115, 793–814. [Google Scholar] [CrossRef]
  25. Kandlikar, S.; Garimella, S.; Li, D.; Colin, S.; King, M.R. Heat Transfer and Fluid Flow in Minichannels and Microchannels; Elsevier: Amsterdam, The Netherlands, 2005. [Google Scholar]
  26. Rohsenow, W.M.; Hartnett, J.P.; Cho, Y.I. Handbook of Heat Transfer; McGraw-Hill: New York, NY, USA, 1998. [Google Scholar]
  27. Xu, M.; Lu, H.; Gong, L.; Chai, J.C.; Duan, X. Parametric numerical study of the flow and heat transfer in microchannel with dimples. Int. J. Heat Mass Transf. 2016, 76, 348–357. [Google Scholar] [CrossRef] [Green Version]
  28. Ligrani, P.M.; Harrison, J.L.; Mahmmod, G.I.; Hill, M.L. Flow structure due to dimple depressions on a channel surface. Phys. Fluids 2001, 13, 3442–3451. [Google Scholar] [CrossRef]
  29. Burgess, N.K.; Oliveira, M.M.; Ligrani, P.M. Nusselt Number Behavior on Deep Dimpled Surfaces within a Channel. J. Heat Transf. 2003, 125, 11–18. [Google Scholar] [CrossRef]
  30. Won, S.Y.; Ligrani, P.M. Numerical predictions of flow structure and local nusselt number ratios along and above dimpled surfaces with different dimple depths in a channel. Numer. Heat Transf. 2004, 46, 549–570. [Google Scholar] [CrossRef]
  31. Burgess, N.K.; Ligrani, P.M. Effects Of Dimple Depth on Channel Nusselt Numbers and Friction Factors. J. Heat Transf. 2005, 127, 839–847. [Google Scholar] [CrossRef]
  32. Park, J.; Ligrani, P.M. Numerical predictions of heat transfer and fluid flow characteristics for seven different dimpled surfaces in a channel. Numer. Heat Transf. 2005, 47, 209–232. [Google Scholar] [CrossRef]
  33. Elyyan, M.A.; Rozati, A.; Tafti, D.K. Investigation of dimpled fins for heat transfer enhancement in compact heat exchangers. Int. J. Heat Mass Transf. 2008, 51, 2950–2966. [Google Scholar] [CrossRef]
  34. Wei, X.J.; Joshi, Y.K.; Ligrani, P.M. Numerical Simulation of Laminar Flow and Heat Transfer Inside a Microchannel with One Dimpled Surface. J. Electron. Packag. 2007, 129, 63–70. [Google Scholar] [CrossRef]
  35. Isaev, S.A.; Kornev, N.V.; Leontiev, A.I.; Hassel, E. Influence of the Reynolds number and the spherical dimple depth on turbulent heat transfer and hydraulic loss in a narrow channel—ScienceDirect. Int. J. Heat Mass Transf. 2010, 53, 178–197. [Google Scholar] [CrossRef]
  36. Mahmood, G.I.; Ligrani, P.M.; Sabbagh, M.Z. Heat Transfer in a Channel with Dimples and Protrusions on Opposite Walls. J. Thermophys. Heat Transf. 2012, 15, 275–283. [Google Scholar] [CrossRef]
  37. Lee, J.; Lee, K.S. Correlations and shape optimization in a channel with aligned dimples and protrusions. Int. J. Heat Mass Transf. 2013, 64, 444–451. [Google Scholar] [CrossRef]
  38. Lan, J.; Xie, Y.; Di, Z. Flow and Heat Transfer in Microchannels With Dimples and Protrusions. J. Heat Transf. 2012, 134, 021901. [Google Scholar] [CrossRef]
  39. Xie, Y.; Qu, H.; Zhang, D. Numerical investigation of flow and heat transfer in rectangular channel with teardrop dimple/protrusion. Int. J. Heat Mass Transf. 2015, 84, 486–496. [Google Scholar] [CrossRef]
  40. Terzis, A.; Wagner, G.; von Wolfersdorf, J.; Ott, P.; Weigand, B. Hole staggering effect on the cooling performance of narrow impingement channels using the transient liquid crystal technique. J. Heat Transf. 2014, 136, 071701. [Google Scholar] [CrossRef]
  41. Boyce, M.P. Gas Turbine Engineering Handbook; Elsevier: Amsterdam, The Netherlands, 2011. [Google Scholar]
  42. Javadi, P.; Rashidi, S.; Esfahani, J.A. Effects of rib shapes on the entropy generation in a ribbed duct. J. Thermophys. Heat Transf. 2018, 32, 691–701. [Google Scholar] [CrossRef]
  43. Drikakis, D.; Frank, M.; Tabor, G. Multiscale Computational Fluid Dynamics. Energies 2019, 12, 3272. [Google Scholar] [CrossRef] [Green Version]
  44. Shah, R.K.; London, A.L. Laminar Flow Forced Convection in Ducts; Supplement to Advances in Heat Transfer; Elsevier Science Publishers: New York, NY, USA, 1978. [Google Scholar]
  45. Cioncolini, A.; Santini, L. An experimental investigation regarding the laminar to turbulent flow transition in helically coiled pipes. Exp. Therm. Fluid Sci. 2006, 30, 367–380. [Google Scholar] [CrossRef]
  46. Gnielinski, V. New equations for heat and mass transfer in turbulent pipe and channel flow. Int. Chem. Eng. 1976, 16, 359–368. [Google Scholar]
  47. Bourque, C.; Newman, B.G. Reattachment of a Two-Dimensional, Incompressible Jet to an Adjacent Flat Plate. Aeron Q. 1960, 11, 201–232. [Google Scholar] [CrossRef]
  48. Rathore, S.K.; Das, M.K. Comparison of two low-Reynolds number turbulence models for fluid flow study of wall bounded jets. Int. J. Heat Mass Transf. 2013, 61, 365–380. [Google Scholar] [CrossRef]
Figure 1. Subsurface micro cooling with rectangular microchannels [5].
Energies 15 04927 g001
Figure 2. Test section of the microchannel without protrusions.
Energies 15 04927 g002
Figure 3. Microchannels with and without protrusions (smooth and roughened channels).
Energies 15 04927 g003
Figure 4. Geometric parameters of the microchannel with protrusions.
Energies 15 04927 g004
Figure 5. Turbulence model validation.
Energies 15 04927 g005
Figure 6. Transition model validation.
Energies 15 04927 g006
Figure 7. Variation in the normalized friction factor with the length of the inlet section.
Energies 15 04927 g007
Figure 8. Variation in the friction factor with the Reynolds number.
Energies 15 04927 g008
Figure 9. Variation in the Nusselt number with the Reynolds number.
Energies 15 04927 g009
Figure 10. Nusselt number contours on the primary wall.
Energies 15 04927 g010
Figure 11. Dimensionless velocity magnitude contours on the middle cross section.
Energies 15 04927 g011
Figure 12. Dimensionless turbulent kinetic energy contours on the middle cross section.
Energies 15 04927 g012
Figure 13. Dimensionless turbulent kinetic energy along the x coordinate.
Energies 15 04927 g013
Figure 14. The middle cross section of the channel in the X direction, and the centerlines in the Z and Y directions on it.
Energies 15 04927 g014
Figure 15. Velocity and Reynolds shear stress component distribution on Z direction centerline.
Energies 15 04927 g015
Figure 16. Velocity and Reynolds shear stress component distribution on Y direction centerline.
Energies 15 04927 g016
Figure 17. Nondimensional velocity magnitude contours on the middle cross section.
Energies 15 04927 g017
Figure 18. Nondimensional temperature contours on the middle cross section.
Energies 15 04927 g018
Figure 19. Nondimensional eddy viscosity contours on the middle cross section.
Energies 15 04927 g019
Figure 20. Variation in friction factor with Reynolds number.
Energies 15 04927 g020
Figure 21. Variation in Nusselt number with Reynolds number.
Energies 15 04927 g021
Figure 22. Eddy viscosity on the centerline of the roughened channel in the X direction.
Energies 15 04927 g022
Figure 23. Nondimensional turbulent kinetic energy contours on the middle cross section.
Energies 15 04927 g023
Figure 24. 3D streamline distribution with (b) and without (a) velocity magnitude contour near protrusion (unit: m·s−1).
Energies 15 04927 g024
Figure 25. Middle and tail sections of the protrusion.
Energies 15 04927 g025
Figure 26. Temperature contours and streamlines on the middle section of protrusion (unit: K).
Energies 15 04927 g026
Figure 27. Temperature contours and streamlines on the tail section of protrusion (unit: K).
Energies 15 04927 g027
Figure 28. Nusselt number contours on the primary wall and the first and second rows of protrusions.
Energies 15 04927 g028
Figure 29. Nusselt number ratio of the protrusions to the primary wall as a function of Reynolds number.
Energies 15 04927 g029
Figure 30. Variation in nondimensional frictional entropy generation rate with Reynolds number.
Energies 15 04927 g030
Figure 31. Variation in nondimensional thermal entropy generation rate with Reynolds number.
Energies 15 04927 g031
Figure 32. Variation in performance evaluation criteria with Reynolds number.
Energies 15 04927 g032
Table 1. Grid independence study.
MeshGrid Number, Millionf × 102Diff, %NuDiff, %
Mesh 10.7687.6770.891%40.1103.801%
Mesh 21.5937.7090.478%41.3770.763%
Mesh 32.8057.7330.168%41.6110.201%
Mesh 43.2787.746Ref41.695Ref
Publisher’s Note: MDPI stays neutral with regard to jurisdictional claims in published maps and institutional affiliations.

