Abstract
Energy security is a multidimensional and multifaceted concept, therefore defining it is a complex problem. It requires the consideration of a wide set of factors from the fields of economics, geology, ecology and geopolitics, all of which have an influence on energy security or the lack thereof. The article focuses on natural gas, which is a very specific fuel in the European context. It is the most “politicized” source of energy, as a consequence of its growing importance as a transition fuel in the energy transformation process. In order to identify dependencies between variables on the gas market and analyze their impact on it (in particular on underground storage), the authors chose a set of variables and built a Bayesian network. The network is an effective and flexible tool that allows analysis of the relationships between the variables that build them and model their values based on evidence. The article presents two stages of work with the Bayesian network. In the first one, a network was built based on historical data. It shows the relationships between the variables as well as the probability of the value ranges of individual variables. A huge advantage of the presented Bayesian network is that it can be used to model various scenarios on the gas market. Moreover, the ability to make statistical inferences for all its nodes represents a valuable additional feature. Several examples of such inferences are presented in the second stage of the analysis, examining the impact of consumption variability on the level of inventory in underground gas storage facilities, the impact of having an LNG terminal and the share of natural gas in electricity production on the storage capacity of a given country. The use of tools such as Bayesian networks allows us to better discover the interrelationships between variables influencing the energy market, analyze them, and estimate the impact on energy security of distinct scenarios described with specific metrics. A simple example of such a metric, i.e., the minimum level of gas storage at the end of the winter season, as well as its analysis and modeling using a relatively simple Bayesian network, is presented in this article.
1. Introduction
Energy is not just another commodity, but the precondition of all commodities, a basic factor equivalent to air, water, and land [1]. In current times, energy represents a key component of economic growth [2], technological development and social well-being [3], i.e., a factor determining the progress of civilization [4]. Economic growth and energy demand are closely related. Energy is required in all sectors of the economy, including industry, transport, residential and services [5]. The state of the economies of individual countries and the standard of living of societies depend on a reliable, efficient and affordable energy supply. The growing demand for energy, especially in the case of rapidly developing countries, renders them more sensitive to energy security issues.
Although the two world wars of the twentieth century demonstrated the relationship between energy resources and the fate of war campaigns and state security [6], the issue of energy security became part of the political debate only in the 1970s as a reaction to the first “oil shocks” [7]. Since then, the interest of researchers on the subject of energy security has been cyclical, depending on the situation and turbulence on the energy markets. Recently, there has been a resurgence in the field of economic security as a result of the growing interest in this issue from researchers, managers and policy makers [8].
The definition of “energy security” has also evolved over the course of several decades. In the 1970s, energy security was narrowly defined, usually as striving to achieve a high level of energy self-sufficiency (nationalistic approach to energy security) [9]. In addition, attention was paid to better management practices in energy projects [10] and more efficient use of energy technologies [11]. At the turn of the century, there were changes in the definition of energy security. This was due to several factors: the development of international cooperation between importers and exporters of energy resources, focus on ensuring equal access to energy for all social groups, and increasing importance of environmental issues in the energy sector [12,13].
Economic security is also an integral component of academic debates and political discussions [14]. A large portion of the research focuses on defining and measuring energy security [8] and despite the rich literature on the subject, there is still no universal definition accepted by all interested parties [13,15].
Energy security is a multidimensional and multifaceted concept, therefore defining it is a complex problem. It requires the consideration of a wide set of factors in the field of economics, geology, ecology, geopolitics. All of these have an influence on energy security or the lack thereof. The nature and importance of energy security depends on the context [16]. In many cases, it is the space-time context that determines the concept of energy security, and the most important component of this context is the state of the energy market at a given moment in time [17].
In modern definitions of energy security, four main elements can be identified:
- Availability—the physical existence of energy;
- Accessibility—the possibility of gaining access to energy resources taking into account geographic, political, demographic, and technological constraints;
- Affordability—the possibility of accessing affordable energy sources;
- Acceptability—the possibility of accessing sources that do not raise any objections, especially environmental ones [18].
Of these elements, accessibility and affordability are considered the most important due to their impact on other aspects of energy security [19]. According to the Asia Pacific Energy Research Center, energy security is defined as “the ability of an economy to guarantee the availability of the supply of energy resources in a sustainable and timely manner with the energy price being at a level that will not adversely affect the economic performance of the economy” [20].
Energy security is most often referred to as “security of supply”. In this context, the International Energy Agency (IEA) defines energy security as “uninterrupted availability of energy sources at an affordable price” [21]. Similarly, according to the European Commission, "energy security or security of supply can be defined as the availability of energy at all times in various forms, in sufficient quantities, and at reasonable and/or affordable prices” [22]. Ensuring a stable/affordalbe energy supply is, therefore, one of the top priorities of many governments internationally [23,24].
The supply-oriented definition of energy security does not take into account the complexity of the energy system, ignoring, e.g., end users [25]. Therefore, the second group of energy security definitions focuses on the concept of “security of services” which refers to “the extent to which the population in a defined area (country or region) can have access to affordable, and competitively priced, environmentally acceptable energy services of adequate quality” [18]. This definition implies end-user orientation [26]. In the energy service-oriented approach, the subject of research is transmission and distribution infrastructure, quality of supply and price.
A different approach to the issue of energy security is presented by energy-exporting countries, whose aim is to secure sufficiently high and stable revenues from the export sale of energy resources [27]. As a result, the economies of the largest producers of energy commodities are dependent on the sale of those commodities. Therefore, the effects of disruptions in the supply of raw materials and reductions in their price on the global markets will be strongly felt by these countries. Export revenues affect the economic development of producer countries, research and exploration projects, development of new oil fields for exploitation and expansion of transport and transmission systems. In the case of energy exporting countries, energy security focuses on the aspects of “security of demand” [28] as well as social and political aspects that test the validity of the “resource curse” [29] and “paradox of plenty” [30] hypotheses.
In this article, the authors have devoted special attention to the issue of natural gas, a raw material particularly important today due to its function as a transition fuel in the energy transformation process and extremely high politicization of the gas market. The natural gas market in Europe has acquired special importance, especially with the ongoing Russia–Ukraine conflict, as the Russian Federation was and still remains one of the main suppliers of this fuel to the European market. At the present stage, we are unable to assess the real scale of the consequences of this war, because we can predict neither the military outcome of the Russian–Ukrainian war, nor the extent to which the announcements of European politicians regarding the cessation of using Russia as the main supplier of energy resources will be implemented. It seems certain, however, that a return to the pre-war situation is no longer possible.
The latest literature on energy security and natural gas is rich and covers a variety of issues. For example, index approach to energy security is presented in [31], where the evaluation of an index called “Energy Security Level”, measuring the overall energy security, is performed. The index assessing energy security is also covered in [32,33]. The impact of technical infrastructure on energy security is described in [34], and the issue of safety and security of oil and gas pipeline transportation is discussed in [35]. An attempt to estimate the value of the potential shortage of natural gas stocks using stochastic modeling based on the mathematical model of the “Newsvendor problem” is shown in [36]. The use of the financial portfolio theory to explore energy security issues is demostrated in [37,38]. The concept of energy security taking into account three new perspectives: sovereignty, robustness and resilience in the gas sector of the European Union is explored in [39]. An example of a comprehensive approach to energy security is presented in [40].
The topic of Bayesian networks appears in the context of optimization of gas supply reliability in natural gas pipelines [41] and an assessment of probabilistic disaster in the oil and gas supply chain [42]. However, there are no attempts to model the gas system with the use of probabilistic methods to obtain the possibility of forecasting the probability of certain events and variable values. This article fills the gap.
The authors decided to use Bayesian networks to model underground natural gas storage, because they provide a very useful method for reasoning with the emphasis on explanation, association, and causation. Bayesian networks are now widely recognized as a powerful technology for dealing with risk, uncertainty and decision making [43]. The paper consists of several parts that cover the following topics:
- The current situation in the natural gas market in Europe compared to other primary energy sources, with particular emphasis on underground natural gas storage.
- Basic information on Bayesian networks.
- A description of the data sources and tools used in the article to create a Bayesian network modeling the underground gas storage market.
- A presentation of the Bayesian network created by the authors with examples of inference.
2. The Natural Gas Market in Europe
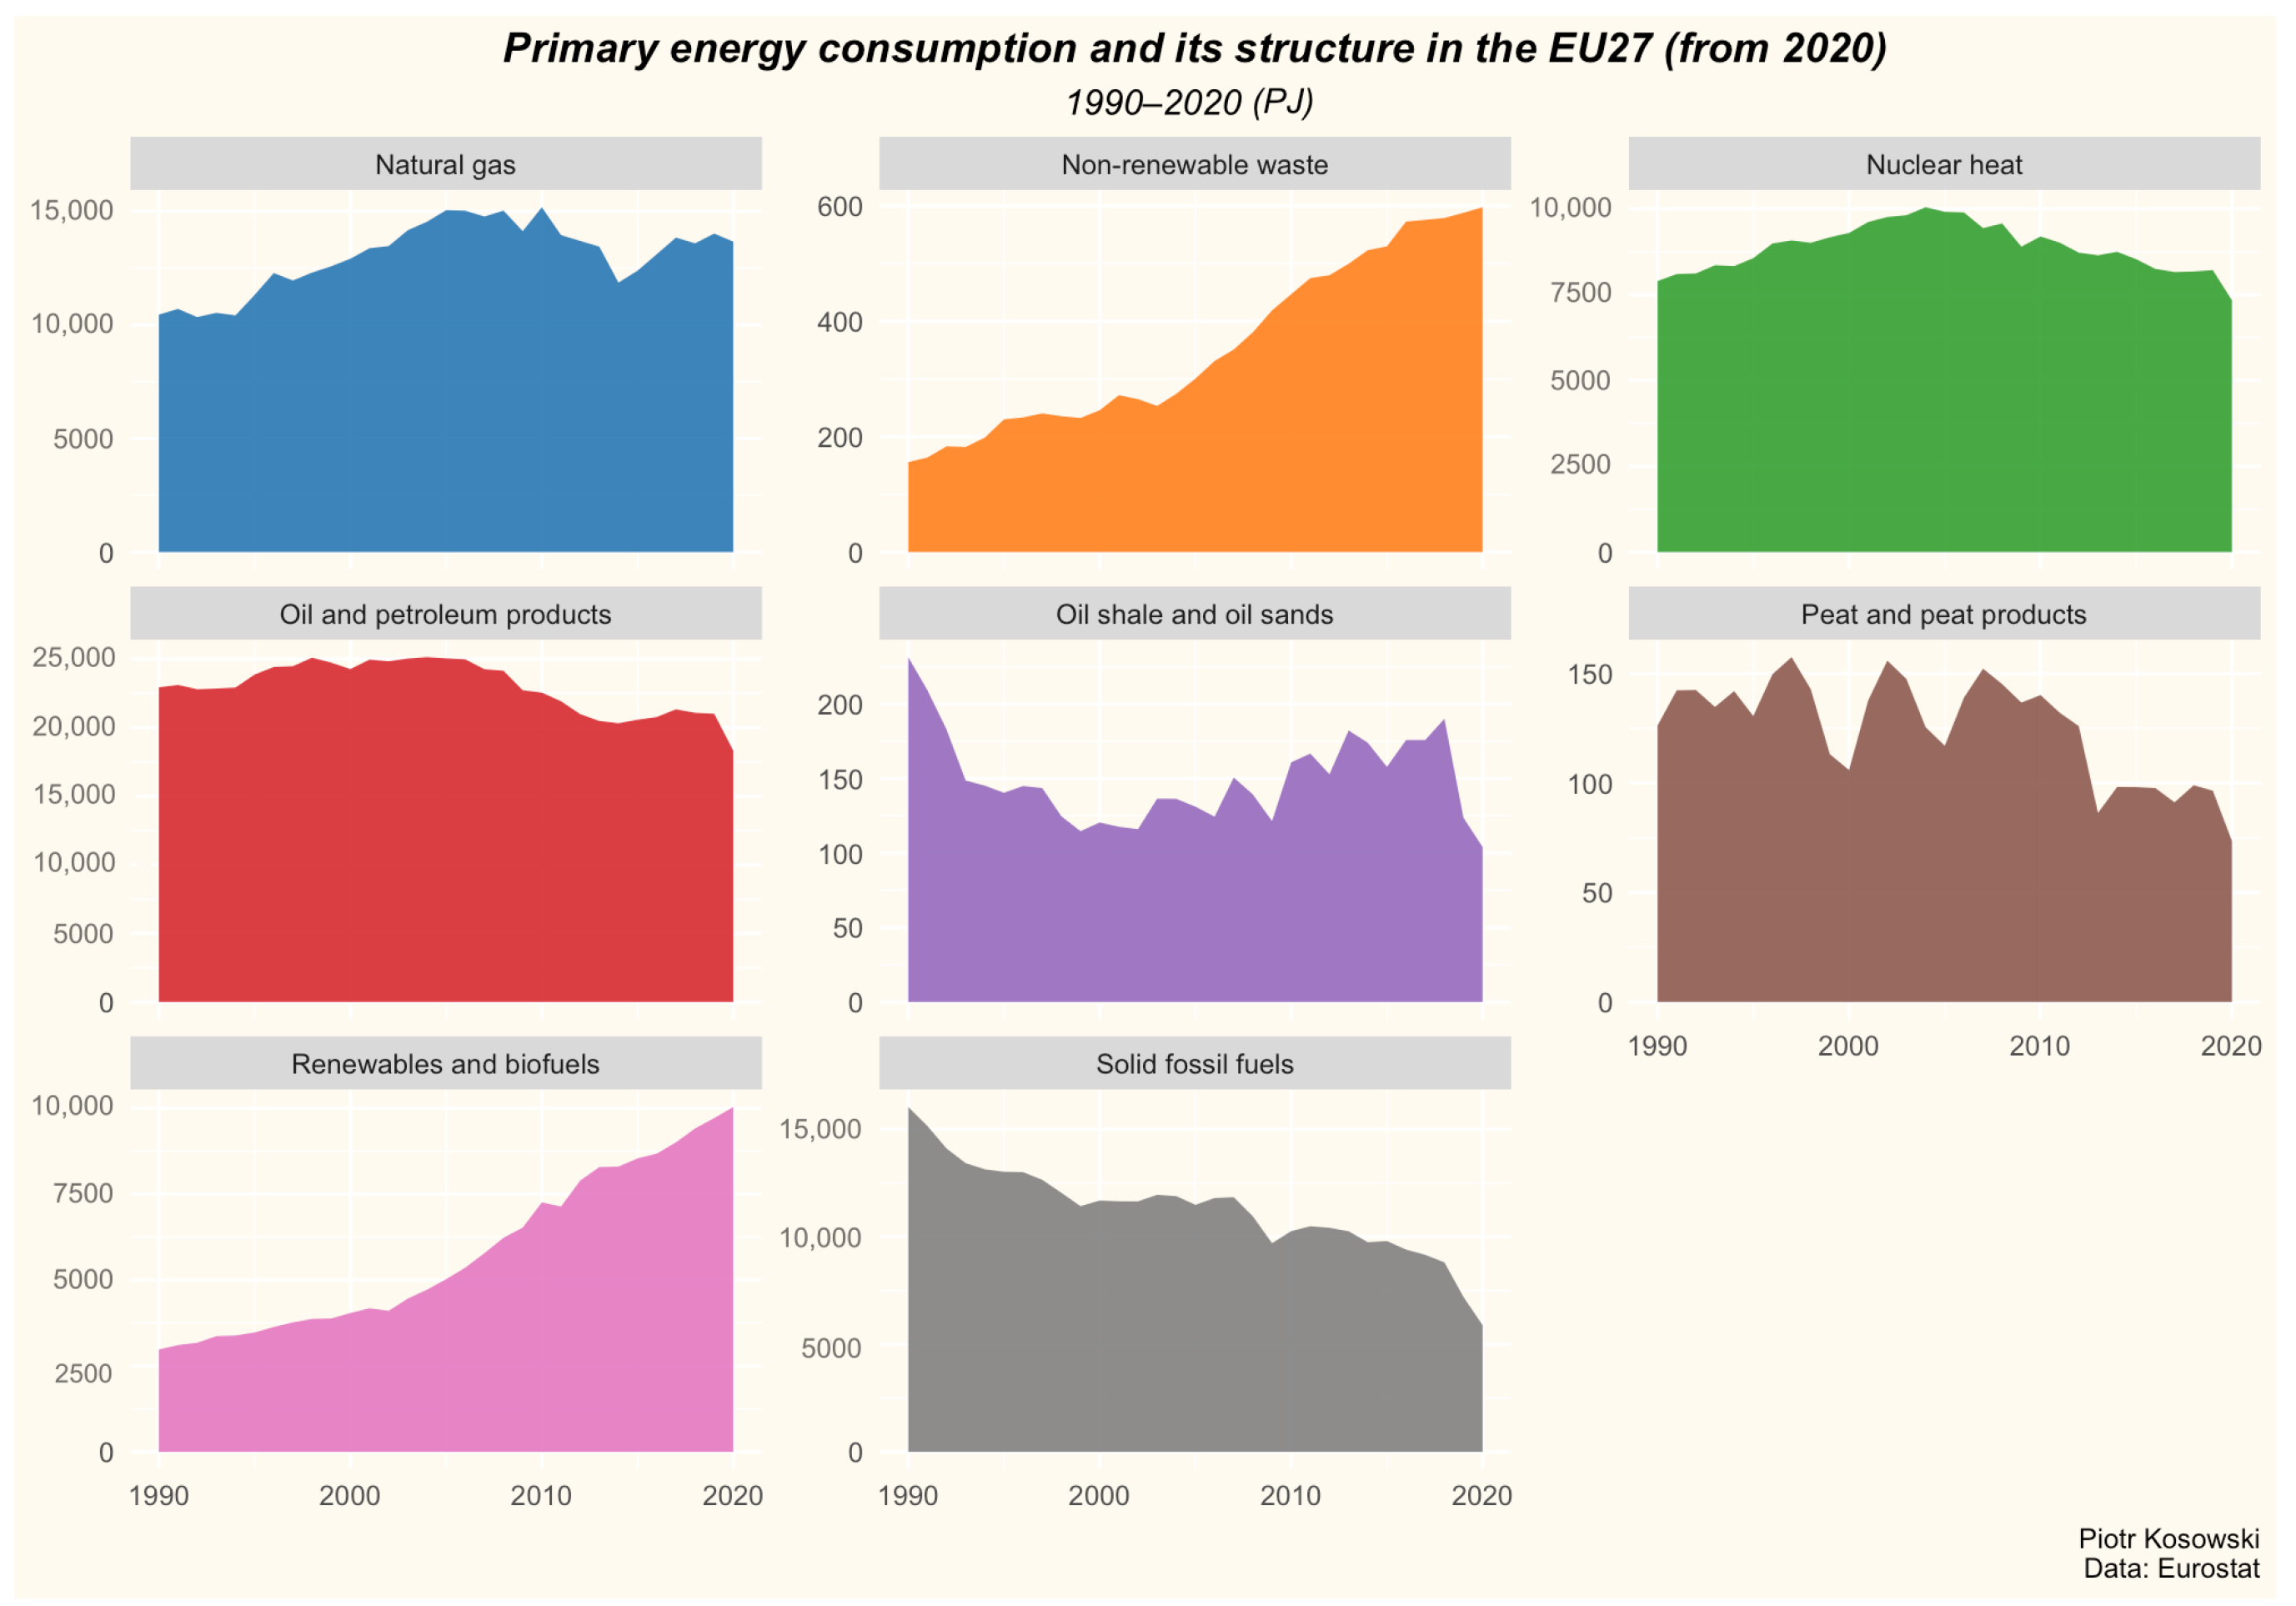
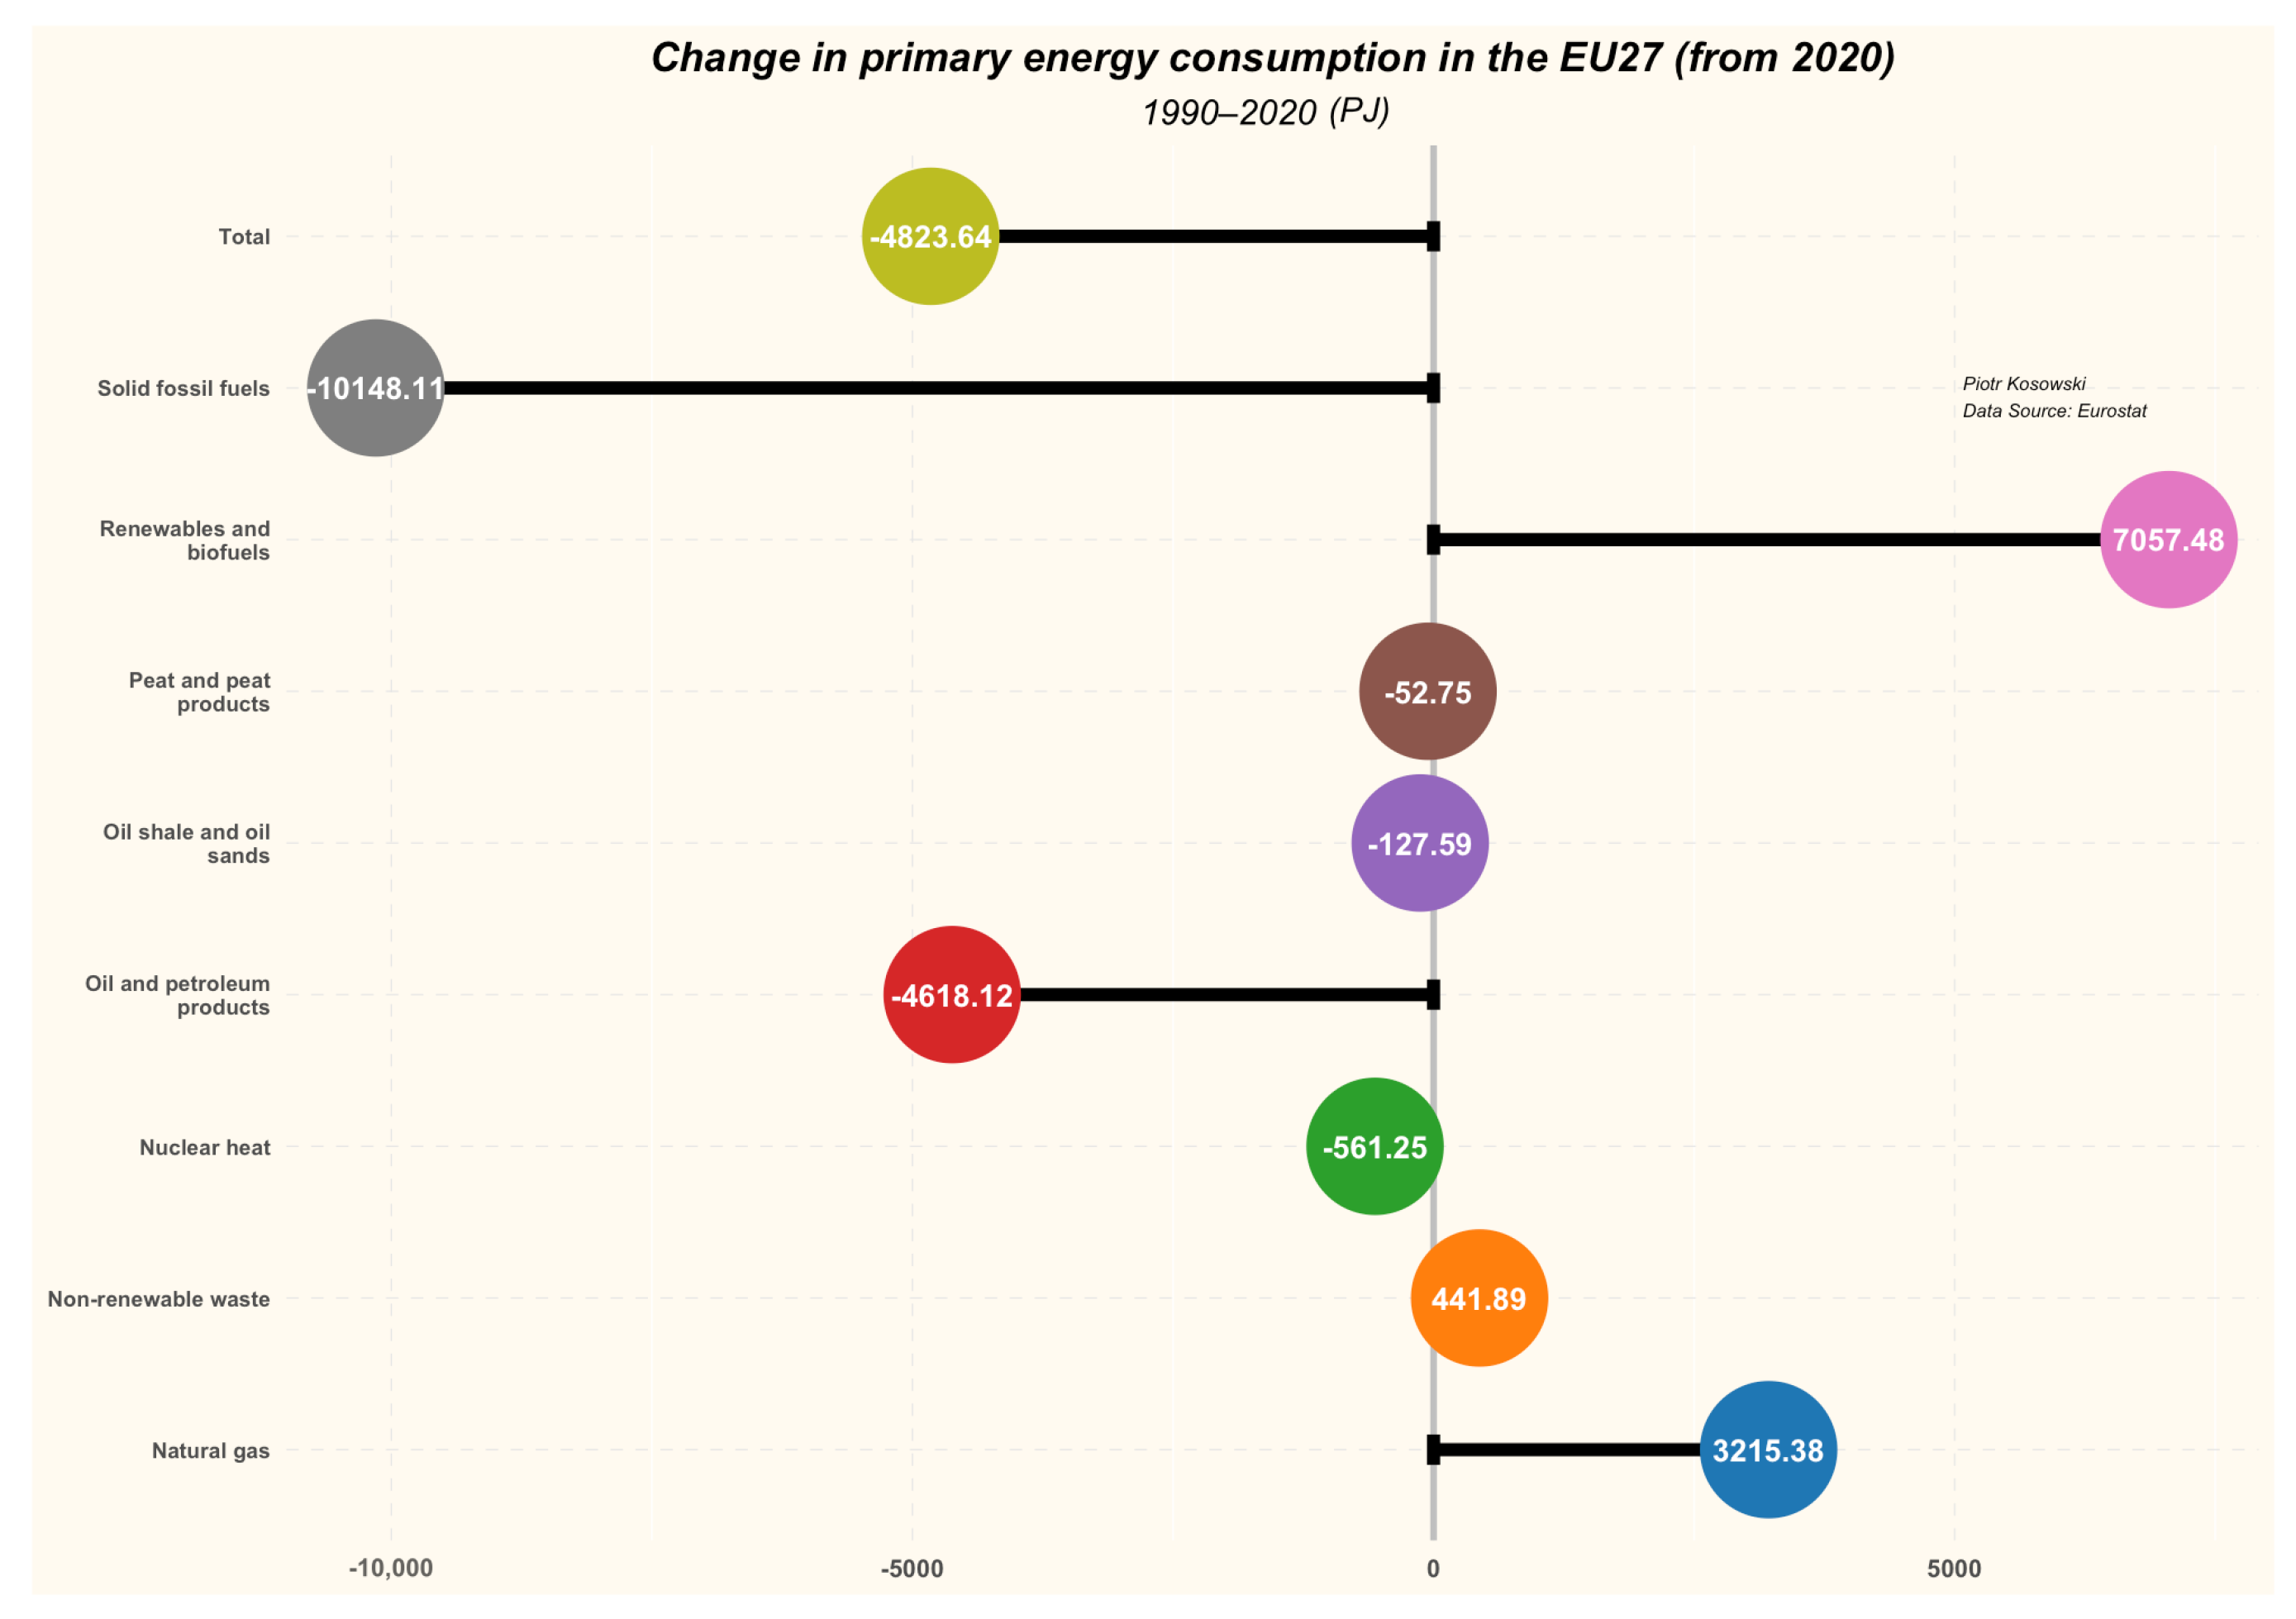
In the European Union countries, consumption of primary energy significantly exceeds production, while the latter remains in a downward trend. By focusing on consumption alone, it can be seen that over the last 30 years there has been an increase in consumption of natural gas, renewable energy and non-renewable waste. On the other hand, declines were recorded in the use of solid fossil fuels, crude oil and nuclear energy. The use of peat and oil sands, which are of marginal importance as a source of primary energy in Europe has also decreased (Figure 1 and Figure 2).
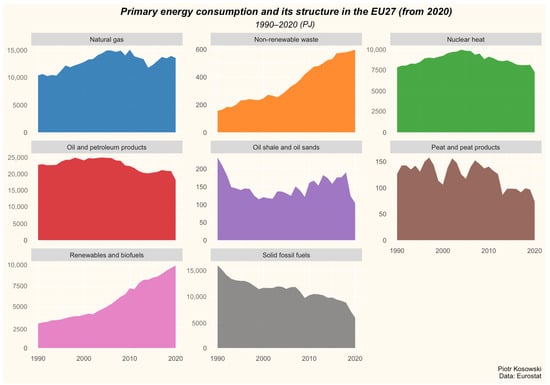
Figure 1.
Primary energy consumption and its structure by source in the European Union (EU27). Data Source: Eurostat.
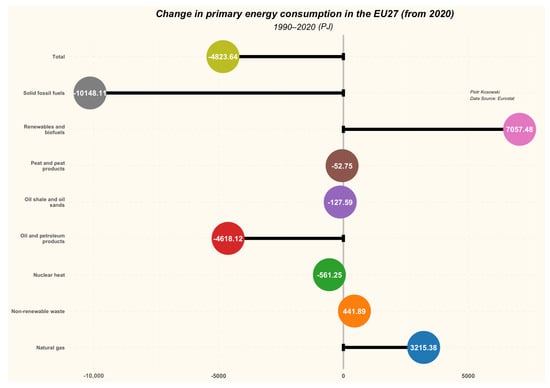
Figure 2.
Change in primary energy consumption in the European Union (EU27). Data Source: Eurostat.
The article focuses on natural gas, which is a very specific fuel in the European context. It represents the most “politicized” source of energy, which is a consequence of its growing importance as a transition fuel in the energy transformation process. Technical and technological issues are also an important factor, because only recently, owing to the technology of liquefied natural gas (LNG), has it been possible to transport this fuel efficiently via routes other than gas pipelines. It should be emphasized that the LNG technology itself is not new, and the first successful liquefaction of methane took place in the 19th century.
The vast majority of European natural gas fields are mature and their production is declining. New discoveries are unlikely to be able to make up for this deficiency, but an interesting new alternative is emerging—development of biomethane production that can be utilized, transported, and stored together with natural gas. Europe bears great potential in this area and some issues related to this topic are detailed in [44,45,46,47].
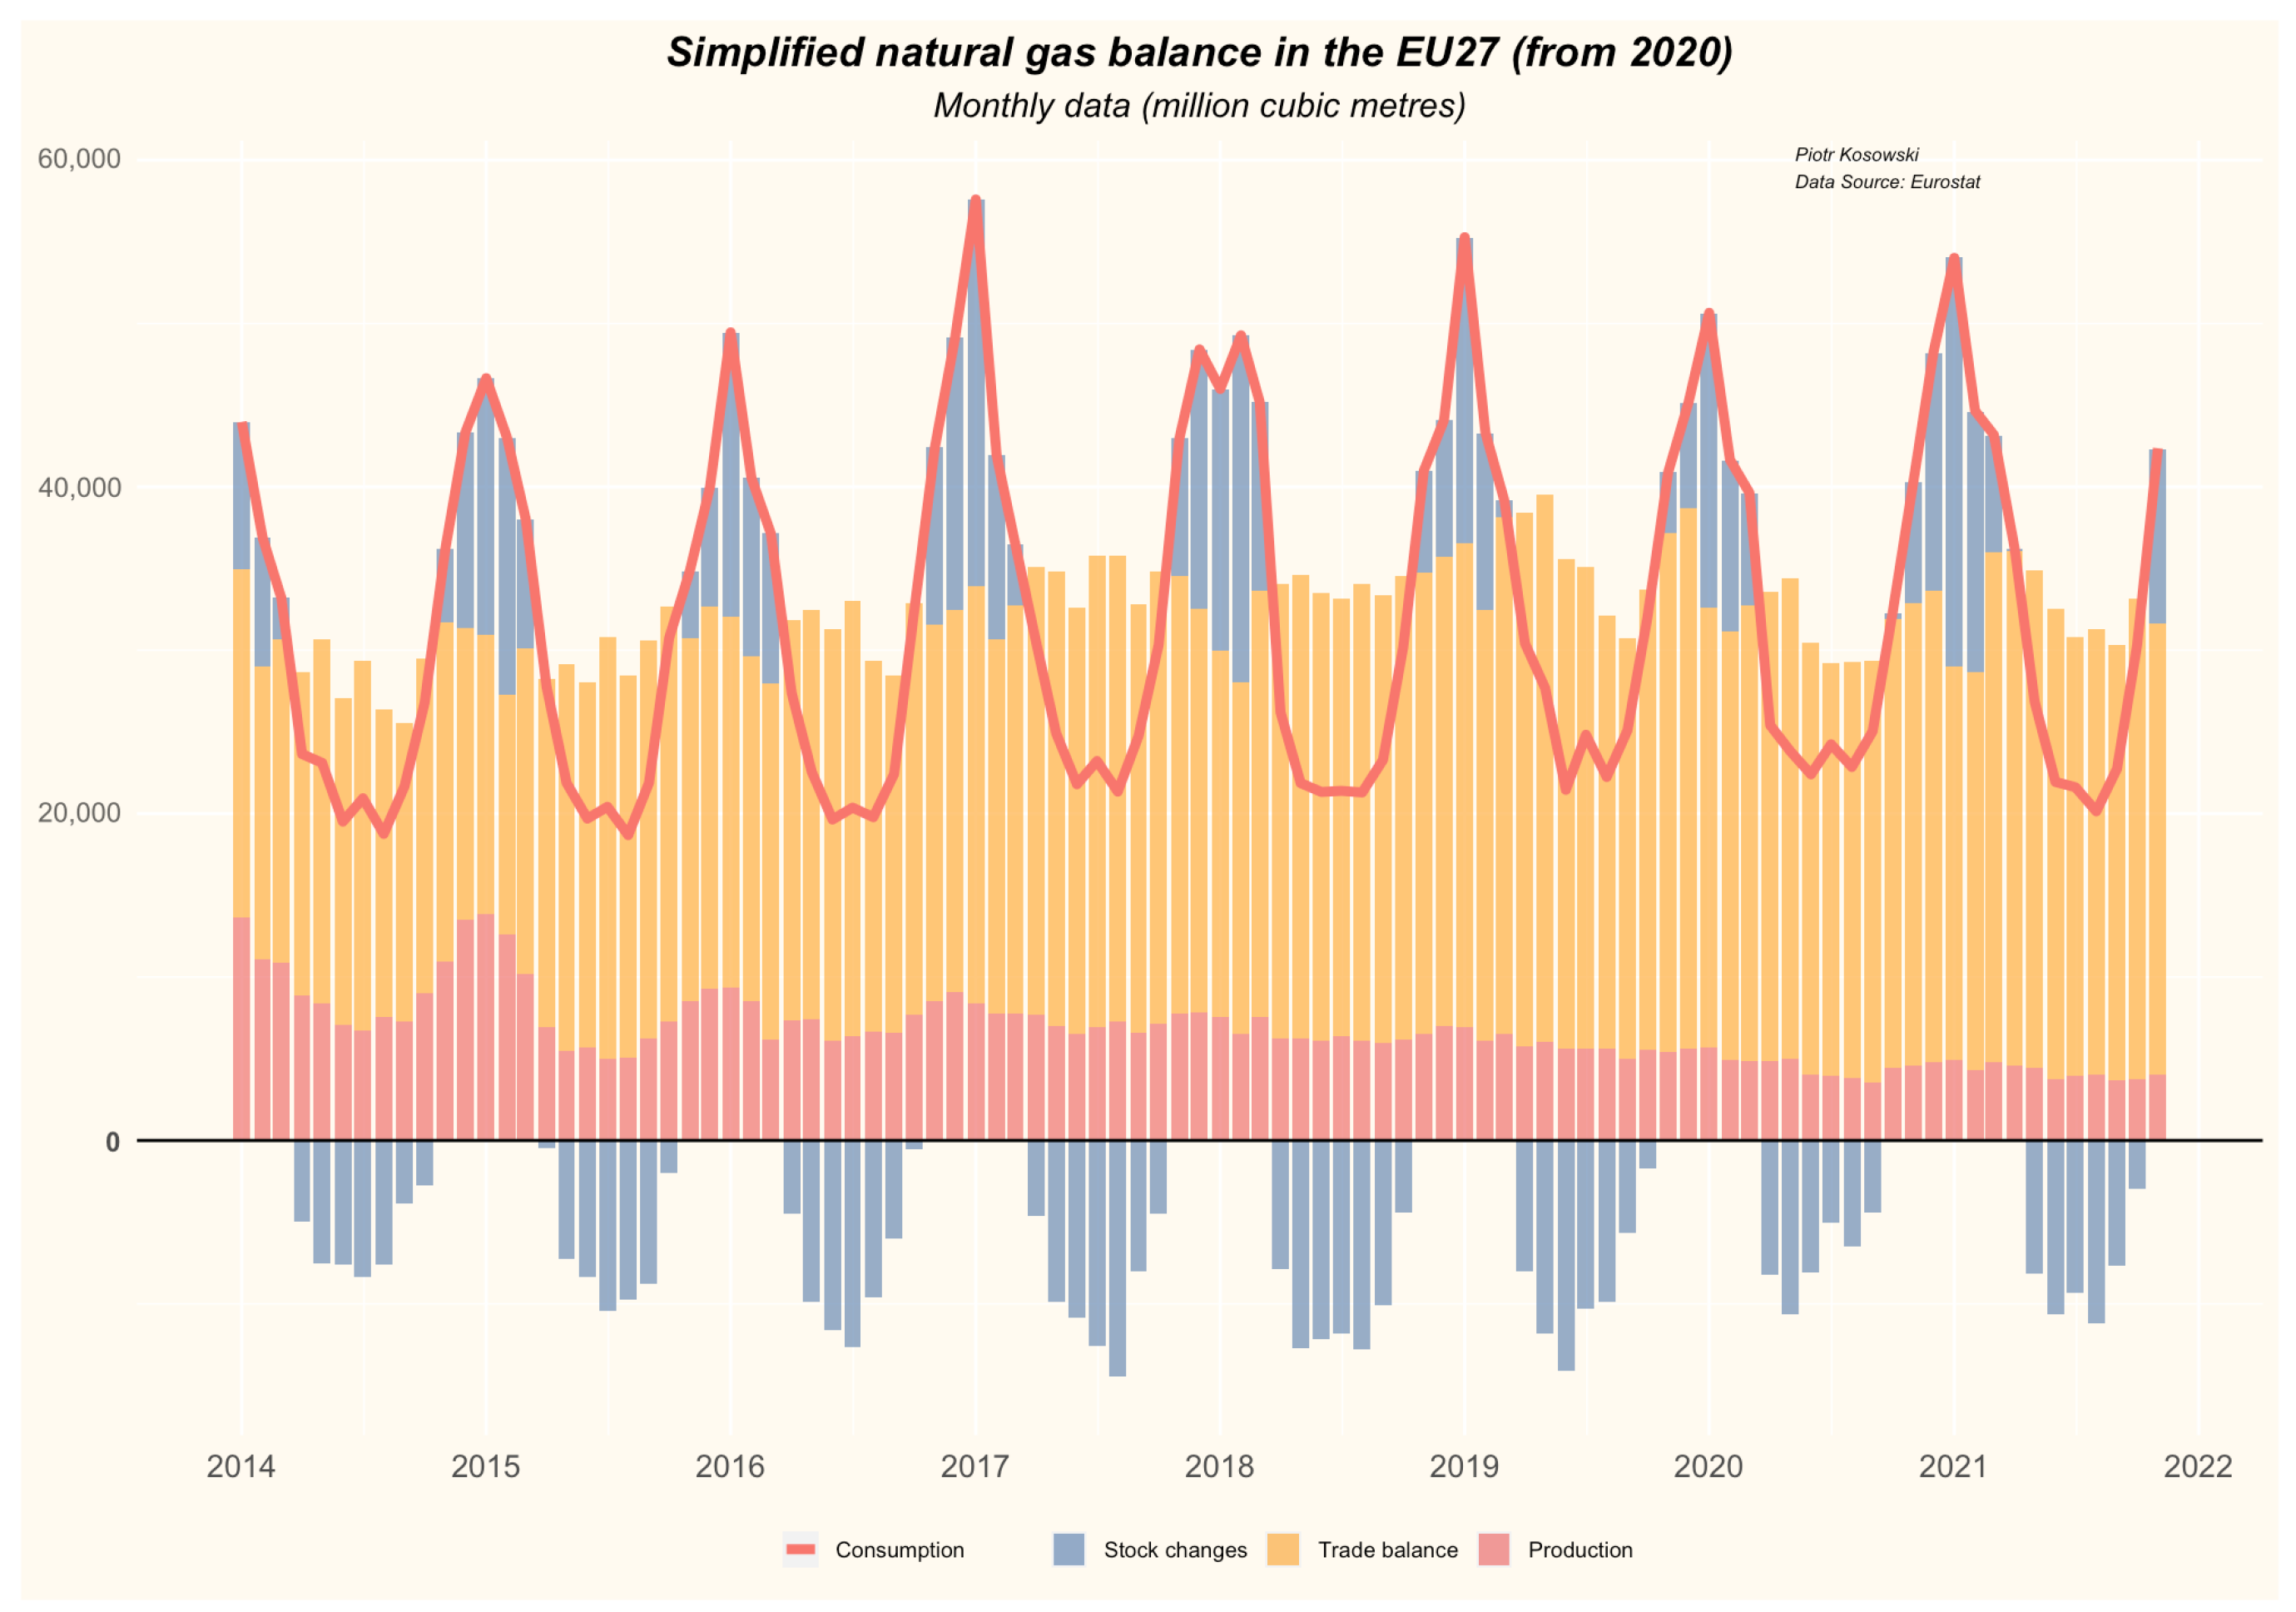
A distinguishing feature of natural gas as a source of primary energy is very strong seasonality in consumption, strongly related to weather conditions. As a result, consumption in the summer months is much lower than in winter. Underground gas storage is used on a large scale to counterbalance fluctuations in supply and demand in both the short, medium and long term. They constitute a key element of the gas infrastructure and are one of the main guarantors of security of gas supply (Figure 3).
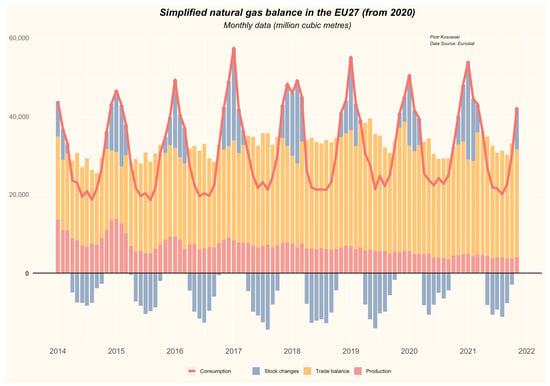
Figure 3.
Natural gas balance in the European Union (EU27). Data Source: Eurostat.
Rational exploitation of gas reservoirs requires storage of the extracted fuel to maintain the stable operation of the field in periods of reduced demand. Transmission grids also work optimally when the gas flow is stable. This strategy is followed (when possible) by all gas companies globally. In the absence of underground gas storage, both production and transmission capacity would be forced to meet the peak demand for natural gas, and in periods of low demand, their capacity would be greatly underused. The seasonal nature of consumption is noteworthy, with large fluctuations between winter and summer. Domestic production is relatively steady, while imports are growing, although their seasonal changes are relatively small. The system is balanced thanks to underground gas storage—gas is injected into the storage facilities in summer, extracted and placed on the market in winter.
The aforementioned very strong seasonality is clearly visible—in spring and summer, the storage facilities are mostly full, while in autumn and winter they are emptied. There are exceptions to this rule, especially in the case of warehouses with a balancing role in the system (this applies mainly to storage facilities built in salt caverns, due to their specific technical characteristics and very high operational flexibility) or in the case of extraordinary events.
Underground gas storage facilities are one of the main guarantors of energy security on the natural gas market. This is due to the functions performed by underground gas storage facilities on the natural gas market, one of the most important of which is balancing seasonal fluctuations. We can see how important it is to adopt an appropriate security policy in the natural gas market by comparing the filling level of gas storage facilities in Poland and throughout Europe in 2021. The Russian Federation, with the help of Gazprom and other companies, which for years have been tools in shaping its foreign policy, caused an energy crisis in the European gas market, which was a preparatory stage for armed aggression against Ukraine. As a result of these activities, the filling level of European gas storage facilities in the winter of 2021/22 was the lowest for many years and posed a threat to the energy security of Europe as a whole. Figure 4 shows the total volume of gas in storage in Europe, and Figure 5 shows the situation in Germany, which was one of the countries most affected by this policy. The situation in Poland, aware of the threat, did not differ significantly from the long-term average, and at the end of 2021, the accumulated stocks were even greater than the average (Figure 6).

Figure 4.
Natural gas in underground gas storage in Europe in 2021 compared to 10-year average and min-max range. Data Source: GIE AGSI+.

Figure 5.
Natural gas in underground gas storage in Germany in 2021 compared to 10-year average and min–max range. Data Source: GIE AGSI+.
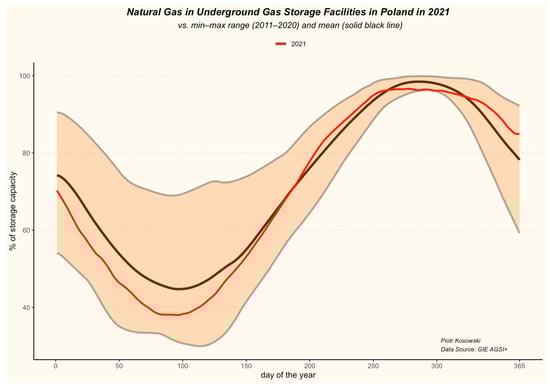
Figure 6.
Natural gas in underground gas storage in Poland in 2021 compared to 10-year average and min–max range. Data Source: GIE AGSI+.
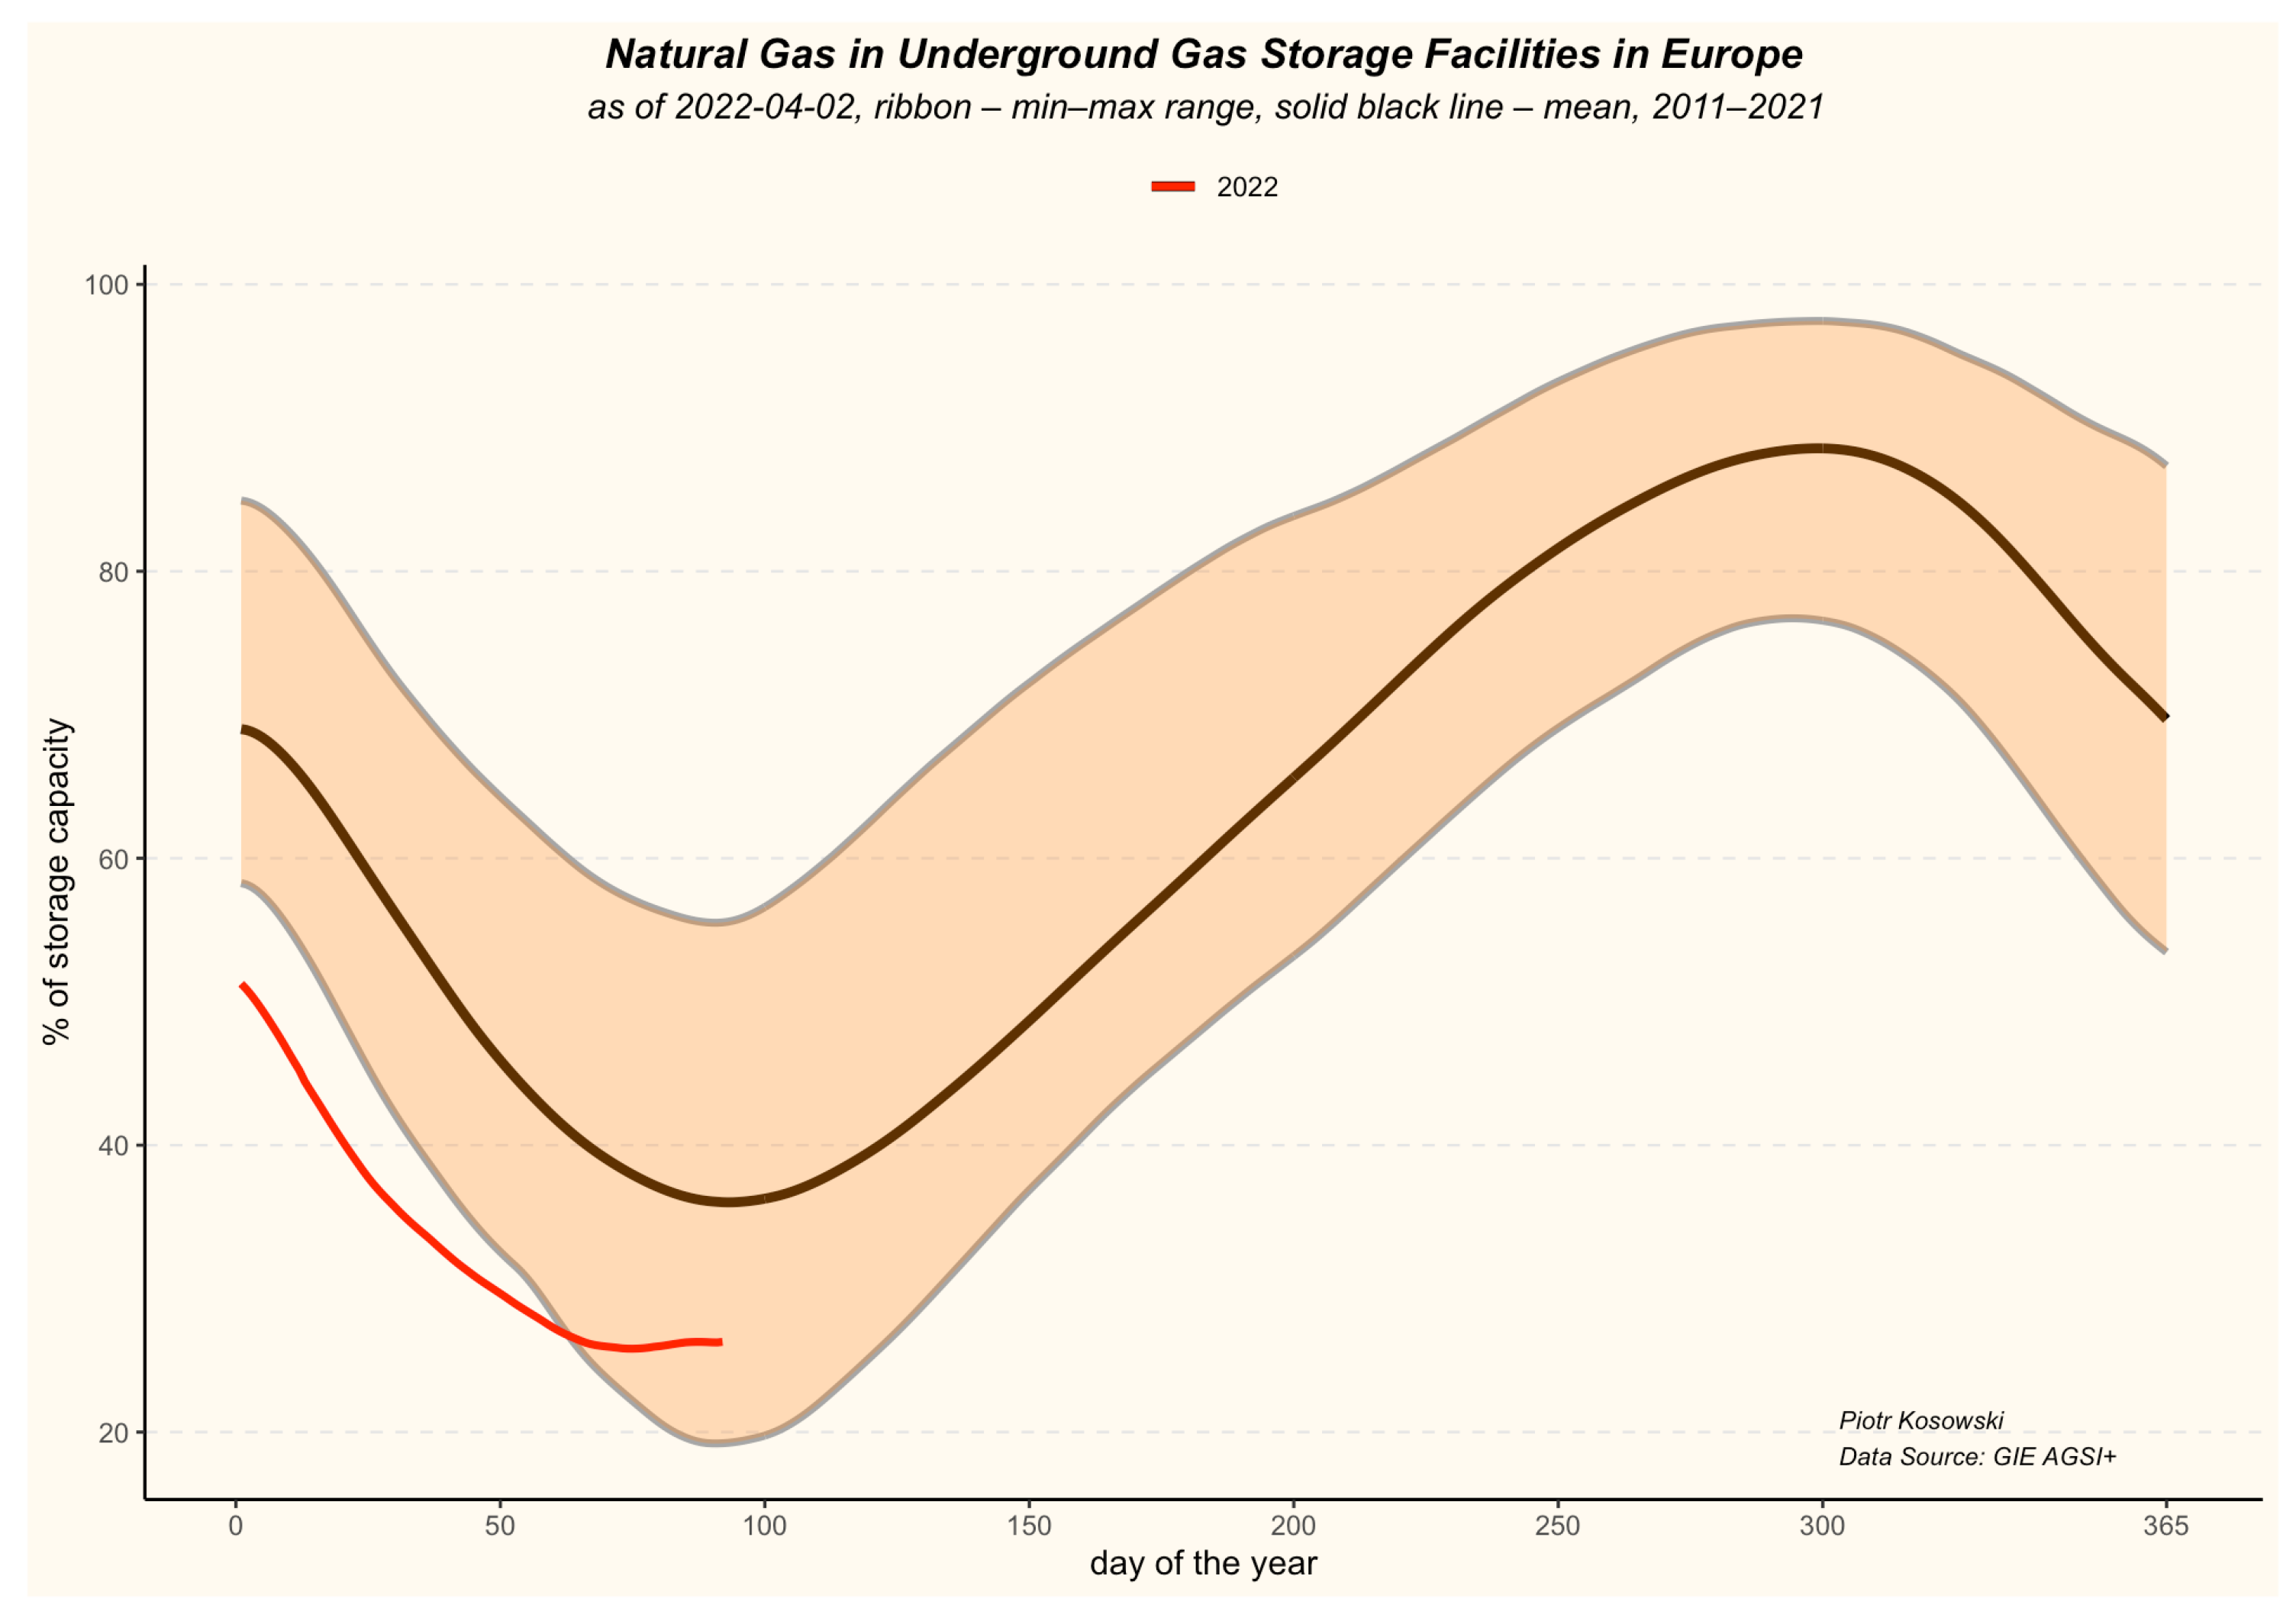
After Russia invaded Ukraine, the difference in the degree of stockpiling in Poland and other Central European countries was striking (Figure 7 and Figure 8): the stocks accumulated in Poland were much larger than usual for this time of the year, while in other countries they remained much lower (data from 2 April 2022), even though in the first quarter of 2022 gas consumption from storage facilities in Europe was lower than usual (Figure 9) and thus the stocks returned to the long-term min–max range (Figure 10).
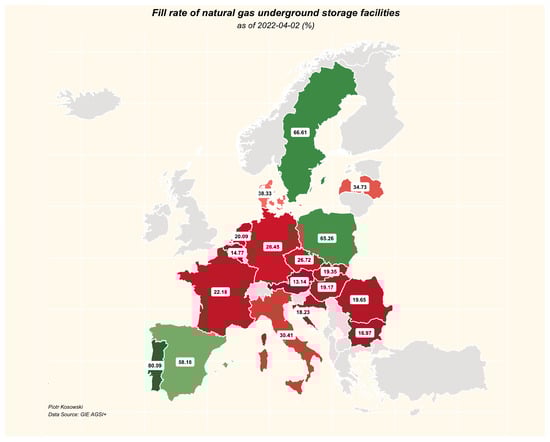
Figure 7.
Fill level of underground gas storage facilities in Europe (as of 2 April 2022). Data Source: GIE AGSI+.

Figure 8.
10-year average fill level of underground gas storage facilities in Europe (as of 2 April). Data Source: GIE AGSI+.
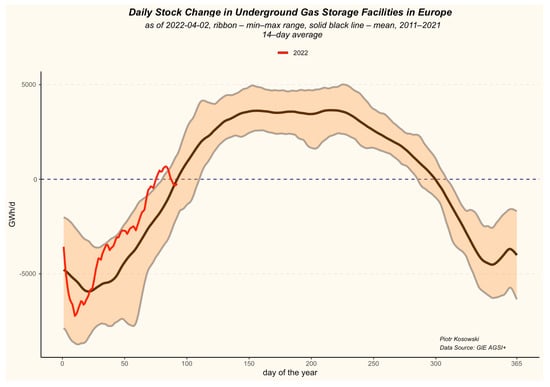
Figure 9.
Daily stock change in underground gas storage facilities in Europe in 2022 compared to 10-year average and min–max range. Data Source: GIE AGSI+.
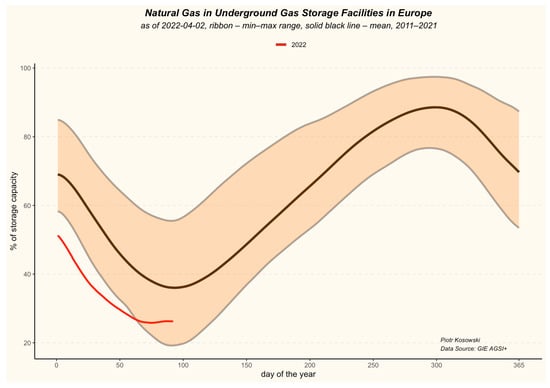
Figure 10.
Natural gas in underground gas storage in Europe in 2022 compared to 10-year average and min–max range. Data Source: GIE AGSI+.
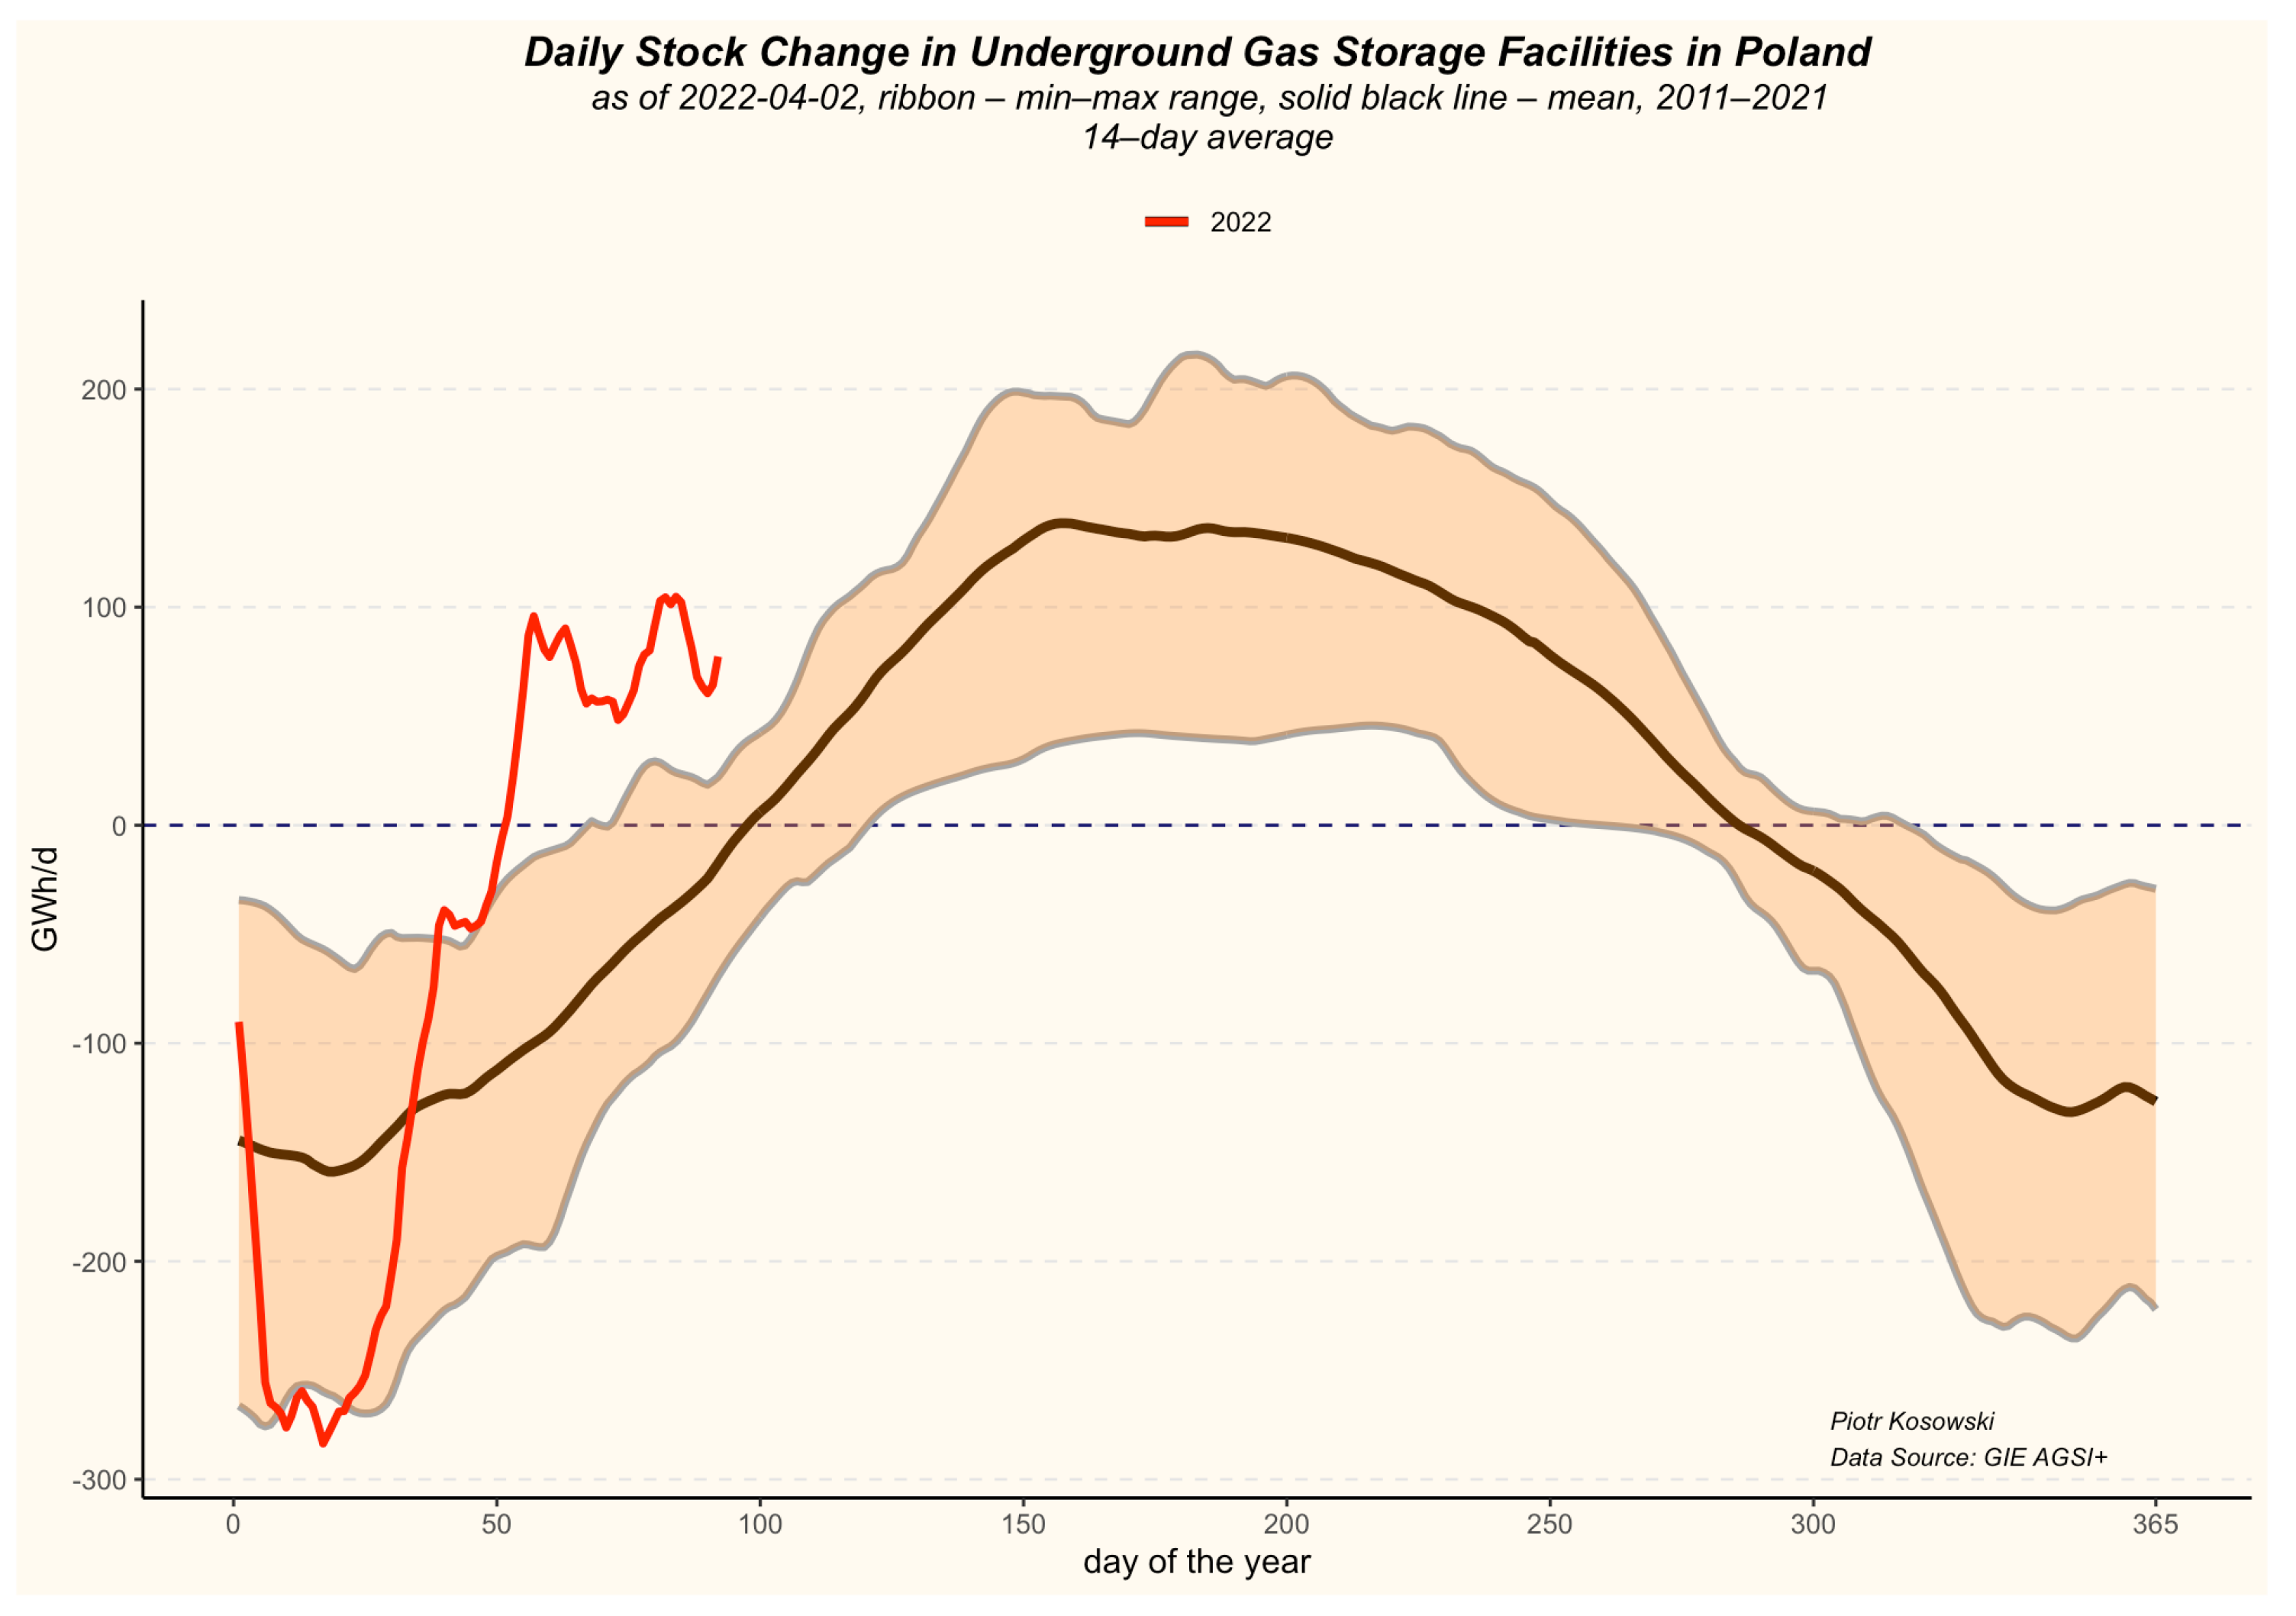
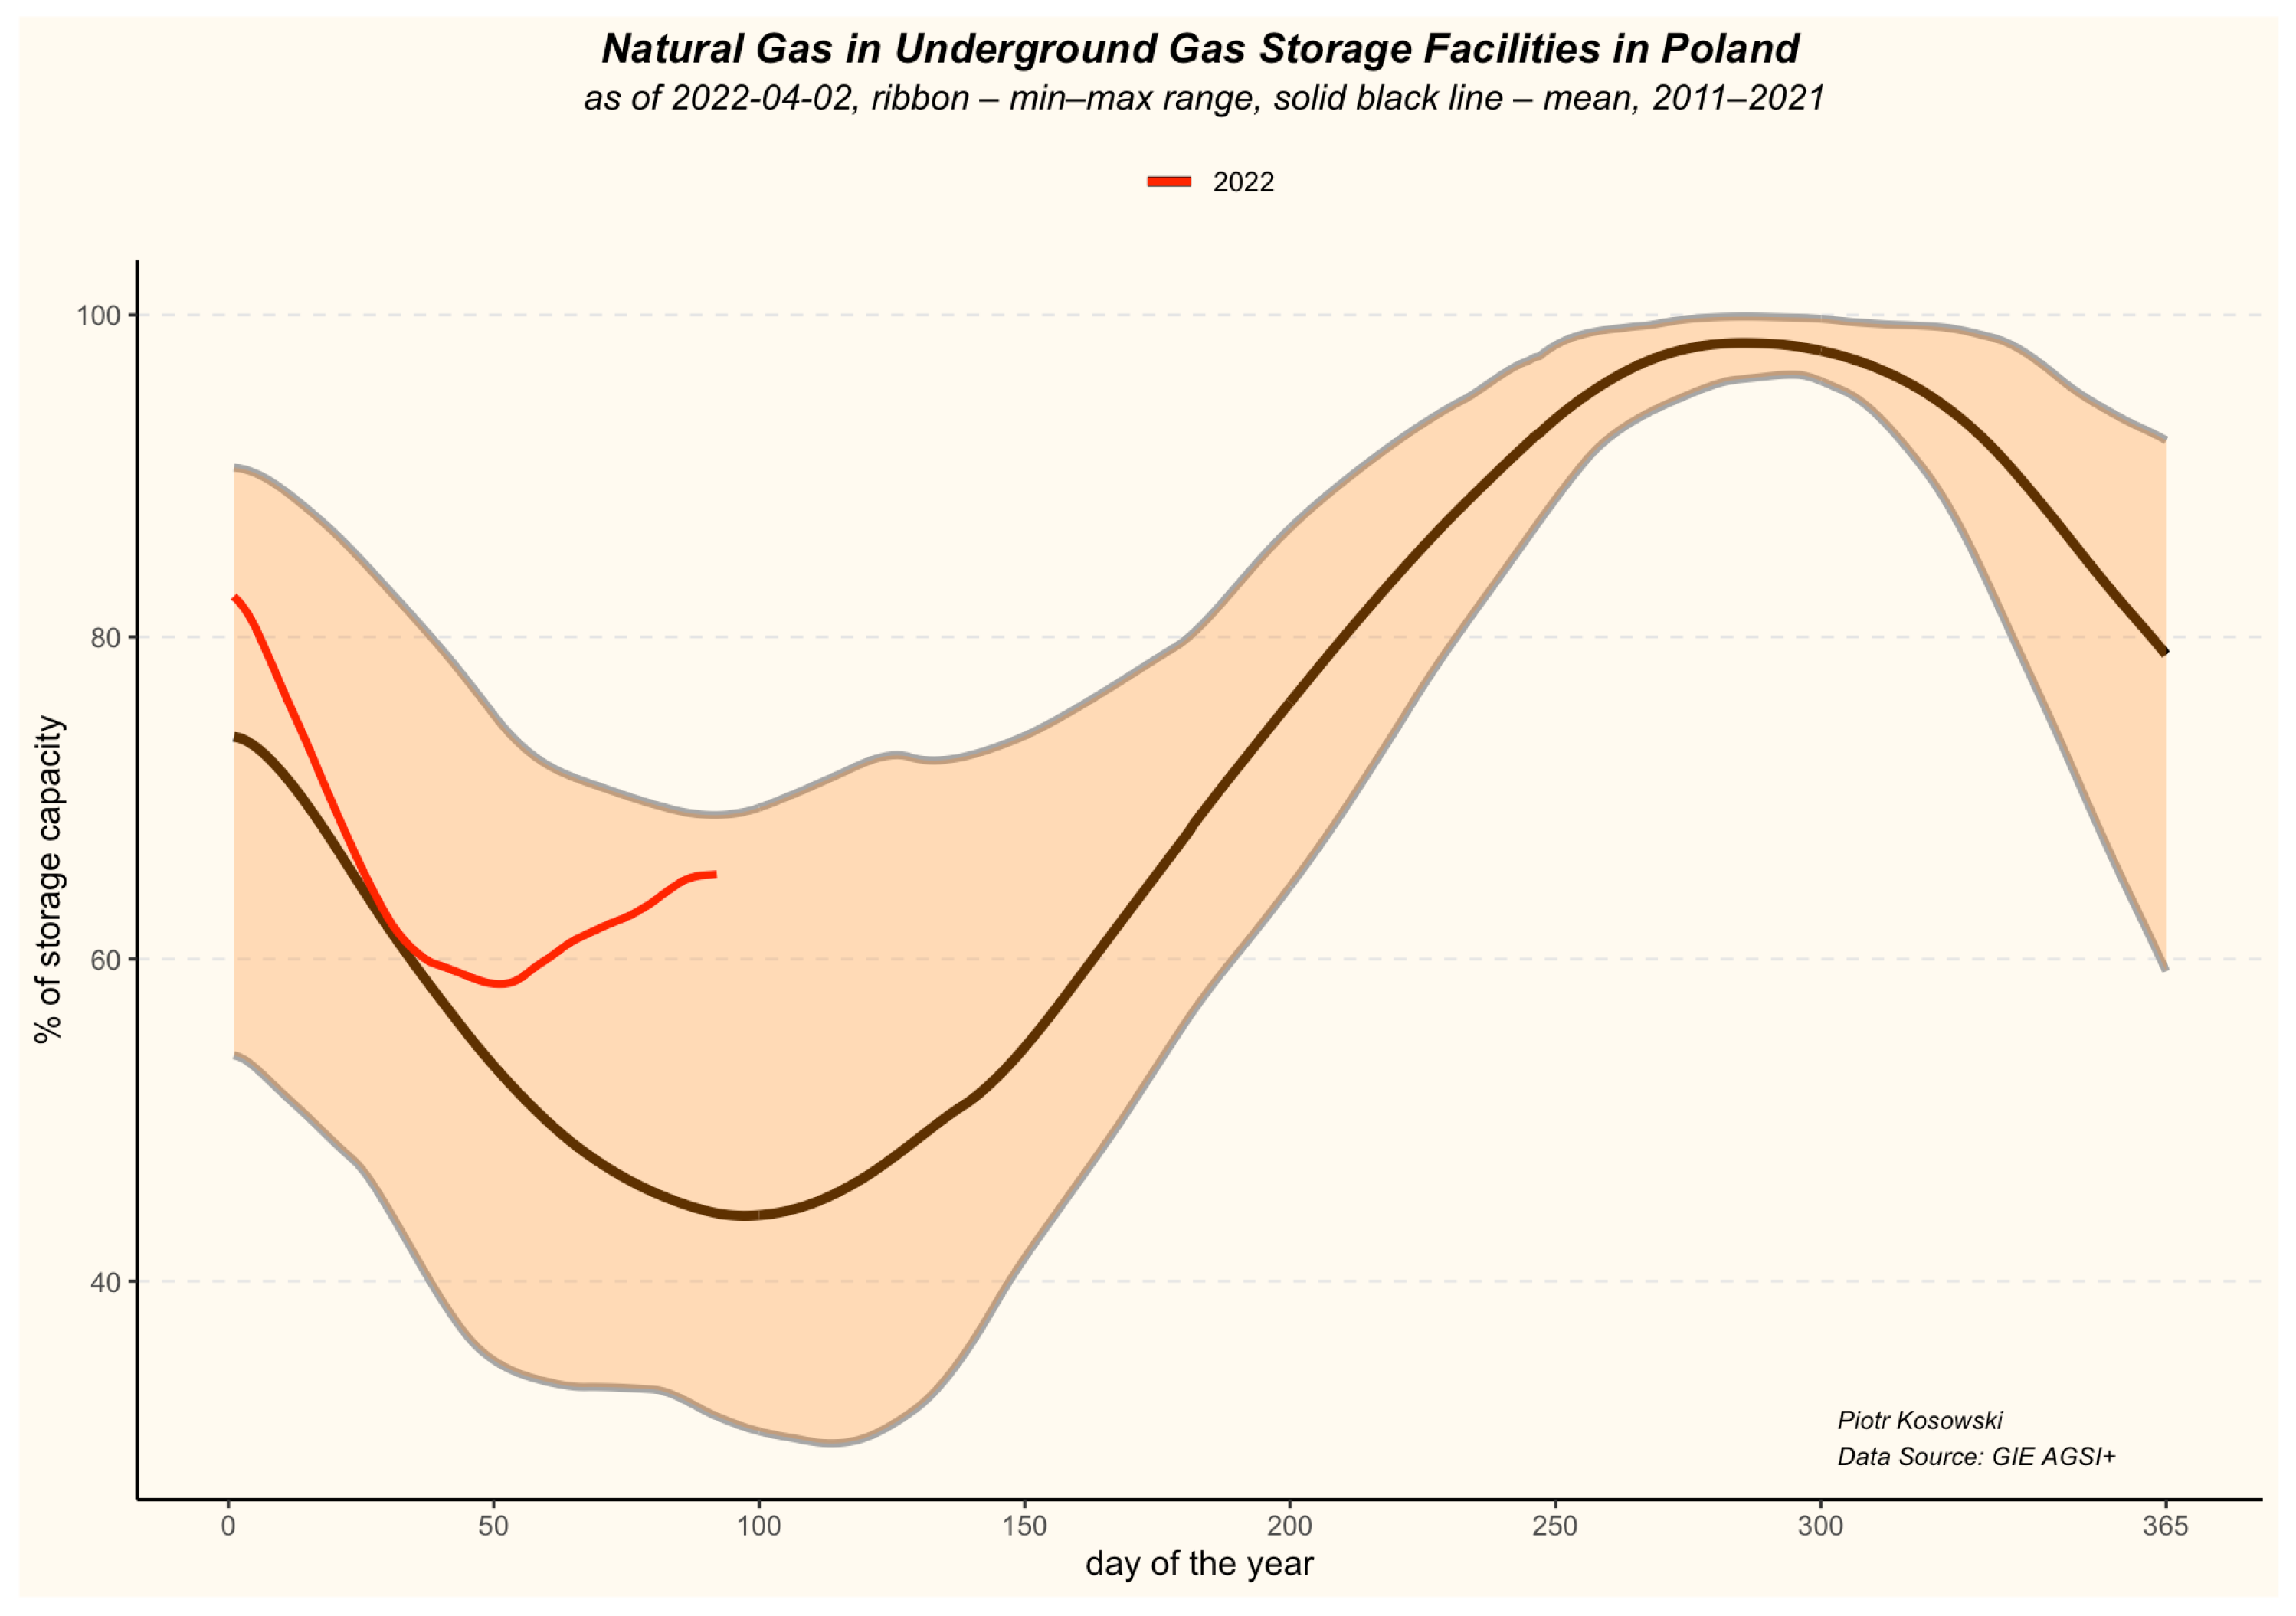
In Poland, on the other hand, an unusual situation has arisen. The increased level of utilization of the LNG terminal in Świnoujście and the relatively mild weather in February and March led to an extremely rare situation: stocks in underground gas storage in Poland began growing instead of falling—more gas was injected into the storage facilities than was withdrawn from them. This is an unusual situation under normal conditions for this time of year (Figure 11 and Figure 12).
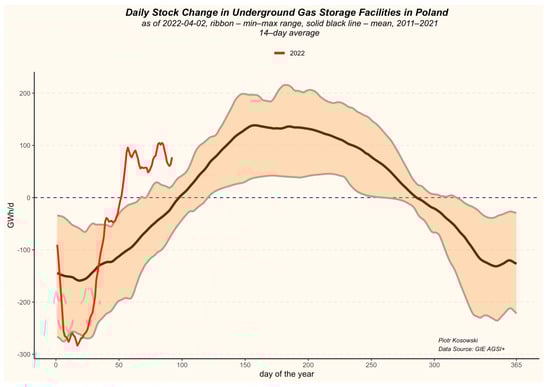
Figure 11.
Daily stock change in underground gas storage facilities in Poland in 2022 compared to 10-year average and min–max range. Data Source: GIE AGSI+.

Figure 12.
Natural gas in underground gas storage in Poland in 2022 compared to 10-year average and min–max range. Data Source: GIE AGSI+.
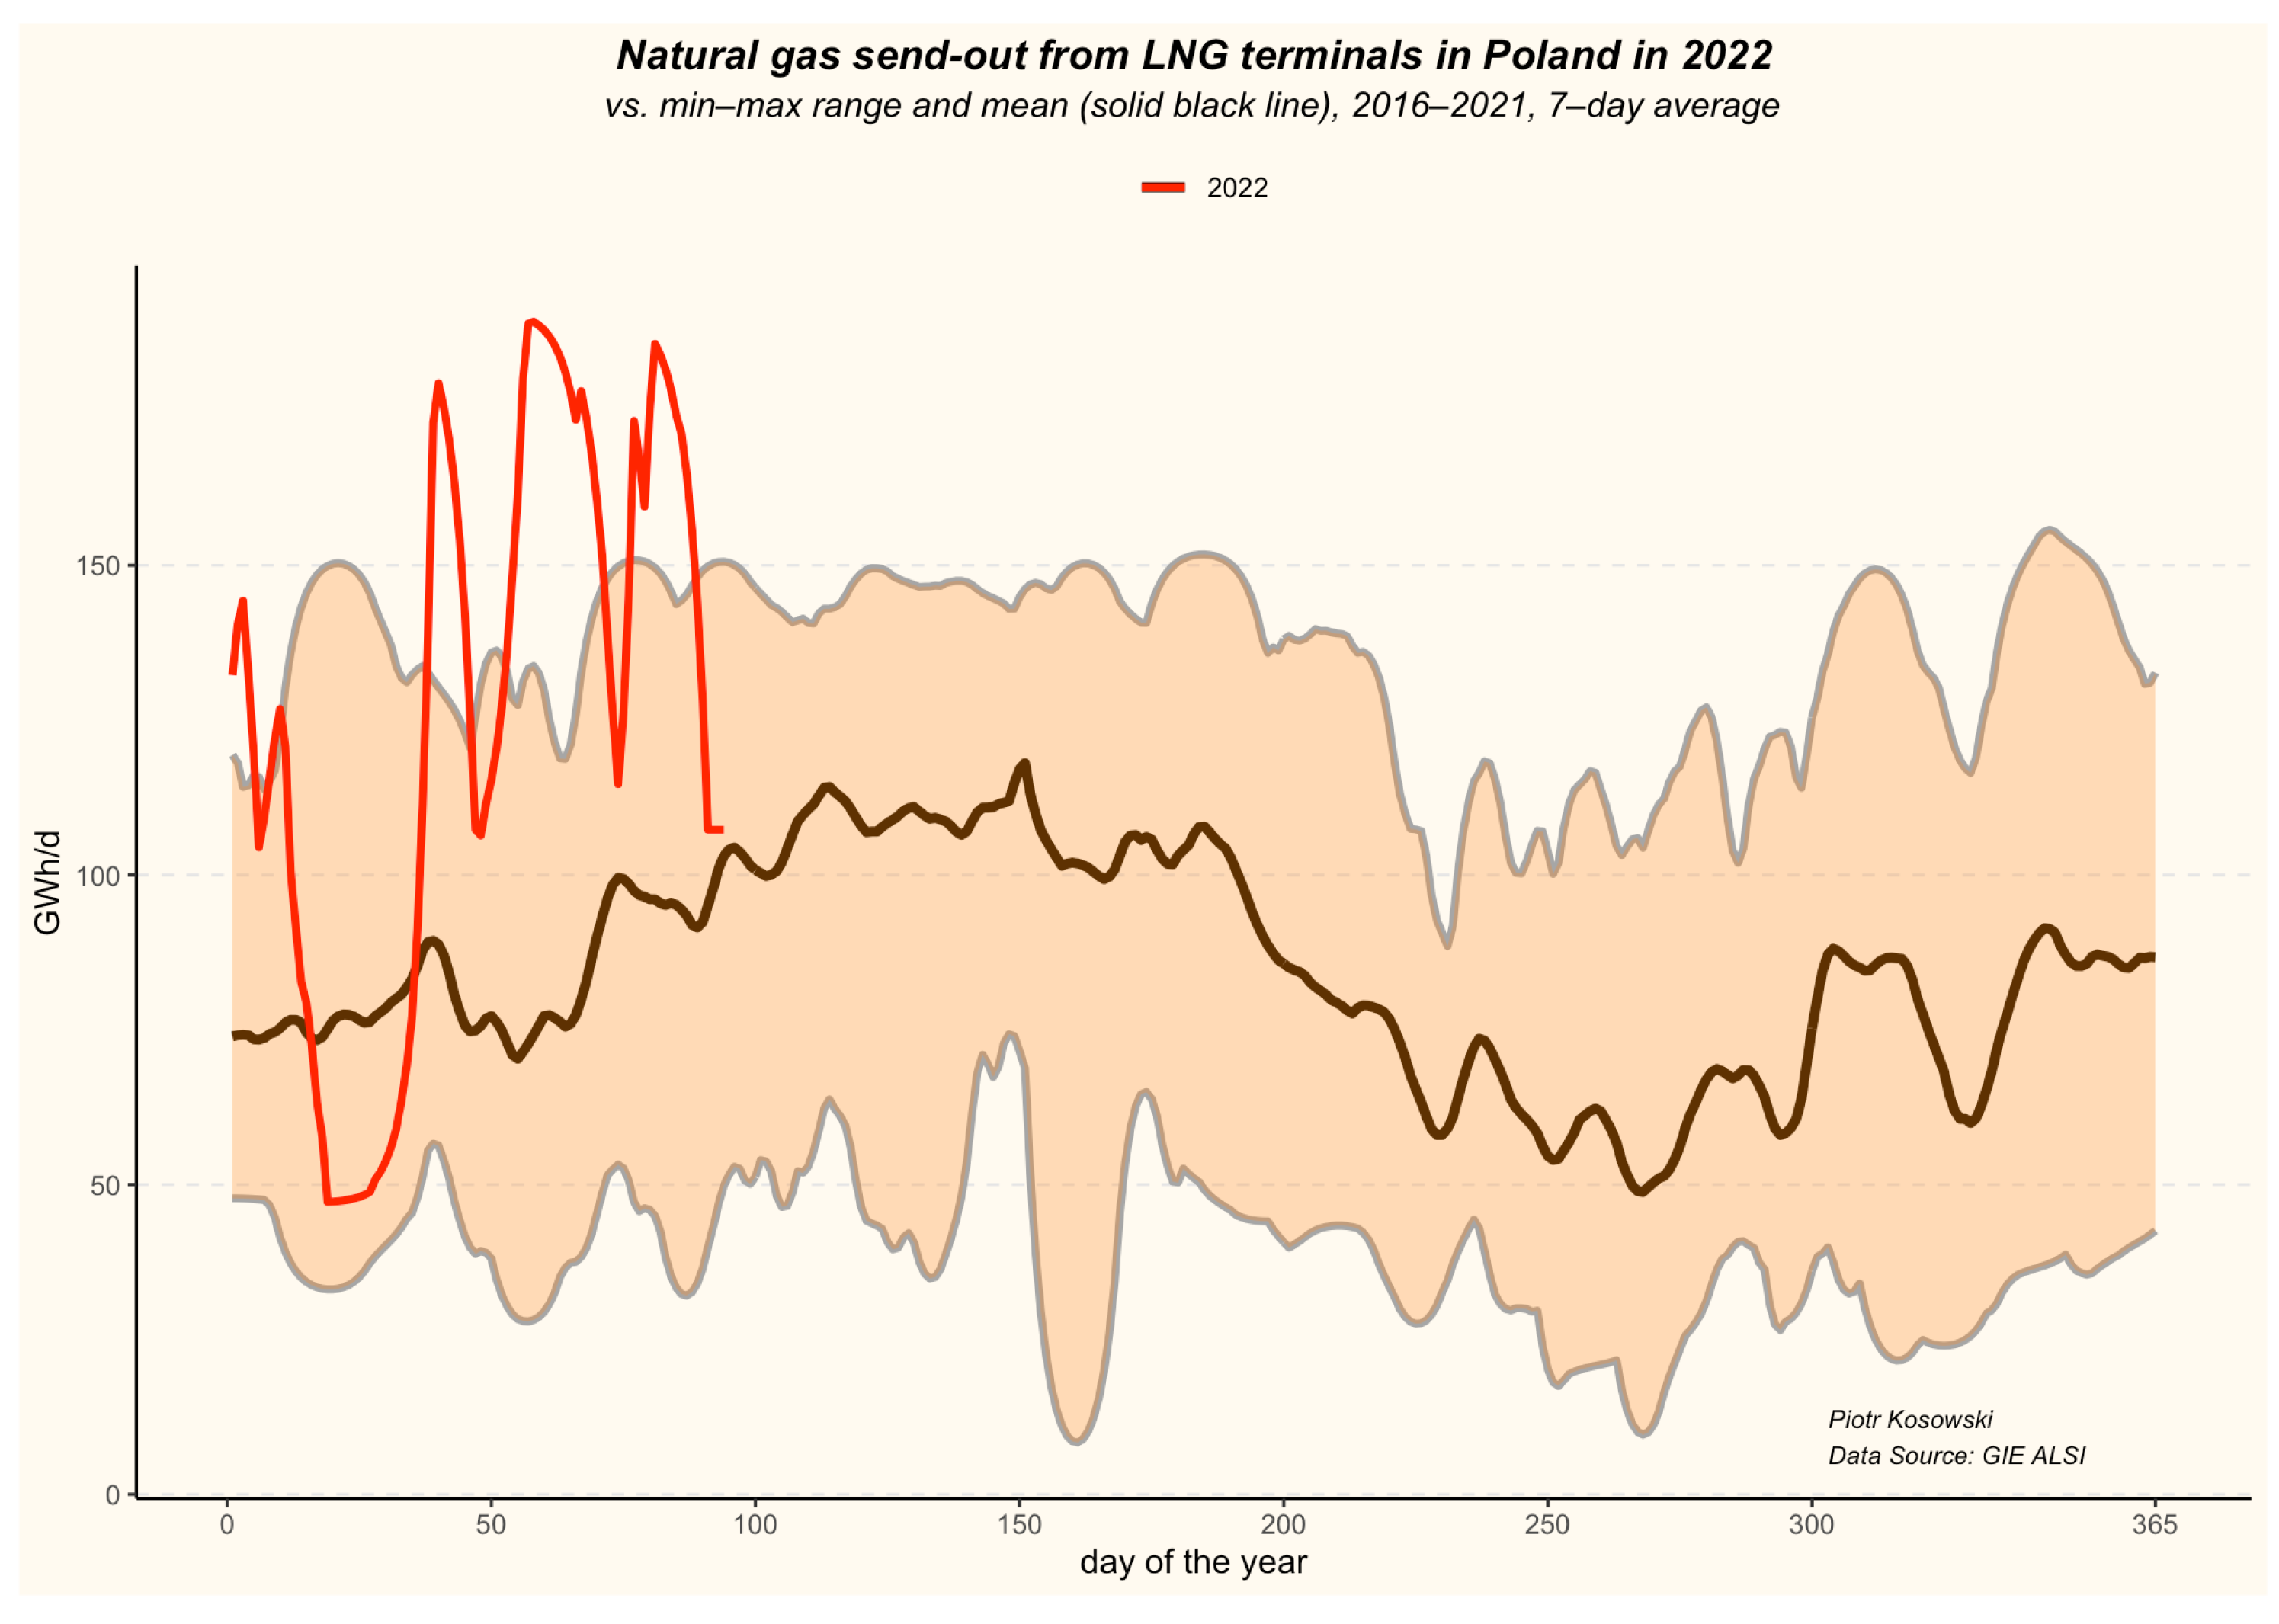
This was, among other factors, the effect of additional LNG deliveries obtained on the spot market and the record utilization of the regasification capacity of the LNG terminal in Świnoujście. As a result, in February and March 2022, the terminal delivered gas to the transmission system with historically unprecedented efficiency (Figure 13).
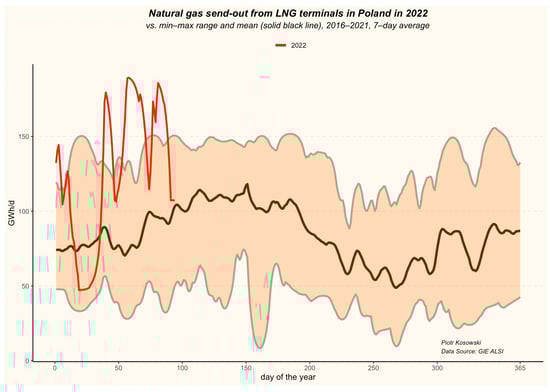
Figure 13.
Natural gas send-out from LNG terminal in Poland in 2022 compared to the long-term average and min–max range. Data Source: GIE AGSI+.
In order to identify dependencies between variables on the gas market and analyze their impact on this market (in particular on underground storage), the authors chose a set of variables and built a Bayesian network which describes the relationships between those variables.
3. Bayesian Networks
The Bayesian network (BN) can be presented as a precise description of direct relationships between a set of variables. Such a network takes the form of a directed acyclic graph consisting of nodes and arcs. A probability table (NPT) is assigned to each node [43].
- Directed Graph—A directed graph (also known as a topology or BN structure) consists of a set of nodes and arcs. Nodes are variables and arcs are connections between them. An arc from A to B expresses the assumption that there is a direct causal or influential dependence of A on B; in this case node A is the parent of node B, and B is the child of A. There are no cycles in such a graph—if we have an arc from A to B and from B to C, then we cannot have an arc from C to A.
- Node Probability Table (NPT)—Each node has an assigned probability table called the node probability (NPT) table. It is the probability distribution for a given set of parents of this node. For a node without parents (also called a root node), the NPT is simply the probability distribution for the variable [43].
The process of building a Bayesian network consists of the following steps:
- 1.
- Identification of a set of variables that are relevant to the problem.
- 2.
- Creation of a node for each identified variable.
- 3.
- Definition of each node’s type.
- 4.
- Determination of states for each non-simulation node.
- 5.
- Identification of connections between nodes (arcs).
- 6.
- Definition of an NPT for each node [43].
Despite the many advantages of Bayesian networks, their use over the years has been limited due to computational limitations. The difficulty was particularly acute when the number of nodes and connections between them was large. For this reason, this tool was not used to a greater extent to solve real decision-making and risk assessment. This situation changed in the late 1980s, when a number of algorithms were developed to ensure efficient propagation of many classes of Bayesian network models. In simple terms, their efficiency results from the use of Bayesian network structures, the variable elimination process and modular calculations that do not require computations for the entire probability model [43].
In recent years, Bayesian networks have gained popularity in many areas, including biology, economics, social sciences, computer science, medical diagnostics, operational and financial risk, cybersecurity, safety and quality assessment, sport-forecasting, law, forensics and equipment failure diagnostics. Their properties, such as the ability to learn cause–effect relationships, intuitive graphical representation, the ability to construct complex hierarchical models and the use of appropriate probability distributions for each of the Bayesian network elements have proved indispensable in many fields [48].
A particular advantage of Bayesian networks is their ability to effectively combine human and artificial sources of intelligence. Bayesian networks describe causes and effects using a graphical framework that ensures rigorous risk quantification and clear reporting of results. Quantitative probabilities are derived from historical data or expert judgments. Bayesian networks can then serve as the basis for answering probabilistic questions, the calculations are based on Bayes’ theorem from 1763 and provide a consistent way to update a belief about an uncertain event as we observe new evidence related to the event. Thus, Bayesian networks provide a general approach to reasoning, with explainable models of reality, unlike other approaches where the emphasis is on prediction rather than explanation, association, and causation [43].
4. Materials and Methods
The article presents an example of a Bayesian network showing the relationship between a number of variables describing the gas market in Europe. R programming language and RStudio IDE were used to create a Bayesian network [49,50]. These tools were selected because they provide a comprehensive and flexible environment for both data analysis and statistical modeling. Additionally, many dedicated Bayesian network packages are available, rendering the implementation of approaches presented in the literature much easier [48]. The main package used in the article was bnlearn which is an R package for learning the graphical structure of Bayesian networks, estimating their parameters and performing inference [51]. As the creator of this package writes: “bnlearn offers a wide variety of structure learning algorithms ([…] with several tests and network scores), parameter learning approaches (maximum likelihood for discrete and continuous data, Bayesian estimation for discrete data) and inference techniques (cross-validation, bootstrap, conditional probability queries and prediction)” [48].
The data used in the article come primarily from two sources—Eurostat database and Gas Infrastructure Europe AGSI+ and ALSI+ databases. The details are presented in Table 1.

Table 1.
Variables used in the model and their data sources.
Distribution of variables are presented in Figure 14. As can be clearly seen, the distribution of the variables used in the model can, in most cases, hardly be considered even close to normal. Therefore, we cannot use Gaussian Bayesian networks (GBN) in modeling [48].
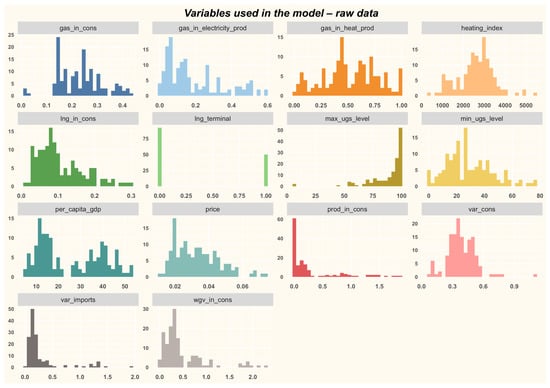
Figure 14.
Variables used in the model—raw data. Data Source: Eurostat, GIE AGSI+, GIE ALSI+.
For this reason, these variables were subjected to a discretization process in the next stage of model preparation. There are three main methods of discretization:
- quantile—each variable is discretized independently into k intervals delimited by empirical quantiles,
- interval—each variable is discretized independently into k equally-spaced intervals,
- information-preserving—variables are jointly discretized while preserving as much of the pairwise mutual information between the variables as possible [48].
Variable discretization was carried out according to the third approach, using the Hartemink algorithm which was created in 2001 [48,52]. The main idea is to pre-discretize each variable into a large number of intervals, thereby minimizing information loss. Then the algorithm iterates over the variables and collapses a pair of adjacent intervals for each of them, which minimizes the loss of paired mutual information in pairs. The algorithm stops when the number of intervals for all variables is . As a result the set of discretized variables keeps the relationship structure of the original data much better than a quantile or interval discretization would allow.
The article adopts a slightly simplified approach because it was decided that, ultimately, the discretized variables would have three value ranges. In the future, while working on the development of this approach, differentiation of this number for individual variables is planned. At the moment, the approach presented above seems to be sufficient, especially since the model is at an early stage of development. One of the variables (lng_terminal) was already a discrete variable (0—No, 1—Yes). The calculations were performed using a function built into the bnlearn package. The variables after discretization are presented in Figure 15.
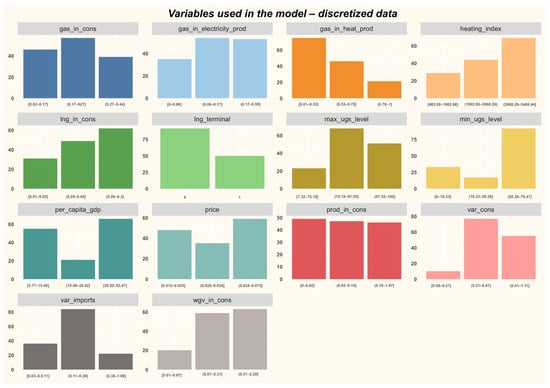
Figure 15.
Variables used in the model—discretized data. Data Source: Eurostat, GIE AGSI+, GIE ALSI+.
5. Results
The data, after being prepared, were used to create a Bayesian network modeling the relationships between the variables influencing the fill level of underground natural gas storage facilities in Europe. The target, modeled value was the minimum level of inventory during the year (usually achieved at the end of the winter season).
Despite having knowledge of the gas market, the authors decided to use the algorithm implemented in the bnlearn package as the basis for the creation of the Bayesian network structure. The only limitation imposed above was the assumption that the min_ugs_level node would not be a parent node for any other node.
There are several algorithms that can be used to find the optimal Bayesian network structure. A relatively simple one is the hill-climbing algorithm [53]. It works as follows: it starts with a net with all nodes and no arcs, then adds, removes, and inverts one arc at a time, and keeps the change which most increases the network score [48]. In this case the Bayesian Information Criterion (BIC) was used as a network score [54].
5.1. Optimized Structure of the Bayesian Network
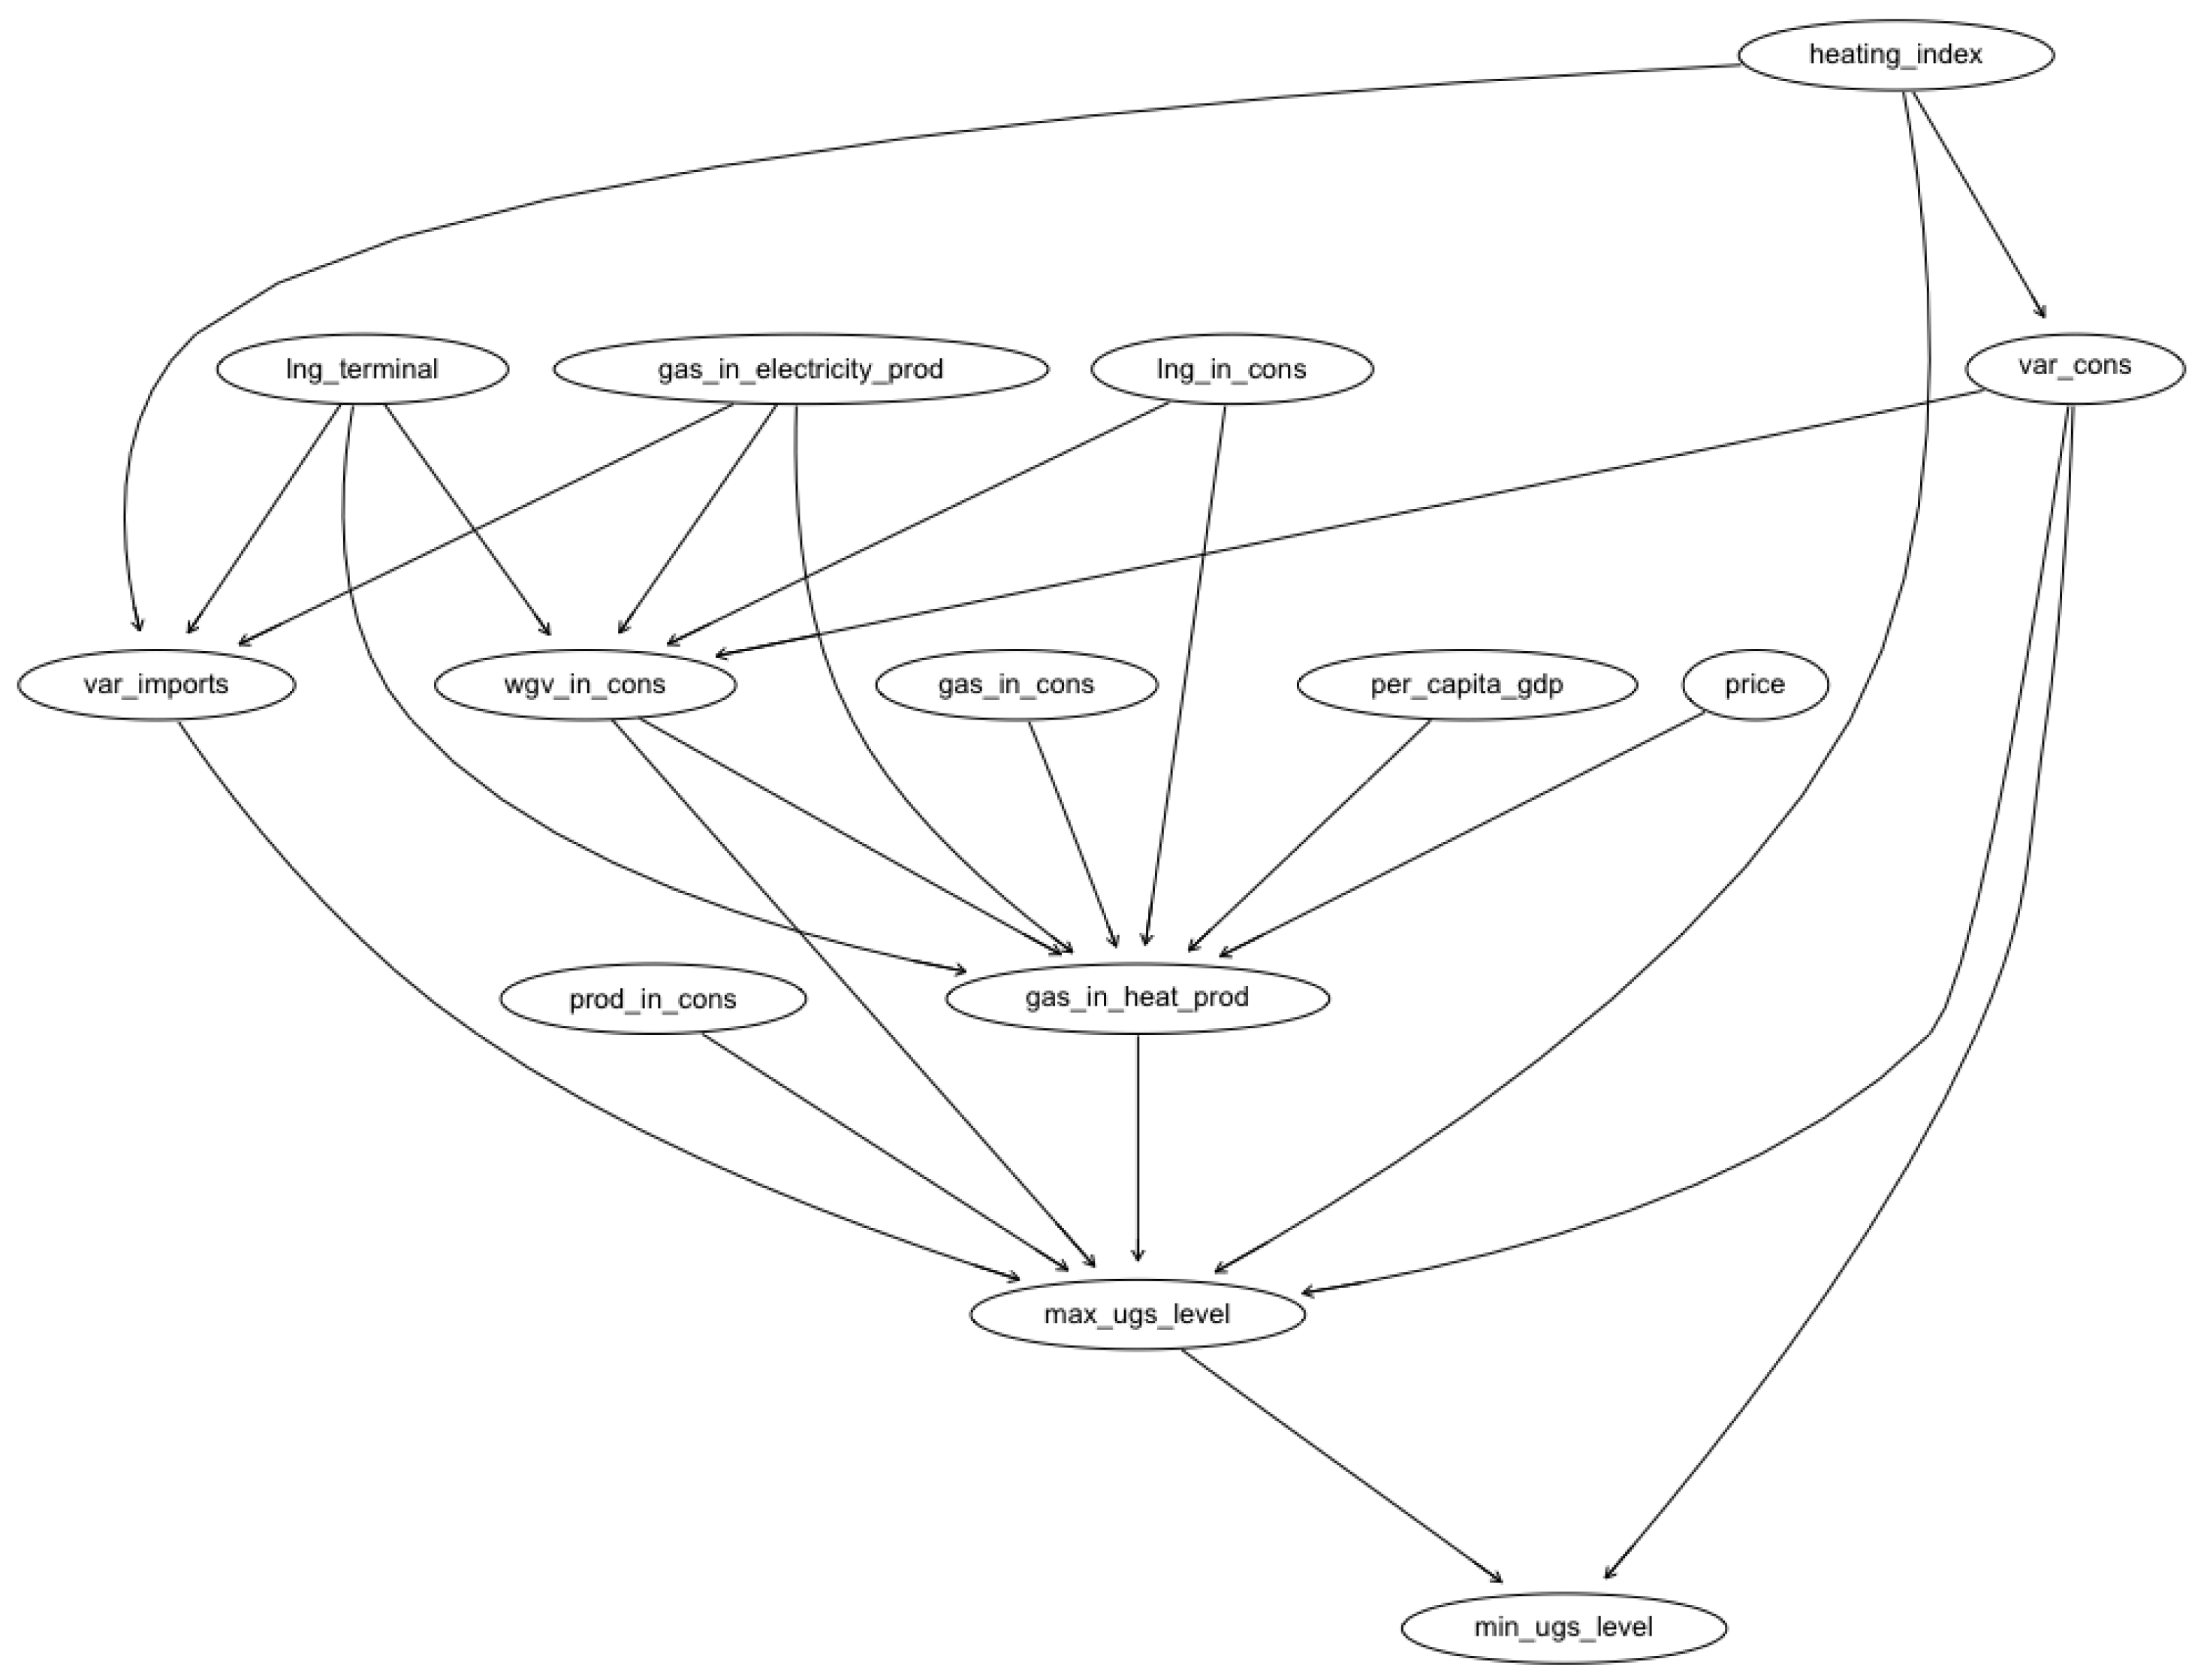
The final structure of the network is shown in Figure 16. Some interesting relationships are revealed on it and, in the authors’ opinion, it is unlikely that all of them could be identified if the network was built manually, relying only on expert knowledge.

Figure 16.
Structure of the final Bayesian network.
In the presented model, the minimum inventory level of gas storage directly depends on two variables:
- natural gas consumption volatility (var_cons),
- maximum level of inventory in the storage facility before the winter season (max_ugs_level).
Consumption volatility depends on only the climatic conditions represented in the model by the heating index (heating_index). It should be remembered that if the model were enriched with additional variables, these dependencies may look different. For example, the structure of consumption, i.e., the share of households, industry and the service sector, could also influence the volatility of consumption. Of course, the above observation applies to all other dependencies in the presented model. The authors plan to gradually develop this model and introduce additional variables and dependencies.
The maximum level of inventory in gas storage facility already depends on more variables. These are:
- consumption volatilty (var_cons),
- share of gas in heat production (gas_in_heat_prod),
- heating index (heating_index),
- share of storage capacity in the annual consumption of natural gas (wgv_in_cons),
- share of the annual production of natural gas in the annual consumption (prod_in_cons),
- import volatility (var_imports).
In turn, the volatility of imports is influenced by:
- heating index (heating_index),
- presence of an LNG terminal (lng_terminal),
- share of gas in the production of electricity (gas_in_electricty_prod).
The share of storage capacity in the annual gas consumption depends on:
- presence of an LNG terminal (lng_terminal),
- share of gas in the production of electricity (gas_in_electricty_prod),
- natural gas consumption volatility (var_cons),
- share of LNG in the annual consumption of natural gas (lng_in_cons),
The following variables influence the share of gas in heat production:
- presence of an LNG terminal (lng_terminal),
- share of storage capacity in the annual consumption of natural gas (wgv_in_cons),
- share of gas in the production of electricity (gas_in_electricty_prod),
- share of natural gas in total primary energy consumption (gas_in_cons),
- share of LNG in the annual consumption of natural gas (lng_in_cons),
- GDP per capita (per_capita_gdp),
- price of natural gas (price).
The remaining variables have no parents and are examples of root nodes.
5.2. Conditional Probability Tables (CPTs)
The Bayesian network presented in the article contains conditional probability tables (CPT) for all of its nodes and the probability values contained in them are based on the data used in its construction process. Table 2 and Table 3 show CPTs for two example nodes—var_cons and min_ugs_level.
Table 2.
Conditional probability table (CPT) for var_cons node.
Table 3.
Conditional probability table (CPT) for min_ugs_level node.
In the case of the var_cons node, which represents the variability of natural gas consumption, expressed as the variation coefficient of monthly consumption, CPT is relatively simple because in the analyzed network this node has only one parent node—heating_index. Furthermore, so, assuming that heating_index is in the range of 403.99 to 1902.06, the coefficient of variation (var_cons) will be (Table 2):
- from 0.084 to 0.213 with a probability of 31%
- from 0.213 to 0.414 with a probability of 55.2%
- from 0.414 to 1.114 with a probability of 13.8%
The CPT for the minimum inventory level is more complex, since this node has two parents—var_cons and max_ugs_level (Table 3).
5.3. Evidence-Based Inference
Despite this increased complexity, a key advantage of Bayesian networks is the ability to make evidence-based inferences. Evidence-based inferences were made in three cases:
- Minimal level of gas inventory (min_gas_level) based on the volatility of gas consumption (var_cons) evidence.
- LNG terminal presence (lng_terminal) based on maximum level of gas inventory (max_gas_level).
- Share of gas storage capacity in gas consumption (wgv_in_cons) based on gas share in electricity (gas_in_electricity_prod) and LNG terminal presence (lng_terminal).
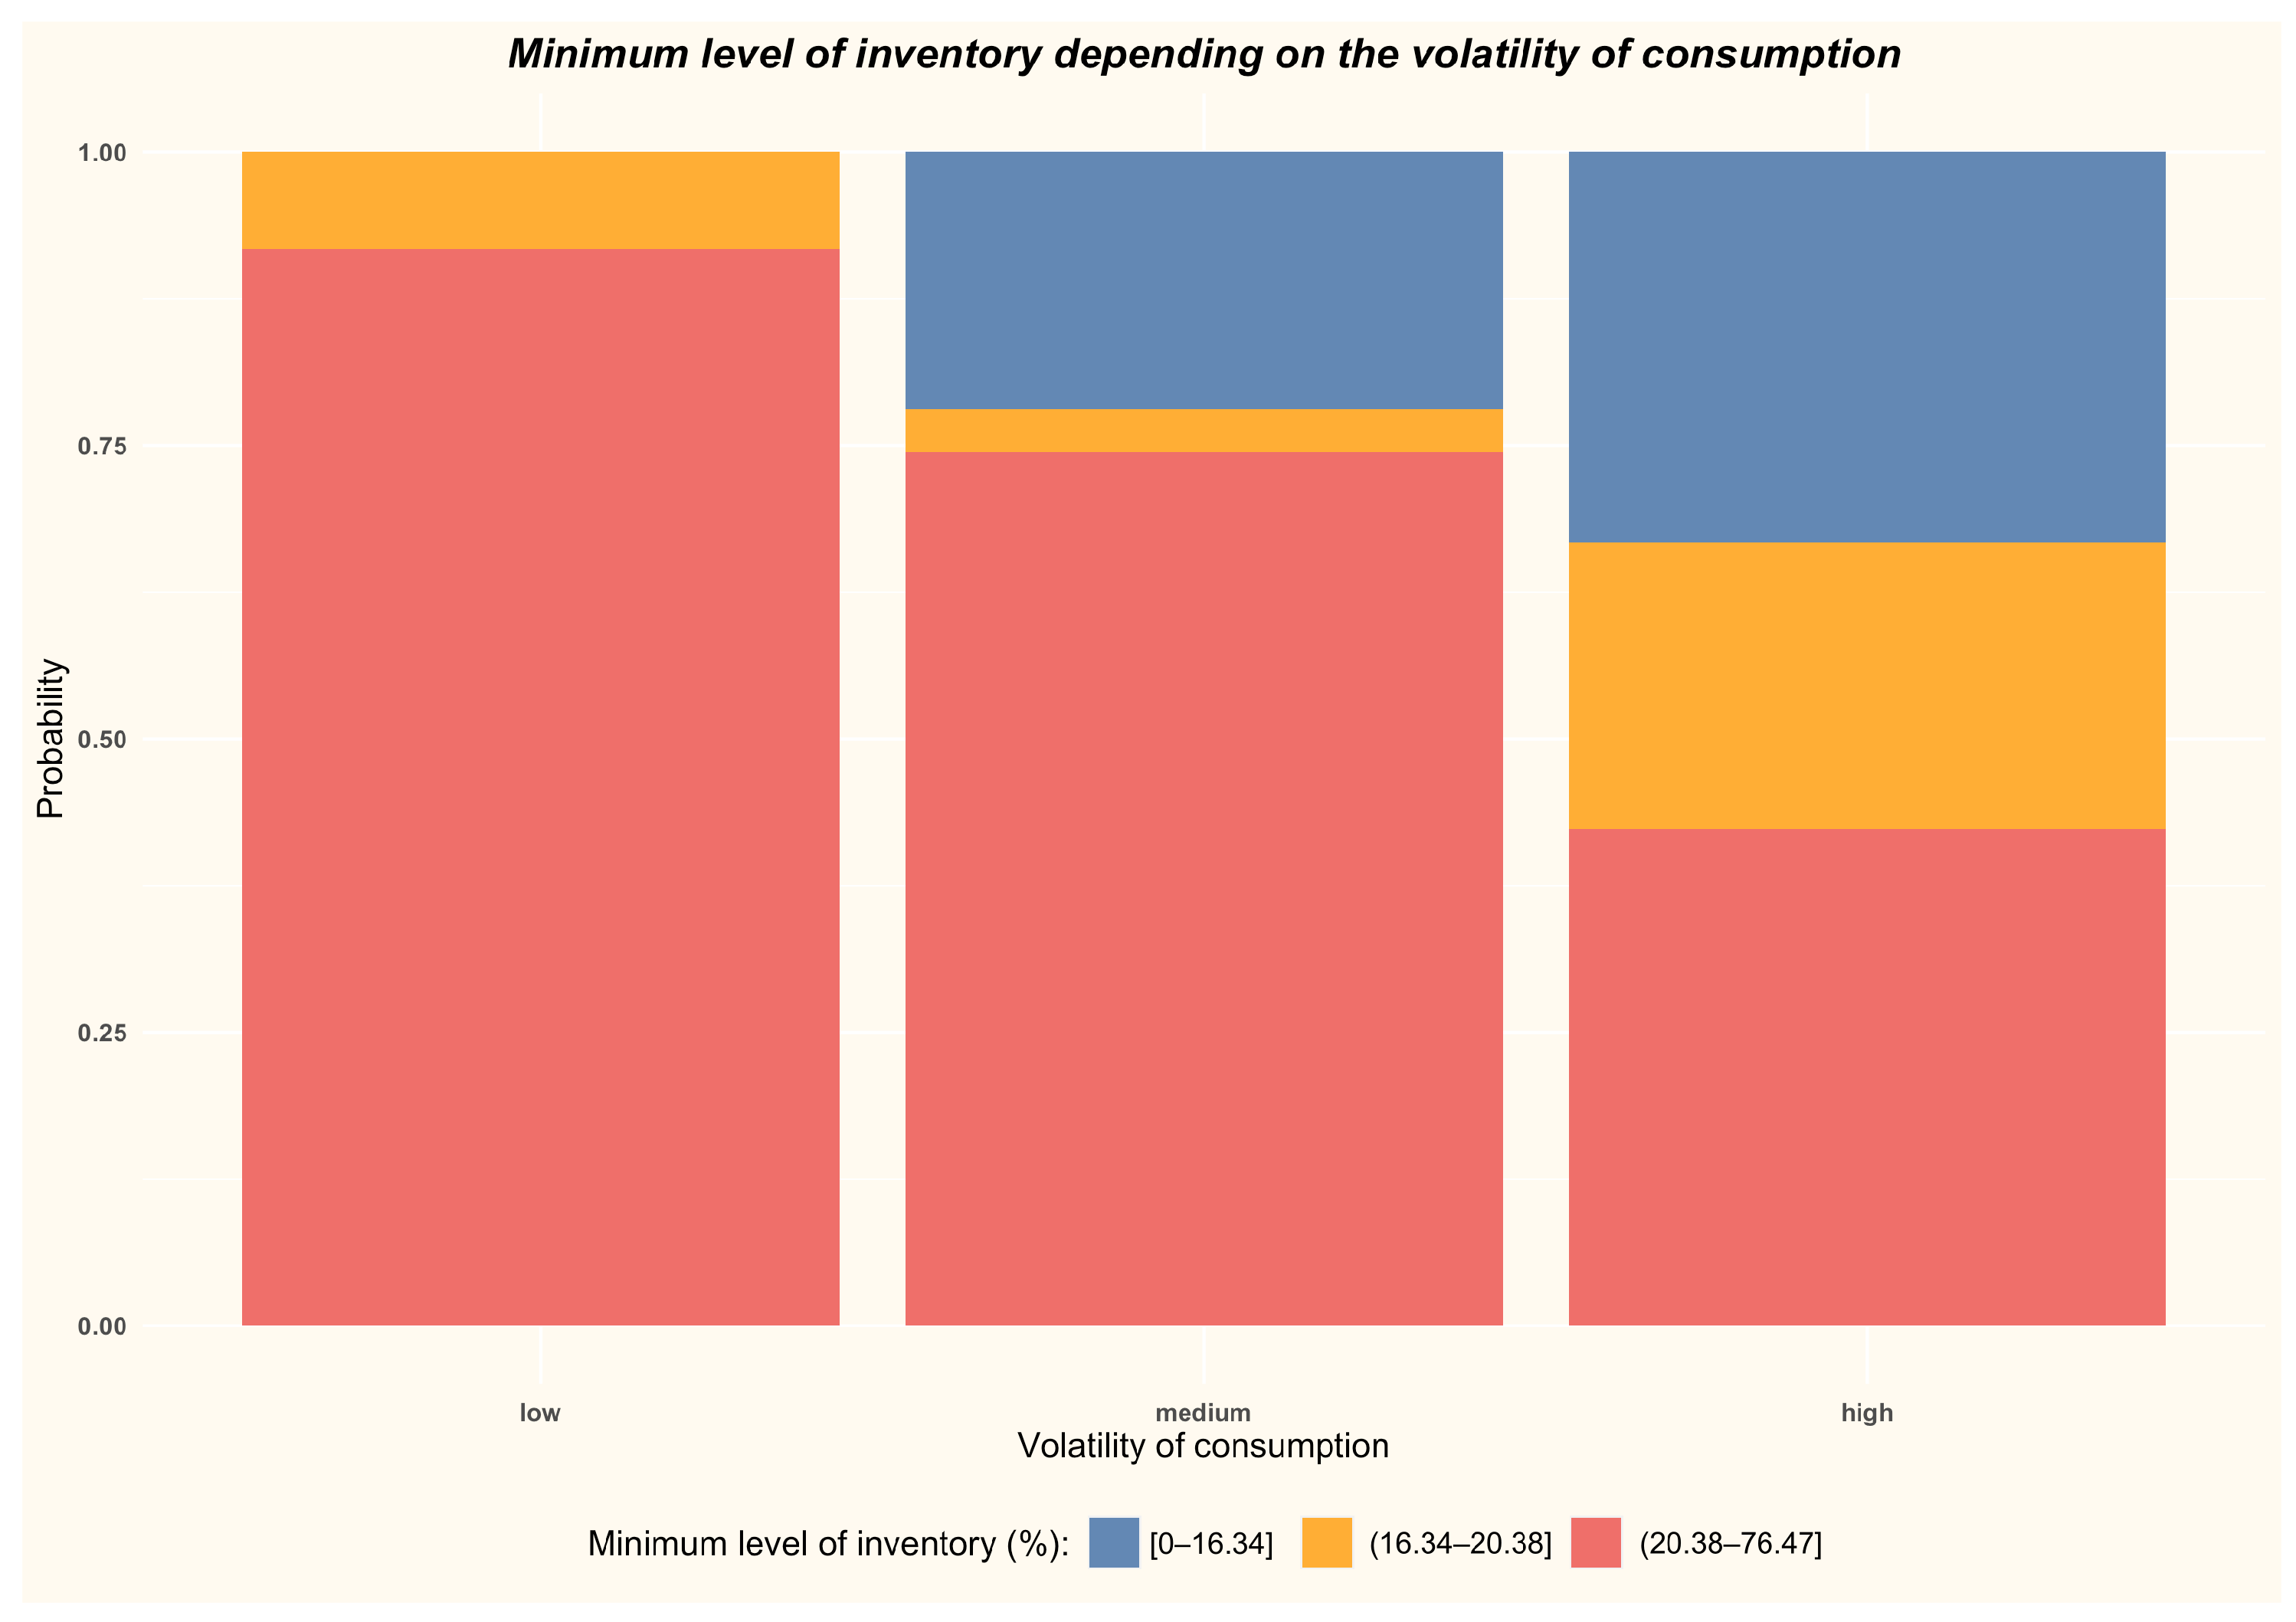
5.3.1. Minimal Level of Gas Inventory (min_gas_level) Based on the Volatility of Gas Consumption (var_cons) Evidence
The probability for the minimum inventory level was estimated using the Bayesian network presented earlier. The evidence used was the volatility of gas consumption in three variants:
- low—[0.084–0.213]
- medium—(0.213–0.414]
- high—(0.414–1.114]
The results are presented in Table 4 and in Figure 17. We can clearly see that as the volatility of natural gas consumption increases, the probability that stocks at the end of the heating season will be low also rise. For the low consumption variant the probability of low inventories is 0%, for the medium variant it is almost 22%, and for high it is over 33%. The probability that the minimum stock level will be high obviously decreases as volatility increases (from 92% to 42%). Therefore, there is no doubt that the volatility of natural gas consumption has a large impact on the minimum stocks of natural gas reached during the year.
Table 4.
Probability of minimal level of inventory (min_ugs_level) depending on volatility of gas consumption (var_cons).

Figure 17.
Minimal level of inventory depending on the volatility of consumption.
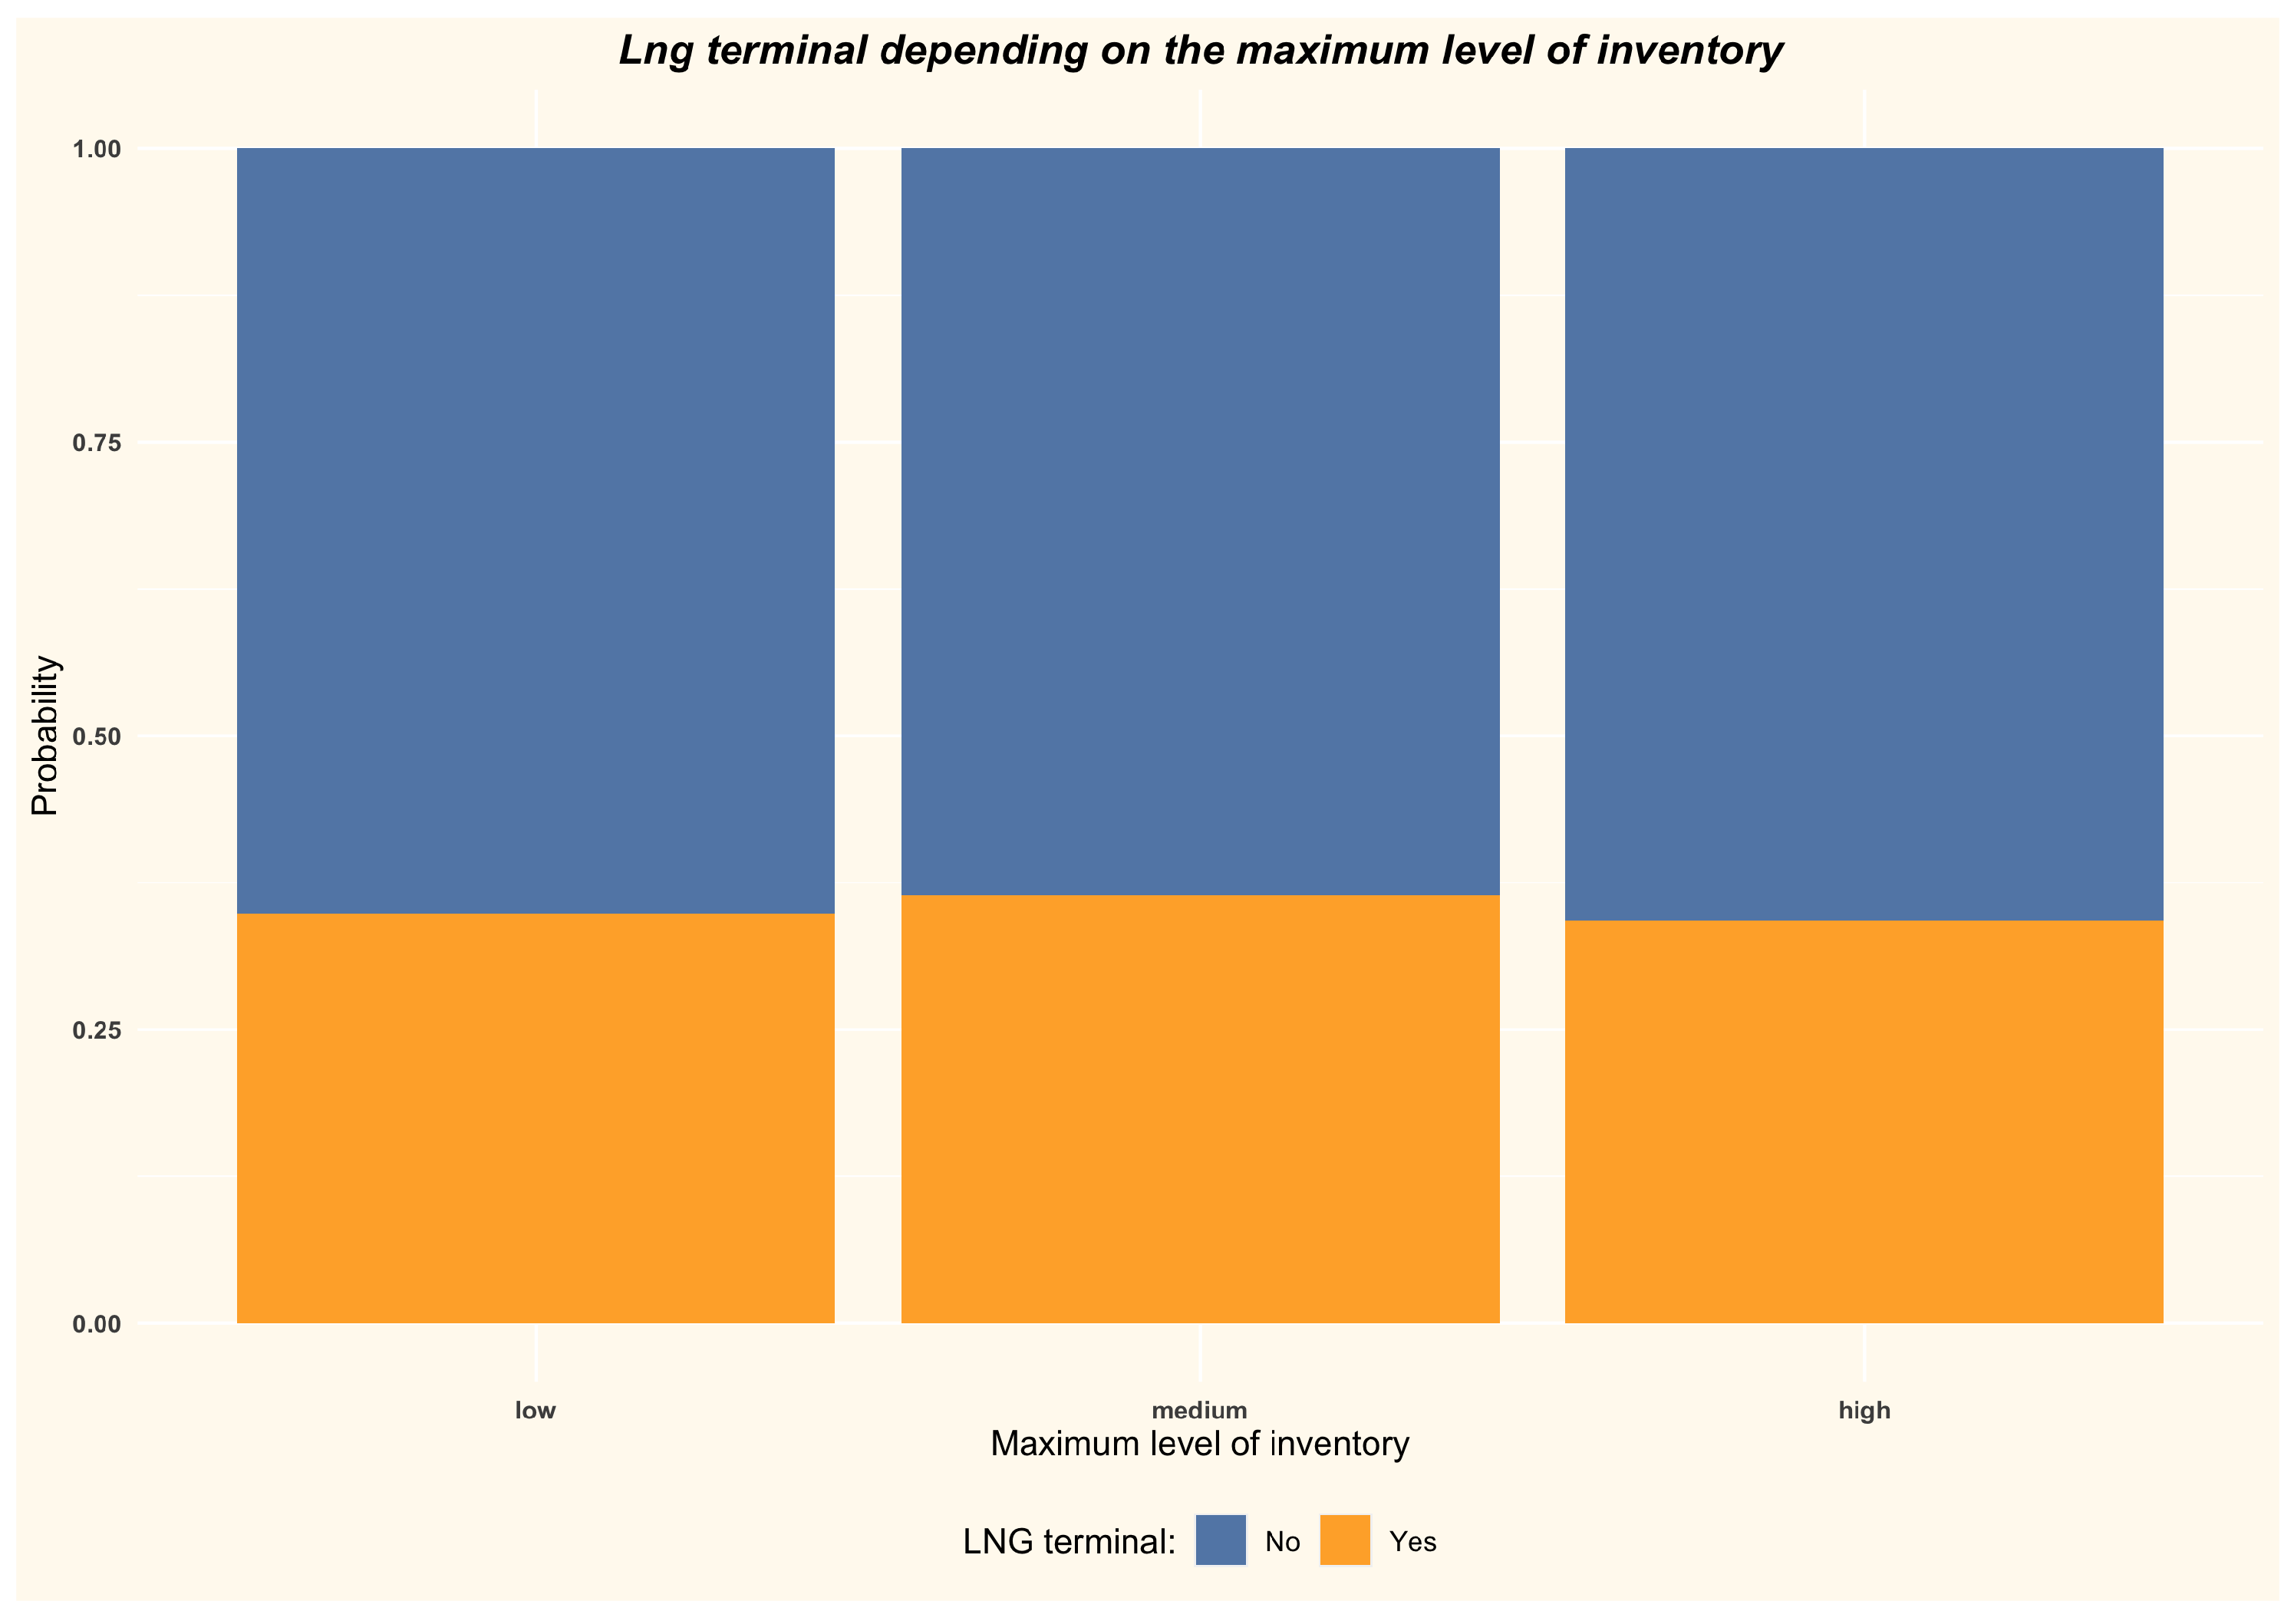
5.3.2. Presence of an LNG Terminal (lng_terminal) Based on Maximum Level of Gas Inventory (max_gas_level)
The situation is slightly different when we analyze the relationship between the maximum level of inventory in gas storage facilities and the presence of an LNG terminal in a given country. It can be seen that these probabilities are similar for each level of maximum inventory level (Table 5 and Figure 18). It can therefore be concluded that the relationship between these variables is not very strong.
Table 5.
Probability of the existence of an LNG terminal (lng_terminal) depending on the maximum level of inventory (max_ugs_level).
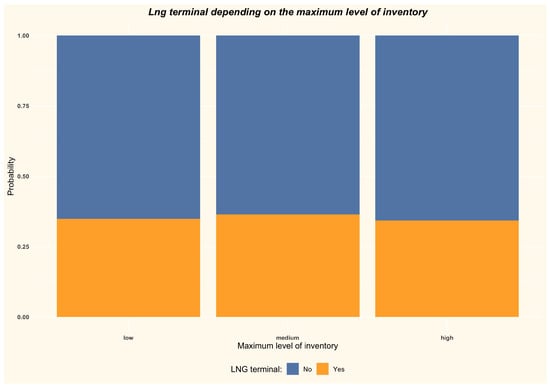
Figure 18.
Existence of an LNG terminal depending on the maximum level of inventory.
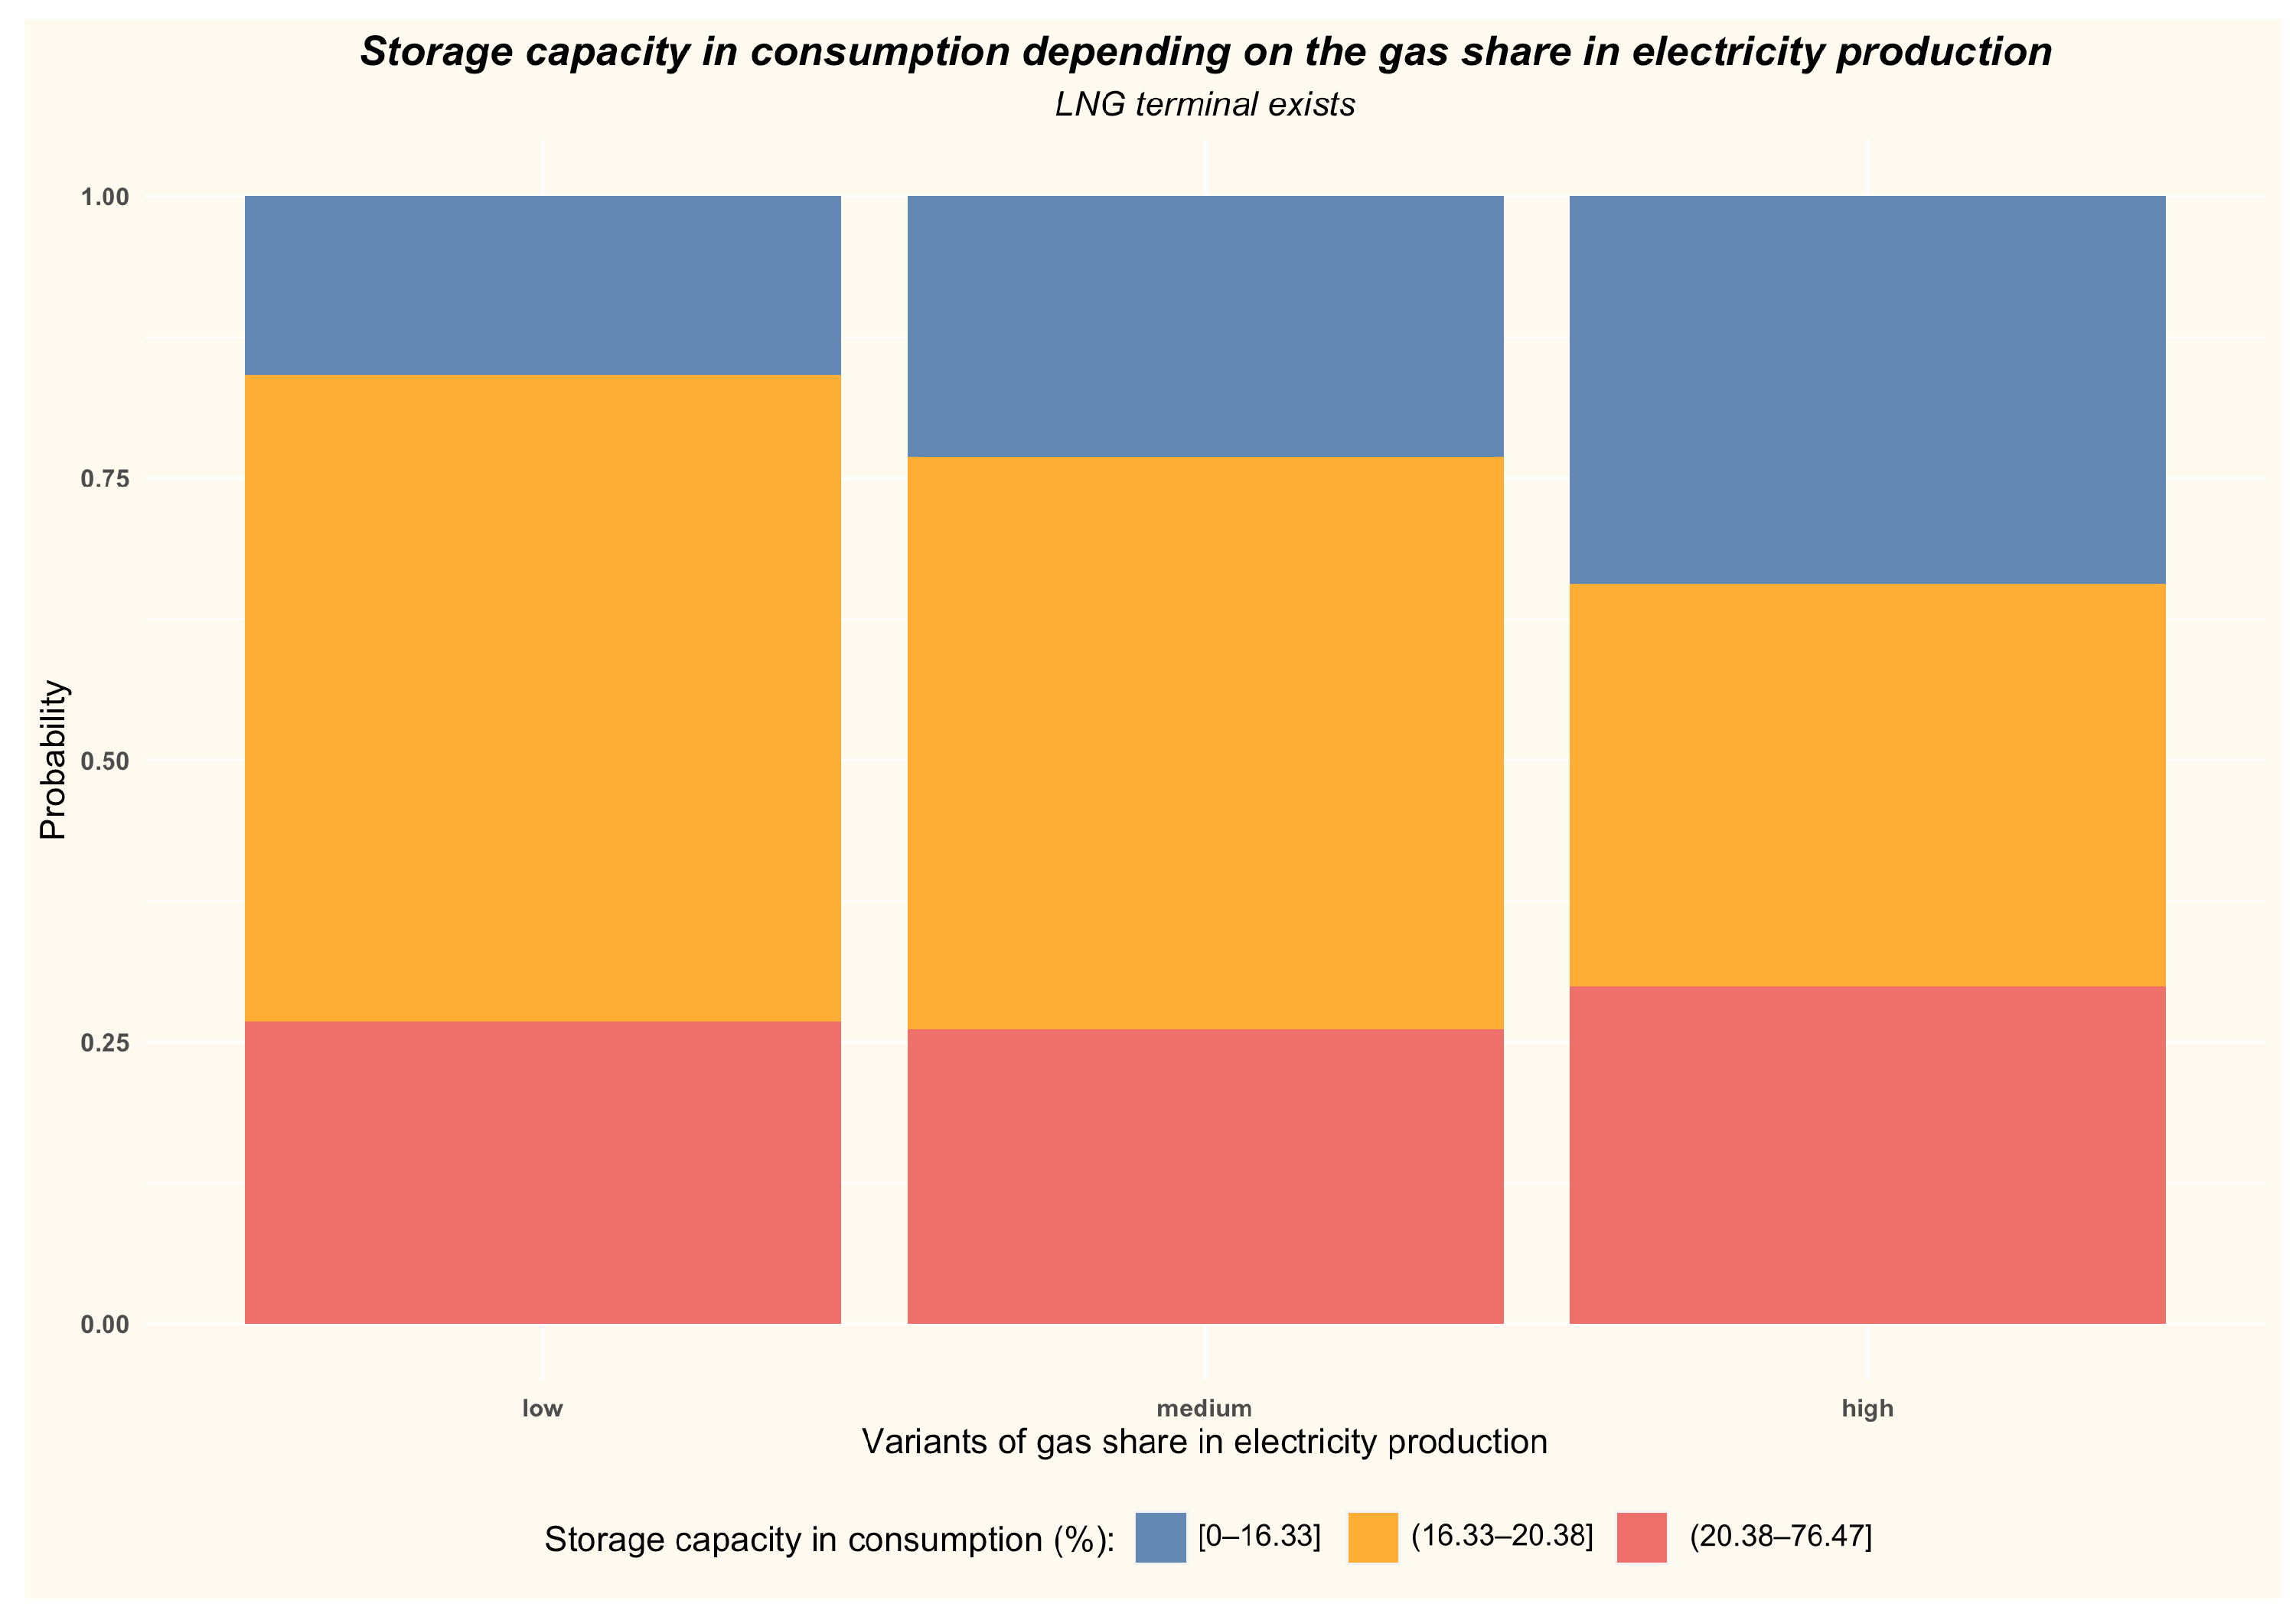
5.3.3. Share of Gas Storage Capacity in Gas Consumption (wgv_in_cons) Based on Gas Share in Electricity (gas_in_electricity_prod) and Presence of an LNG Terminal (lng_terminal)
The results of the analysis of the share of storage capacity in the consumption of natural gas, depending on whether there is an LNG terminal in a given country and on the share of natural gas in the production of electricity, are interesting. When there is an LNG terminal in a given country, we notice an interesting phenomenon—with the increase in the share of gas in electricity production, the probability of the medium share of storage capacity in the consumption of natural gas decreases (Table 6 and Figure 19). In contrast for a low and high share it grows (more for a low share). It seems that having an LNG terminal is a security measure and serves as a kind of alternative to underground gas storage.
Table 6.
Probability of gas storage capacity share in gas consumption (wgv_in_cons) depending on the gas share in electricity production (gas_in_electricity_prod) when an LNG terminal exists (lng_terminal).

Figure 19.
Share of storage capacity in gas consumption depending on gas share in electricity production when an LNG terminal exists.
If, on the other hand, there is no LNG terminal in a given country, the probability of a high share of storage capacity in consumption increases along with the increase in the share of natural gas in electricity production (Table 7 and Figure 20). This is unsurprising because, lacking an alternative (e.g., an LNG terminal), underground gas storage is the only way to ensure continuity of energy supply where a significant proportion of electricity is generated through the use of gas. Running out of gas would bear very serious consequences.
Table 7.
Probability of gas storage capacity share in consumption (wgv_in_cons) depending on the gas share in electricity production (gas_in_electricity_prod) when an LNG terminal does not exist (lng_terminal).
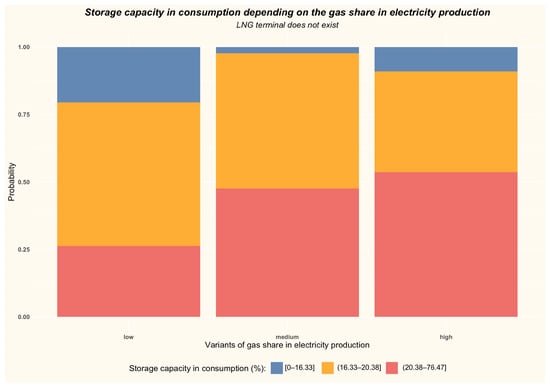
Figure 20.
Share of storage capacity in gas consumption depending on gas share in electricity production when an LNG terminal does not exist.
6. Discussion and Conclusions
Bayesian networks are an effective and flexible tool that allow analysis of the relationships between the variables that build them and model their values based on evidence. Utilization of this powerful tool enables the performance of the entire system to be understood, modeled and improved.
This has been presented in this article, where the authors have shown a relatively simple Bayesian network model that uses historical data from the European gas market and allows the estimation of the values of the variables that affect underground natural gas storage. It was built using the R programming language, the RStudio IDE and the bnlearn package. The data used in the model come from two sources: Eurostat and Gas Infrastructure Europe databases. The paper fills a gap, because the authors have not yet encountered a published attempt to model the gas market in this way.
The article presents two stages of work with the Bayesian network. In the first one, a network was built based on historical data. It shows the relationships between the variables as well as the probability of the value ranges of individual variables.
The target variable—the minimum level of inventory of gas storage facilities at the end of the heating season, directly depends on two factors: the volatility of gas consumption and the maximum filling level of the storage facilities before winter.
Consumption volatility depends on only the climatic conditions represented in the model by the heating index.
The maximum level of inventory in gas storage facility depends on more variables. These are: the consumption volatilty, the share of gas in heat production, the heating index, the share of storage capacity in the annual consumption of natural gas, the share of the annual production of natural gas in the annual consumption and volatility of the gas imports.
The volatility of imports is influenced by the heating index, the presence of an LNG terminal and the share of gas in the production of electricity.
The share of storage capacity in the annual gas consumption depends on: the presence of an LNG terminal, the share of gas in the production of electricity, the natural gas consumption volatility and the share of LNG in the annual consumption of natural gas.
The share of gas in heat production is influenced by: the presence of an LNG terminal, the share of storage capacity in the annual consumption of natural gas, the share of gas in the production of electricity, the share of natural gas in total primary energy consumption, the share of LNG in the annual consumption of natural gas, the GDP per capita and the price of natural gas.
The relationships presented in the model are interesting and, importantly, it is probable that not all of them would have been identified if expert knowledge only was used in the process of creating a Bayesian network, and the network itself was built manually. All the probabilites are derived from the historical data.
A huge advantage of this Bayesian network is that it can be used to model various scenarios of the gas market, and a valuable additional feature is the ability to make statistical inferences for all of its nodes. During such inferences, we enter data for selected variables (evidence) into the model and calculate the probabilities for the nodes of interest.
Several examples of such inferences are presented in the second stage of the analysis, examining the impact of consumption variability on the level of inventory in underground gas storage facilities, the impact of having an LNG terminal and the share of natural gas in electricity production on the storage capacity of a given country.
We can clearly see that as the volatility of natural gas consumption increases, the probability that stocks at the end of the heating season will be low also rise.
The situation is slightly different when we analyze the relationship between the maximum level of inventory in gas storage facilities and the presence of an LNG terminal in a given country. It can be seen that these probabilities are similar for each level of maximum inventory level. It can therefore be concluded that the relationship between these variables is not very strong.
The results of the analysis of the share of storage capacity in the consumption of natural gas, depending on whether there is an LNG terminal in a given country and on the share of natural gas in the production of electricity, are interesting. When there is an LNG terminal in a given country, we notice an interesting phenomenon—with the increase in the share of gas in electricity production, the probability of the medium share of storage capacity in the consumption of natural gas decreases. In contrast, for a low and high share it grows (more for a low share). It appears that having an LNG terminal is a security measure and serves as a kind of alternative to underground gas storage.
Such a network may be helpful in assessing the impact of energy policies, investments, climate, geopolitical challenges and unforeseen events on the gas market. This can significantly simplify the process of managing it, especially from the perspective of identifying, assessing and managing risk. The development of such tools is in the best interest of states and energy companies, and they should be permanently included in the portfolio of tools used for management at both the operational and strategic levels.
The beginning of 2022 was dominated by Russia’s brutal aggression against Ukraine coupled with an imbalance in global energy security. These events open a new chapter in research and approaches to energy security. We are likely to face very large changes, the scale of which we are not yet able to predict. On the one hand, there is talk of a return to the use of fossil fuels on a larger scale, mainly solid ones, and on the other hand, there are discussions about the inevitable acceleration of energy transformation towards the use of renewable energy sources. Additionally, the global population is currently struggling with high inflation, caused, on the one hand by years of very lenient monetary policy, and on the other hand by the soaring energy prices that are spreading throughout the economy, increasing the price of almost all goods and services.
At present it is difficult to predict how this situation will develop in the short, medium and long term, but the use of tools such as Bayesian networks allows us to better discover the interrelationships between variables influencing the energy market, analyze them, and estimate the impact on energy security of distinct scenarios described with specific metrics. A simple example of such a metric, i.e., the minimum level of gas storage at the end of the winter season, as well as its analysis and modeling using a relatively simple Bayesian network, is presented in this article.
Author Contributions
Conceptualization, P.K., K.K. and W.N.; methodology, P.K.; software, P.K.; validation, P.K.; formal analysis, P.K.; investigation, P.K.; resources, P.K.; data curation, P.K.; writing—original draft preparation, P.K.; writing—review and editing, P.K., K.K. and W.N.; visualization, P.K., energy security definitons, K.K. All authors have read and agreed to the published version of the manuscript.
Funding
This research was cofinanced by the Research Subsidy of the AGH University of Science and Technology for the Faculty of Drilling, Oil and Gas (No. 16.16.190.779).
Institutional Review Board Statement
Not applicable.
Informed Consent Statement
Not applicable.
Data Availability Statement
Only publicly available data were used in this article.
Conflicts of Interest
The authors declare no conflict of interest.
Abbreviations
The following abbreviations are used in this manuscript:
| LNG | Liquefied Natural Gas |
| IEA | International Energy Agency |
| EU27 | Countries of the European Union |
| GIE | Gas Infrastructure Europe |
| BN | Bayesian Network |
| NPT | Node Probability Table |
| IDE | Integrated Development Environment |
| GBN | Gaussian Bayesian Networks |
| BIC | Bayesian Information Criterion |
| GDP | Gross Domestic Product |
| CPT | Conditional Probability Table |
References
- Schumacher, E.; Kirk, G. Schumacher on Energy: Speeches and Writings of E.F. Schumacher; Cape: London, UK, 1982. [Google Scholar]
- Stern, D. Energy and Economic Growth: The Stylized Facts. 2011. Available online: http://www.sterndavidi.com/Publications/Foundation%20Seminar.pdf (accessed on 30 May 2022).
- Mazur, A.; Rosa, E. Energy and Life-Style. Science 1974, 186, 607–610. [Google Scholar] [CrossRef] [PubMed]
- Asif, M.; Muneer, T. Energy supply, its demand and security issues for developed and emerging economies. Renew. Sustain. Energy Rev. 2007, 11, 1388–1413. [Google Scholar] [CrossRef]
- IEA. World Energy Balances 2016; Technical Report; International Energy Agency: Paris, France, 2016. [Google Scholar]
- Kinnear, J. Oil and the Military. The Challenge of Leadership. Vital Speeches Day 1993, 59, 429–433. [Google Scholar]
- Kemp, G. Scarcity and Strategy. Foreign Aff. 1978, 56, 396. [Google Scholar] [CrossRef]
- Månsson, A.; Johansson, B.; Nilsson, L.J. Assessing energy security: An overview of commonly used methodologies. Energy 2014, 73, 1–14. [Google Scholar] [CrossRef] [Green Version]
- Bahgat, G. Oil Security at the Turn of the Century: Economic and Strategic Implications. Int. Relat. 1999, 14, 41–52. [Google Scholar] [CrossRef]
- Cocklin, C. Anatomy of a future energy crisis Restructuring and the energy sector in New Zealand. Energy Policy 1993, 21, 881–892. [Google Scholar] [CrossRef]
- Coates, J.F. Technological change and future growth: Issues and opportunities. Technol. Forecast. Soc. Chang. 1977, 11, 49–74. [Google Scholar] [CrossRef]
- Cherp, A.; Jewell, J. The three perspectives on energy security: Intellectual history, disciplinary roots and the potential for integration. Curr. Opin. Environ. Sustain. 2011, 3, 202–212. [Google Scholar] [CrossRef] [Green Version]
- Sovacool, B.K. Differing cultures of energy security: An international comparison of public perceptions. Renew. Sustain. Energy Rev. 2016, 55, 811–822. [Google Scholar] [CrossRef]
- Cox, E. Assessing long-term energy security: The case of electricity in the United Kingdom. Renew. Sustain. Energy Rev. 2018, 82, 2287–2299. [Google Scholar] [CrossRef]
- Cox, E. Opening the black box of energy security: A study of conceptions of electricity security in the United Kingdom. Energy Res. Soc. Sci. 2016, 21, 1–11. [Google Scholar] [CrossRef]
- Skinner, R. Energy Security and Producer–Consumer Dialogue: Avoiding a Maginot Mentality. The Oxford Institute for Energy Studies. 2005. Available online: https://www.oxfordenergy.org/publications/energy-security-and-producer-consumer-dialogue-avoiding-a-maginot-mentality/ (accessed on 30 May 2022).
- Skinner, R.; Arnott, R. The Oil Supply and Demand Context for Security of Oil Supply to the Eu form the GCC Countries. The Oxford Institute for Energy Studies. 2005. Available online: https://www.oxfordenergy.org/publications/the-oil-supply-and-demand-context-for-security-of-oil-supply-to-the-eu-from-the-gcc-countries/ (accessed on 30 May 2022).
- Sovacool, B.K. (Ed.) The Routledge Handbook of Energy Security; Routledge: London, UK, 2010. [Google Scholar] [CrossRef]
- Ren, J.; Sovacool, B.K. Quantifying, measuring, and strategizing energy security: Determining the most meaningful dimensions and metrics. Energy 2014, 76, 838–849. [Google Scholar] [CrossRef]
- APERC. A Quest for Energy Security in the 21st Century Resources and Constraints; Technical Report; APERC: Tokyo, Japan, 2007. [Google Scholar]
- IEA. Energy Security: Reliable, Affordable Access to All Fuels and Energy Sources; IEA: Paris, France, 2020. [Google Scholar]
- European Commission. Study on Energy Supply Security and Geopolitics; European Commission: Brussel, Belgium, 2004. [Google Scholar]
- Hedenus, F.; Azar, C.; Johansson, D.J. Energy security policies in EU-25—The expected cost of oil supply disruptions. Energy Policy 2010, 38, 1241–1250. [Google Scholar] [CrossRef]
- Kazantsev, A. Policy networks in European–Russian gas relations: Function and dysfunction from a perspective of EU energy security. Communist Post-Communist Stud. 2012, 45, 305–313. [Google Scholar] [CrossRef]
- Parag, Y. From Energy Security to the Security of Energy Services: Shortcomings of Traditional Supply-Oriented Approaches and the Contribution of a Socio-Technical and User-Oriented Perspectives. Sci. Technol. Stud. 2014, 27, 97–108. [Google Scholar] [CrossRef]
- Action, P. Poor People’s Energy Outlook 2014—Key messages on energy for poverty alleviation. In Poor People’s Energy Outlook 2014; Practical Action Publishing: Rugby, UK, 2014; pp. 3–66. [Google Scholar] [CrossRef] [Green Version]
- Mitchell, J. Will Western Europe Face the Energy Shortage? Technical Report; Energy Council of France: Strasbourg, France, 1997. [Google Scholar]
- Alhajji, A. What is Energy Security? In Energy Politics; OEGL: Nootdorp, The Netherlands, 2008; Volume 2. [Google Scholar]
- Auty, R. Sustaining Development in Mineral Economies; Routledge: London, UK, 2002. [Google Scholar] [CrossRef]
- Karl, T.L. The Paradox of Plenty; University of California Press: Berkeley, CA, USA, 1997. [Google Scholar] [CrossRef]
- Krikštolaitis, R.; Bianco, V.; Martišauskas, L.; Urbonienė, S. Analysis of Electricity and Natural Gas Security. A Case Study for Germany, France, Italy and Spain. Energies 2022, 15, 1000. [Google Scholar] [CrossRef]
- Augutis, J.; Krikštolaitis, R.; Pečiulytė, S.; Žutautaitė, I. Dynamic model based on Bayesian method for energy security assessment. Energy Convers. Manag. 2015, 101, 66–72. [Google Scholar] [CrossRef]
- Chen, C.; Li, C.; Reniers, G.; Yang, F. Safety and security of oil and gas pipeline transportation: A systematic analysis of research trends and future needs using WoS. J. Clean. Prod. 2021, 279, 123583. [Google Scholar] [CrossRef]
- Hebda, W. The North–South Gas Corridor in the Context of Poland’s Gas Transmission System—A Perfect Opportunity to Diversify Gas Resources. Energies 2021, 14, 7188. [Google Scholar] [CrossRef]
- Tutak, M.; Brodny, J. Analysis of the level of energy security in the three seas initiative countries. Appl. Energy 2022, 311, 118649. [Google Scholar] [CrossRef]
- Kosowski, P.; Kosowska, K. Valuation of Energy Security for Natural Gas—European Example. Energies 2021, 14, 2678. [Google Scholar] [CrossRef]
- Bigerna, S.; Bollino, C.A.; Galkin, P. Balancing energy security priorities: Portfolio optimization approach to oil imports. Appl. Econ. 2020, 53, 555–574. [Google Scholar] [CrossRef]
- Bollino, C.A.; Galkin, P. Energy Security and Portfolio Diversification: Conventional and Novel Perspectives. Energies 2021, 14, 4257. [Google Scholar] [CrossRef]
- Rodríguez-Fernández, L.; Carvajal, A.B.F.; de Tejada, V.F. Improving the concept of energy security in an energy transition environment: Application to the gas sector in the European Union. Extr. Ind. Soc. 2022, 9, 101045. [Google Scholar] [CrossRef]
- Mišík, M. The EU needs to improve its external energy security. Energy Policy 2022, 165, 112930. [Google Scholar] [CrossRef]
- Fan, L.; Su, H.; Wang, W.; Zio, E.; Zhang, L.; Yang, Z.; Peng, S.; Yu, W.; Zuo, L.; Zhang, J. A systematic method for the optimization of gas supply reliability in natural gas pipeline network based on Bayesian networks and deep reinforcement learning. Reliab. Eng. Syst. Saf. 2022, 225, 108613. [Google Scholar] [CrossRef]
- Sakib, N.; Hossain, N.U.I.; Nur, F.; Talluri, S.; Jaradat, R.; Lawrence, J.M. An assessment of probabilistic disaster in the oil and gas supply chain leveraging Bayesian belief network. Int. J. Prod. Econ. 2021, 235, 108107. [Google Scholar] [CrossRef]
- Fenton, N.; Neil, M. Risk Assessment and Decision Analysis with Bayesian Networks; Chapman and Hall/CRC: New York, NY, USA, 2018. [Google Scholar] [CrossRef]
- Scarlat, N.; Fahl, F.; Dallemand, J.F.; Monforti, F.; Motola, V. A spatial analysis of biogas potential from manure in Europe. Renew. Sustain. Energy Rev. 2018, 94, 915–930. [Google Scholar] [CrossRef]
- Romaniuk, W.; Mazur, K.; Borek, K.; Borusiewicz, A.; Wardal, W.J.; Tabor, S.; Kuboń, M. Biomass Energy Technologies from Innovative Dairy Farming Systems. Processes 2021, 9, 335. [Google Scholar] [CrossRef]
- Gustafsson, M.; Svensson, N. Cleaner heavy transports—Environmental and economic analysis of liquefied natural gas and biomethane. J. Clean. Prod. 2021, 278, 123535. [Google Scholar] [CrossRef]
- D’Adamo, I.; Falcone, P.M.; Huisingh, D.; Morone, P. A circular economy model based on biomethane: What are the opportunities for the municipality of Rome and beyond? Renew. Energy 2021, 163, 1660–1672. [Google Scholar] [CrossRef]
- Scutari, M.; Denis, J.B. Bayesian Networks; Chapman and Hall/CRC: New York, NY, USA, 2021. [Google Scholar] [CrossRef]
- R Core Team. R: A Language and Environment for Statistical Computing; R Foundation for Statistical Computing: Vienna, Austria, 2021. [Google Scholar]
- RStudio Team. RStudio: Integrated Development Environment for R; RStudio, PBC: Boston, MA, USA, 2022. [Google Scholar]
- Scutari, M. Learning Bayesian Networks with the bnlearn R Package. J. Stat. Softw. 2010, 35, 1–22. [Google Scholar] [CrossRef] [Green Version]
- Hartemink, J. Principled Computational Methods for the Validation Discovery of Genetic Regulatory Networks. Ph.D. Thesis, Massachusetts Institute of Technology, Cambridge, MA, USA, 2001. [Google Scholar]
- Russell, S.J.; Norvig, P. Artificial Intelligence: A Modern Approach, 4th ed.; Pearson: London, UK, 2020. [Google Scholar]
- Schwarz, G. Estimating the Dimension of a Model. Ann. Stat. 1978, 6, 461–464. [Google Scholar] [CrossRef]


Publisher’s Note: MDPI stays neutral with regard to jurisdictional claims in published maps and institutional affiliations. |
© 2022 by the authors. Licensee MDPI, Basel, Switzerland. This article is an open access article distributed under the terms and conditions of the Creative Commons Attribution (CC BY) license (https://creativecommons.org/licenses/by/4.0/).