Article

Empirical Evidence of the Cost of Capital under Risk Conditions for Thermoelectric Power Plants in Brazil

by
Luiz Moreira Coelho Junior
1,*,
Amadeu Junior da Silva Fonseca
2,
Roberto Castro
3,
João Carlos de Oliveira Mello
4,
Victor Hugo Ribeiro dos Santos
4,
Renato Barros Pinheiro
5,
Wilton Lima Sousa
5,
Edvaldo Pereira Santos Júnior
6 and
Dorel Soares Ramos
7
1
Department of Renewable Energy Engineering, Federal University of Paraíba (UFPB), João Pessoa 58051-970, Brazil
2
Renewable Energy Graduate Program (PPGER), Federal University of Paraíba (UFPB), João Pessoa 58051-970, Brazil
3
MRTS Consultoria em Engenharia, São Paulo 05511-001, Brazil
4
Thymos Energia, São Paulo 04578-907, Brazil
5
EPASA—Centrais Elétricas da Paraíba S.A., João Pessoa 58071-973, Brazil
6
Postgraduate Program in Energy and Nuclear Technologies (PROTEN), Federal University of Pernambuco (UFPE), Recife 50740-545, Brazil
7
Department of Electrical Energy Engineering and Automation, Polytechnic School, University of São Paulo (Poli USP), São Paulo 05508-010, Brazil
*
Author to whom correspondence should be addressed.
Energies 2022, 15(12), 4313; https://doi.org/10.3390/en15124313
Submission received: 25 May 2022 / Revised: 8 June 2022 / Accepted: 10 June 2022 / Published: 13 June 2022
(This article belongs to the Special Issue Finance and Economics of Energy Transition)

Abstract

:
This article analyzed the cost of capital under risk conditions for thermoelectric plants in Brazil, applying the Capital Asset Pricing Model—CAPM and the Weighted Average Capital Cost—WACC. To estimate the local CAPM, we used information from the Electric Energy Index—IEE of publicly traded companies in the electricity sector in Brazil and for the global CAPM, we observed the companies associated with the Edison Electric Institute—EEI, listed on the New York Stock Exchange—NYSE and at the National Association of Securities Dealers Automated Quotations—NASDAQ—USA. The risk conditions for capital costs were represented by Monte Carlo simulation using, as a basis, the WACC of a fuel oil thermoelectric plant and the local and global CAPM. The main results show that the IEE and EEI companies obtained a positive average daily return. Due to the Brazil risk, under deterministic conditions, the local WACC (11.13% p.a.) was more attractive to investors when compared to the global WACC (10.32% p.a.) and the regulatory WACC of 10.55% p.a., established by the National Electric Energy Agency—ANEEL. The most risk-sensitive input variables were: unleveraged beta, net debt and equity. Under risk conditions observed by the market from the point of view of Brazilian companies, the chances of the WACC of the fuel oil thermoelectric plant being 11.1% p.a. was 68.30% and from a global perspective, the chance of WACC being 10.32% p.a. was 99.51%. It is concluded that the cost of capital under risk conditions provides a more realistic view of decision-making for privately held companies.

1. Introduction

Brazil has a privileged position in the electricity generation matrix when compared to other countries, with an installed capacity of 84% of the domestic supply of electricity from renewable resources, distributed in hydroelectric plants (65.8%), biomass (9%), wind (8%) and other renewables (1.2%). Historically, the Brazilian electrical system is characterized by the presence of hydroelectric plants incorporated into the regulatory and commercial model with large reservoirs, which guarantees safety and low operating costs. The reduction in the storage capacity of water reservoirs, combined with climate change, has been impacting the effective capacity of generation and service at the end of the National Integrated System—SIN. Energy security is at risk, requiring SIN planning to promote the development of enterprises in the sector involving technical-economic and socio-environmental issues [1,2,3].
At the beginning of the 21st century, electricity was rationed in Brazil and it was necessary to opt for the regulated contracting of fuel oil thermoelectric plants, accelerating the generation capacity, as well as the insertion of renewable energies. SIN was supplied through the addition of “run-of-river” hydroelectric, wind, solar and biomass plants that present low controllability in the generation dispatch process, from the point of view of planning the operation of the system, in a pronounced way. To meet the electrical load, the National System Operator—ONS controls the expressive amount and capacity to meet the systemic requirements of reliability and safety to meet the load curve, considering the variability of renewable generation, increasingly present in the system. Fuel oil thermoelectric plants, in turn, have a wide capacity for flexibility and reliability in energy generation. Currently, these fuel oil thermoelectric plants are close to the end of the energy supply contract [1,2,4,5].
Every company tends to maximize market value by comparing return on investment and capital cost. In addition, other sustainable criteria that are associated with good ESG practices (Environmental, Social and Governance) have gained strength within large companies operating in the financial market, boosting investments in new technologies to provide cleaner energy and mitigate climate change, which are on the agenda of some of the Sustainable Development Goals (SDGs) [6,7,8]. Therefore, the capital cost is the average rate over time required by stakeholders, shareholders (own capital) and creditors (others’ capital). For decision-making, the capital structure of a company has complexities due to its relationship with other variables, which originate from financing, loans, debts, partners and shareholders, among others that receive a return equal to or greater than the cost of opportunity [9,10].
In corporate finance theory, since the contributions of Modigliani and Miller [11], the Weighted Average Capital Cost—WACC has become one of the pillars. The WACC determines a minimum rate necessary to meet the needs of stakeholders, to determine whether or not to accept the risk of the investment. Marcus et al. [10] recommend the Capital Asset Pricing Model (CAPM) that assists in decision-making involving capital budgeting. CAPM assumes two types of risk (diversifiable and non-diversifiable) and to make it attractive, the risk premium must compensate for its exposure to risk, giving up investing in a risk-free asset [9,12]. The only risk that involves most or all companies, and which cannot be eliminated by diversification, is macroeconomic risk, the non-diversifiable risk. Markowitz [13] stated that the diversifiable market risk would be the only one to be considered by investors, as it could somehow be estimated. Rocha et al. [14], Rotella Junior et al. [15], Saluga et al. [16] and Steffen [17] applied the WACC in the economic analysis of energy projects.
In deterministic models of economic evaluation, generally, the input data are known or assumed to be known. The uncertainty and risks of a future scenario regarding decision-making cannot be ignored [18]. Eid and Eldin [19] consider risk as an inherent factor in most decisions for a business, defining it as the central point of risk analysis. In an analysis under risk conditions, one wants to know the probability distribution of possible outcomes. When little is known about the input data, methods for uncertainty analysis are adopted. One of the methods to assess possible deviations and risks involved is the Monte Carlo simulation as applied by Aquila et al. [20], Lacerda et al. [21] and Silva et al. [22].
In the Brazilian electricity sector, ANEEL calculates the cost of capital for the purpose of reviewing the tariff or revenue of the electricity distribution, transmission and generation segments. The calculation of the regulatory rate of return on capital is estimated from American companies in the EEI, follows the entity’s premises and undergoes periodic reviews through public consultations [23,24]. Thermoelectric plants are capital-intensive and knowing the determining factors is necessary for evaluating the business plan. Despite the complexity, understanding the cost of capital becomes fundamental for analyzing the company’s results and the relationship between risk and return of the business.
This paper presents little explored results on privately held thermoelectric plants, in the context of an emerging market, given that there is little understanding and publicity of the capital structure due to the confidentiality of business information. Another aspect that should be highlighted is the use of WACC when examining this type of company, in addition to the application of Monte Carlo simulations.
To ensure competitiveness and survival in the energy market, this article empirically analyzed the cost of capital under risk conditions for a thermoelectric power plant in Brazil, based on CAPM and WACC.

2. Materials and Methods

2.1. Object of Study

The case study presented in the work refers to the application of the proposed methodology to the real case of a fuel oil thermoelectric plant located in the municipality of João Pessoa, Paraíba, with an installed capacity of 342 MW, in an area of 800 thousand m2.

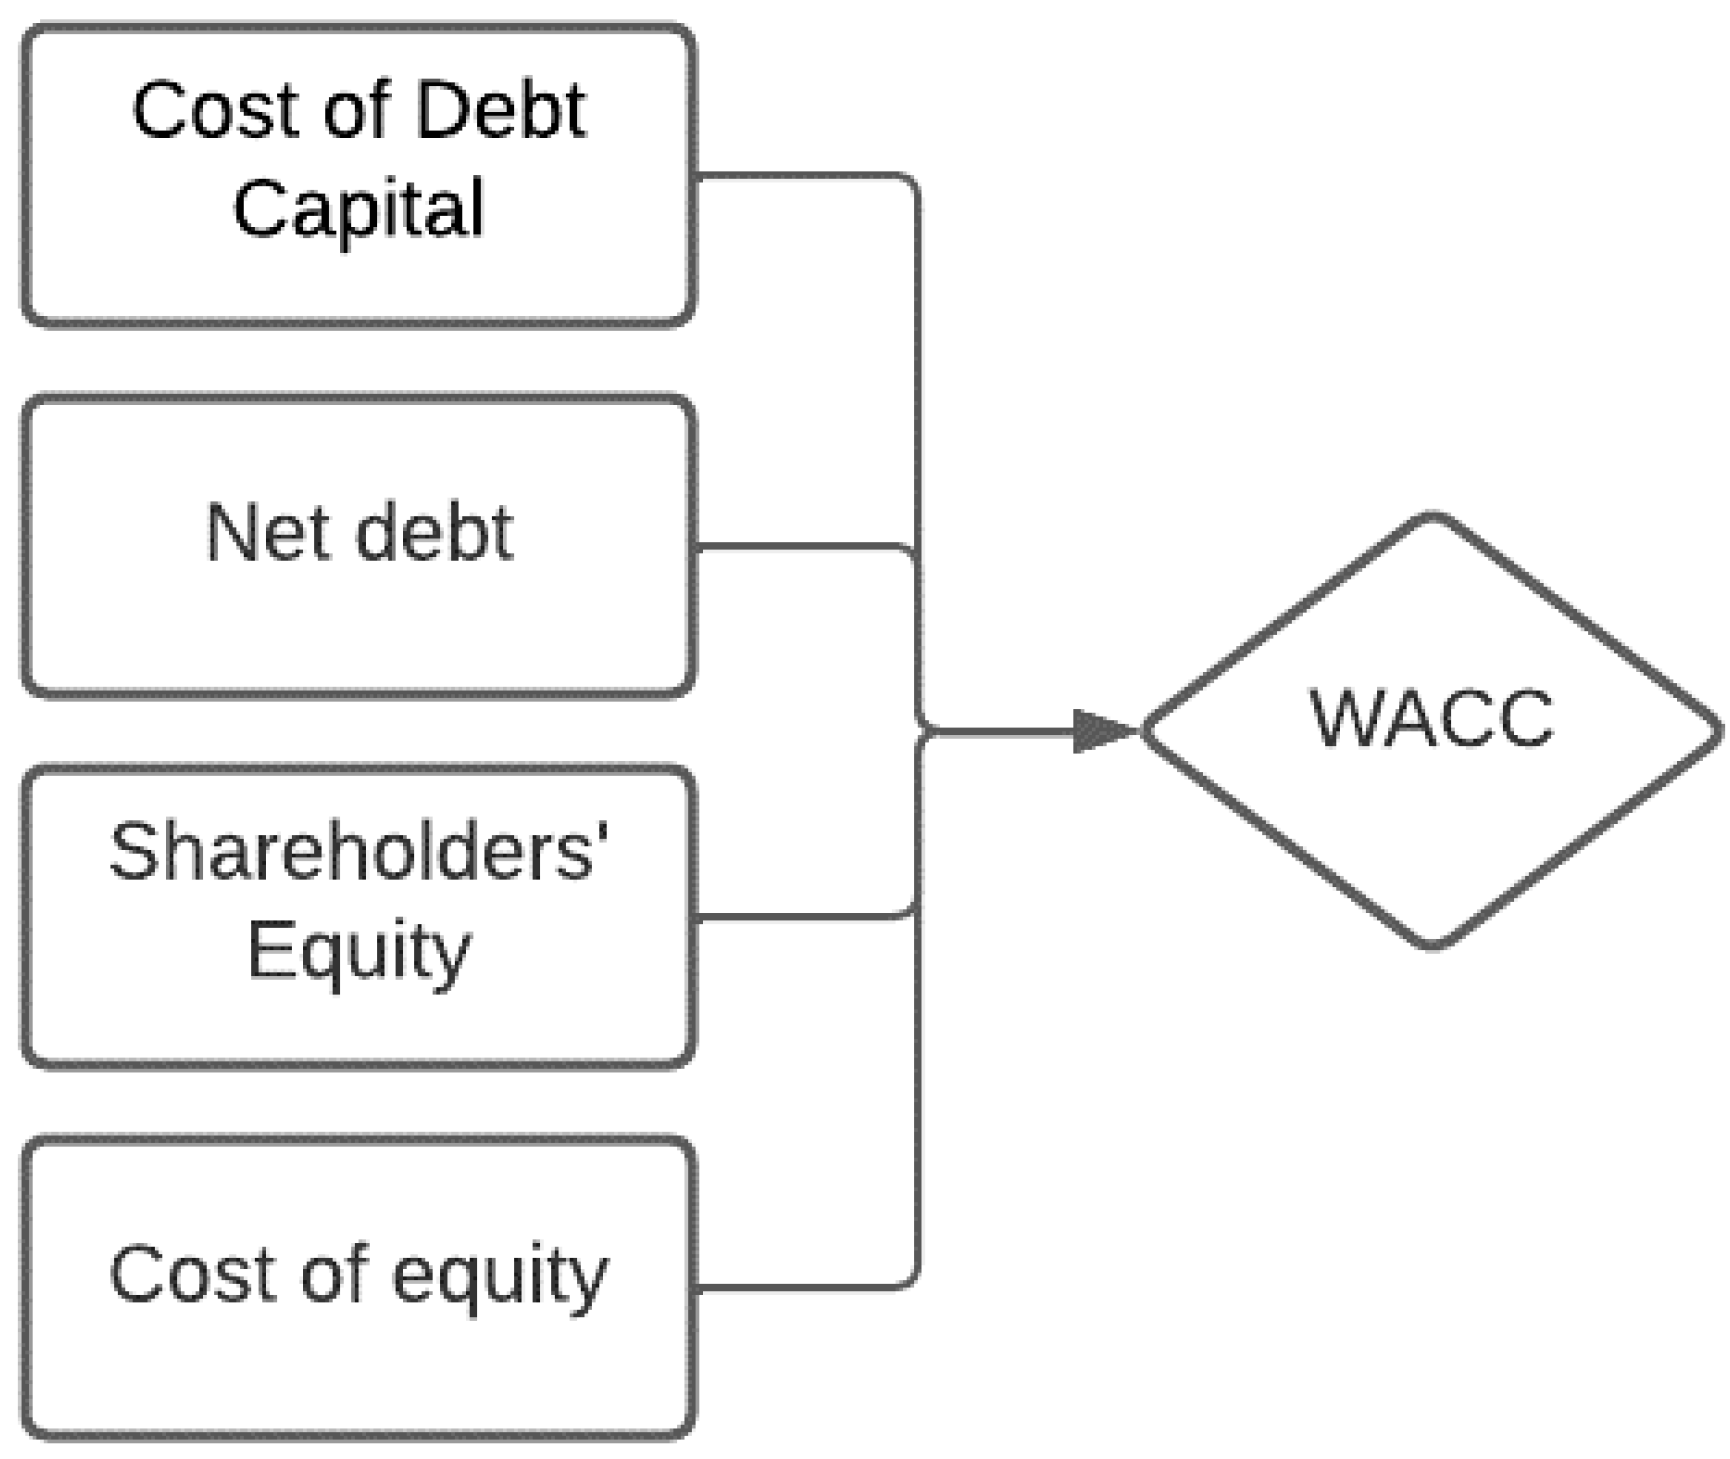
2.2. Model Development

To analyze the cost of capital of a thermoelectric plant, the following steps were followed: identify the activity sector; gather information on the segment’s average unleveraged beta; verify the average indebtedness of companies in the sector; and infer the leveraged beta [25]. Table 1 shows the selected companies in the electricity sector, located in the Brazilian (local) and North American (international) market, using the daily quotation of assets, from 2011 to 2019. The local companies are from the Electric Energy Index (IEE) of B3 S.A. Brasil, Bolsa, Balcão (B3) and international ones are associated with the Edison Electric Institute (EEI), listed on the New York Stock Exchange (NYSE) and the National Association of Securities Dealers Automated Quotations (NASDAQ).

2.3. Risk Identification and Uncertainty

For the elaboration of the analysis of the cost of capital at risk, the opportunities and threats that influence the variables involved in thermoelectric generation were highlighted. The threats were: the end of the authorization to operate the generation enterprise and environmental pressures imposed on fuel oil thermoelectric plants. The opportunities were the Auctions for the retrofit of fuel oil plants, ancillary services market and tax incentives. The input variables considered most significant to analyze the cost of capital, both locally and internationally, were: unleveraged beta, net debt and equity. For the Monte Carlo simulation of the variables, the triangular distribution was used, for mathematical simplicity and for generating random samples capable of identifying sensitive parameters [15,29].
Information on Brazilian inflation was gathered by the Broad National Consumer Price Index (IPCA) of the Brazilian Institute of Geography and Statistics (IBGE); U.S. inflation was measured by the U.S. Consumer Prices Index (CPI). Bureau of Labor Statistics: Return of the Standard & Poor’s 500 Index (S & P500) for the CAPM estimates was extracted from the projections of the International Monetary Fund (IMF), in April 2021. As a market return, the profitability of the Standard & Poor’s 500 Index portfolio was used (S & P500) in the period from 2011 to 2020 [22]. The risk-free rate comprised the National Treasury Notes indexed to inflation (NTN-B), measured by the IPCA, using a 10-year window. Only government bonds can be considered risk-free, given the power to issue currency and pay nominal values [30].

2.4. Identification of Analysis Variables or Output Variables

The output variable used was WACC (Equation (1)).
W A C C = E E + D K e + D E + D K d 1 T  
where E is the value of shareholders’ equity, D is the value of net debt, Ke is the cost of equity, Kd is the cost of debt capital and T is the marginal tax rate, 34% in Brazil [21].
The cost of capital of the partners (Ke) in the analysis represented the minimum return acceptable to equity investors in relation to the thermoelectric risk, calculated by the CAPM approach [10,19]. Figure 1 shows the formation of the thermoelectric cost of capital to estimate the WACC.
Based on the structure of the WACC formation, it estimated the beta for including market risk. Thus, the greater the risk, the greater the beta of the asset and the CAPM was calculated (Equation (2)).
K e = r f + β r m r f  
where Ke is the expected return in dollars; rf is the return on risk-free assets, given by the average return on National Treasury Notes indexed to inflation (NTN-B); β is the asset’s beta; r m r f is the risk premium, which is the difference between the return on the S & P500 Index portfolio and the return on the risk-free asset; and the values were also adjusted to obtain Ke in reais (BRL) [9,21].
To analyze the companies’ risk, the correlation of the indexes was calculated based on the local market (IBOV) and the international market (S & P500). The correlation between assets and portfolio risk showed market conditions, positively or negatively affecting companies. As market indices are affected, companies can also be affected, with covariance between the indices being calculated. Beta (β) indicates the asset’s sensitivity to market volatility, that is, between the return on portfolio assets and the return of market indices, the IBOV and S & P500. The beta calculation (Equation (3)) is performed using the standard deviation in relation to daily returns.
β i = C o v R i ,   R m S 2 R m  
where Cov(Ri, Rm) is the covariance between the return on assets and the return on market indices. S2(Rm) is the variance of the market portfolio returns.
The risk and return of beta can present three scenarios: assets have higher risk (β > 1), lower risk (β < 1) and similar risk (β = 1) to the market risk. Determining a company’s beta can be achieved in three ways: through cyclical nature of revenues, operating leverage and financial leverage. After finding the beta value of the selected companies, it inferred the companies’ indebtedness. The equity beta is the unleveraged beta, and the asset beta corresponds to the leveraged beta. To remove the financial risk and determine only the business risk, the betas must be “deleveraged”; in doing so, all companies will be on the same level for continuity of analysis. Soon after, the average of the companies’ unleveraged betas was calculated. In the last step, the thermoelectric beta was again leveraged using its capital structure. The cost of debt capital (Kd) represents the percentage of interest demanded by creditors and also includes other financial expenses of the company. In summary, all short-term and long-term borrowing costs of the company and the respective weighted interest rates are taken into account [17].

2.5. Model Simulation and Analysis

After measuring the WACC (output variable), 10,000 simulations were performed for the output variable, using pseudo-random numbers, that is, generating a series of values for the analysis variable to obtain its simple and cumulative frequency distribution, descriptive statistics and sensitivity of input variables. Once the probability distribution of the output variables is obtained, the decision is made based on the information found and taking into account other relevant aspects of the project.

3. Results and Discussion

Table 2 presents the average financial results of local and international companies, from January 2011 to December 2019. For Brazilian companies, a positive correlation of 39.7% was obtained with the IBOV, and for international firms, a statistical analysis of the correlation of American companies showed a median of 39.5%, also characterizing an association with the index of this analysis, the S & P500, showing a positive correlation.
The correlation analysis offers an excellent perception of the relationship between the return of the variables, which was perceived in the expected return of the assets involved. All Brazilian companies had a positive average daily return, except for ENEV3, with asset volatility fluctuating between 1.36% and 3.74%. For American companies, the average returns were between 0.95% and 3.55%, with the exception of the PCG company. For the investment in ENEV3 to be viable, the investor must demand a higher return to compensate for his exposure to risk. For a given degree of risk, the investor will choose the alternative that offers the highest possible return, considering the smallest standard deviation.
NEOE3 has the best alternative with the lowest standard deviation (1.36%) of the series and the most favorable daily return (0.32%). For American companies, NEE was the most recommended, with a standard deviation of 1% and the highest daily return (0.08%) among the other assets. The leveraged beta of companies represents an important indicator that estimates the relative risk of companies. This risk measure is based on market risk, represented by the IBOV (local companies) and S & P500 (international companies). Values can be greater than, equal to or less than zero. The local betas ranged from 0.25 to 1.17 and ELET3 showed the highest beta (1.17) of the portfolio, having a risk higher than the market risk (β > 1). According to the CAPM method, when choosing this asset or company, the investor expects a higher premium for his investment; however, he incurs greater risks. This hypothesis is confirmed in Table 2, with the accounting of the highest expected return at 21.9% for this asset, the result of Ke in reals.
OMGE3 presented the lowest beta (0.25), inferring lower risk in relation to the market (β < 1) and also the lowest expected return (9.5%) of Ke in reals. The beta interval serves as a benchmark, constituting an important parameter for assessing the level of risk presented by the thermoelectric beta in the final assessment. The leveraged beta of international companies ranged from 0.33 to 0.68, with an average of 0.51. The OGE company showed the highest beta of the portfolio (0.68), having a risk lower than the market risk (β < 1), accounting for the highest expected return on Ke (BRL) of 11.4% among other American companies.
The ED company stood out in the analysis, presenting the lowest beta (0.33), giving the lowest risk in relation to the market (β < 1) and lowest expected return (8.4%) of Ke (BRL). For unleveraged betas (Table 2), Brazilian companies had an average of 0.37, ranging from 0.12 to 0.89; and international companies had an average of 0.27, oscillating between 0.17 and 0.42, which is equivalent to the level of risk in the electricity sector that makes up the IBOV and the S & P500. According to Damodaran [30], the higher the level of financial leverage through the use of cost of debt capital, the lower the unleveraged beta, that is, using leveraged beta shows that the lower its value, the lower the unleveraged beta.
For the local case, ENGI11 had the lowest unleveraged beta (0.12) with strong exposure to debt of 184%, based on the proportion of debt capital and shareholders’ capital, being the second most indebted company. It was noted that ELET3 with the highest unleveraged beta (0.89) did not have the highest net debt to shareholders’ equity ratio, accounting for 46.8%. Brealey et al. [9] pointed out that other aspects can determine the beta of a company, which go beyond the financial, such as operating leverage and the cyclical nature of revenues. Therefore, evidencing the theory, the beta of ELET3 was the highest among Brazilian companies at 1.17.
The American company with the highest level of leverage was FE, with an unleveraged beta of 0.17, showing strong dependence on cost of debt capital. The net debt to shareholders’ equity ratio, calculated at 314.1%, proves the result of the analysis. From another perspective, the IDA company, with the highest unleveraged beta of 0.42, assumed a prominent position, due to the low dependence on cost of debt capital, and consequently, lower net debt to capital ratio (66.4%). For the local investor, it was noticed that there was risk due to having more volatility of the assets of the standard deviation and by the leveraged betas. Returns on invested capital exceeded the returns of international companies. The risk composition assumes that if the company has a higher proportion of debt capital, the unleveraged beta tends to be higher, but most of the risk comes from financial leverage and not from the market. Despite the fact that international firms have a higher proportion of cost of debt capital than local ones, the estimated risk from the leveraged betas linked to EEI was lower than that of the IEE, showing that the international risk is lower than the Brazilian market.
Table 3 presents the WACC estimates for the privately held thermoelectric plant, from a local and international point of view. Based on the debt ratio of local companies (0.36), the thermoelectric leveraged beta was estimated at 0.38. Analyzing international companies, the debt ratio of companies estimated at 0.26 resulted in a lower leveraged beta for thermoelectric power at 0.28.
The spread between leveraged beta and unleveraged beta shows that the thermoelectric plant does not depend on cost of debt capital to finance its operational activity. This outcome reflects the success of the enterprise’s good management and operational performance. The ratio between net debt and capital of the thermoelectric partners was accounted for at only 3%. When the company does not have any net debt, it is an exclusively equity company. However, despite the low cost of debt capital, the plant still has financing to pay.
The percentage of the ratio between net debt and equity of national companies ranged from 14.5% to 202.9% and for international companies, it ranged from 66.4% to 314.1%. Despite greater indebtedness, American companies have lower beta, indicating greater risk for the Brazilian scenario. The average market leveraged beta in the local market was 0.54 and for companies in the international market it was 0.51. The estimated leveraged beta result for thermoelectric power was below the averages presented, 0.36 (national) and 0.26 (international). Low exposure to cost of debt capital is the main factor for diluting the company’s risk.
Calculating the amount and rate of financing taken by the thermoelectric plant in the analyzed period, the cost of debt capital (Kd) was 8.19%. Applying the CAPM, the required return by shareholders (Ke) in US dollars (USD) was 11.32% in reals (R) for the Brazilian case and 10.48% in reals (BRL) for the international case of American companies. The WACC calculated for the period 2020 by ANEEL was estimated at 10.55%, based on American companies. Comparing with the results of Brazilian companies (11.13%) and American companies (10.32%), in the period of analysis, it varied by 0.58% (Brazilian companies) and 0.23% (American companies). The analyses by Steffen [17] and Anton and Nucu [31] indicated that, in general, the cost of capital in emerging countries is higher compared to stable countries. In order to establish strategies to minimize risks and/or maximize gains for the decision-maker, they took into account the attitudes, actions and reactions of actors or players in order to formalize the maximization of the expected payoff. Table 4 presents the variables of the stochastic model, assigning minimum, maximum and most probable values, opting for the triangular distribution in considering the measurement of the uncertainty of the cost of capital.
Figure 2 shows the participation of variables in the composition of WACC probabilities. For Brazilian companies, the input variable that had the greatest impact was the unleveraged beta (84%); therefore, it was more sensitive and more important in relation to the thermoelectric cost of capital. The net worth of the projects contributed to the estimate (39%), despite the lower proportion. Only the net debt (−31%) had negative participation in the result of the cost of capital. The sensitivity analysis of US companies shows that the shareholders’ equity and the unleveraged beta of the projects contributed with 55% in the composition of the WACC estimate, while the net debt contributed negatively by 56%.
Monte Carlo simulation is a technique applied to models in order to find results linked to initial assumptions. Simulation comes from the Latin similis, which means similar. It is a technique that aims to reproduce situations supposedly similar to real ones. In reality, the cash flows and discount rates are unknown, characterizing a situation of uncertainty; therefore, in this method, simulations are performed using hypothetical data (through pseudo-random numbers). Figure 3 shows the distribution of WACC from the perspective of Brazilian and American companies in terms of Monte Carlo simulation considering 10,000 iterations.
Observing the probability distribution of Brazilian companies, the WACC varied between 6.64% p.a. and 15.06% p.a., with an average of 10.50% p.a. and standard deviation of 1.35% (Table 5). The odds of WACC being 11.13% p.a. of the fuel oil thermoelectric plant was 68.30%, while they had values very close to the average; that for the WACC ANEEL being 10.55% p.a. was 53.20% and for the American WACC, the odds of being 10.32% p.a. was 48.21%. From the perspective of American companies, the WACC ranged from 6.79% to 11.22%, with an average of 8.49% p.a. and standard deviation indicating a probability of being above 11.10% p.a. of 30.46% for the WACC. The odds of WACC being 11.13% p.a. of the fuel oil thermoelectric plant was 100.00%, while they had values very close to the average for the WACC ANEEL; the odds of being 10.55% p.a. was 99.57% and for the American WACC, the odds of being 10.32% p.a. was 99.55%. The average proportion of cost of debt capital of US companies was 42%, reflected by the plant’s leveraged beta being outside the range of US companies (Table 2).
Table 5 presents the descriptive statistics for the WACC projection. Brazilian companies accounted for an average of 10.50% and a median of 10.40%. Analyzing the percentiles, there is a 50% chance of the WACC being equal to or greater than the mean and median values, and a 90% chance of being above 12.3%. American companies returned an average of 8.53% and a median of 8.49%. Examining the percentiles, there is also a 50% chance of the WACC being equal to or greater than the mean and median, and a 90% chance of being above 9.3% p.a.

4. Conclusions

From the analyses carried out, it is concluded that from the perspective of national and international companies, the WACC of the local thermoelectric plant was estimated at 11.13% and 10.32%, respectively. Despite the low presence of third-party capital in the capital structure of local companies, the calculated risk of the business made the cost of capital higher. The thermoelectric plant had a very low level of financial leverage, 3% in third-party capital. We exposed that 97% of the estimated beta for the venture was associated solely with the business risk. Under local and international risk conditions, the WACC of the case study was close to the average from the point of view of local companies and 100% of international firms.
This study contributes to more realistic decision-making for privately held thermoelectric plants in the Brazilian electricity sector. The calculated WACC allowed better economic analysis, involving risk and uncertainty. The cost of capital provides a critical parameter for allocating investors’ resources, influencing prices and decision-making. For an emerging economy, the cost of capital is higher, but when there is economic stability, these risks are reduced in economic policy, favoring the business environment and the expectation of future ventures. The empirical result was limited to companies in the energy sector from two countries, with a stable and emerging economy, and for future research, ESG practices can be included in the investment analysis.

Author Contributions

Conceptualization, L.M.C.J., A.J.d.S.F. and D.S.R.; methodology, L.M.C.J., A.J.d.S.F., R.C., J.C.d.O.M., V.H.R.d.S. and D.S.R.; software, A.J.d.S.F.; validation, L.M.C.J., R.C., J.C.d.O.M., V.H.R.d.S. and D.S.R.; formal analysis, L.M.C.J., A.J.d.S.F., R.C. and D.S.R.; investigation, L.M.C.J., A.J.d.S.F., R.C., R.B.P. and W.L.S.; data curation, R.B.P. and W.L.S.; writing—original draft preparation, L.M.C.J. and A.J.d.S.F.; writing—review and editing, R.C., J.C.d.O.M., V.H.R.d.S., E.P.S.J. and D.S.R.; visualization, R.C., J.C.d.O.M., V.H.R.d.S., E.P.S.J. and D.S.R.; supervision, L.M.C.J., R.C., J.C.d.O.M. and D.S.R.; project administration, L.M.C.J. and D.S.R.; funding acquisition, L.M.C.J. All authors have read and agreed to the published version of the manuscript.

Funding

EPASA contributed financial support in R&D “The future of UTEs oil in the Brazilian electricity sector: An analysis visualizing the massive integration of intermittent renewable sources and the systemic resources to enable the operation SIN”. RD-07236-0008/2020.

Data Availability Statement

The data is not available.

Acknowledgments

The authors are grateful for EPASA’s financial support in the R&D; the Foundation for the Technological Development of Engineering (FDTE—Brazil) for funding the APC; the National Council for Scientific and Technological Development—CNPq by Productivity Research Grants, nº: 310871/2021-2; the Coordination of the Coordination for the Improvement of Higher Education Personnel—CAPES; the MRTS Consultoria em Engenharia; the Thymos Energia, and the Federal University of Paraíba (UFPB)—Brazil.

Conflicts of Interest

The authors declare no conflict of interest.

References

  1. Agência Nacional de Energia Elétrica—ANEEL. Sistema de Informações da Geração da ANEEL. 2020. Available online: http://www2.aneel.gov.br/aplicacoes/capacidadebrasil/OperacaoCapacidadeBrasil.cfm (accessed on 5 May 2022).
  2. Empresa de Pesquisa Energética—EPE. Brazilian Energy Balance 2020 Year 2019; Empresa de Pesquisa Energetica: Rio de Janeiro, Brazil, 2020; 292p.
  3. Empresa de Pesquisa Energética—EPE. Expansão da Geração. 2022. Available online: https://www.epe.gov.br/pt/areas-de-atuacao/energia-eletrica/expansao-da-geracao/fontes (accessed on 16 January 2022).
  4. Operador Nacional do Sistema—ONS. Módulo 7—Planejamento da Operação Energética—Submódulo 7.2 Planejamento Anual da Operação Energética. Operador Nacional do Sistema Elétrico, Rio de Janeiro. 2020. Available online: http://www.ons.org.br/%2FProcedimentosDeRede%2FM%C3%B3dulo%207%2FSubm%C3%B3dulo%207.2%2FSubm%C3%B3dulo%207.2%202017.12.pdf (accessed on 10 December 2021).
  5. U.S. Department of Energy—DOE. Quadrennial Technology Review: An Assessment of Energy Technologies and Research Opportunities; U.S. Department of Energy: Washington, DC, USA, 2015.
  6. Brasil, Bolsa, Balcão (B3)—B3 S.A. Índice de Sustentabilidade Empresarial (ISE B3). 2022. Available online: https://www.b3.com.br/pt_br/market-data-e-indices/indices/indices-de-sustentabilidade/indice-de-sustentabilidade-empresarial-ise.htm (accessed on 24 May 2022).
  7. Edison Electric Institute—EEI. Delivering The Future. 2022. Available online: https://www.eei.org/ (accessed on 24 May 2022).
  8. United Nations Lead Agency on International Development—UNDP. Sustainable Development Goals (SDGs). 2022. Available online: https://www.undp.org/sustainable-development-goals (accessed on 24 May 2022).
  9. Brealey, R.; Allen, F.; Stewart, M. Principles of Corporate Finance, 13th ed.; Mc Graw Hill: New York City, NY, USA, 2020. [Google Scholar]
  10. Marcus, A.; Kane, A.; Bodie, Z. ISE Investments, 12th ed.; Mc Graw Hill: New York, NY, USA, 2020. [Google Scholar]
  11. Modigliani, F.; Miller, M.H. The Cost of Capital, Corporation Finance and the Theory of Investment. Am. Econ. Rev. 1958, 48, 261–297. [Google Scholar]
  12. Hawawini, G.; Viallet, C. Finance for Executives: Managing for Value Creation, 4th ed.; South-Western Cengage Learning: Mason, OH, USA, 2009. [Google Scholar]
  13. Markowitz, H. Portfolio Selection. J. Financ. 1952, 7, 77–91. [Google Scholar]
  14. Rocha, L.C.S.; Aquila, G.; Rotela Junior, P.; Paiva, A.P.; Pamplona, E.O.; Balestrassi, P.P. A stochastic economic viability analysis of residential wind power generation in Brazil. Renew. Sustain. Energy Rev. 2018, 90, 412–419. [Google Scholar] [CrossRef]
  15. Rotella, P., Jr.; Rocha, L.C.S.; Morioka, S.N.; Bolis, I.; Chicco, G.; Mazza, A.; Janda, K. Economic Analysis of the Investments in Battery Energy Storage Systems: Review and Current Perspectives. Energies 2021, 14, 2503. [Google Scholar] [CrossRef]
  16. Saluga, P.W.; Szczepariska-Woszczyna, K.; Miskiewicz, R.; Chlad, M. Cost of Equity of Coal-Fired Power Generation Projects in Poland: Its Importance for the Management of Decision-Making Process. Energies 2020, 13, 4833. [Google Scholar] [CrossRef]
  17. Steffen, B. Estimating the cost of capital for renewable energy projects. Energy Econ. 2020, 88, 104783. [Google Scholar] [CrossRef]
  18. Drozdowski, G. Economic calculus qua an instrument to support sustainable development under increasing risk. J. Risk Financ. Manag. 2021, 14, 15. [Google Scholar] [CrossRef]
  19. Eid, M.S.; Eldin, H.K. Evaluation of risk in investment alternatives. Comput. Ind. Eng. 1977, 1, 185–197. [Google Scholar]
  20. Aquila, G.; Rotella, P., Jr.; Pamplona, E.; De Queiroz, A. Wind Power Feasibility Analysis under Uncertainty in the Brazilian Electricity Market. Energy Econ. 2017, 65, 127–136. [Google Scholar] [CrossRef]
  21. Lacerda, L.S.; Rotela, P., Jr.; Peruchi, R.S.; Chicco, G.; Rocha, L.C.S.; Aquila, G.; Coelho, L.M., Jr. Microgeneration of Wind Energy for Micro and Small Businesses: Application of ANN in Sensitivity Analysis for Stochastic Economic Feasibility. IEEE Access 2020, 8, 73931–73946. [Google Scholar] [CrossRef]
  22. Silva, C.P.C.; Coelho, L.M., Jr.; Oliveira, A.D.; Scolforo, J.R.S.; Rezende, J.L.P.; Lima, I.C.G. Economic analysis of agroforestry systems with candeia. Cerne 2012, 18, 585–594. [Google Scholar] [CrossRef]
  23. Agência Nacional de Energia Elétrica—ANEEL. Nota Técnica 45/2020-SRM/ANEEL, de 14/04/2020, Conforme Detalhado no Item “III.4.1-Taxa Regulatória de Remuneração de Capital Real e Antes de Impostos—Segmento de Distribuição—Por Alíquotas de IRPJ e CSLL”; ANEEL: Brasília, Brazil, 2020.
  24. Agência Nacional de Energia Elétrica—ANEEL. Nota Técnica 34/2021—SGT-SRM/ANEEL, de 10/03/2021, Atualização da Taxa Regulatória de Remuneração do Capital; ANEEL: Brasília, Brazil, 2021.
  25. Hawawini, G.; Viallet, C. Finanças Para Executivos—Gestão Para a Criação de Valor; Tradução Técnica Antonio Zoratto Sanvicente; Cengage Learning: São Paulo, Brazil, 2009. [Google Scholar]
  26. Brasil, Bolsa, Balcão (B3)—B3 S.A. Índice de Energia Elétrica (IEE B3). Available online: https://www.b3.com.br/pt_br/market-data-e-indices/indices/indices-de-segmentos-e-setoriais/indice-de-energia-eletrica-iee.htm#:~:text=O%20IEE%20%C3%A9%20um%20%C3%ADndice,%E2%80%9Cex%2Dprovento%E2%80%9D) (accessed on 20 April 2021).
  27. New York Stock Exchange—NYSE. Listings. Available online: https://www.nyse.com/index (accessed on 20 April 2021).
  28. National Association of Securities Dealers Automatic Quotation System—NASDAQ. Market Activity. Available online: https://www.nasdaq.com/ (accessed on 20 April 2021).
  29. Lamers, P.; Roni, M.S.; Tumuluru, J.S.; Jacobson, J.J.; Cafferty, K.G.; Hansen, J.K.; Kenney, K.; Teymouri, F.; Bals, B. Techno-economic analysis of decentralized biomass processing depots. Bioresour. Technol 2015, 194, 205–213. [Google Scholar] [CrossRef] [PubMed] [Green Version]
  30. Damodaran, A. What Is the Riskfree Rate? A Search for the Basic Building Block. 2008. Available online: https://pages.stern.nyu.edu/~adamodar/pdfiles/papers/riskfreerate.pdf (accessed on 10 December 2021). [CrossRef] [Green Version]
  31. Anton, S.G.; Nucu, A.E. The impact of working capital management on firm profitability: Empirical evidence from the Polish listed firms. J. Risk Financ. Manag. 2020, 14, 9. [Google Scholar] [CrossRef]
Figure 1. Structure of the WACC formation.
Energies 15 04313 g001
Figure 2. Influence of the uncertainty variables of the Brazilian and American companies in relation to the cost of capital (WACC) of the fuel oil thermoelectric plant.
Energies 15 04313 g002
Figure 3. Histogram of the frequency and cumulative frequency (%) of the Monte Carlo simulation from the perspective of the Brazilian (IEE) and American (EEI) companies.
Energies 15 04313 g003
Table 1. Companies in the local and international market, which make up the Electric Energy Index (IEE) and Edison Electric Institute (EEI), respectively.
CodeLocal CompaniesCodeInternational Companies
ALUP11Alupar Investimento S.A.FEFirstenergy Corp.
CESP6Cesp—Cia Energética de São PauloEIXEdison International
CMIG4Cemig—Cia Energética de Minas GeraisESEversource Energy
COCE5Coelce—Cia Energética do CearáPPLPpl Corporation
CPFE3CPFL energiaEDConsolidated Edison, Inc.
CPLE6Copel—Cia Paranaense de EnergiaAEPAmerican Electric Power Company, Inc.
EGIE3Engie Brasil Energia S.A.PCGPg & e Corporation
ELET3Eletrobrás—Centrais Elétricas Bras. S.A.OGEOge Energy Corp.
ENBR3EDP Energias do BrasilEXCExelon Corporation
ENEV3Eneva S.A.NWENorthwestern Corporation
ENGI11Energisa S.A.NEENextera Energy, Inc.
EQTL3Equatorial Energia S.A.AEEAmeren Corporation
LIGT3Light Serviços de Eletricidade S.A.IDAIdacorp, Inc.
NEOE3Neoenergia S.A.ETREntergy Corporation
OMGE3Ômega Geração S.A.PEGPublic Service Enterprise Group Incorporated
TAEE11Taesa–Transm. Aliança de Energia Elétrica S.A.
TIET11AES Tiete Energia S.A.
TRPL4Isa Cteep—Cia Trans. Energia Elétrica Paulista
Source: [26,27,28].
Table 2. Average financial results of local and international companies, from January 2011 to December 2019.
CodeAverage
Return
Standard
Deviation
Leveraged
Beta
D/EUnleveraged
Beta
Ke (USD)Ke (BRL)
LocalALUP110.06%1.70%0.4246.8%0.288.4%11.8%
CESP60.03%2.24%0.6333.0%0.5711.1%14.6%
CMIG40.03%2.62%0.9963.6%0.7015.8%19.5%
COCE50.06%1.67%0.3215.4%0.217.0%10.4%
CPFE30.04%1.66%0.56105.4%0.3710.3%13.7%
CPLE60.04%2.23%0.8954.6%0.7314.6%18.2%
EGIE30.06%1.49%0.5014.5%0.249.4%12.8%
ELET30.04%3.24%1.1781.5%0.8918.2%21.9%
ENBR30.05%1.89%0.5864.7%0.4310.5%13.9%
ENEV3−0.10%3.74%0.4376.2%0.308.5%11.9%
ENGI110.10%1.95%0.2788.1%0.126.4%9.7%
EQTL30.11%1.57%0.44158.0%0.288.7%12.0%
LIGT30.01%2.53%0.8083.9%0.4713.3%16.9%
NEOE30.32%1.36%0.2671.8%0.156.2%9.5%
OMGE30.13%1.54%0.25202.9%0.176.2%9.5%
TAEE110.06%1.59%0.3875.9%0.247.8%11.2%
TIET110.06%1.54%0.4399.0%0.188.5%11.9%
TRPL40.04%1.75%0.41184.4%0.378.2%11.6%
InternationalAEE0.06%1.09%0.52128.0%0.287.7%10.1%
AEP0.06%1.01%0.44160.4%0.216.9%9.3%
ED0.04%0.95%0.33121.8%0.186.0%8.4%
EIX0.04%1.35%0.50163.5%0.247.5%9.9%
ES0.06%1.04%0.49127.0%0.267.3%9.8%
ETR0.04%1.08%0.46202.9%0.207.1%9.5%
EXC0.02%1.20%0.50118.7%0.287.4%9.8%
FE0.03%1.27%0.51314.1%0.177.6%10.0%
IDA0.06%1.09%0.6166.4%0.428.4%10.8%
NEE0.08%1.00%0.47128.7%0.267.2%9.6%
NWE0.05%1.08%0.58115.9%0.338.1%10.5%
OGE0.04%1.16%0.6898.8%0.419.0%11.4%
PCG−0.05%3.55%0.53192.3%0.247.7%10.2%
PEG0.04%1.12%0.53104.5%0.317.7%10.1%
PPL0.04%1.07%0.46180.1%0.217.1%9.5%
Table 3. Cost of privately held local and international thermoelectric companies.
ParametersNationalInternational
Leveraged beta0.380.28
Unleveraged beta0.360.26
Cost of equity (Ke) in reals11.32%10.48%
Cost of debt capital (Kd) in reals8.19%8.19%
WACC11.13%10.32%
WACC ANEEL (Technical Note N° 45/2020)10.55%10.55%
Table 4. Maximum, minimum and most likely values of the thermoelectric plant capital cost variables for estimating the WACC.
Brazil (BRL)EUA (USD)
MinimumMore LikelyMaximumMinimumMore LikelyMaximum
Unleveraged Beta0.120.370.890.170.270.42
Net Debt (×106)$1.11$9.10$35.75$1.70$21.84$46.98
Shareholders’ Equity (×106)$1.38$76.37$13.67$2.07$14.82$36.51
Table 5. Descriptive statistics of the output variables of the WACC projection from the perspective of IEE and EEI companies.
StatisticsBrazilian Companies (IEE)American Companies (EEI)
Average10.50%8.53%
Median10.40%8.49%
Standard Deviation1.35%0.63%
Variance0.02%0.00%
Kurtosis2.712.94
Coefficient of Variation0.12860.0745
Minimum6.64%6.79%
Maximum15.06%11.22%
Percentiles
0%6.64%6.79%
10%8.82%7.73%
20%9.30%7.98%
30%9.70%8.17%
40%10.06%8.33%
50%10.40%8.49%
60%10.77%8.66%
70%11.18%8.83%
80%11.66%9.06%
90%12.35%9.37%
100%15.06%11.22%
Publisher’s Note: MDPI stays neutral with regard to jurisdictional claims in published maps and institutional affiliations.

