Article

Quantitative Evaluation of Imbibition Damage Characteristics of Foaming Agent Solutions in Shale Reservoir

1
College of Petroleum Engineering, Xi’an Shiyou University, Xi’an 710065, China
2
Key Laboratory of Unconventional Oil & Gas Development, China University of Petroleum (East China), Ministry of Education, Qingdao 266580, China
3
Engineering Research Center of Development & Management for Western Low to Extra-Low Permeability Oilfield, Xi’an Shiyou University, Xi’an 710065, China
4
PetroChina Research Institute of Petroleum Exploration & Development, Beijing 100089, China
*
Author to whom correspondence should be addressed.
Energies 2022, 15(16), 5768; https://doi.org/10.3390/en15165768
Submission received: 19 May 2022 / Revised: 21 July 2022 / Accepted: 5 August 2022 / Published: 9 August 2022
(This article belongs to the Special Issue Enhanced Oil Recovery for Unconventional Oil and Gas Reservoirs)

Abstract

:
Shale reservoirs are characterized by extremely low porosity and permeability, poor connectivity, and high content of clay minerals. This leads to the reservoir being vulnerable to imbibition damage caused by foaming agent solutions during foam drainage gas recovery. It results in the decrease of reservoir permeability and the reduction of gas well production and ultimate recovery. Therefore, as the most commonly used foam drainage gas production, it is particularly important. This study is structured as follows. First, we analyze and evaluate the characteristics of shale reservoirs within the target area, and that of mineral composition and microscopic pore throat structures. Second, we study foaming agent types and two types are selected to be applied in subsequent sensitivity tests. Simultaneously, the nuclear magnetic resonance (NMR) method was used to study the microscopic characteristics of reservoir damage and imbibition damage of shale, caused by the impact of foaming agent solutions during the foam drainage and gas recovery processes. Finally, it is concluded that the degree of damage to the core permeability is minimized when the concentration of foaming agents is 0.4–0.6%. A trend has been established for increased damage to the cores with increasing exposure time. Additionally, this study provides technical guidance for damage evaluation and reservoir protection in shale reservoir exploitation.

1. Introduction

Water infusion in the shale matrix is a common problem in the modern state-of-the-art development of shale gas reservoirs. It frequently causes a reduction in productivity or even complete shutdown of the producing wells. Drainage gas production method is used to discharge the accumulated liquid at the bottom of the well and increase gas production. It plays a critical role in this production process. Of these techniques, the most commonly used method is foam drainage gas recovery. However, it is known that water-based fluids (including foamed fluids) may cause imbibition damage to reservoirs. Therefore, it is essential to reveal the damage mechanisms of foamed fluids to protect the formation rock and improve productivity [1,2].
Starting in the 1950s, extensive research has been conducted to study reservoir damage outside of China. These early-stage studies were mostly focused on empirical experimental work. The researchers believed that the formation damage would only affect the output rate, not the ultimate recovery [3,4]. Later, some authors indicated that the shale reservoir damage problem required comprehensive evaluation, because the performed studies of damage mechanisms and the affecting factors did not cover the whole picture [5].
In 2013, Zheng et al. [6] summarized the results of shale reservoir damage studies over the past 30 years. He attributed the major root of shale reservoir damage to water locking caused by injected fluids. At the same time, due to poor fluid inhibition, clay cannot be prevented from hydration and expansion, which makes it incompatible with reservoir rocks. Lu et al. [7] studied shale reservoir damage during drilling and concluded that extended research is required to fill the gap in understanding the impact of drilling fluids on wellbore stability and their compatibility with reservoir rocks. Zhang et al. analyzed the water lock damage on productivity of the Yanchang Formation in 2017. The authors concluded that the pore diameters in the studied shale reservoir were small which encourage the injected fluid to invade the rock matrix due to the capillary force, resulting in water lock damage and leading to a reduction in the permeability of the reservoir [8]. In 2017, Liu et al. studied the permeability change of active-water saturated shale compared with dry samples. It was concluded that active water pollutes the reservoir, leading to a decrease of shale permeability, and the damage increases with the prolonging of soaking time. [9]. In 2019, Wang et al. [10] and Wang et al. [11] studied shale reservoir sensitivity and water lock damage that were caused by injected fluids. The authors demonstrated that the severe damage of the studied shale formations could be explained by their sensitivity to injected fluids. The decrease in the rock permeability was primarily caused by swelling of clay deposits in formation pores upon penetration of the injected fluid. In 2020, Yi et al. [12] conducted studies of the leak-off-related damage of shale reservoirs from fracturing fluids. They confirmed that leak-off and forced imbibition caused significant reduction in shale permeability, which was also dependent on mineral composition of the rock and pore size distributions. Xiong et al. studied the imbibition characteristics of the Longmaxi Formation shale in 2020, and divided the imbibition process into three stages, namely, rapid imbibition stage, imbibition transition stage, and late imbibition stage. At the same time, it is clear that the oil imbibition speed and capacity of shale are lower than that of water, and cations can effectively reduce its imbibition capacity [13]. In 2021, Ke et al. studied the water lock damage in low permeability gas reservoirs and determined that it was caused by capillary-force-induced water absorption and determined that the main factors affecting the water lock damage included capillary radius and adhesion tension. The authors also performed corresponding research on the methods to remove the water lock damage [14]. In the study of spontaneous imbibition in shale reservoirs conducted in 2021, Xu et al. examined the conclusion about the decrease of the imbibition rate during the imbibition process. At the same time, due to the high clay mineral content in shale, the imbibition driving force is strong and damage is more serious [15]. In 2022, Xu et al. studied the imbibition-related damage of fracturing fluids to tight gas formations and concluded that imbibition in tight gas rocks starts instantly and slows down with time. Imbibition degree increased as time increased. It was concluded that the capillary force drives the liquid into small pores at first and then big pores. So, the smaller the pore, the greater the imbibition damage due to a greater capillary force [16]. This means that, due to the extremely low porosity and permeability of shale reservoirs, the imbibition of various injected fluids may cause serious damage to the permeability.
During the first stage of the study the mineral composition of the shale reservoir in the study area was analyzed. Then, we carried out imbibition experiments and studied water lock damage for various foaming agent solutions. This aims to confirm the characteristics of damage by the optimal concentration of forming agents and injection time. This performed study fills the gap in the study of formation imbibition and water lock damage caused by foaming agent solutions. At present, it has certain guidance for the main problems of shale damage and can also provide reference for the follow-up research on reservoir damage and reservoir protection.

2. Analysis of the Shale Reservoir Characteristics

The study area is located in the Longmaxi shale at the southern edge of the low-steep fold belt of the southern depression of Sichuan platform, whose southern part is adjacent to the northern Yunnan-Guizhou depression. Experiments were carried out to study shale mineral composition, microscopic pore throat characteristics, and rock wettability. Then, the characteristics of the shale rock were analyzed to define the risk of the damage that may be caused by injected water-based fluids. This provided data for the following imbibition and water locking damage experiments with foamed fluids.

2.1. Mineral Composition Characteristics

The mineral composition of shale formation in the studied area was evaluated using the X-ray diffraction method (See Table 1). According to the experimental results, the mineral components primarily included quartz, feldspar, calcite, pyrite, and clay minerals. Quartz mass content varied from 20.1 to 50.3% with a mean content of about 34.67%; feldspar content was about 13.28%; and carbonate content was 15.87%. The clay minerals primarily included illite, chlorite, kaolinite, and illite interlayer. Mass content of illite was 10.3–52.6%, with a mean of 28.61%; mean chlorite mass content was 1.27% with a maximum of 9.6%; and mean kaolinite mass content was 0.23%. In the studied shale, quartz and clay minerals predominated and the content of brittle minerals was relatively high, which indicates that the reservoirs are highly fracturable and stimulation is more feasible. Simultaneously, the content of clay minerals was relatively high which benefited the adsorption and storage of shale gas and largely contributed to shale gas accumulation. However, the high content of clay minerals makes the reservoir vulnerable to sensitivity damage. For example, a high content of illite makes it easy to cause reservoir water lock damage. Therefore, it is necessary to more accurately know the possible damage of shale reservoirs.
Wang Xiuping et al. analyzed the shale mineral components of the Longmaxi Formation shale [17]. According to their data, quartz’ and feldspar’s content in the formation rock is over 50% mass with maximum clay content of 40% and carbonate content of 30%. The content of brittle minerals in the studied area is relatively high, with a maximum of 69%, in contrast to a relatively low content of clay minerals.
Guan Xiaoxu studied the mineral composition of the Longmaxi Formation samples by X-ray diffraction method. According to his results, the mass contents of feldspar, pyrite, and clay varied in the studied samples in the range of 3–15%, 1–3%, and 20–50%, respectively. He also demonstrated that illite is the main clay of the studied rock. The results of this study are consistent with other published results [17,18,19].
Gao Hui and other researchers studied the Chang 7 shale reservoir located at Ordos basin [20]. They found that shale in this area has high organic matter content, with TOC content ranging from 2 to 6%, and Ro distribution ranging from 0.9 to 1.2%, which corresponds to the mature rock state. According to these data, the shale of Chang 7 member can be considered a high-quality source rock.

2.2. Microscopic Pore Throat Characteristics

Table 2 and Figure 1 show the pore characteristics of the studied rock samples obtained using isothermal nitrogen adsorption methodology. The specific surface area (BET) ranges from 1.81 to 11.43 m2/g with a mean of 5.22 m2/g. The total pore volume of pore size distribution test (BJH) ranges from 0.0095 to 0.03 mL/g with a mean of 0.0203 mL/g. Furthermore, the pore diameter ranges from 9.79 to 18.87 nm with a mean of 14.81 nm. Figure 2 shows nitrogen adsorption curves for some of the studied cores. These results are in agreement with the data by Zhang Mengqi et al. [21], who reported a mean diameter range of 0.5–30 nm.

2.3. Wettability Characteristics

The contact angle was measured using a standard direct measurement method, which drops the liquid directly on the solid surface, then takes a photo and measures the contact angle with a protractor. The corresponding experimental accuracy was ±1°. The results of the wettability tests for the studied core samples are listed in Table 3. Figure 2 also shows pictures of the contact angles for core samples 1 and 2 measured during the performed experiments. According to the obtained results, contact angles of the studied core samples vary in the range of 6.57–36.12, which corresponds to predominately hydrophilic wettability characteristics. Contact angles are measured to be less than 60 degrees for 0.9% sodium chloride solution and fracturing fluids. This indicates the shale is hydrophilic. The measurements of wettability characteristics of shale are consistent with the previous literature. The accuracy of the experimental results is further proved [19].

3. Foaming Agent Type and Quantification of Sensitivity to Concentration

3.1. Foaming Agent Type

The foaming property, stability, and liquid-carrying capacity of the foaming agent were measured by Roche foam meter. Foam stability was characterized by foam half-life time T1/2.
To differentiate foaming agents, a comprehensive foaming index E was introduced to accurately characterize foaming agent properties. By definition, this index is the product of bubble volume V0 and half-life T1/2 [22,23,24].
E = V 0 × T 1 / 2
Testing of the foaming agents was performed under various conditions. The effects of temperature, pressure, salinity, surface tension, and liquid-carrying capacity on its performance were studied. Table 4 shows the foaming characteristics of two surfactants, HY-3K and UT-18, which demonstrated the highest values of the foaming index E and were selected for the field applications. These agents were stable at a temperature of 150 °C and pressure of 12 MPa, and also demonstrated good foaming ability at a salinity of 200,000 mg/L (200,000 ppm).

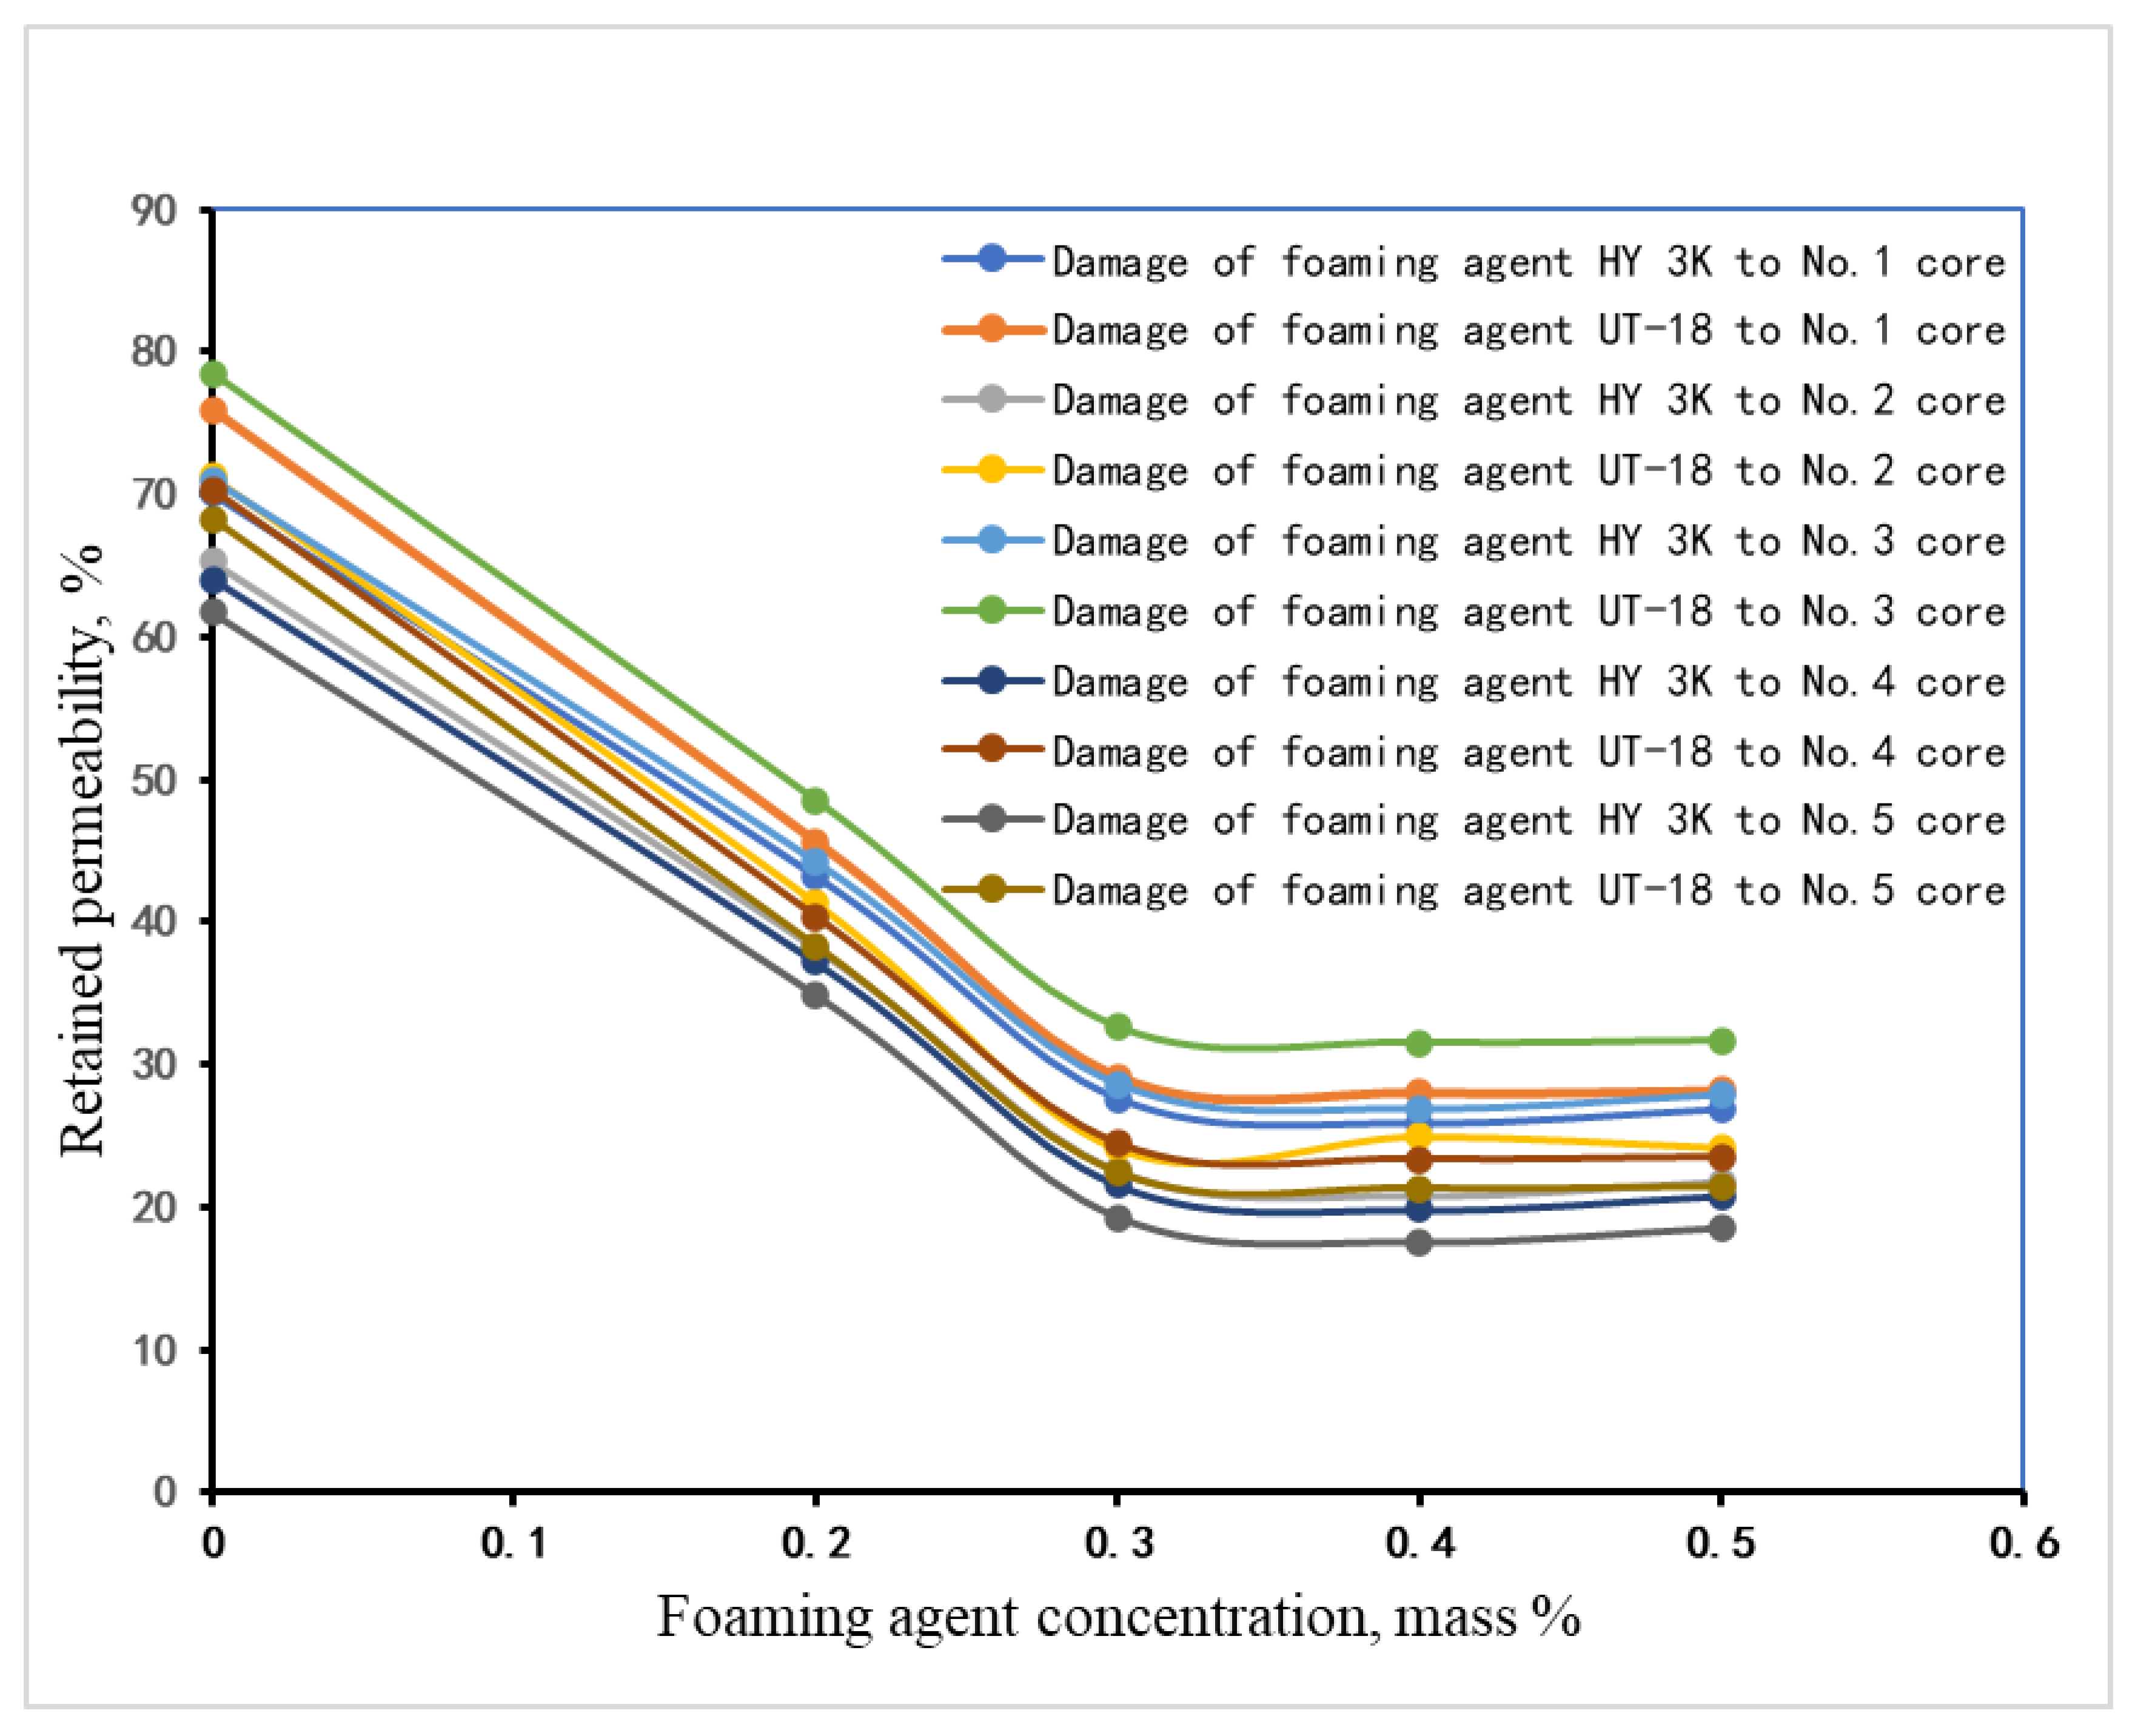
3.2. Quantitative Evaluation of the Impact of Concentration of the Foaming Agent on Rock Permeability

Permeability tests were carried out using five cores to evaluate the impact of the foaming agent solution, prepared with HY-3K and UT-18 agents, on the rock’s permeability. To reveal their impact on the cores, 0%, 0.2%, 0.3%, 0.4%, and 0.5% of the studied surfactants were mixed with simulated formation water. Test accuracy and reliability were guaranteed following the core column pressure attenuation method (ISPP).
The experimental steps and principles are as follows:
(1)
A grinder and sandpaper were used to polish the core end face, measure the length L and diameter D of shale, dry the shale core column at 100 °C, and then measure the effective porosity φ of shale samples by the gas (helium) expansion method.
(2)
The shale core was put into the core holder, the confining pressure was increased to 9 MPa, and the valve was opened to fill in nitrogen with a pressure of 6.8 MPa (1000 psi). After the gas pressure stabilized, the valve was closed, and the outlet valve of the downstream chamber was opened, and then a small amount of gas was released. We then measure the relationship between the upstream chamber pressure pu and downstream chamber pressure pd with pressure, and then calculate the permeability of the core column. During the whole permeability test process, the data acquisition and the corresponding solution processing were all completed by the software of the instrument.
According to the data on Table 5 and Figure 3, penetration of the studied foamed fluids into the core samples resulted when the concentration of foaming agent was 0.4–0.5%; the damage rate was the lowest, and the overall damage degree was 26.8–45%. The obtained data can be explained by the simultaneous impact of the two following potential mechanisms. First, foaming agents could be adsorbed on pore surface which could plug shale pores, and this process caused a reduction in core permeability. Second, injected surfactants reduced the capillary pressure in pores and mitigated water lock, this reduced the intrusion of working fluids and increased permeability. Due to the two effects, the rate of permeability damage from the foaming agent solutions remained at a relatively low level [25,26,27].
Foaming agent HY-3K reduced the capillary pressure by decreasing the interfacial tension and modifying the contact angle, as shown in Figure 4. The contact angles were measured as 88.4 degrees after treatment from surfactants in comparison to 38.3 degrees without treatment.

4. Damage Characteristics of Foaming Agent Solution to Shale Reservoir

4.1. Experimental Procedure

Permeability damage was quantified using results of the filtration experiments. The filtration experiments were performed using core samples 25 mm in diameter and 45 mm in length, solutions of the selected surfactants, and a fracturing fluid. The fracturing fluid has a viscosity of 2.5–3.0 mPas at 170 s−1. A nuclear magnetic resonance (NMR) setup, model Mini-MR was employed for the quantitative evaluation of damage of nano-porous throat systems. In these studies, NMR T2 spectra were recorded to determine fluid distribution in the cores. Then, the fluid distribution in the samples soaked in solutions of foaming agents were compared with fluid distributions in the original samples. NMR measurements were performed at a magnetic field of 0.5 T, pulse frequency range of 1–30 MHz, and resolution of 0.01 MHz. Additionally, the echo time Te was 0.27 ms, waiting time Tw was 4000 ms, the number of echo periods Nech was 6000, the number of scans Ns was 64, and the pulse width is divided into 90° pulse width (P1 = 22) and 180° pulse width (P2 = 40), correspondingly. The NMR setup was calibrated before every test to ensure accurate and reliable measurements [28,29,30,31].
Experimental methods: Rock samples were put into beakers and the damage degree of fracturing fluid and bubble drainage fluid were calculated by measuring core NUCLEAR magnetic resonance T2 spectrum under different conditions. The specific test steps were as follows [32].
(1)
After centrifuging the core, we placed the core in an incubator and heated it to 105 °C for 48 h, then removed it and measured the dry weight and size of the core.
(2)
Dry core was placed in simulated fracturing fluid and heated to 110 °C (simulated formation temperature) in a constant temperature bath.
(3)
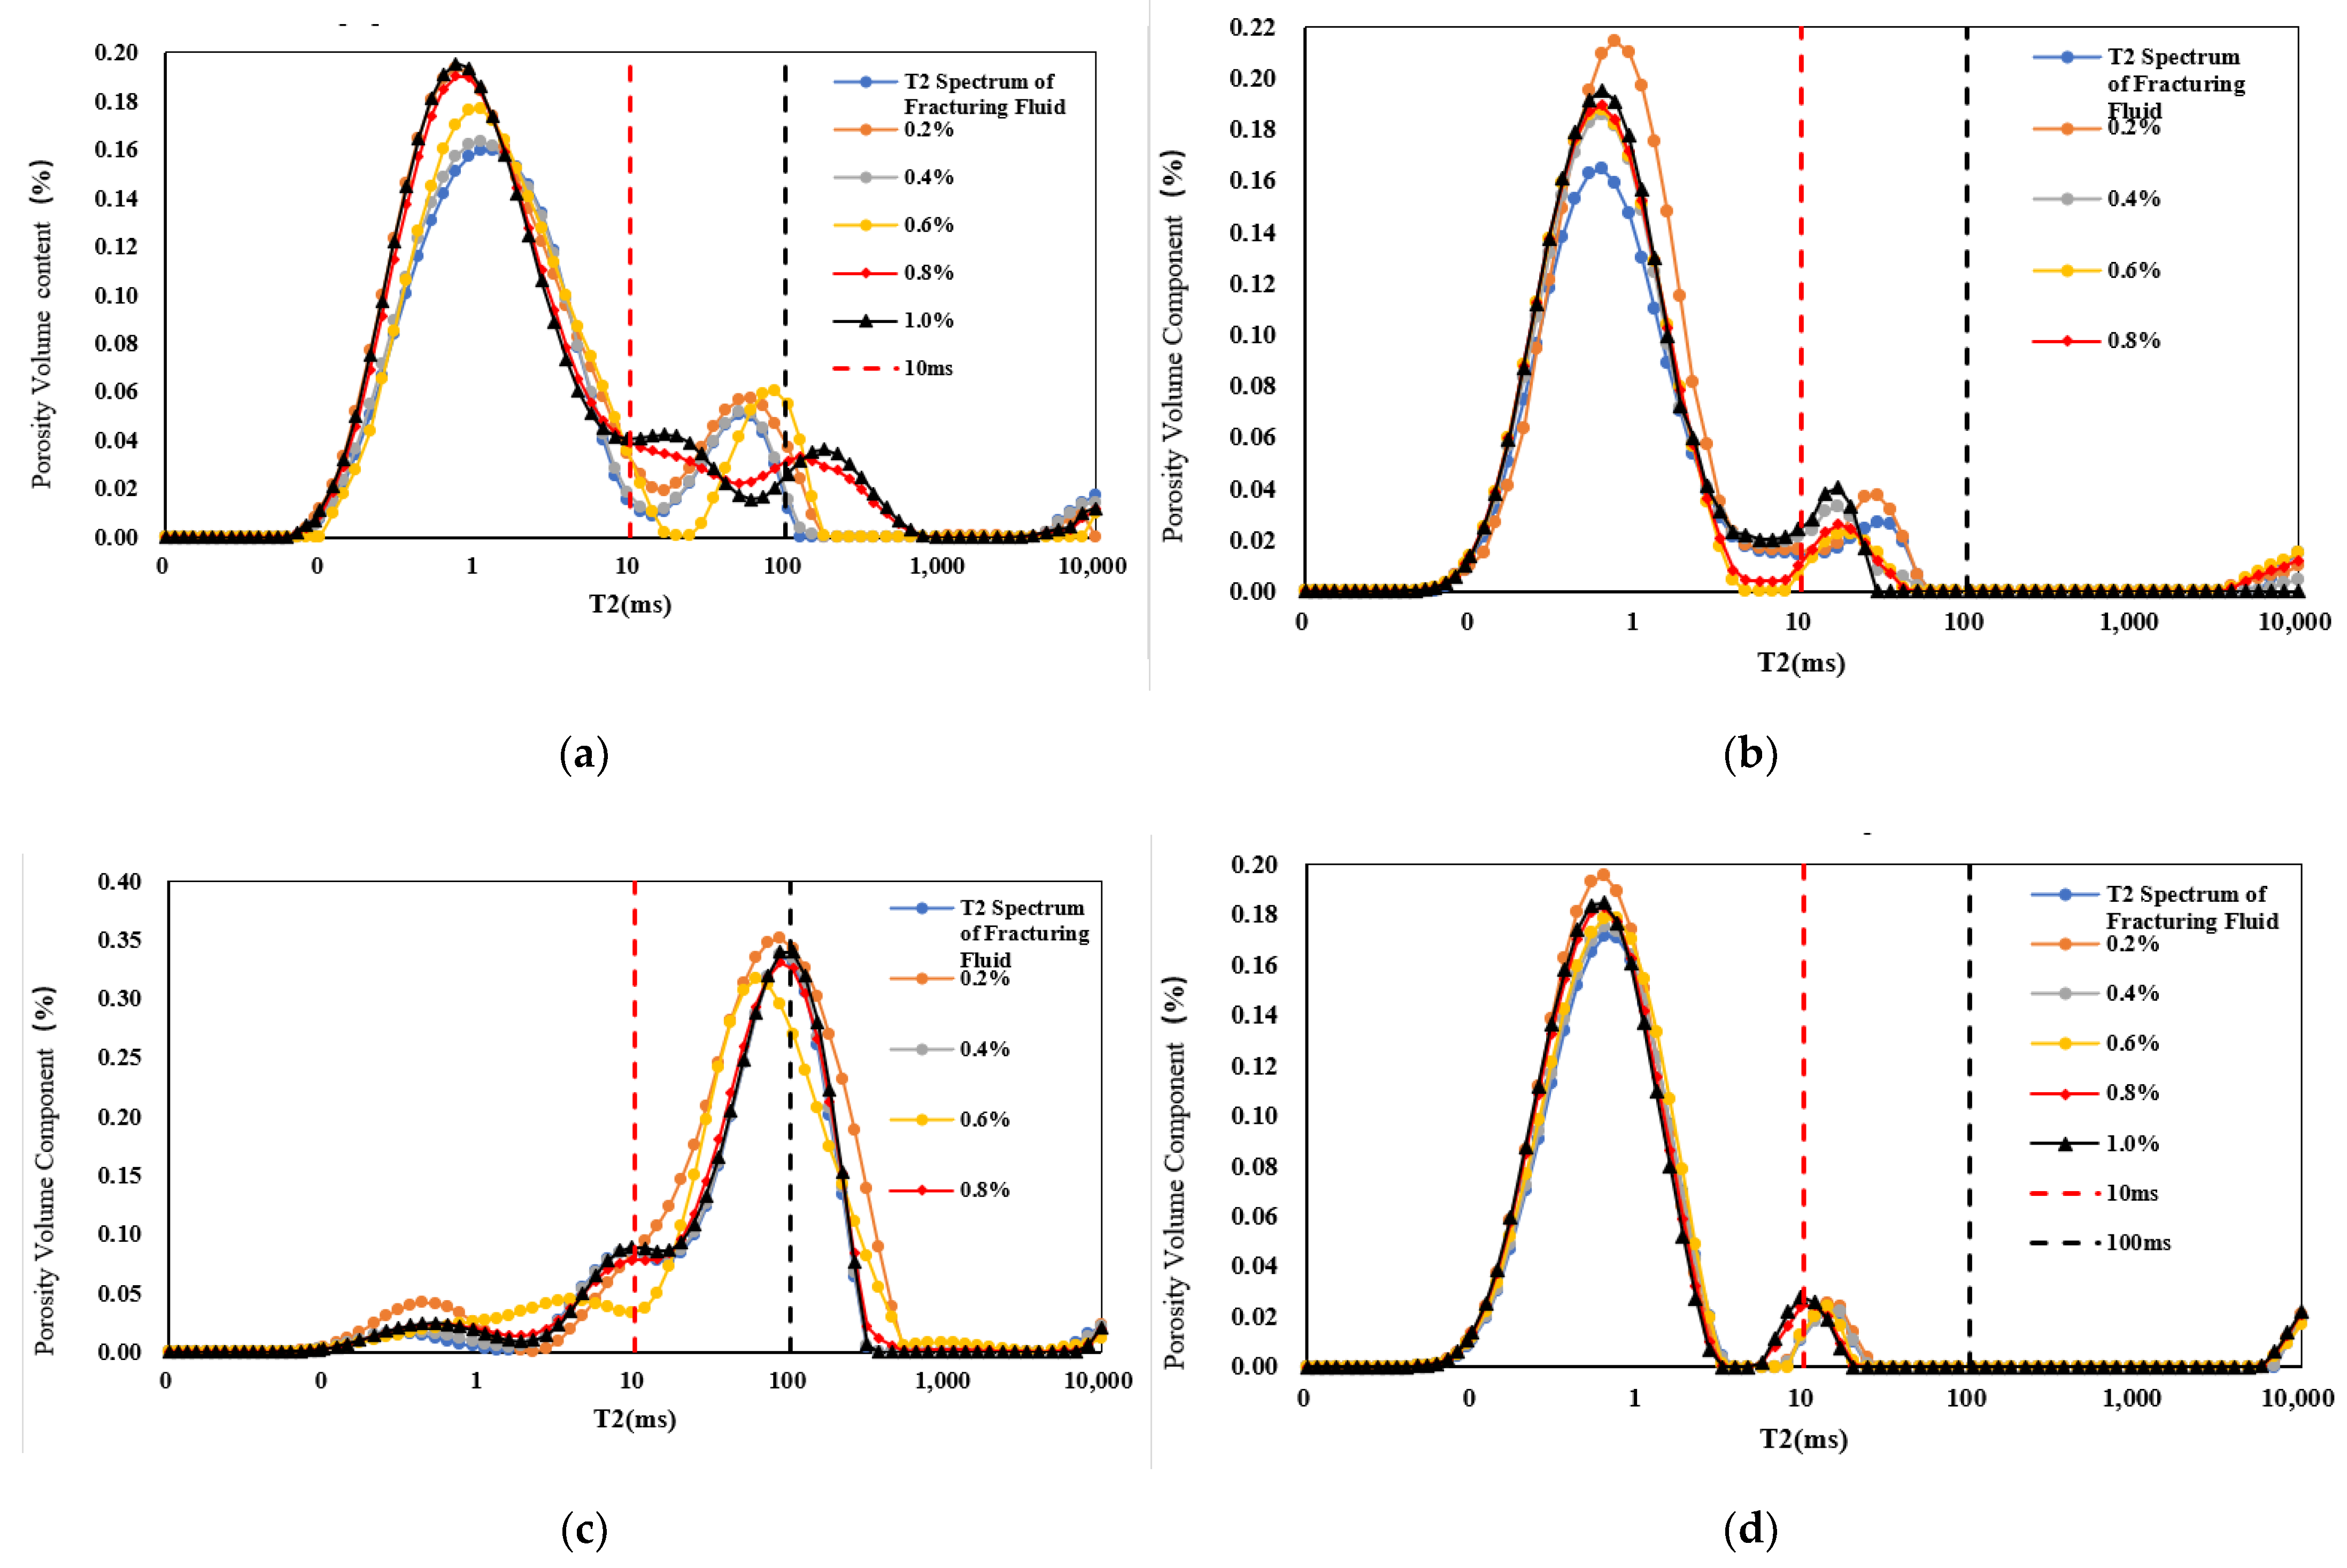
In order to conform to the actual situation on site, the core was first placed in a beaker for the imbibition experiment of fracturing fluid. The imbibition experiment was carried out at a constant temperature of 80 °C for 12 h, and then the T2 relaxation time spectrum of the core was measured.
(4)
After the above experimental steps were completed, the cores were placed in simulated formation water with different concentrations of foaming agents (0.2%, 0.4%, 0.6%, 0.8%, and 1.0%) to imbibe for 12 h, and the T2 relaxation time spectra of the cores were measured.
(5)
After the above experimental steps were completed, the experimental steps (1)–(3) were repeated. The optimal concentration of foam discharge agent solution was imbibed at 110 °C for 12 h, 24 h, 36 h, 48 h, and 72 h, respectively, and then the T2 relaxation time spectrum of the core was measured.

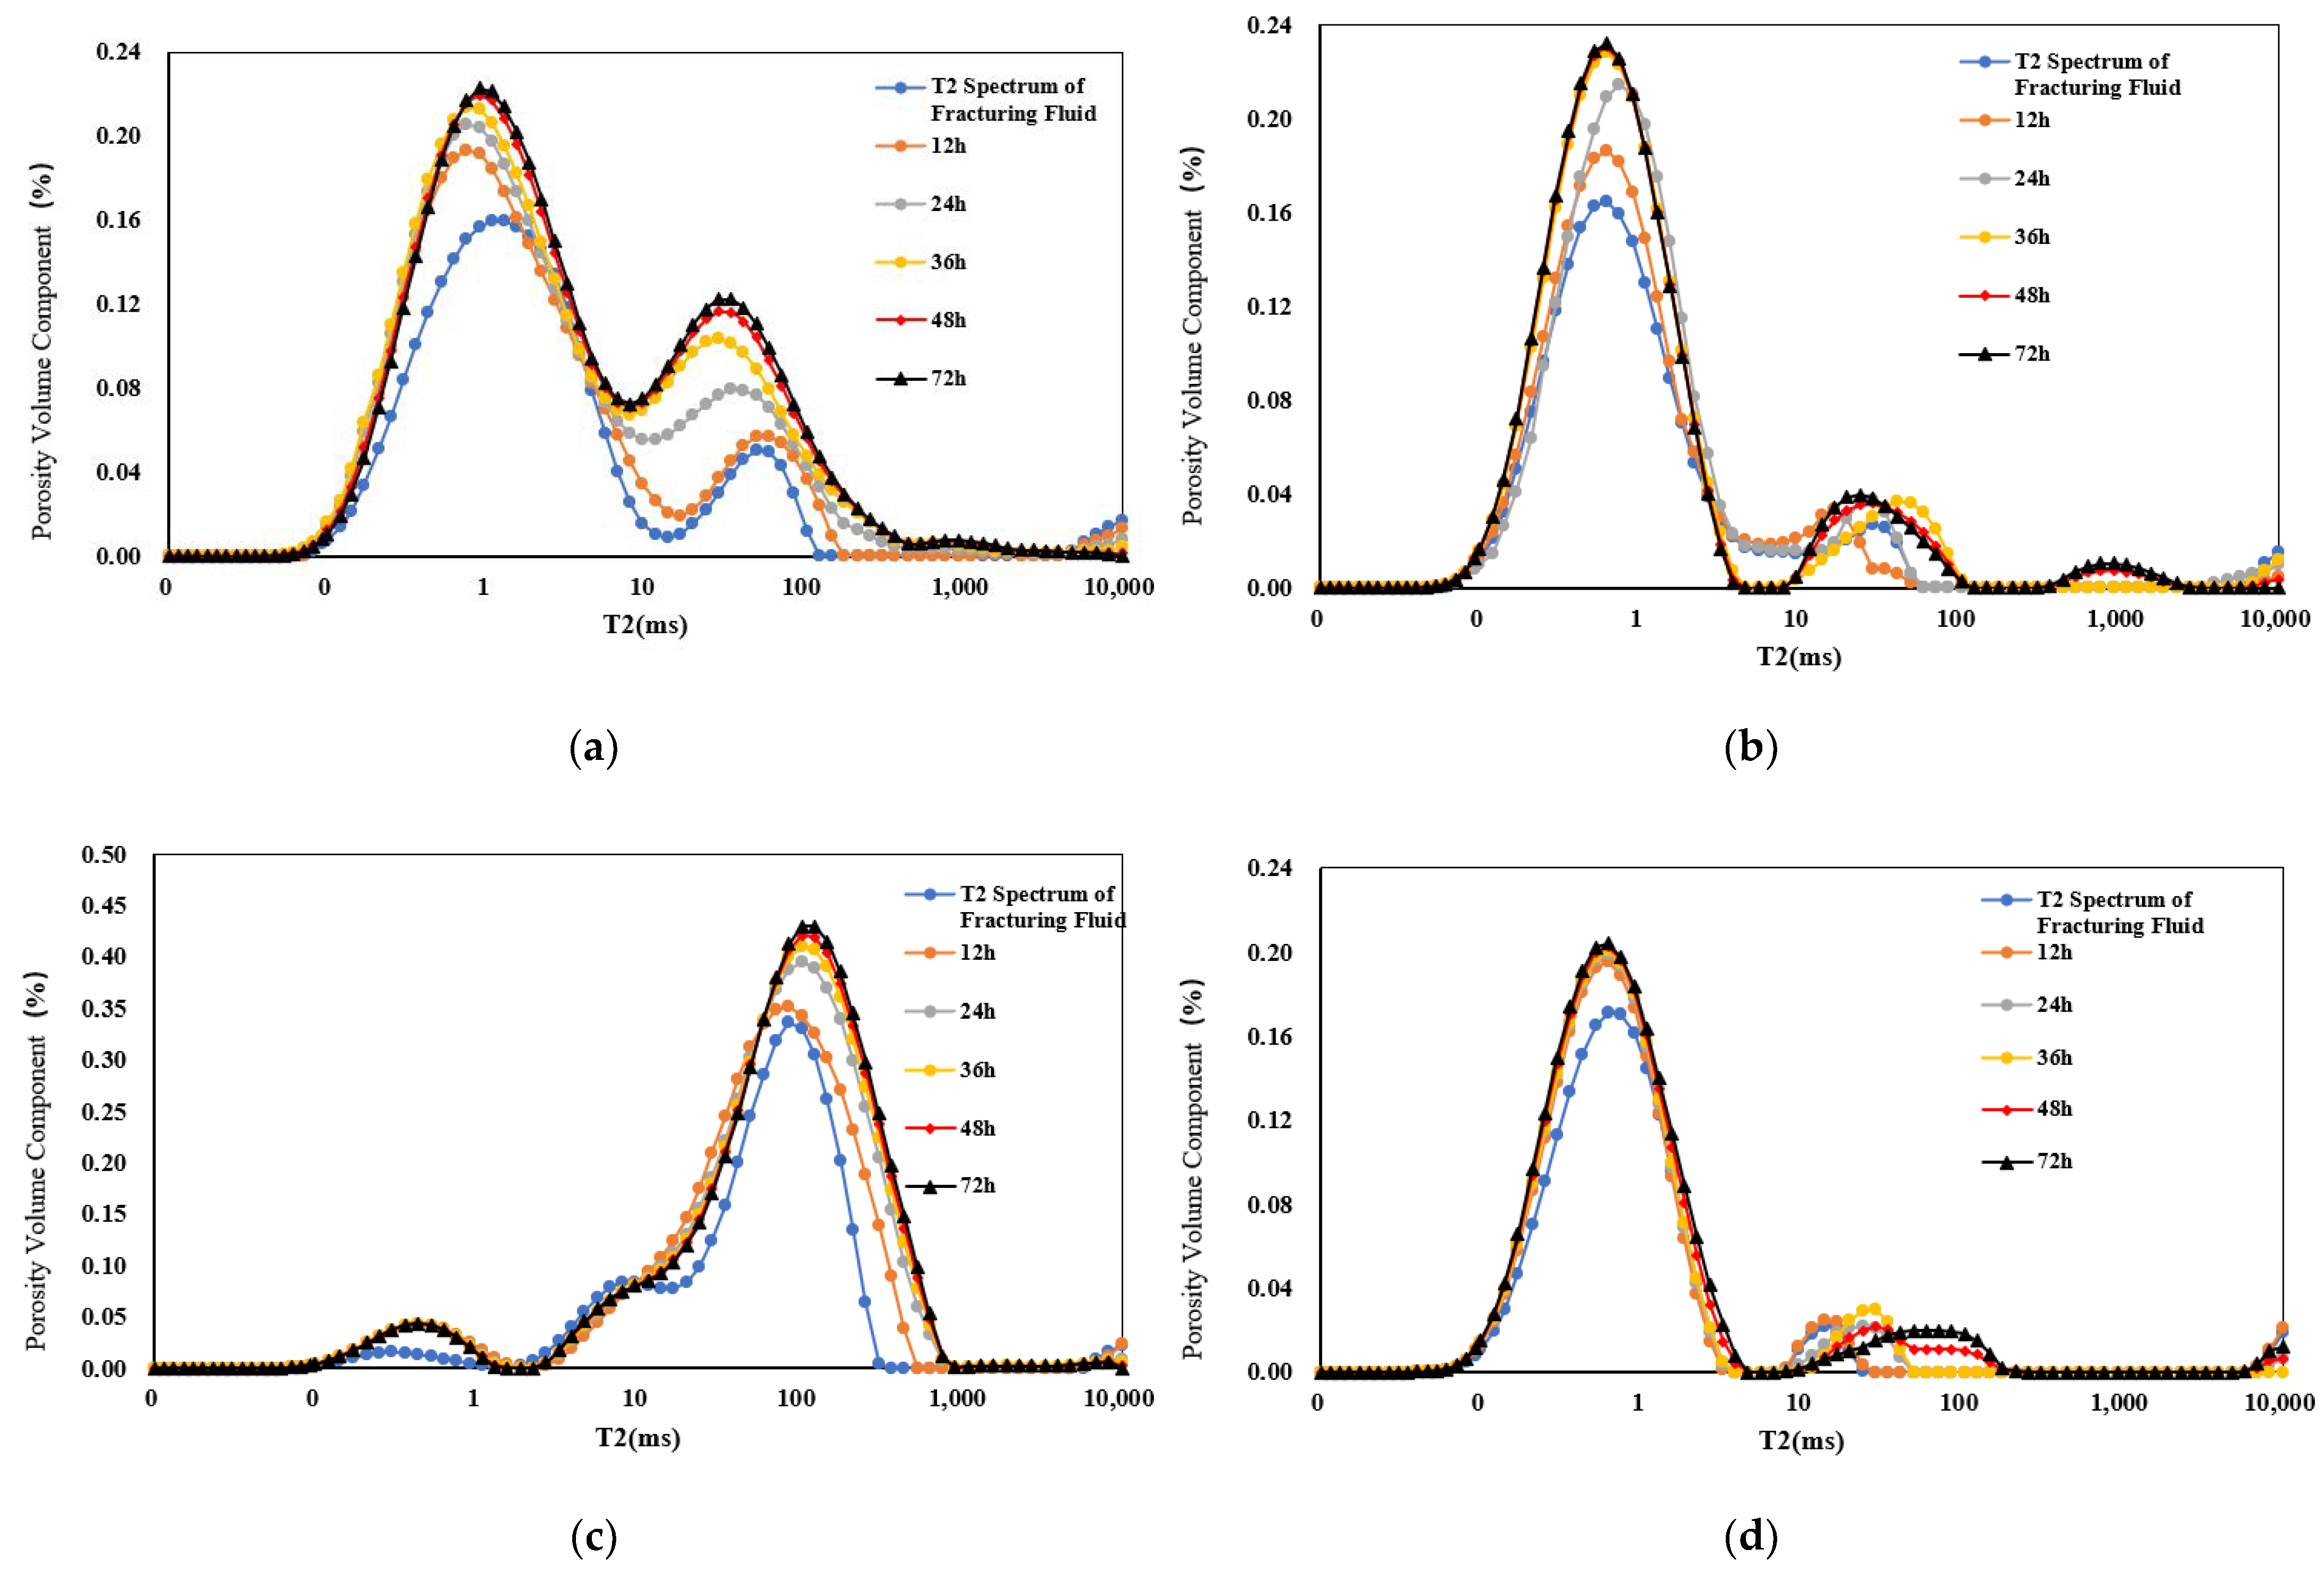
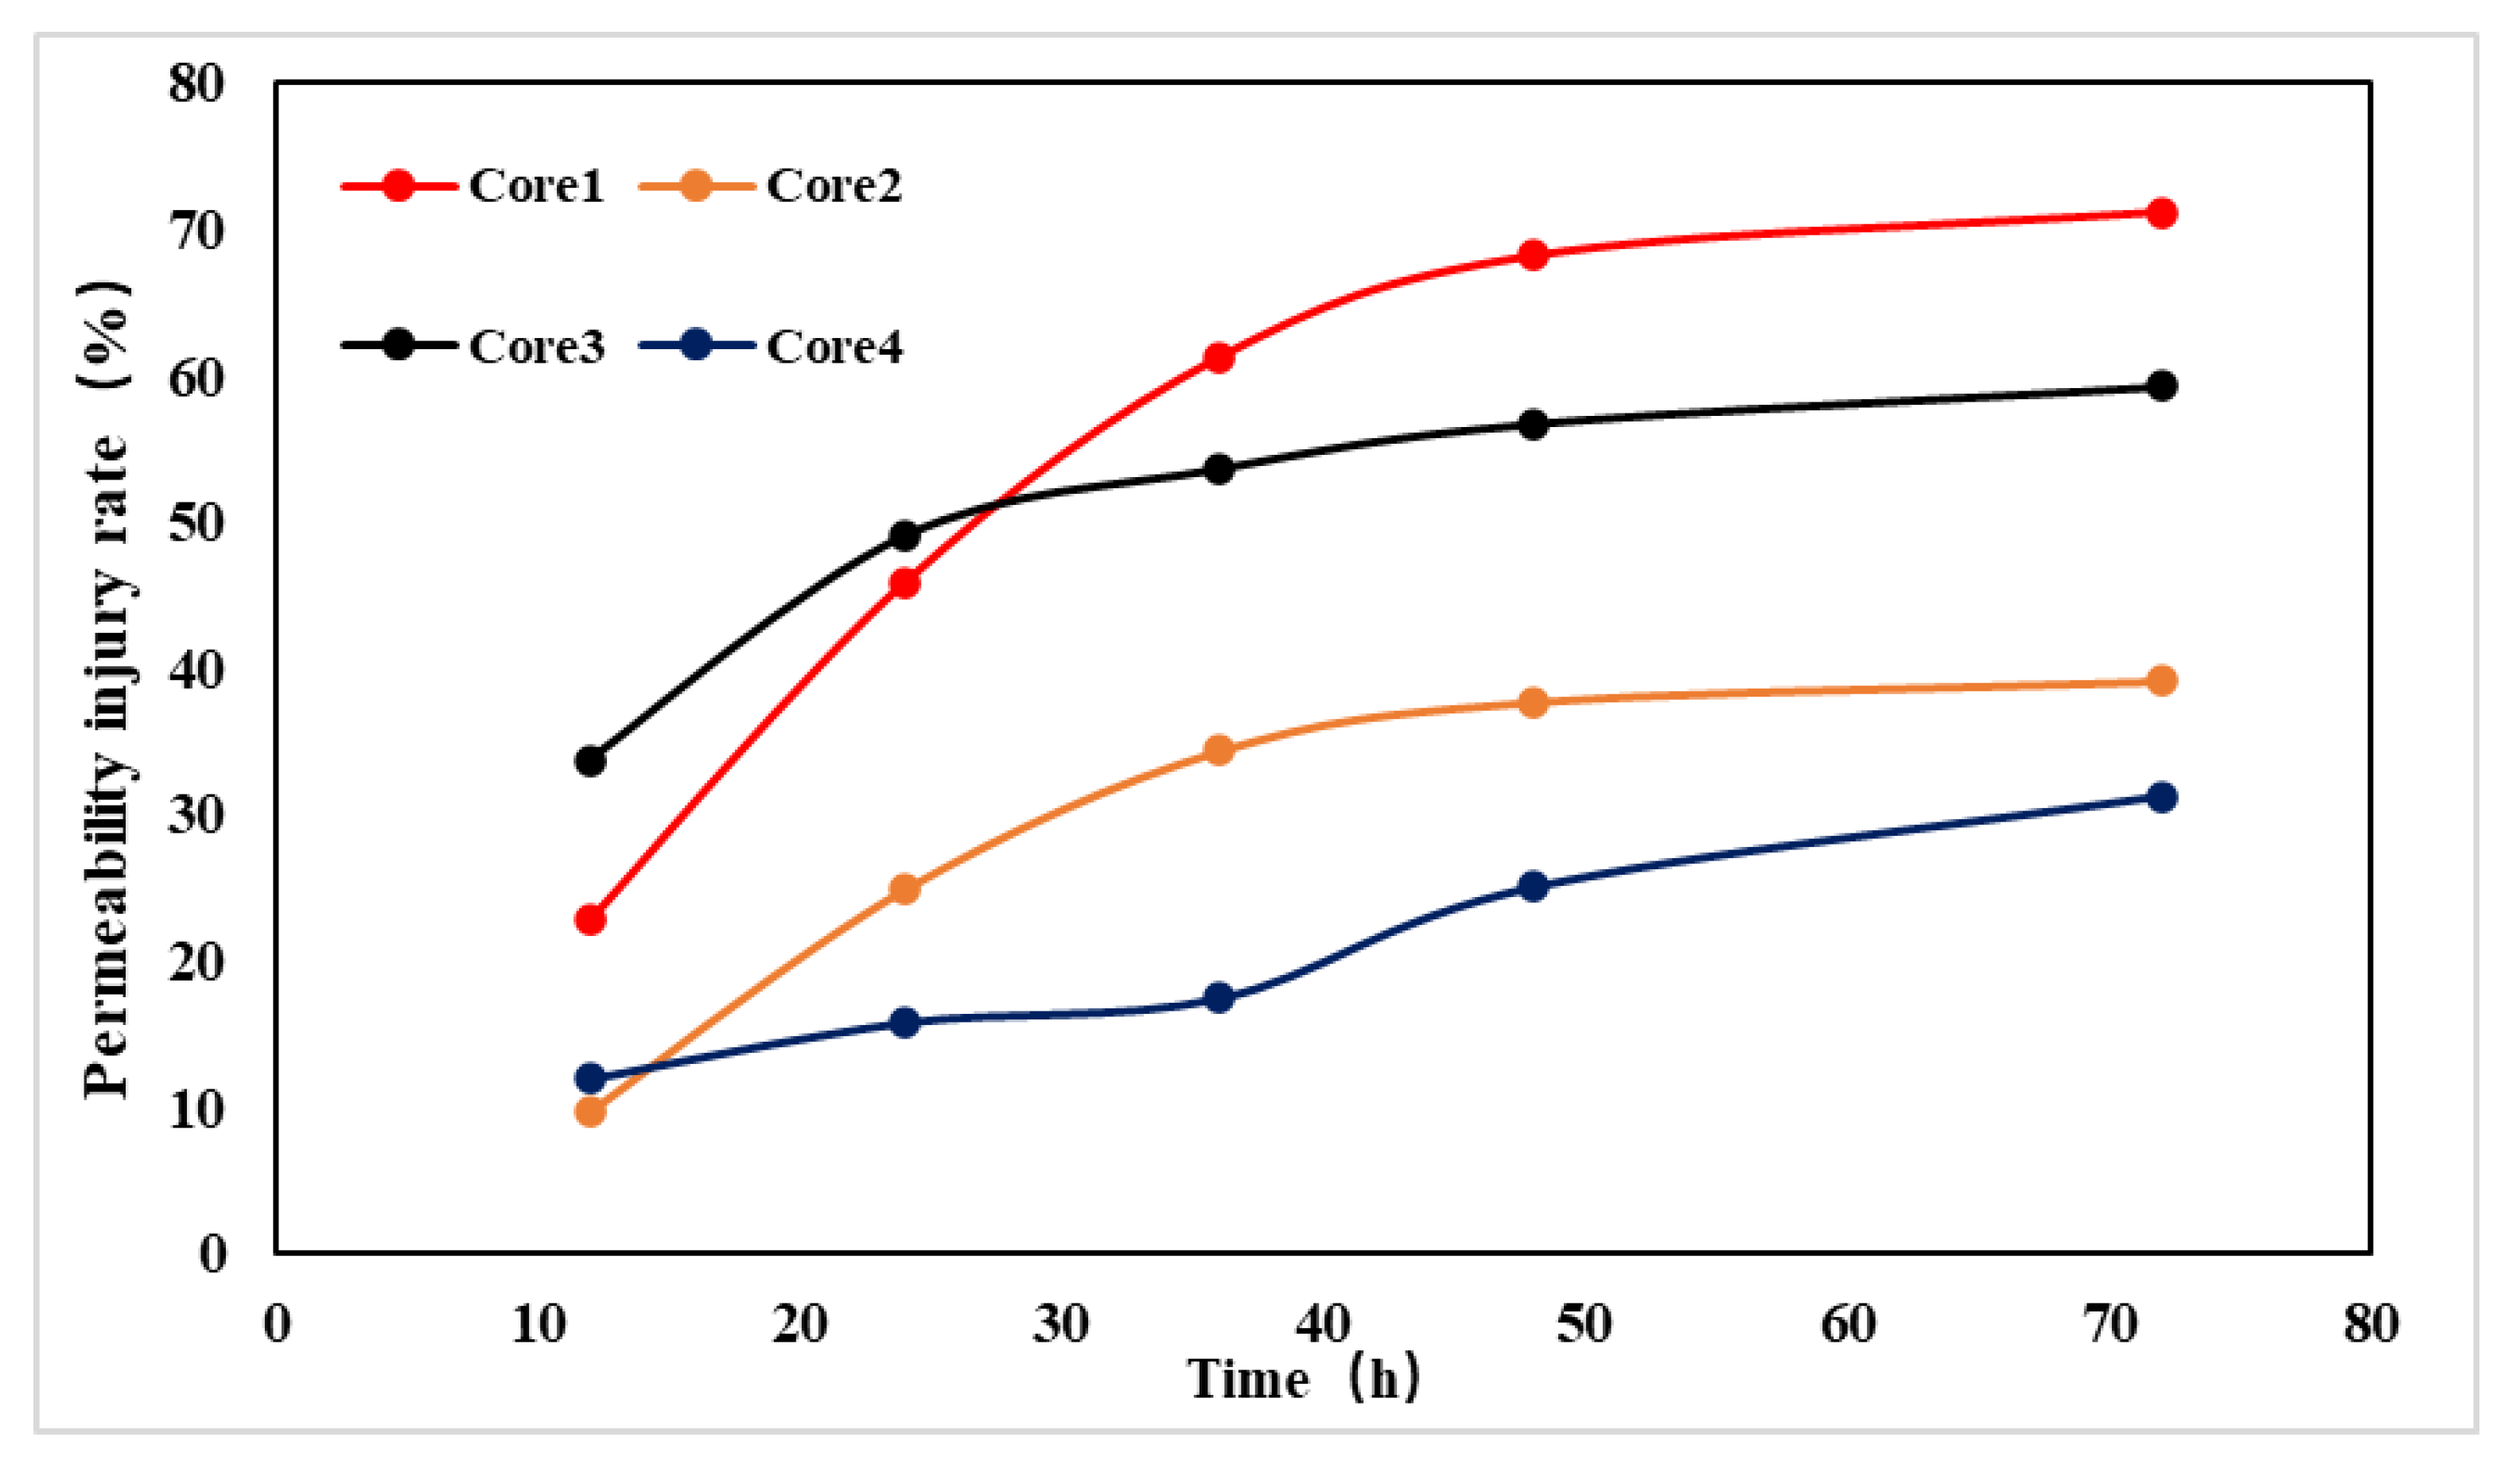
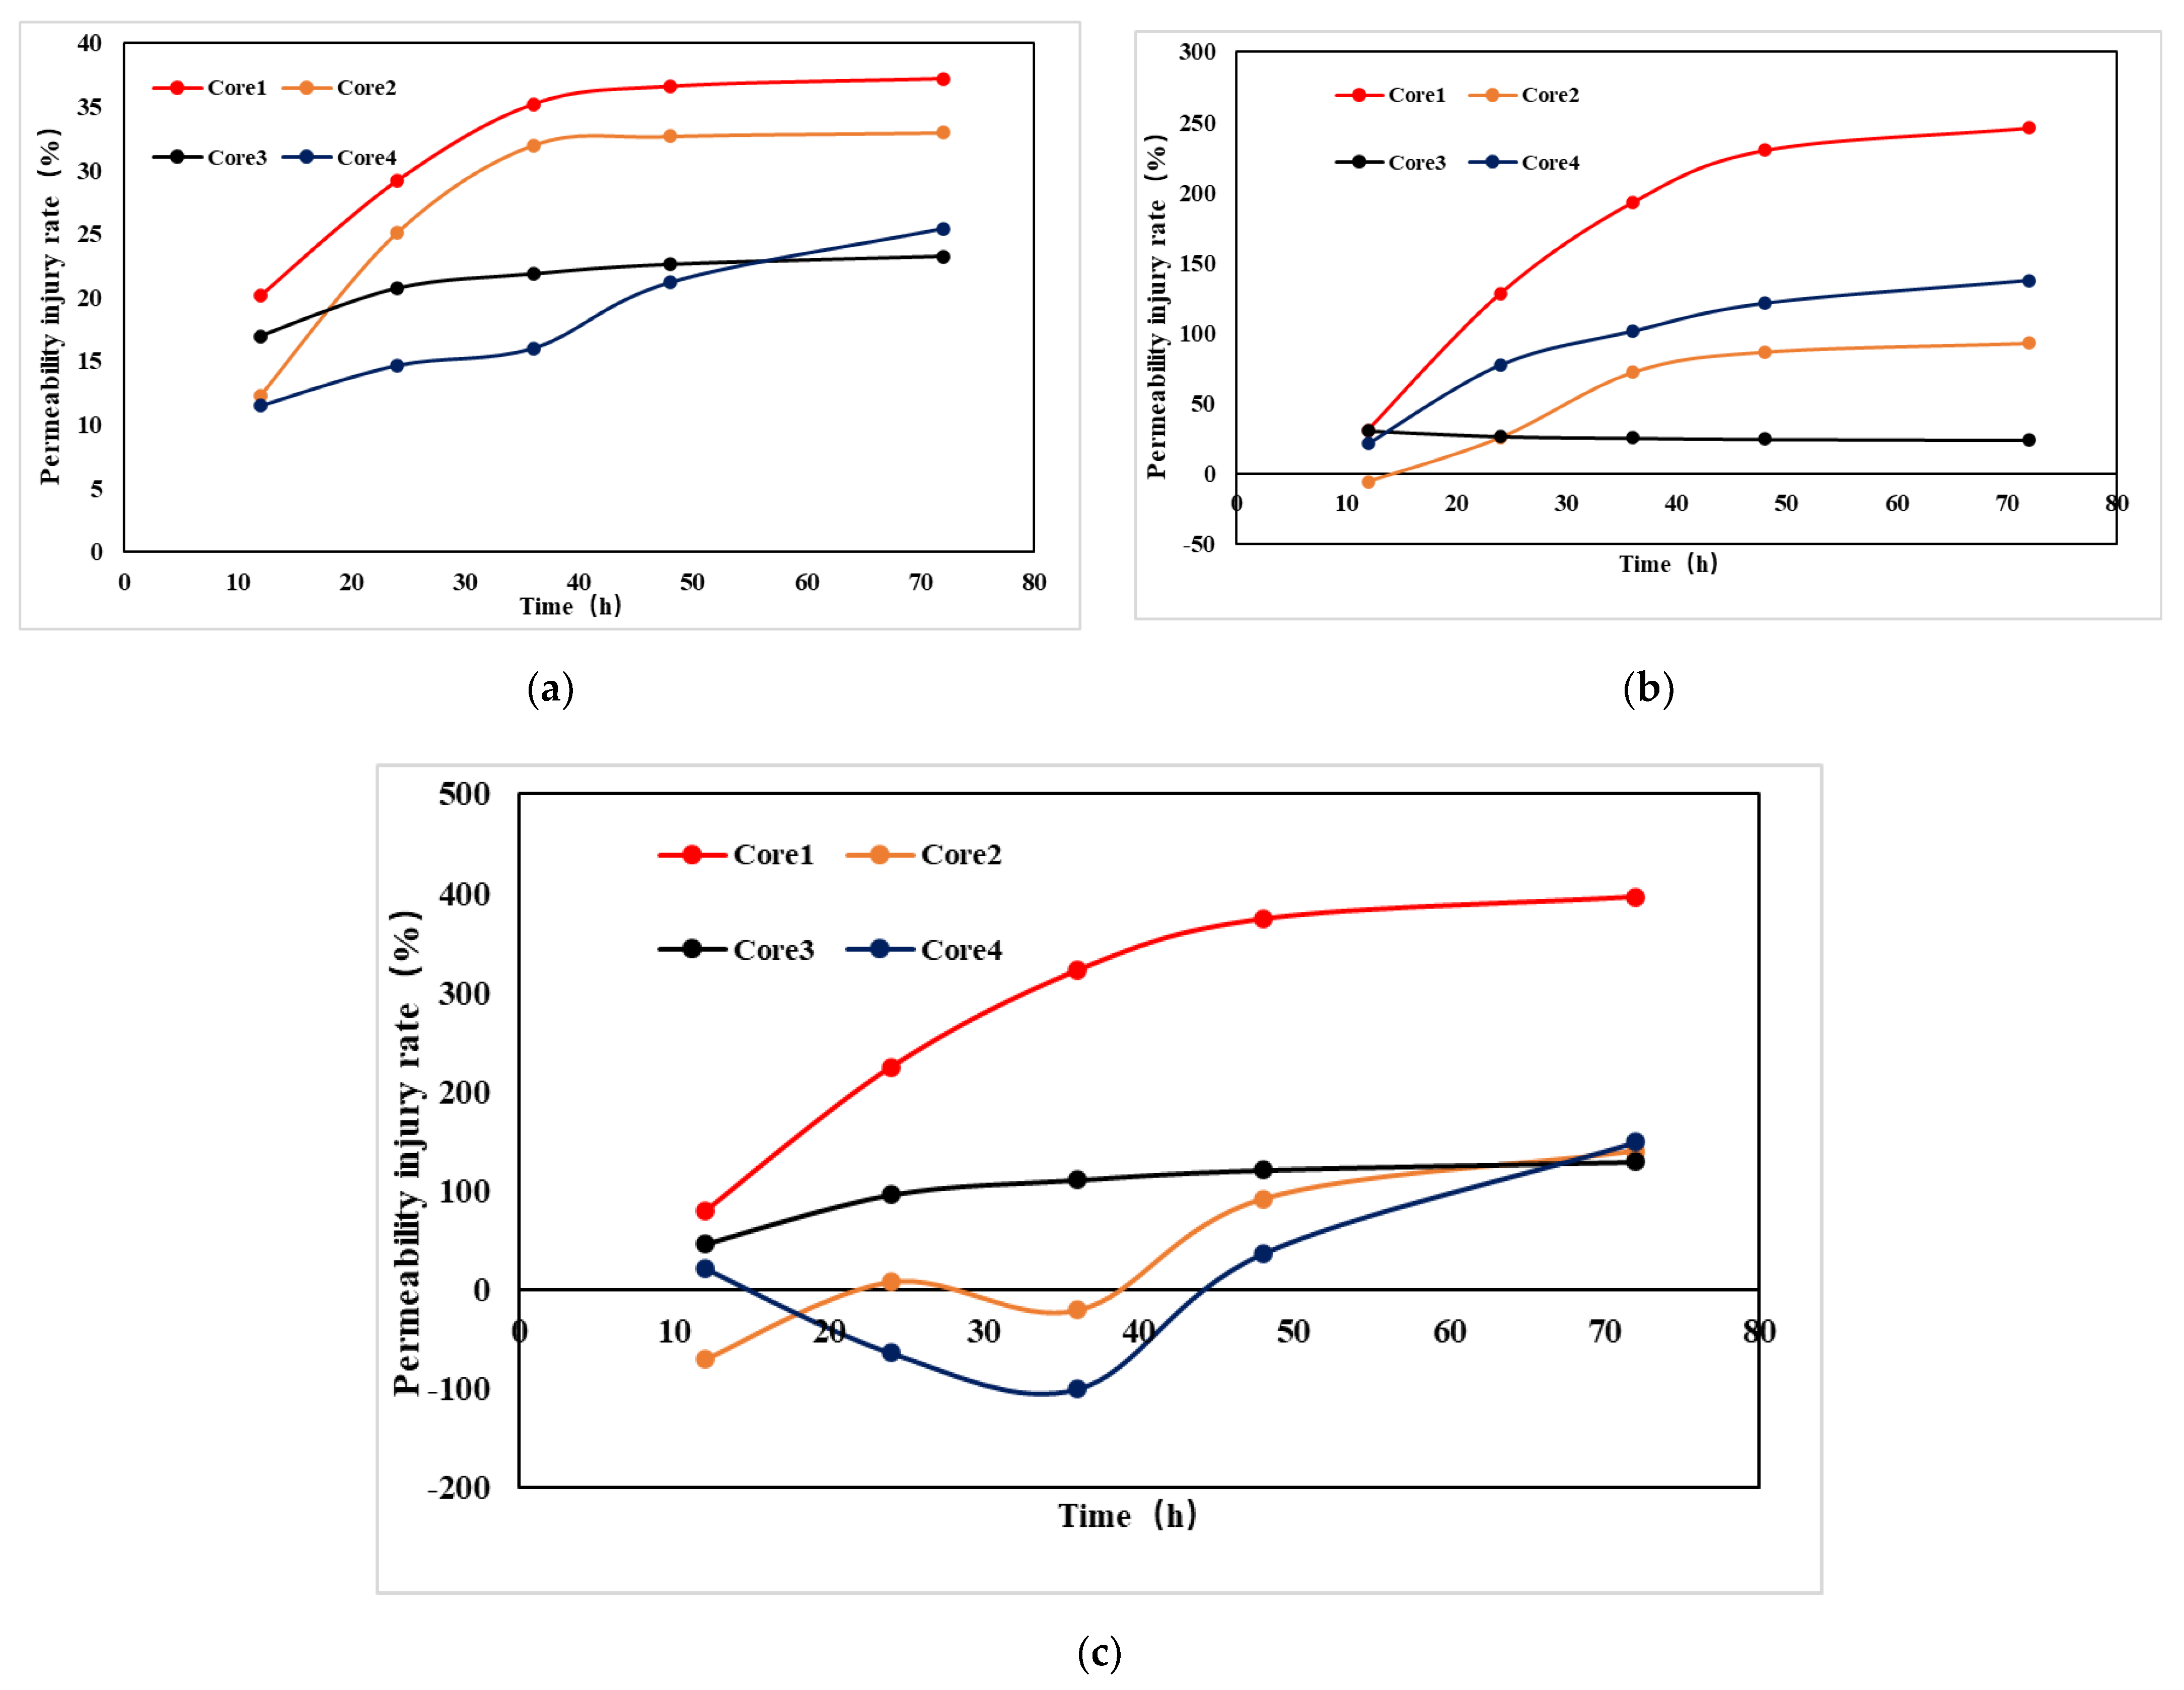
4.2. Results and Discussion

According to the actual production situation, four core samples were put into fracturing fluid using the nuclear magnetic resonance method to meet the premise of fracturing before production, and then the damage evaluation experiment of the foam drainage agent was carried out. The microscopic damage rates of different pores were determined under a series of foaming concentrations and experimental times. Then, we analyzed the damage-affecting factors of foaming agent solutions and their trends. Afterwards, the microscopic damage mechanism of the foaming agent solution to shale reservoir was obtained [33,34,35,36,37].
According to the NMR results, the T2 spectrum ranges from 0.01 to 10,000.0 ms, with typical bimodal characteristics of shale formations. Theoretically, the transverse relaxation time T2 is linearly proportional to the pore radius RC. Pore types are classified according to the T2 values of some authors, that is, pores are divided into three categories: small, medium, and large, with T2 ranges of 0–10 ms, 10–100 ms, and greater than 100 ms, respectively.
Figure 5 shows T2 spectra of core samples 1, 2, 3, and 4 at different concentrations of foaming agent UT-18.
Figure 6 shows the damage rates variation with increasing foaming concentration for different cores.
Permeability injury rate is:
a = A o A i A o × 100 %
where a is injury rate, %; A0 is the core permeability before the foaming agent solution damages, Ai is the permeability of the core after being damaged by foaming agent solution.
From Figure 7, the overall damage rate curves showed a V-shape and differed for different concentrations. The damage rate was minimized at a concentration range of 0.4–0.6%. With the increase of concentration, the damage rate tends to increase [38,39].
To evaluate and analyze the damage caused by different concentrations of foaming agent solution to the reservoir is to analyze the influence of the relationship between the interfacial tension, caused by the change of foaming agent solution concentration, and the seepage damage of pores with different diameters in the rock. At the same time, there will also be an optimal interfacial tension to minimize the spontaneous imbibition damage of shale. The influence of interfacial tension on spontaneous imbibition includes imbibition force and flow resistance. The increase of interfacial tension will increase capillary force and improve imbibition force. However, if the interfacial tension increases, it will also become the seepage resistance due to the change of pore size and liquid deformation. Similarly, the greater the interfacial tension is, the greater the adhesion work is [40].
From Figure 7a in minor pores, the shale damage rate remained at a minimum level at a concentration range of 0.4–0.6%. The damage rate was inconsistent with the overall damage rate, indicating that minor pores took up the majority of pore types. The capillary pressures of minor pores were relatively large which caused high seepage velocity. This cut-off of fluid flow in macro pores caused residual fluids. The larger the interfacial tension was, the more volume of residual fluids. Then, the fluid flow speed decreased caused by the Jamin effect from the residual fluids. In this way, damage was accumulated.
For medium and macro pores in Figure 7b,c, the damage rates were close to the overall damage rates. The absence in damage was confirmed at some ranges of concentrations, where the phenomenon of permeability acceleration was determined. This could result from the displacement of fluids in macro pores to minor pores by capillary pressures. The response from different pore sizes indicated that interfacial tension played a greater role in medium and macro pores than that in minor pores [41].
Under the optimal concentration of foaming agent solutions, the influence of soaking time on reservoir damage was studied on multiple cores. The T2 spectra are shown in Figure 8.
Figure 9 shows the damage rates for different rock cores with increasing times. The overall damage rate increased but later decreased. At the time of 72 h, all samples reached saturation imbibition except core 4.
Figure 10 shows the damage rates of different pore sizes. For minor pores, initially, it significantly increased and then remained constant at 36 h. For medium pores, it increased slower than in the minor pores and remained constant at 48 h. For macro pores, the damage rate slightly increased over a relatively long period. For cores 3 and 4, significant increases were found for the residual time. The damage rate trend of macro pores was between that of minor and medium pores [42,43].

5. Conclusions

(1)
The components of the local shale were determined to be quartz, carbonate, and feldspar by a descending content sequence. Clay minerals primarily included illite, chlorite, kaolinite, and illite-smectite interlayer, where illite took up the largest portion. The damage to the shale reservoir was possibly caused by the high content of clays. Nitrogen adsorption tests on multiple cores determined the BET-specific surface areas of 1.81~11.43 m2/g with a mean of 5.22 m2/g. The total pore volume of BJH ranged from 0.0095 to 0.03 mL/g with a mean of 0.0203 mL/g, and an average pore diameter range of 9.79~18.87 nm with a mean of 14.81 nm. The contact angle was between 6.57 and 36.12 degrees. This confirmed the wettability of the shale as primarily hydrophilic. The foaming agent increased the contact angle of fluids and decreased the capillary pressure.
(2)
Foaming agents were selected by a primary screening and based on temperature, pressure, salinity, surface tension, and liquid-carrying capacity. We selected the two most suitable agents, i.e., HY-3K and UT-18. They could adapt a temperature of 150 °C, a pressure of 12 MPa, and a salinity of 200,000 mg/L or more.
(3)
The shale damage rate was measured to be 26.8–45% from sensitivity tests under different foaming concentrations. The damage rate curves generally showed a V-shape, where the minimum damage was in the concentration range of 0.4–0.5%.
(4)
All samples were soaked with slick water and later applied to damage tests with foaming agents. This conformed to the practical fracturing operation. A typical double-peak characteristic of shale was determined in the T2 spectra. The pore dimensions were confirmed to be in a nanometer order.
(5)
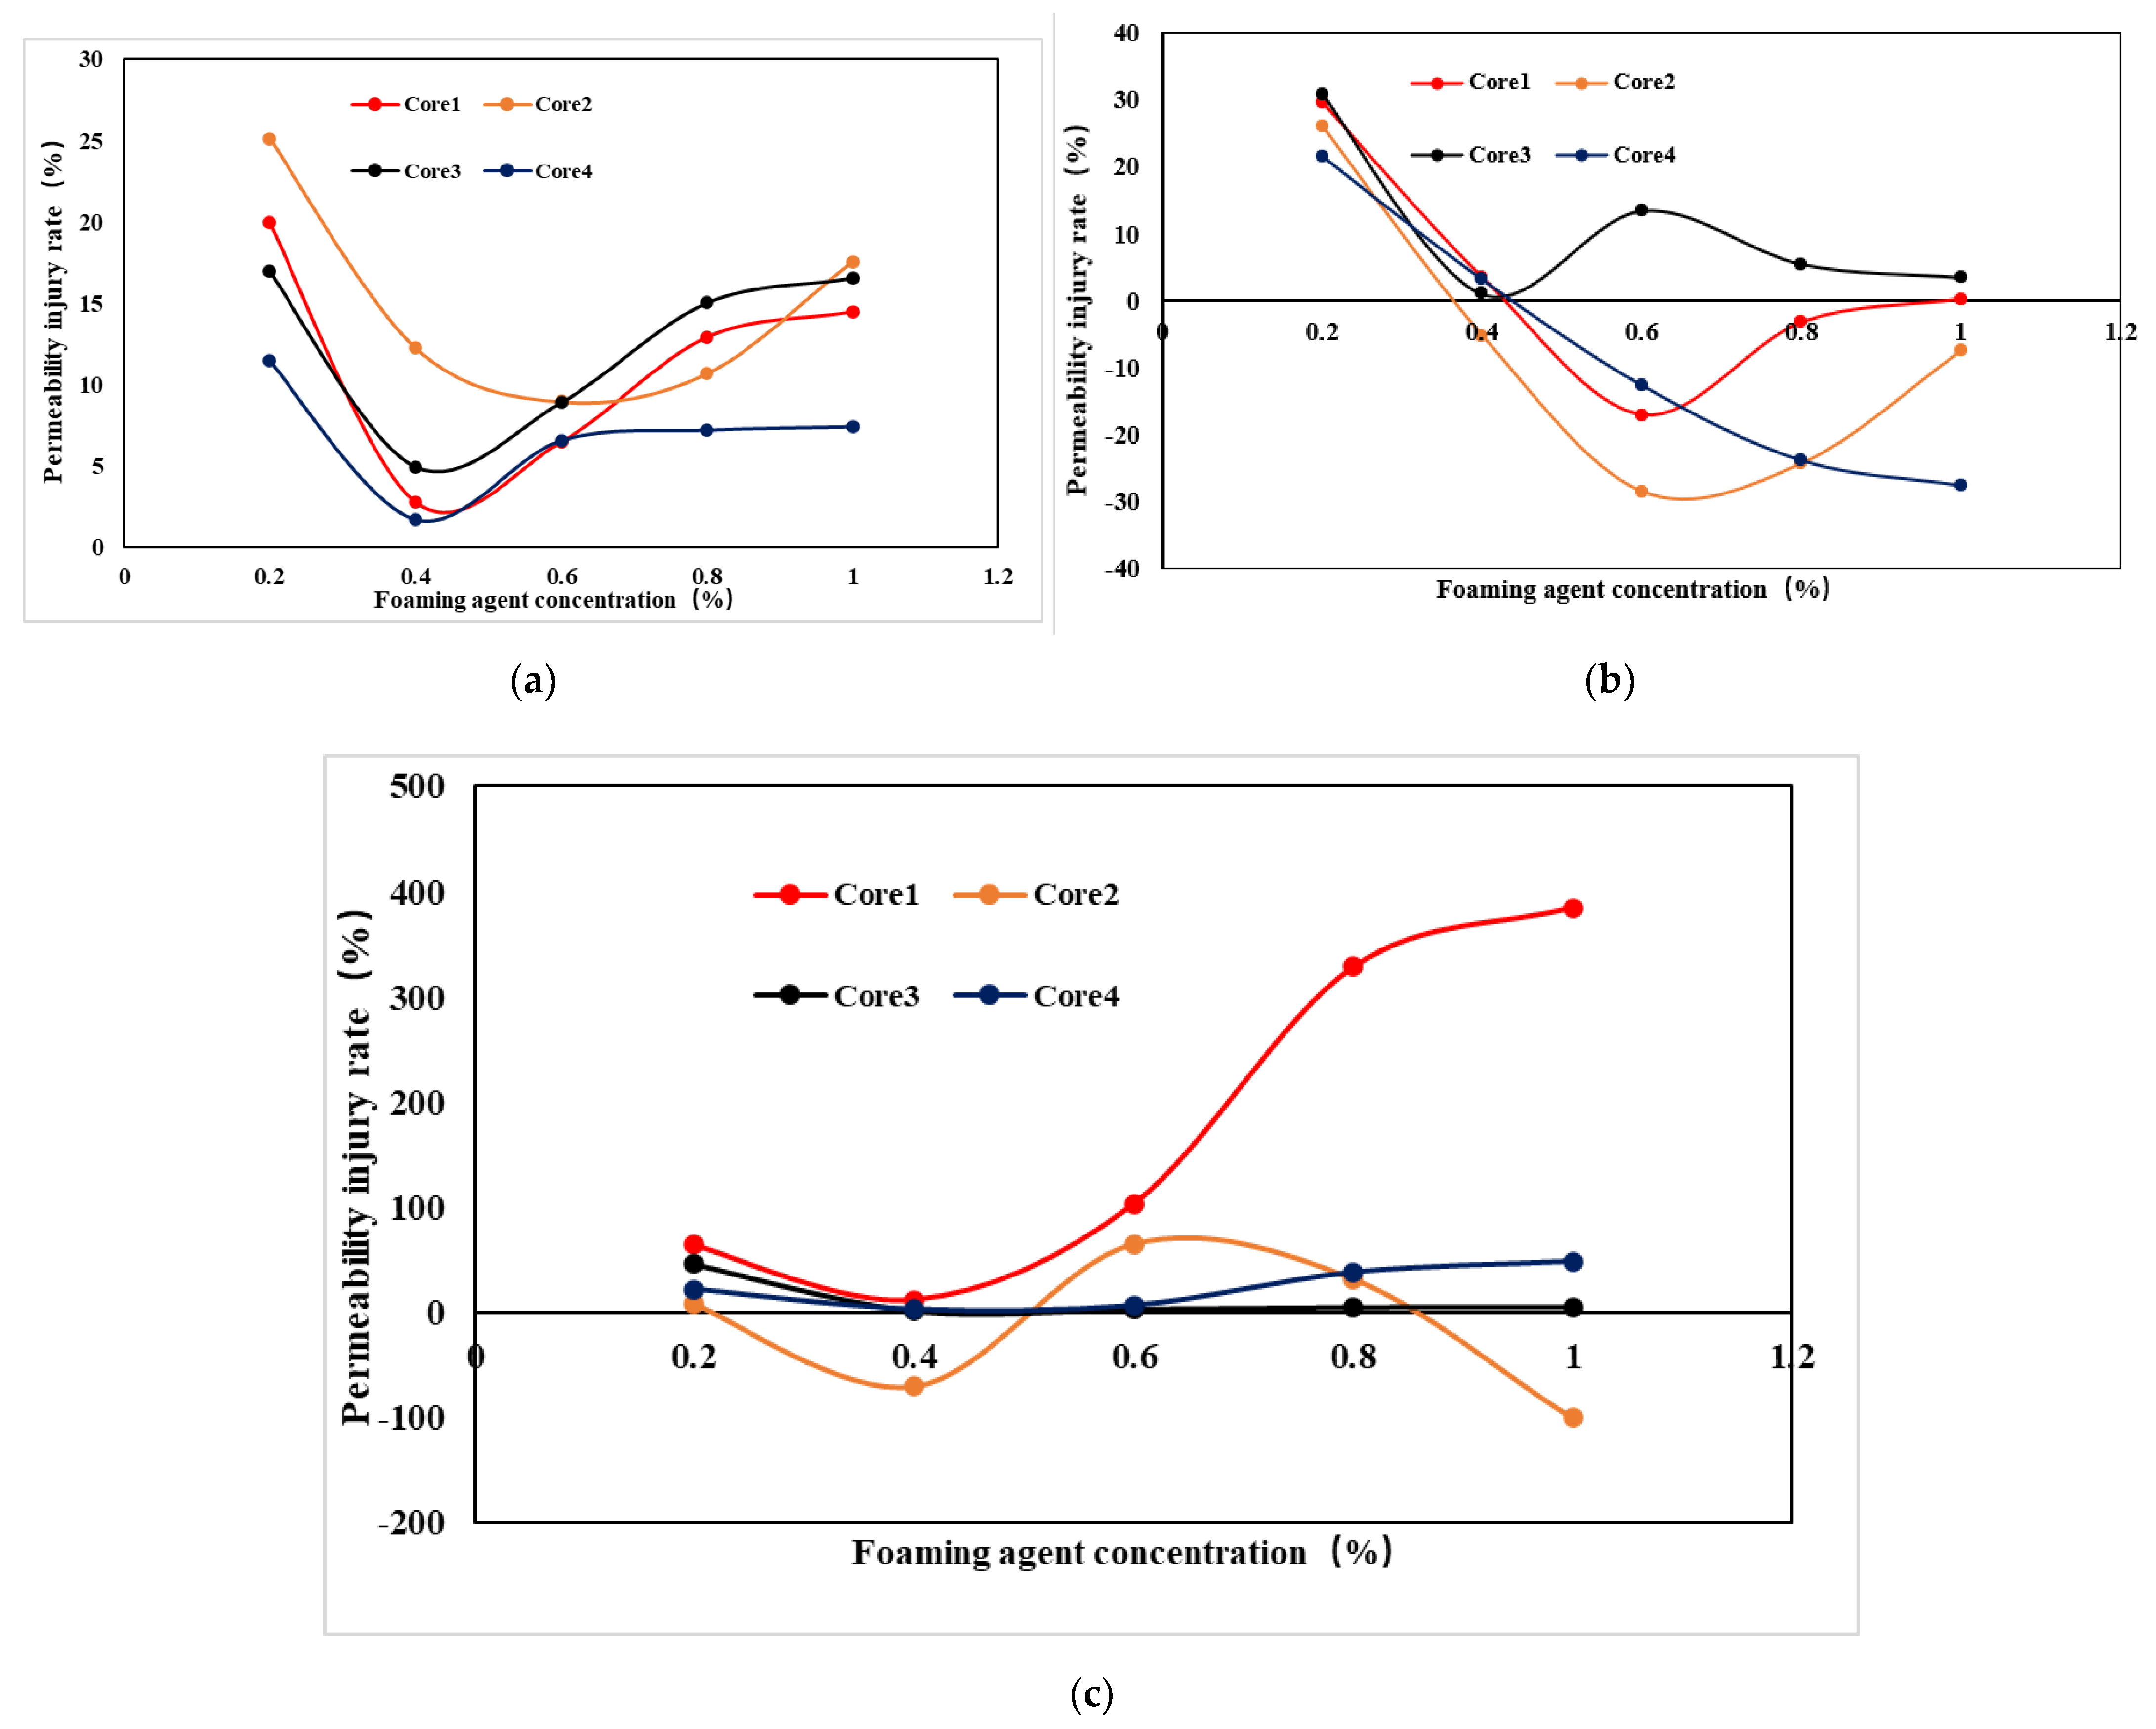
Measurements of overall damage rate were conducted under different foaming concentrations. A minimum shale damage rate was determined at the concentration range of 0.4–0.6%. The effects of foaming solutions on damage were studied by investigating the damage in spontaneous imbibition, which was influenced by interfacial tension for different pores. An optimal interfacial tension was determined to reach the minimized damage in spontaneous imbibition. Minor pores were the major pore type because their damage rate was consistent with the total damage rate. For medium and macro pores, the damage rates were close to the overall damage rates. An absence in damage was confirmed at some concentration ranges, where permeability acceleration was found.
(6)
The damage rate gradually increased as the soaking time increased. Initially, it increased significantly and then remained constant for the residual experimental time. The damage rates remained constant at 72 h, 48 h, and 36 h for macro, medium, and minor pores, respectively. For macro pores, the damage rate gradually increased throughout the experiment.

Author Contributions

Data curation, J.C. and K.Z.; Formal analysis, L.D., J.C. and Y.F.; Funding acquisition, L.D.; Investigation, N.L. and R.W.; Project administration, L.D.; Resources, J.C.; Software, J.B.; Supervision, L.D. All authors have read and agreed to the published version of the manuscript.

Funding

This research was funded by National Natural Science Foundation of China, grant number 52074221, 52074224 and Open Fund of Key Laboratory of Ministry of Education for Unconventional Oil and Gas Development and Special Funds for Basic Scientific Research Business Expenses of Central Universities, grant number 19CX05005A-203. Innovation Capability Support Program of Shaanxi, grant number 2022KJXX-63. Scientific Research Key Program Funded by Shaanxi Provincial Education Department, grant number 21JY036.

Institutional Review Board Statement

Not applicable.

Informed Consent Statement

Not applicable.

Data Availability Statement

Not applicable.

Conflicts of Interest

The authors declare no conflict of interest.

References

  1. Chen, M.Y. Characteristics and Evaluation of Shale Reservoir in Shanxi Formation in Yan’an Area. Master’s Thesis, Xi’an Shiyou University, Xi’an, China, 2020. [Google Scholar]
  2. Shao, Z.B. Study on the Combination of Low-Harm Surfactants in Shale Reservoir and Its Action Mechanism. Master’s Thesis, Chengdu University of Technology, Chengdu, China, 2016. [Google Scholar]
  3. Amaefule, J.O.; Ajufo, A.; Peterson, E.; Durst, K. Understanding formation damage processes: An essential ingredient for improved measurement and interpretation of relative permeability data. In Proceedings of the SPE Production Operations Symposium, Oklahoma City, OK, USA, 8–10 March 1987; OnePetro: Richardson, TX, USA, 1987. [Google Scholar]
  4. Gdanski, R.D.; Weaver, J.D.; Slabaugh, B.F.; Walters, H.G.; Parker, M.A. Fracture face damage–it matters. In Proceedings of the SPE European Formation Damage Conference, Sheveningen, The Netherlands, 25–27 May 2005; OnePetro: Richardson, TX, USA, 2005. [Google Scholar]
  5. Civan, F. Analyses of processes, mechanisms, and preventive measures of shale-gas reservoir fluid, completion, and formation damage. In Proceedings of the SPE International Symposium and Exhibition on Formation Damage Control, Lafayette, LA, USA, 26–28 February 2014; OnePetro: Richardson, TX, USA, 2014. [Google Scholar]
  6. Zheng, L.H.; Wei, P.F. Review to shale gas formation damage for 30 years. Oil Drill. Prod. Technol. 2013, 35, 1–16. [Google Scholar]
  7. Lu, Z.; Li, Q.; Li, J.; Song, F.; Liu, H. Research development on formation damage induced by shale drilling. Chem. Eng. Oil Gas/Shi You Yu Tian Ran Qi Hua Gong 2013, 42, 49–52. [Google Scholar]
  8. Zhang, F. Study on Low-Damage Fracturing Fluid System of Yanchang Luxiangchang 7 Shale Gas Reservoir. Ph.D. Thesis, China University of Geosciences, Wuhan, China, 2017. [Google Scholar]
  9. Liu, X.M.; Feng, S.J. Experimental study on permeability change law of shale cores before and after soaking in active water. Contemp. Chem. Eng. 2017, 46, 622–624. [Google Scholar]
  10. Wang, R.; Wu, X.; Yun, M.A.; Zhang, N. Status-quo of Study on the Methods of Evaluating Formation Damage by Shale Gas Reservoir Working Fluids. Drill. Fluid Complet. Fluid 2019, 36, 672–678. [Google Scholar]
  11. Wang, R.; Wu, X.M.; Ma, Y.; Bai, H.T. Review of Working Fluid Damage Mechanism for Shale Gas Reservoir. Sci. Technol. Eng. 2020, 20, 867–873. [Google Scholar]
  12. Yi, M.H.; Jiang, Z.G.; Zeng, J.; Nie, J. Fracturing fluid damage experiment of shale reservoirs in Wufeng-Longmaxi Formation in Southeast Chongqing. West. Prospect. Proj. 2020, 32, 55–58. [Google Scholar]
  13. Xiong, J.; Chen, S.S.; Liang, L.X.; Xiao, Y.Y.; Chen, L.; Yang, L.P. Infiltration characteristics and influencing factors of Longmaxi Formation shale. J. Guilin Univ. Technol. 2020, 40, 688–694. [Google Scholar]
  14. Ke, C.Y.; Wei, Y.L.; Zhang, Q.Z.; Zhang, S.L. Research progress of water lock damage and water lock release technology in low permeability gas reservoirs. Appl. Chem. Eng. 2021, 50, 1613–1617. [Google Scholar]
  15. Xu, F. Considering the spontaneous imbibition characteristics of fracturing fluid in shale gas reservoir under the action of chemical osmotic pressure. Lithol. Reserv. 2021, 33, 145–152. [Google Scholar]
  16. Xu, D.J.; Zhang, B.H.; Li, Z.H.; Xue, J.S.; Chen, J.F. Study on the law of imbibition damage in the whole process of tight gas fracturing fluid and reservoir. J. Yangtze Univ. (Nat. Sci. Ed.) 2022, 19, 79–85. [Google Scholar]
  17. Wang, X.P.; Mou, C.; Ge, X.; Chen, X.; Zhou, K.; Wang, Q.; Liang, W. Mineral component characteristics and evaluation of black rock series of Longmaxi Formation in Southern Sichuan and its periphery. Acta Pet. Sin. 2015, 36, 150–162. [Google Scholar]
  18. Jin, Y.X. Study on the Characteristics of Longmaxi Shale Reservoirs in the Lower Silurian of Southeastern Sichuan Area. Master’s Thesis, School of Geosciences China University of Petroleum (East China), Shandong, China, 2017. [Google Scholar]
  19. Guan, X.X. Study of the Mechanism and Control Methods of Formation Damage for Longmaxi Shale Formation in Eastern Sichuan. Ph.D. Thesis, Chengdu University of Technology, Chengdu, China, 2016. [Google Scholar]
  20. Gao, H.; He, M.; Zhao, P.; Dou, L.; Wang, C. Comparison of geological characteristics of Chang 7 shale oil in Ordos Basin and typical shale oil in North America. Pet. Geol. Exp. 2018, 40, 133–140. [Google Scholar]
  21. Zhang, M.Q.; Zou, C.N.; Guan, P.; Dong, D.Z.; Sun, S.S.; Shi, Z.S.; Li, Z.X.; Feng, Z.Q.; Li, L.M.C.D. Pore throat characteristics of deep shale reservoirs in Sichuan Basin—Taking Longmaxi Formation of Well 201 in Zigong as an example. Nat. Gas Geosci. 2019, 30, 1349–1361. [Google Scholar]
  22. Liu, Y.X.; Wang, K.L.; Hu, P.Q.; Li, W.M. Discussion on the determination method of mineral components in shale. Nat. Gas Geosci. 2015, 26, 1737–1743. [Google Scholar]
  23. Lai, F.; Leng, H.; Gong, D. Evaluation of shale brittleness based on mineral compositions and elastic mechanics parameters. Fault-Block Oil Gas Field 2019, 26, 168–171. [Google Scholar]
  24. Liu, X.J.; Xiong, J.; Liang, L.X.; Luo, C.; Zhang, A.D. Wettability analysis and influence discussion of Longmaxi shale in southern Sichuan. Nat. Gas Geosci. 2014, 25, 1644–1652. [Google Scholar]
  25. Fan, Q.Y. Effect of wettability and pore structure on adsorption characteristics of shale reservoirs. J. Chongqing Univ. Sci. Technol. (Nat. Sci. Ed.) 2016, 18, 10–13. [Google Scholar]
  26. Ye, H.; Ning, Z.; Wang, Q.; Cheng, Z.; Huang, L.; Mu, D. Spontaneous imbibition experiment and wettability of shale reservoir. Fault-Block Oil Gas Field 2019, 26, 84–87. [Google Scholar]
  27. He, J.G.; Kang, Y.L.; You, L.J. Influence of fluid damage on shale reservoir stress sensitivity. Nat. Gas Geosci. 2011, 22, 915–919. (In Chinese) [Google Scholar]
  28. Huang, W.; Qiu, Z.; Yue, X. Damage mechanism and water-based drilling fluid protection technology for shale gas reservoir. J. China Univ. Pet. (Ed. Nat. Sci.) 2014, 38, 99–105. [Google Scholar]
  29. Li, X.C.; Yan, X.P.; Kang, Y.L. Investigation of drill-in fluids damage and its impact on wellbore stability in Longmaxi shale reservoir. J. Pet. Sci. Eng. 2017, 159, 702–709. [Google Scholar] [CrossRef]
  30. Zhang, J.; Nan, X. The analyses on potential damages and the discussions on protection technologies in shale gas reservoir drilling. Petrochem. Ind. Appl. 2015, 34, 1–4. [Google Scholar]
  31. Jiang, Z.X.; Zhang, W.; Liang, C.; Wang, Y.; Liu, H.; Chen, X. Basic characteristics and evaluation of shale oil reservoirs. Pet. Res. 2016, 1, 149–163. [Google Scholar] [CrossRef]
  32. Liu, X.W.; Guo, Z.Q.; Liu, C.; Liu, Y.W. Anisotropy rock physics model for the Longmaxi shale gas reservoir, Sichuan Basin, China. Appl. Geophys. 2017, 14, 21–30. [Google Scholar] [CrossRef]
  33. Yuan, J.H. Promoting Environmental Protection While Boosting Shale Gas Development in China. In SPE Unconventional Resources Conference; Alberta: Edmonton, AB, Canada, 2013. [Google Scholar]
  34. Son, A.J.; Neal, V.S.; Garvey, C.M. Shale and Salt Stabilizing Drilling Fluid. U.S. Patent No. 4,526,693, 2 July 1985. [Google Scholar]
  35. Tianshou, M.A.; Chen, P. Study of meso-damage characteristics of shale hydration based on CT scanning technology. Pet. Explor. Dev. 2014, 41, 249–256. [Google Scholar]
  36. Murphy, R.P.; Frank, O.J., Jr. Minimizing Clay and Shale Damage in A Log-Inject-Log Procedure. U.S. Patent No. 4,281,712, 4 August 1981. [Google Scholar]
  37. Lauzon, R.V. Colloid science resolves shale, formation-damage problems. Oil Gas J. 1984, 82. Available online: https://www.osti.gov/biblio/6425712 (accessed on 4 August 2022).
  38. Kang, Y.L.; Chen, Q.; You, L.; Wang, Q.; Yang, B.; Yu, Y. Laboratory investigation of water phase trapping damage in shale gas reservoir—A case of Longmaxi shale in the eastern Sichuan Basin. Pet. Geol. Recovery Effic. 2014, 21, 87–91. [Google Scholar]
  39. Sun, W.; Zuo, Y.; Wu, Z.; Xu, Y. Experimental study on seepage-damage evolution of shale. China Min. Mag. 2017, 26, 142–145. [Google Scholar]
  40. Liu, K.; Zakharova, N.; Adeyilola, A.; Zeng, L. Experimental Study on the Pore Shape Damage of Shale Samples during the Crushing Process. Energy Fuels 2021, 35, 2183–2191. [Google Scholar] [CrossRef]
  41. Dou, L.; Xiao, Y.; Gao, H.; Wang, R.; Liu, C.; Sun, H. The study of enhanced displacement efficiency in tight sandstone from the combination of spontaneous and dynamic imbibition. J. Pet. Sci. Eng. 2021, 199, 103327. [Google Scholar] [CrossRef]
  42. Dou, L.; Shu, G.; Gao, H.; Bao, J.; Wang, R. Study on the Effect of High-Temperature Heat Treatment on the Microscopic Pore Structure and Mechanical Properties of Tight Sandstone. Geofluids 2021, 2021, 8886186. [Google Scholar] [CrossRef]
  43. Dou, L.; Yang, M.; Gao, H.; Jiang, D.; Liu, C. Characterization of the Dynamic Imbibition Displacement Mechanism in Tight Sandstone Reservoirs Using the NMR Technique. Geofluids 2020, 2020, 8880545. [Google Scholar] [CrossRef]
Figure 1. Nitrogen adsorption curves for core samples. (a) Core sample 1; (b) Core sample 2.
Energies 15 05768 g001
Figure 2. Pictures taken during contact angle measurements for core samples 1 (a) and 2 (b) using 0.9% NaCl.
Energies 15 05768 g002
Figure 3. Permeability damage rate curves of five cores with different foaming agent concentrations.
Energies 15 05768 g003
Figure 4. Contact angle for core 3 before (a) and after (b) exposure to the foaming agent solution prepared using agent HY-3K (mass concentration 0.4%).
Energies 15 05768 g004
Figure 5. T2 spectrums of four rock samples under different concentrations of foaming agent solutions. (a) Rock sample 1; (b) Rock sample 2; (c) Rock sample 3; (d) Rock sample 4.
Energies 15 05768 g005
Figure 6. Permeability damage rate changes with the increase of foam concentration.
Energies 15 05768 g006
Figure 7. Damage rates of various pores with increasing foaming concentrations. (a) Minor pore; (b) Medium pore; (c) Macro pore.
Energies 15 05768 g007
Figure 8. T2 spectra of different rock samples under different soaking periods. (a) Rock sample 1; (b) Rock sample 2; (c) Rock sample 3; (d) Rock sample 4.
Energies 15 05768 g008
Figure 9. Overall damage rates of different rock samples under different action times of foaming agent solutions.
Energies 15 05768 g009
Figure 10. Damage rate curves of varying pore sizes of rock samples under different action times. (a) Minor pore; (b) Medium pore; (c) Macro pore.
Energies 15 05768 g010
Table 1. Mineral composition of the studied rock samples defined using X-ray diffraction.
CoreDepthQuartz/Mass%Potassium Feldspar/Mass%Plagioclase/Mass%Calcite/Mass%Dolomite/Mass%Pyrite/Mass%Clay Mineral/Mass%
Core sample 1727 m20.12.45.510.217.53.740.6
Core sample 2729 m36.7 11.87.417.015.911.2
Core sample 3731 m41.0 5.3 16.0 37.7
Core sample 4732 m34.8 11.23.617.02.431.0
Core sample 5733 m50.34.613.85.07.12.616.6
Core sample 6734 m40.64.112.52.28.84.627.2
Core sample 7735 m27.8 9.8 10.95.346.2
Core sample 8736 m37.93.013.46.6 39.1
Core sample 9746 m22.23.98.99.74.64.246.5
Core sample 10748 m35.36.016.6 15.13.423.6
Table 2. Pore characteristics of the studied rock samples obtained using isothermal nitrogen adsorption.
CoresDepthBET Specific Surface/m2/gBJH Total Pore Volume/mL/gAverage Hole Diameter/nm
Core sample 1727 m4.16490.02116917.6092
Core sample 2729 m2.70280.01298317.3485
Core sample 3
Core sample 4
731 m11.43100.0277649.7878
6.82630.03003215.2298
Core sample 5
Core sample 6
732 m6.32110.02428514.3835
4.39140.01998215.8772
Core sample 7733 m7.68150.02904013.4212
Core sample 8
Core sample 9
734 m8.46090.02143310.1659
5.22950.02277815.4011
Core sample 10735 m4.07630.01861815.3115
Core sample 1
Core sample 2
736 m3.88550.01588614.3734
5.23430.02056614.2955
Core sample 3746 m1.81110.00946018.8684
Core sample 4748 m4.78370.02160015.9722
2.69870.01235215.9204
Table 3. Results of the wettability tests for the studied rock samples.
Core NumberExperimental ConditionExperimental Temperature/°CExperimental Pressure/MPaStabilization Time/MinContact Angle (°)Wettability Type
No. 1525,000 mg/L 0.9% NaCl60.018.010.06.57hydrophilic
No. 1660.018.010.036.12hydrophilic
Table 4. Properties of the selected foaming agents.
Name of the Agent HY-3KUT-18
Item
AppearanceLight yellow liquidyellow liquid
Density1.071.05
Foaming agent concentration0.4%0.4%
Water surface tension at surfactant
concentration of 0.4% (mN/m)
21.7~26.629.5~31.2
Form half-life time (s)610570
Foam composite index (mL·s)1,140,7001,159,510
Liquid carrying capacity (mL/min)9.129.00
The effect on that stability of CO2 foam discharge agentNo significant impactNo significant impact
Table 5. Damage test of different concentrations of foaming agents to core permeability.
Core NumberSurfactant%Initial Permeability to
N2/μD
Permeability Reduction after Solution Displacement by Surfactant,% (HY-3K)Permeability Reduction after Solution Displacement by Surfactant,% (UT-18)
10.023.470.0275.81
0.217.643.1645.58
0.323.027.5629.13
0.437.625.8228.02
0.529.226.8028.15
20.015.465.3071.25
0.216.638.1641.32
0.321.222.5624.05
0.419.620.8224.91
0.517.521.8024.12
30.013.77178.50
0.215.644.1648.51
0.321.128.5632.61
0.414.626.8231.53
0.513.227.8031.64
40.013.464.0370.32
0.215.137.1640.35
0.313.021.5624.44
0.414.819.8223.36
0.512.320.8023.48
50.023.461.7068.30
0.217.634.8638.30
0.323.019.2722.40
0.437.617.5321.30
0.529.218.5121.40
Publisher’s Note: MDPI stays neutral with regard to jurisdictional claims in published maps and institutional affiliations.

