Article

Numerical Analysis on Impact of Thickness of PEM and GDL with and without MPL on Coupling Phenomena in PEFC Operated at Higher Temperature Such as 363 K and 373 K

1
Division of Mechanical Engineering, Graduate School of Engineering, Mie University, 1577 Kurimamachiya-cho, Tsu 514-8507, Mie, Japan
2
School of Mechanical Engineering, The University of Adelaide, Adelaide, SA 5005, Australia
*
Author to whom correspondence should be addressed.
Energies 2022, 15(16), 5936; https://doi.org/10.3390/en15165936
Submission received: 19 July 2022 / Revised: 5 August 2022 / Accepted: 14 August 2022 / Published: 16 August 2022
(This article belongs to the Special Issue Advances in Proton Exchange Membrane Fuel Cell)

Abstract

:
The aim of this study is to clarify the impact of the thickness of a gas diffusion layer (GDL) and a micro porous layer (MPL) on the distributions of gas, H2O, and current density in a polymer electrolyte fuel cell (PEFC) which is operated at 363 K and 373 K and with various thicknesses of polymer electrolyte membrane (PEM) as well as a relative humidity (RH) of supply gas. These investigations are carried out by numerical simulation using the 3D model with COMSOL Multiphysics. In the case of Nafion 115, which is the thicker PEM, the change in the molar concentration of H2O from the inlet to the outlet with MPL is larger than that without MPL irrespective of the thickness of GDL, Tini and RH condition. In the case of Nafion NRE-212, which is the thinner PEM, the change in the molar concentration of H2O from the inlet to the outlet is larger with MPL than that without MPL in the case of TGP-H-060 (the thicker commercial GDL), while that is smaller with MPL than that without MPL in the case of TGP-H-030 (the thinner commercial GDL). These results exhibit the same tendency as the results of the numerical simulation on the current density.

1. Introduction

In Japan, it is required that a polymer electrolyte fuel cell (PEFC) is operated at 363 K and 373 K for the application of stationary and mobility usage, respectively, for the duration from 2020 to 2025 according to the Japanese New Energy and Industry Technology Development Organization (NEDO) road map 2017 [1]. However, the PEFC using Nafion membrane as a polymer electrolyte membrane (PEM) is generally operated below 353 K [2,3,4]. There are several merits when the PEFC system is operated at higher temperatures, such as 363 K and 373 K, including: (i) improvement of the kinetics of electrode, (ii) small size effect of the cooling system due to the increase in the temperature difference between the PEFC stack and the coolant, and (iii) endurance improvement to CO which includes the H2 reformed from hydrocarbon [5]. However, the following demerits have to be overcome related to the operation of PEFC at a higher temperature: (i) deterioration of PEM; (ii) electrode erosion; (iii) non-uniform distribution of gases flow, pressure, temperature, voltage, and current in PEFC [6]. Moreover, it is thought that the uniform distributions of gas, H2O, and current density would be required to obtain the higher power generation performance as well as extend the operation time when operating at higher temperatures [6,7].
We can classify the recent research on high temperature PEFC (HTPEFC) into the target component of PEFC.
As to PEM, some research focuses on new materials which are available for high temperature operation. Phosphoric acid-doped polybenzimidazole (PA-PBI) membranes [8] and bulky basic group grafted ether-free poly (terphenyl piperidinium) membranes [9] have been reported. However, the stability has not been confirmed.
Regarding catalyst layer, the catalyst layer with different microstructures and Pt, which was blade-coated, was prepared by mixing Pt/C, PTFE solution, and ethanol-H2O solution [10]. Although the electrode with less cracks and optimum pore structure shows the better cell performance, the effect of microstructures of catalyst layers on cell performance decreases with the increase in Pt loading.
As to micro porous layer (MPL), the numerical analysis using a 3D model has been conducted to clarify the impact of MPL on in-plane temperature distribution in PEM and cathode GDL and through-plane temperature distribution [11]. In addition, it has also clarified the impact of MPL on through-plane distributions of H2, O2 and H2O mass fraction. According to this reference, the MPL reduces the local temperature and helps to obtain a more uniform in-plane temperature distribution, and thus to increase the proton conductivity of PEM. In addition, the polarization curve without MPL has shown the superiority to that with MPL, which indicates that MPL is not necessary for high-temperature operation. However, the thickness of PEM and GDL was fixed. The impact of MPL changing the thickness of PEM and GDL has not been investigated in this reference. In addition, the impact of MPL changing the relative humidity (RH) of supply gas has not been investigated in this reference, either. The other study developing MPL experimentally has reported that the reticulated polyaniline nanowires as a cathode MPL improves the power generation performance at 443 K [12], improving the higher power density by 36% compared with that using a conventional MPL. However, the effect of the developed MPL on mass and heat transfer phenomena in the cell as well as the effect of thickness of GDL on the performance of MPL has not been investigated.
Regarding GDL, the structure such as porosity distribution and thickness [13,14] has been investigated numerically. The impact of them on distributions of O2, H2, and H2O in the cell as well as the power generation performance has been investigated. When the porosity in GDL is uniform, the O2 concentration decreases, and the H2O concentration increases gradually along the gas channel [13]. The distribution uniformity of H2 and O2 in the catalyst layer is more uniform with the increase in the thickness of GDL [14]. It has been revealed that the optimum thickness of GDL at anode and cathode is 100 μm and 150 μm, respectively, from the viewpoint of improving the power generation performance. However, the thickness of PEM was fixed in these references. In addition, the impact of MPL and the RH of supply gas changing the thickness of GDL has not been investigated yet.
The other research on GDL has conducted the numerical simulation to clarify the distributions of O2, H2O, and current density in MPL and GDL [15,16]. Xu et al. [15] has also investigated the temperature distribution changing the RH. In the case of low RH conditions, reducing water saturation on the interface between catalyst layer and GDL at cathode provides better power generation performance due to the higher O2 mole fraction at the reaction sites. When the operation temperature increases from 323.15 K to 363.15 K, the capillary-driven flow is the dominant factor for the water transfer in MPL. Zhang et al. [16] has also investigated the impact of assembly force on the distributions of O2, H2O and current density. The porosity distribution of GDL is influenced by the assembly force. High assembly force leads to wider in-plane distributions of O2 and H2O concentration in GDL, which provides the wider in-plane distribution of current. However, the impact of MPL and the RH of supply gas changing the thickness of GDL has not been investigated yet.
The impact of the thickness of PEM, GDL and MPL on the temperature distribution on separator back of PEFC operated at 363 K and 373 K has been investigated experimentally by the authors [17,18,19]. In addition, the authors have reported that the impact of the thickness of PEM, GDL and MPL on the temperature distribution on the interface between PEM and the catalyst layer at cathode of PEFC operated at 363 K and 373 K which was evaluated by the 1D heat transfer model [20,21,22]. It was concluded that the combination of thinner PEM and thinner GDL without MPL provided the highest power generation performance and a uniform temperature distribution. The numerical simulation with the 3D isothermal model on coupling phenomena in a cell of HTPEFC at 363 K and 373 K has also been conducted by the authors [23]. The effect of the thickness of PEM on mass and current density distributions on the interface between PEM and the catalyst layer at anode and cathode has been investigated, indicating the thinner PEM with well-humidified conditions is more desirable to attain a higher power generation and a uniform distribution of current density. However, the impacts of MPL and the thickness of GDL on distributions of gas, H2O, and current density on the interface between PEM and catalyst layer at anode and cathode in PEFC operated at 363 K and 373 K changing the thickness of PEM and the RH of supply gas have not been investigated yet.
Therefore, the aim of this study is to clarify these impacts, which have not been studied so far. This study carries out a numerical simulation using a 3D model with COMSOL Multiphysics composed of multi-physics simulation codes. The thickness of PEM changed from 127 μm and 51 μm, which is simulated for Nafion 115 and Nafion NRE-212, respectively. The thickness of GDL is changed from 190 μm and 110 μm, which is simulated for TGP-H-060 and TGP-H-030, respectively. The operation temperature is changed from 353 K to 373 K. The RH of supply gas at anode of 80%RH and cathode of 80%RH (A80%RH, C80%RH) and that at anode of 40%RH and cathode of 40%RH (A40%RH, C40%RH) is also investigated in both well-humidified conditions and dry conditions, respectively. These simulations are also compared among the conditions with and without MPL.

2. Numerical Simulation Procedure

Governing Equations in 3D Numerical Simulation Model

In this study, a numerical simulation has been conducted using a multi-physics simulation software COMSOL Multiphysics. This software has the simulation code for PEFC composed of the continuity equation, the Brinkman equation for a momentum transfer, the Maxwell–Stefan equation for a diffusion transfer and Butler–Volmer equation for an electrochemical reaction. This simulation code for PEFC has been validated well by many previous studies [24,25,26,27].
At first, the continuity equation which considers the gas species in porous media, e.g., catalyst layer, MPL, and GDL as well as the gas channel is expressed as follows:
t ( ε p ρ ) + · ( ρ u ) = Q m
where εp indicates the porosity (-), ρ indicates the density (kg/m3), u indicates the velocity vector (m/s), Qm indicates the mass source term (kg/(m3·s)), and t indicates the time (s). The Brinkmann equation considering the relationship between the pressure and gas flow velocity, which is solved in porous media, e.g., catalyst layer, MPL, and GDL as well as in the gas channel, is expressed as follows:
ρ ε p ( u t + ( u · ) u ε p )
= p + · [ 1 ε p { μ ( u + ( u ) T ) 2 3 μ ( · u ) I } ] ( κ 1 μ + Q m ε p 2 ) u + F
where p indicates the pressure (Pa), μ indicates the viscosity (Pa·s), I indicates the unit vector (-), κ indicates the permeability (m2), and F indicates the force vector (kg/(m2·s2)), e.g., gravity.
The Maxwell–Stefan equation which considers the mass transfer such as the diffusion, ion transfer, and convection transfer is expressed as follows:
N i = D i C i z i u m , i F C i φ l + C i u = J i + C i u
C i t + · N i = R i , t o t
where Ni indicates the vector molar flow rate on the interface between PEM and electrode (mol/(m2·s)), Di indicates the diffusion coefficient (m2/s), Ci indicates the concentration of ion i (mol/m3), zi indicates the valence of ion (-), um,i indicates the mobility of ion i ((s·mol)/kg), F indicates the Faraday constant (C/mol), φl indicates the electrical potential of liquid [28] (V), J indicates the molar flow rate of the convection transfer (mol/(m·s)), and Ri,tot indicates the reaction rate of species (mol/(m3·s)).
The Butler–Volmer equation calculates the electrochemical reaction as follows:
i = i 0 { exp ( α a F η R T ) exp ( α c F η R T ) }
η = φ s φ l E e q
where i indicates the current density (A/m2), i0 indicates the exchange current density (A/m2), αa indicates the charge transfer coefficient at anode (-), η indicates the activation over-potential [28] (V), R indicates the gas constant (J/(mol·K)), T indicates the temperature (K), αc indicates the charge transfer coefficient at cathode (-), φs indicates the electrical potential of solid [28] (V), Eeq indicates the equilibrium electric potential [28] (V).
The 3D model of single cell of PEFC for the numerical simulation used in this study is the same as the authors’ previous study [24]. This structure follows the commercial single cell used in the experimental studies carried out by the authors [18,19]. The outside of the roof of the gas separator at anode and cathode sides is omitted in this model. The cell has a gas separator with a serpentine flow channel consisting of five gas channels with the width of 1.0 mm and depth of 1.0 mm as well as a width of 1.0 mm. Table 1 lists the geometrical parameters of the 3D model. As to PEM, Nafion 115 and Nafion NRE-212 with a thickness of 127 μm and 51 μm, respectively, have been adopted to investigate the effect of thickness of PEM on the distributions of H2, O2, and H2O concentrations and the current density. In addition, TGP-H-060 and TGP-H-030 with the thickness of 190 μm and 110 μm, respectively, have been adopted to investigate the effect of the thickness of GDL on the distributions of H2, O2, and H2O concentrations and the current density. Table 2 and Table 3 list physical parameters and operation conditions, respectively. The initial operation temperature of cell (Tini) is changed from 353 K to 373 K. As to 353 K, this study has selected it to exhibit the characteristics at a standard operation temperature comparing the characteristics at a higher temperature. The RH of supply gases for A80%RH, C80%RH and A40%RH, C40%RH have been investigated as a well-humidified condition and a dry condition, respectively. The flow rate of supply gas is set at the stoichiometric ratio of 1.5, where the volume flow rate of supply gas at the anode and the cathode is 0.210 NL/min and 0.105 NL/min, respectively. The stoichiometric ratio of 1.0, which indicates the flow rate of supply gas, can be defined by Equation (7).
C H 2 = I n H 2 F
where CH2 indicates the molar flow rate of consumed H2 (mol/s), I indicates the loaded current (A) and nH2 indicates the electrons moles exchanged in the reaction (=2) (-), CH2 indicates the molar flow rate corresponding to the stoichiometric ratio of 1.0. The CO2 indicates the molar flow rate of consumed O2 (mol/s), which is the half of CH2 (which can be defined by Equation (8)).
H2 + 1/2 O2 = H2O
It can be expected that H2, which is produced from a renewable energy via H2O electrolyzer, will be used as a fuel for PEFC in order to realize a zero-CO2-emission society in the near future. When H2 is produced by H2O electrolysis, O2 is also produced as a by-product. This study suggests that not only H2 but also O2 produced from H2O electrolysis can be used for PEFC. This study also proposes that the total system consisting of renewable energy, H2O electrolyzer, and PEFC system can be operated using H2 and O2 produced by the H2O electrolyzer. Therefore, in this study, O2 is adopted as the cathode gas for the numerical simulation. If O2 was adopted as a cathode gas, a higher current density on the interface between PEM and the catalyst layer could be expected, especially under the rib, compared with the case using air [29].
The assumptions set in this study are the same as the authors’ previous study [24]. When PEFC is operated at higher temperatures, such as 363 K and 373 K, it is easy to dehydrate PEM and the catalyst layer due to the exponential increase in the saturation of H2O vapor with temperature [42]. The performance of O2 reduction reaction occurring at the cathode is influenced by the hydration of ionomer in the catalyst layer using the H2O [41]. Therefore, this study focuses on distributions of O2, H2O, and current density on the interface between PEM and catalyst layer at cathode which indicates the performance of O2 reduction reaction and shows the results.

3. Results and Discussion

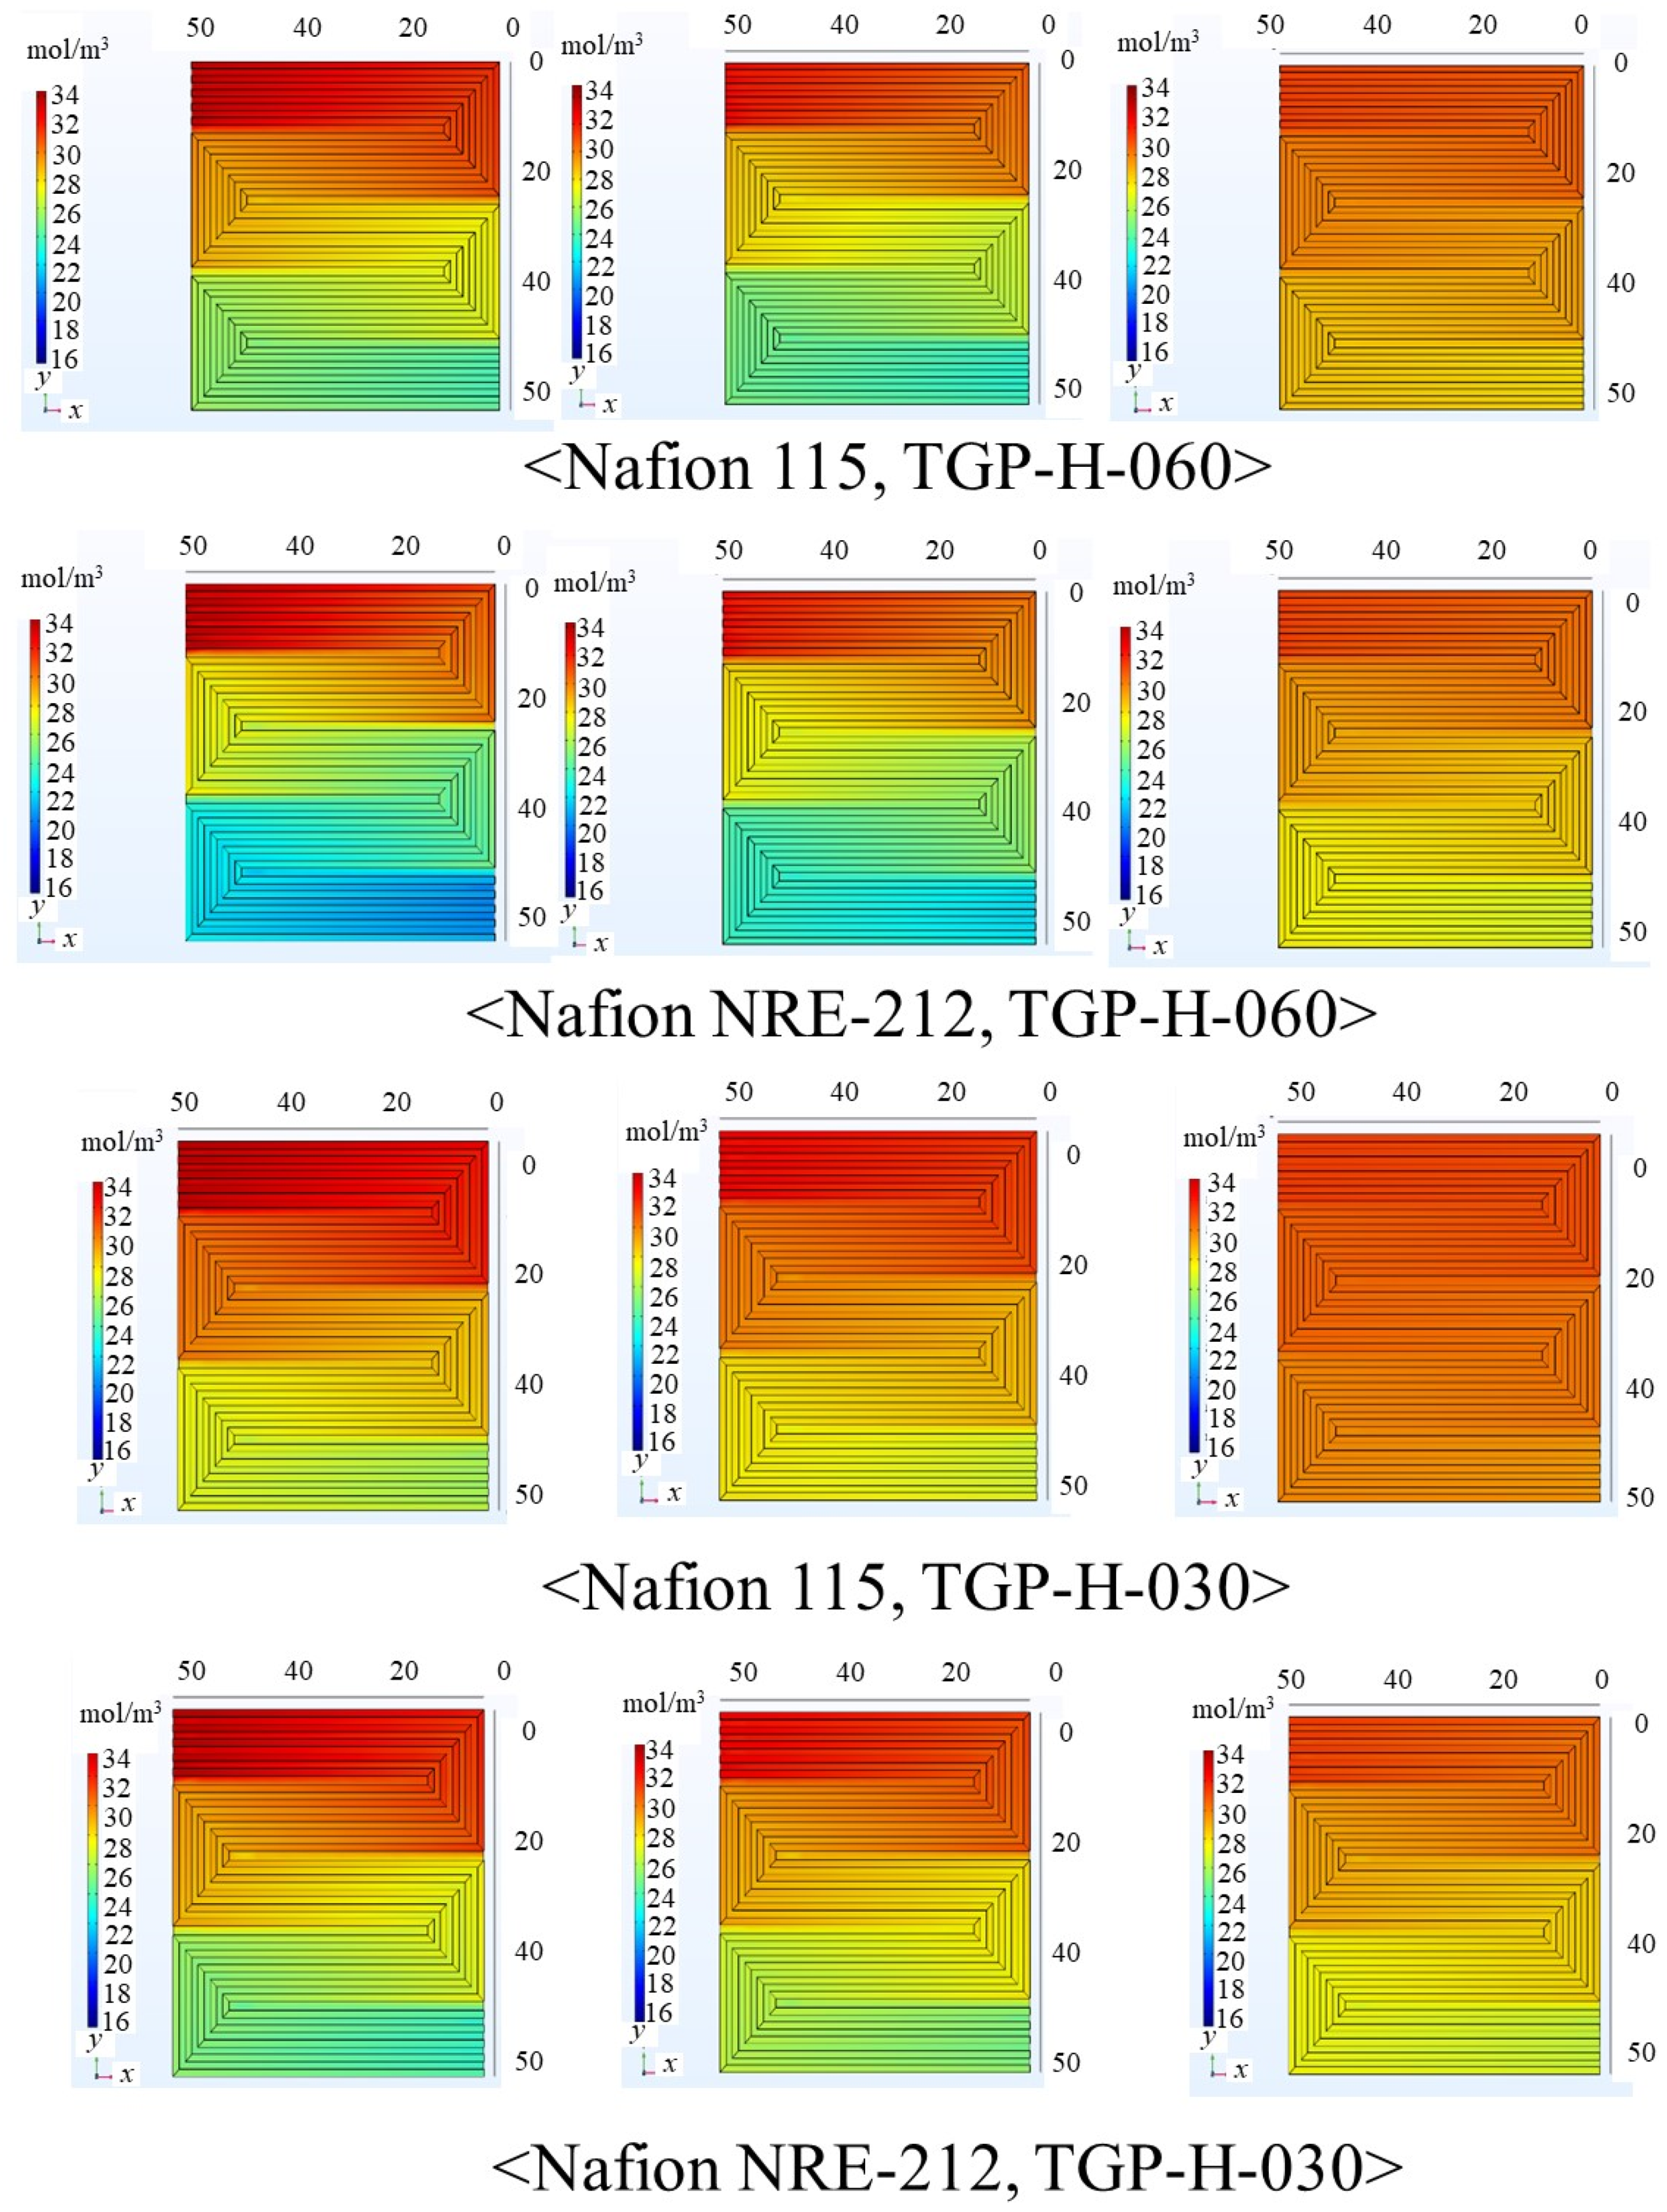
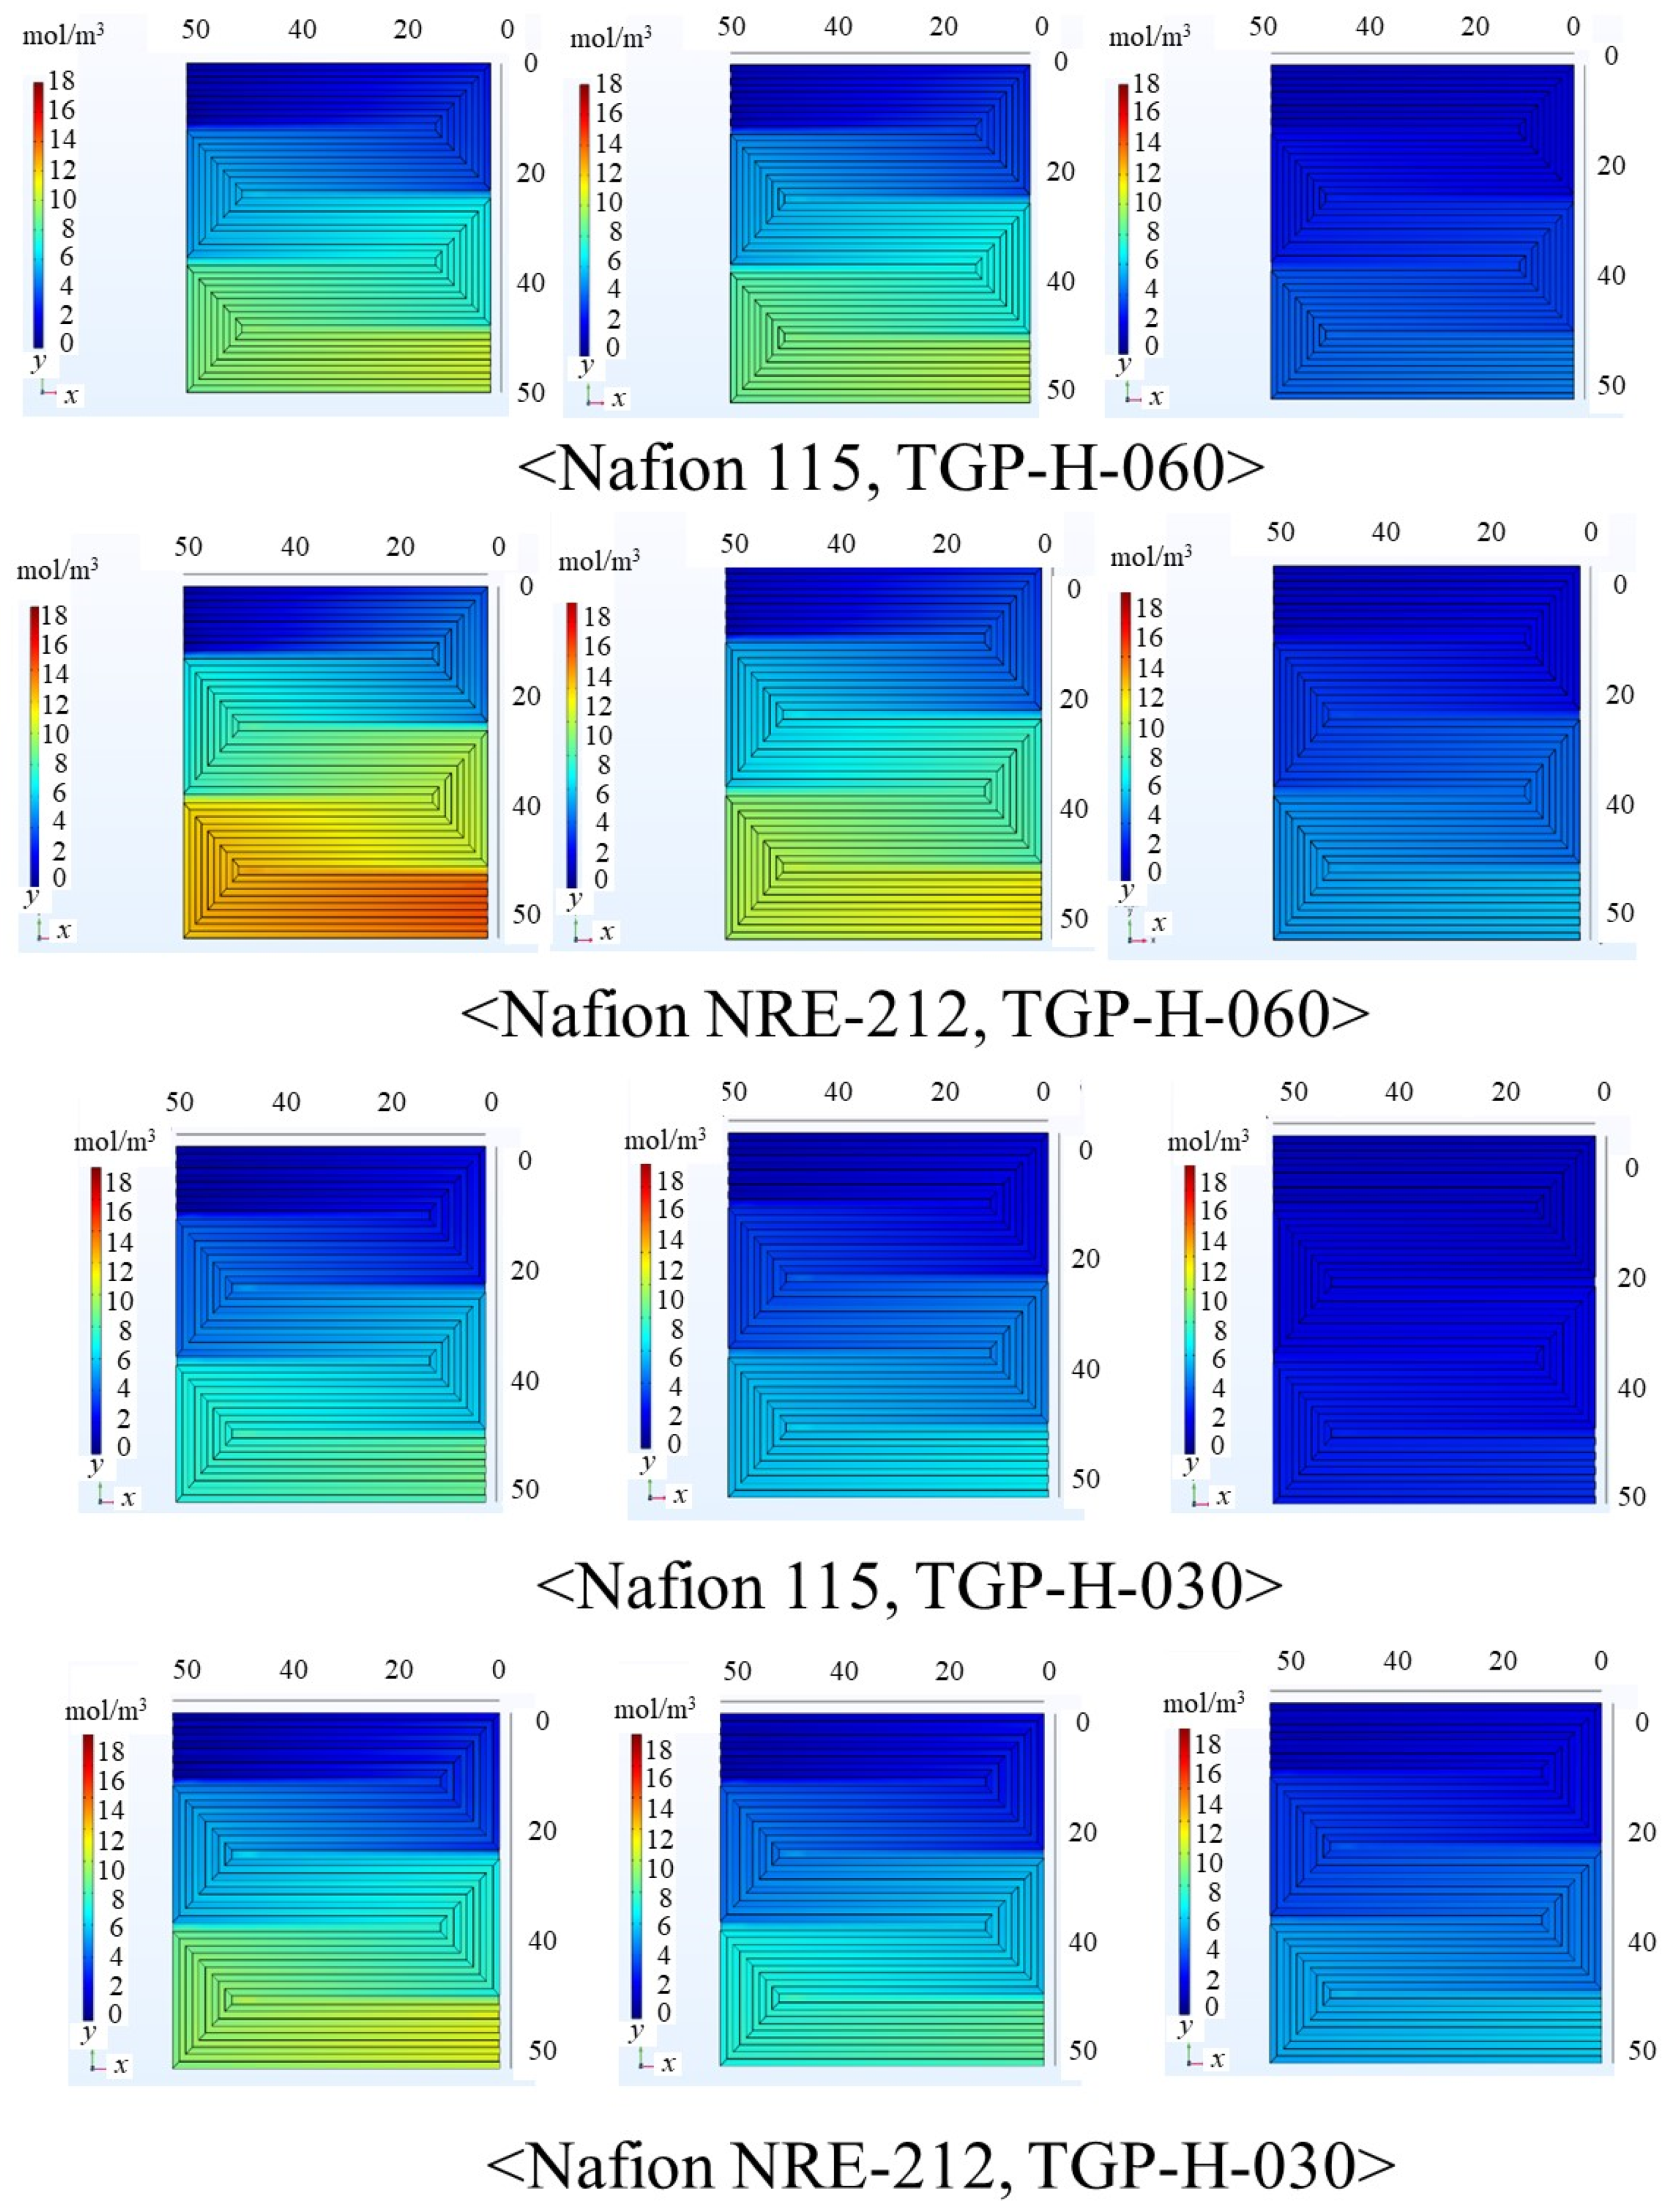
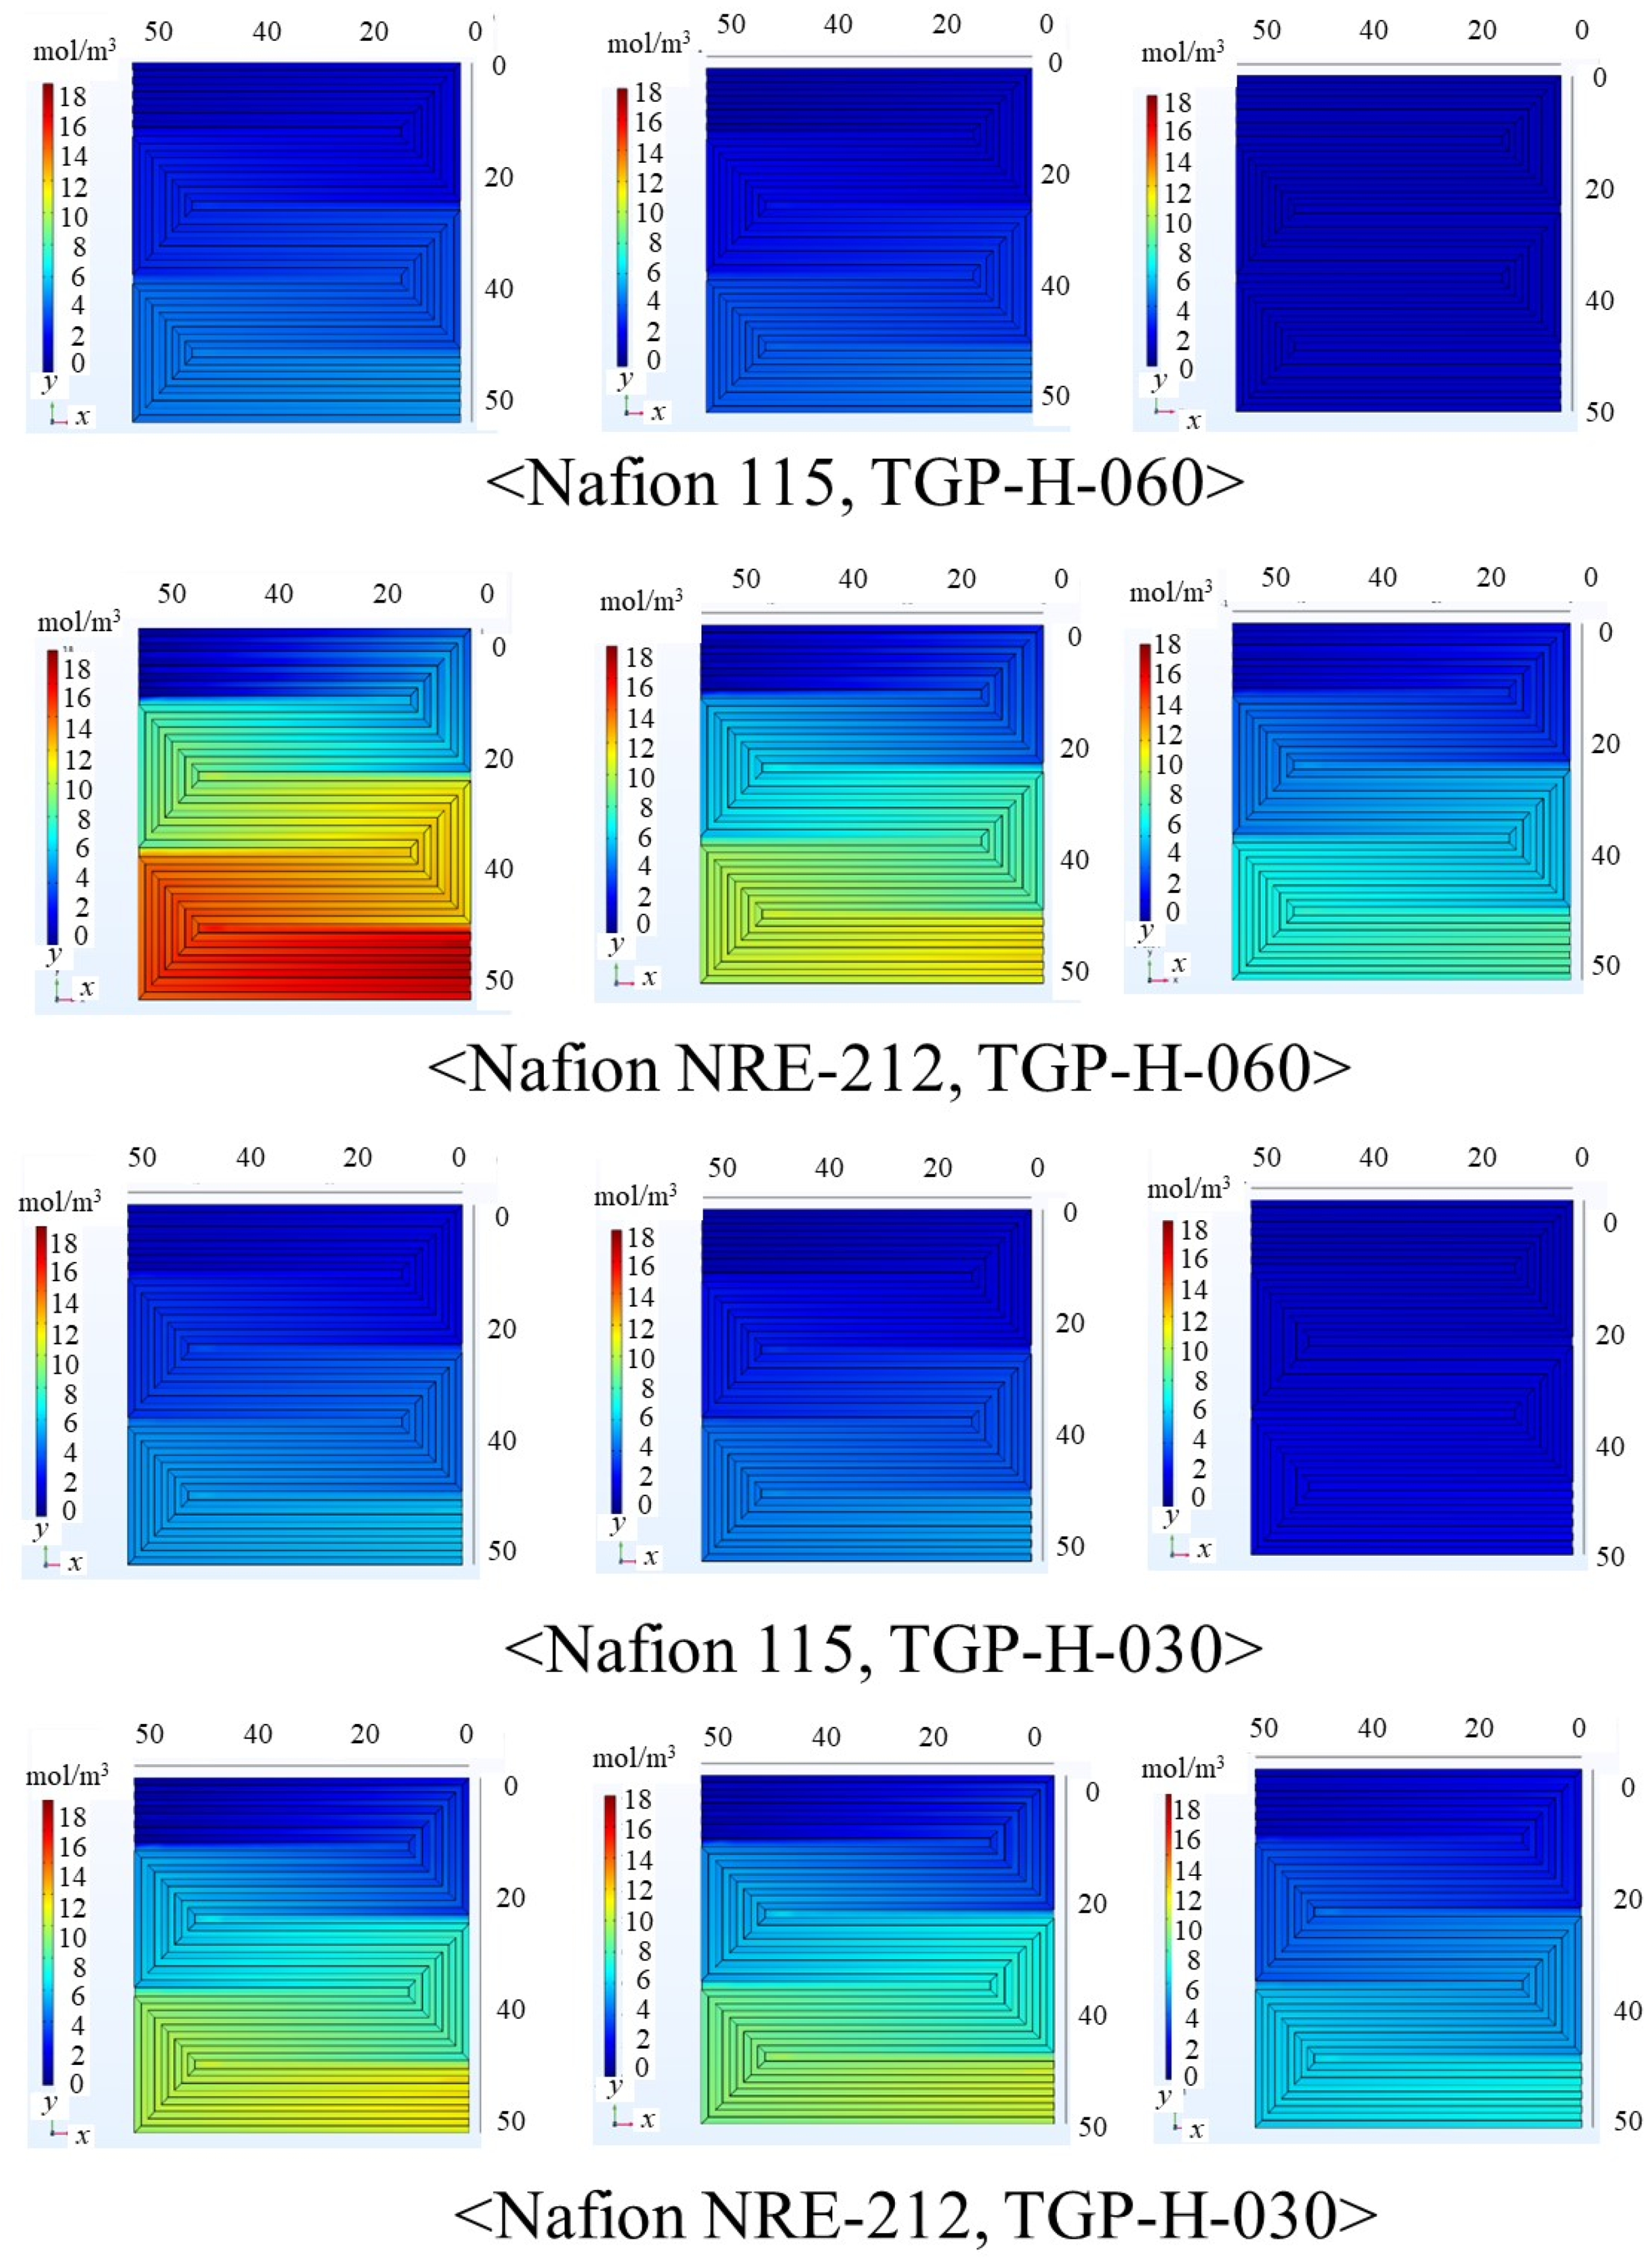
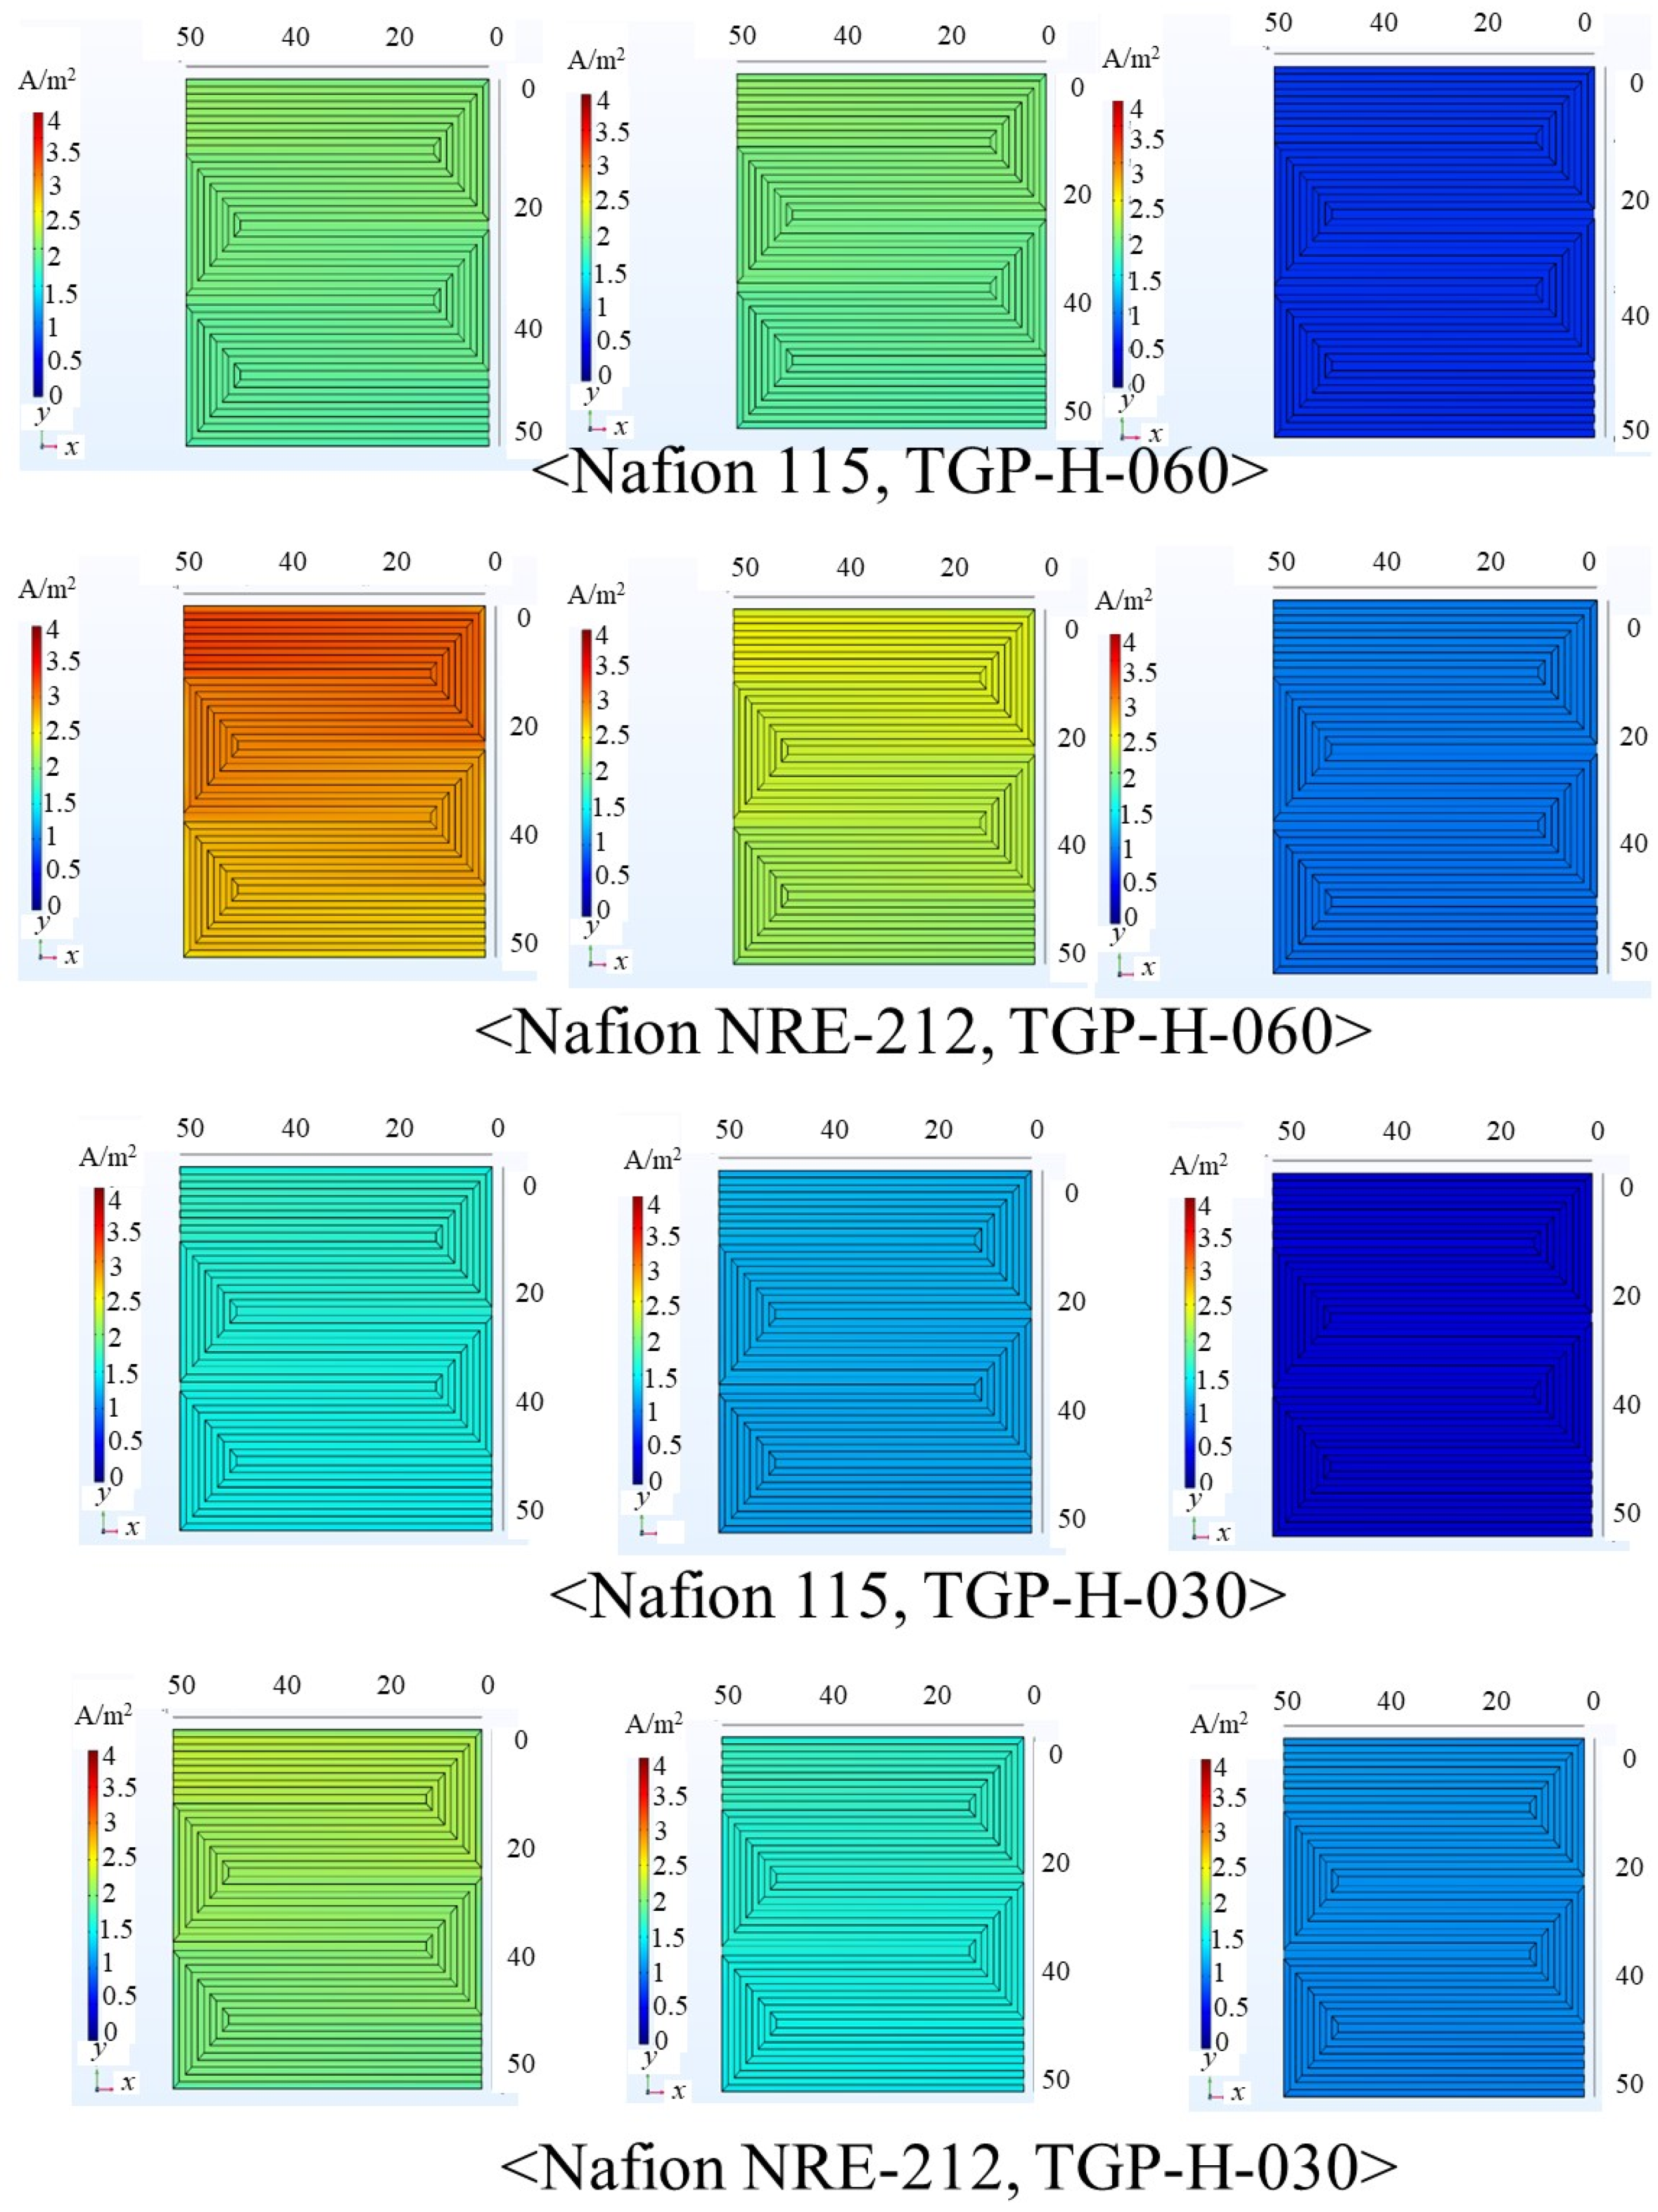
3.1. In-Plane Distribution of O2, H2O and Current Density on the Interface between PEM and Cathode Catalyst Layer

Figure 1 and Figure 2 show the comparison of the in-plane molar concentration distribution of O2 on the interface between PEM and catalyst layer at cathode among different PEM, GDL, and Tini with and without MPL, respectively. Figure 3 and Figure 4 show the comparison of the in-plane molar concentration distribution of H2O on the interface between PEM and catalyst layer at cathode among different PEM, GDL, and Tini with and without MPL, respectively. Figure 5 and Figure 6 show the comparison of the in-plane current density distribution on the interface between PEM and catalyst layer at cathode among different PEM, GDL, and Tini with and without MPL, respectively. In these figures, the RH of supply gas is A80%RH, C80%RH.
According to Figure 1, it is found that the molar concentration of O2 decreases along with the gas flow through the gas channel irrespective of the thickness of PEM and GDL as well as Tini. In addition, it is confirmed that the amount of O2 consumption from the inlet to the outlet is the smallest at Tini = 373 K irrespective of thickness of PEM and GDL. The kinetics of catalyst layer are faster with the increase in temperature [41]. According to the previous studies [43,44], the proton conductivity of PEM increases with the increase in temperature as well as the increase in RH. The saturation pressure of H2O vapor increases with the temperature exponentially [42], with the result that it is easy to dehydrate PEM at Tini = 373 K compared with Tini = 353 K. The proton conductivity of PEM decreases at Tini = 373 K. If the proton conductivity of PEM decreases, the performance of the O2 reduction reaction drops by the lack of proton. Moreover, the hydration of PEM is not enough at Tini = 373 K, with the result that the high O2 partial pressure is needed to progress the O2 reduction reaction [42]. Therefore, it is thought that the amount of O2 consumption decreases at Tini = 373 K. In addition, it is seen that the decrease in concentration of O2 from the inlet to the outlet using the thin PEM, i.e., Nafion NRE-212 is larger than that using the thick PEM, i.e., Nafion 115 irrespective of the thickness of GDL. When the thickness of PEM decreases, the proton conductivity of PEM increases [45]. Since the amount of proton which is transported to the catalyst layer at cathode via PEM is larger, the O2 reduction reaction is conducted well. As a result, the amount of O2 consumption from the inlet to the outlet is larger when using the thin PEM, i.e., Nafion NRE-212.
According to Figure 2, it is found that the change in the concentration of O2 from the inlet to the outlet in the case of Nafion NRE-212 is larger compared with that of Nafion 115 when using the thick GDL, i.e., TGP-H-060, which is the same tendency as the results with MPL shown in Figure 1. As discussed above, when the thickness of PEM decreases, the proton conductivity of PEM increases [45]. Since the amount of proton which is transported to the catalyst layer at cathode via PEM is larger, the O2 reduction reaction is conducted well. As a result, the amount of O2 consumption from the inlet to the outlet is larger when using the thin PEM, i.e., Nafion NRE-212. On the other hand, it is seen that the amount of O2 consumption from the inlet to the outlet in the case of Nafion NRE-212 is almost the same as that of Nafion 115 when using the thin GDL, i.e., TGP-H-030, which shows the different tendency compared with the results with MPL shown in Figure 1. Since the RH of supply gas is A80%RH, C80%RH, which is a well-humidified condition, it is thought that the discharge of H2O from the catalyst layer is not well conducted without MPL. As a result, the supplied O2 is not consumed well, the change in the concentration of O2, i.e., the amount of O2 consumption, from the inlet to the outlet in the case of Nafion NRE-212 is almost the same as that of Nafion 115 when using the thin GDL, i.e., TGP-H-030.
It is seen from Figure 3 that the molar concentration of H2O increases along with the gas flow through the gas channel irrespective of the thickness of PEM and GDL as well as Tini. This result matches with Figure 1 from the viewpoint of progress on the O2 reduction reaction which produces H2O at the cathode. In addition, it is observed that the amount of H2O produced from the inlet to the outlet is the smallest at Tini = 373 K, irrespective of the thickness of PEM and GDL. It can also be explained by the above discussion conducted for Figure 1. Moreover, it is revealed from Figure 3 that the increase in the concentration of H2O from the inlet to the outlet using thin PEM, i.e., Nafion NRE-212 is larger than that using the thick PEM, i.e., Nafion 115, irrespective of the thickness of GDL. When the thickness of PEM decreases, the proton conductivity of PEM increases [45]. Since the amount of proton which is transported to the catalyst layer at cathode via PEM increases, the O2 reduction reaction is conducted well. As a result, the amount of H2O produced from the O2 reduction reaction increases.
According to Figure 4, it is observed that the molar concentration of H2O increases along with the gas flow through the gas channel irrespective of the thickness of PEM and GDL as well as Tini which is the same as the results with MPL shown in Figure 3. In addition, it is observed that the amount of H2O produced from the inlet to the outlet is the smallest at Tini = 373 K irrespective of the thickness of PEM and GDL, which is the same tendency as the results with MPL shown in Figure 3. Moreover, it is revealed that the increase in the concentration of H2O from the inlet to the outlet using the thin PEM, i.e., Nafion NRE-212 is larger than that using the thick PEM, i.e., Nafion 115 irrespective of the thickness of GDL, which is the same as the results with MPL shown in Figure 3.
It is observed from Figure 5 that the current density decreases with the increase in Tini. Some previous experimental studies have reported that the current density increases with the increase in Tini. However, they are the reported results using the new materials which are available for high temperature operation, e.g., bulky N-heterocyclic group functionalized poly (terphenyl piperidinium) membranes [9] and PBI-based membranes [45]. The authors selected the Nafion membrane which is a popular membrane used under low temperature operation conditions, e.g., below 353 K. According to the reference using the Nafion membrane such as Nafion NRE-211 experimentally [43], the power generation performance declines with the increase in Tini. The previous study has reported that the operation using Nafion membrane at higher temperatures results in a poor power generation performance due to the low proton conductivity of Nafion membrane under a dry condition [8]. In addition, the other study has suggested preparing the new material which can conduct protons independent of H2O [45]. Therefore, it can be thought that the Nafion membrane is influenced by a humidification condition easily at higher temperatures. The saturation pressure of H2O vapor increases with temperature exponentially [42]. Therefore, it is easy to dehydrate PEM at higher temperatures when using the Nafion membrane. The proton conductivity of PEM decreases at Tini = 373 K. If the proton conductivity of PEM decreases, the performance of O2 reduction reaction drops due to the lack of proton. Moreover, the hydration of PEM is not enough at Tini = 373 K, resulting that the high O2 partial pressure is needed to progress the O2 reduction reaction [42]. Consequently, the current density decreases with the increase in Tini due to the increase in ohmic over-potential and concentration over-potential [42]. In addition, it is seen from Figure 5 that the current density in the case of the thin PEM, i.e., Nafion NRE-212 is higher than that of the thick PEM, i.e., Nafion 115 irrespective of the thickness of GDL and Tini. When the thickness of PEM decreases, the proton conductivity of PEM increases [45]. Since the amount of proton which is transported to the catalyst layer at cathode via PEM increases, the O2 reduction reaction is conducted well. As a result, the current density is higher when using the thin PEM such as Nafion NRE-212. Moreover, it is observed that the current density in the case of the thick GDL, i.e., TGP-H-060 is higher than that of the thin GDL, i.e., TGP-H-030 irrespective of Tini. Since the performance of mass and O2 transportation in GDL is lower in the case of the thick GDL, it is believed that the function of MPL such as (i) reduction of ohmic losses due to enhancing the hydration of PEM [46], (ii) O2 diffusion in the catalyst layer due to discharging H2O [47], and (iii) back diffusion from the cathode to the anode caused by the increase in the H2O vaporized due to the increase in the temperature of the catalyst layer at cathode [48], which plays an important role in the PEFC, would work well.
According to Figure 6, it is found that the current density decreases with the increase in Tini, which exhibits the same tendency as the results with MPL shown in Figure 5. The reason for this phenomenon has been already discussed above. Additionally, it is observed that the current density in the case of the thin PEM, i.e., Nafion NRE-212 is larger than that of Nafion 115 when using the thin GDL, i.e., TGP-H030. This tendency is more remarkable compared with using the thick GDL, i.e., TGP-H-060. Since the RH of supply gas is A80%RH, C80%RH, which is a well-humidified condition, it is thought that the discharge of H2O from the catalyst layer is not well without MPL. Therefore, it is thought that the combination of thin PEM and thin GDP is effective to promote H2O transfer as well as O2 transfer. The electro-osmotic drag which decides the H2O flux in PEM decreases with the decrease in the thickness of PEM [49] and the mass transfer resistance decreases with the decrease in the thickness of GDL due to the promotion of discharging H2O [19]. Consequently, the higher current density is obtained for the thin PEM, i.e., Nafion NRE-212 compared with the thick PEM, i.e., Nafion 115 when using the thin GDL, i.e., TGP-H-030.

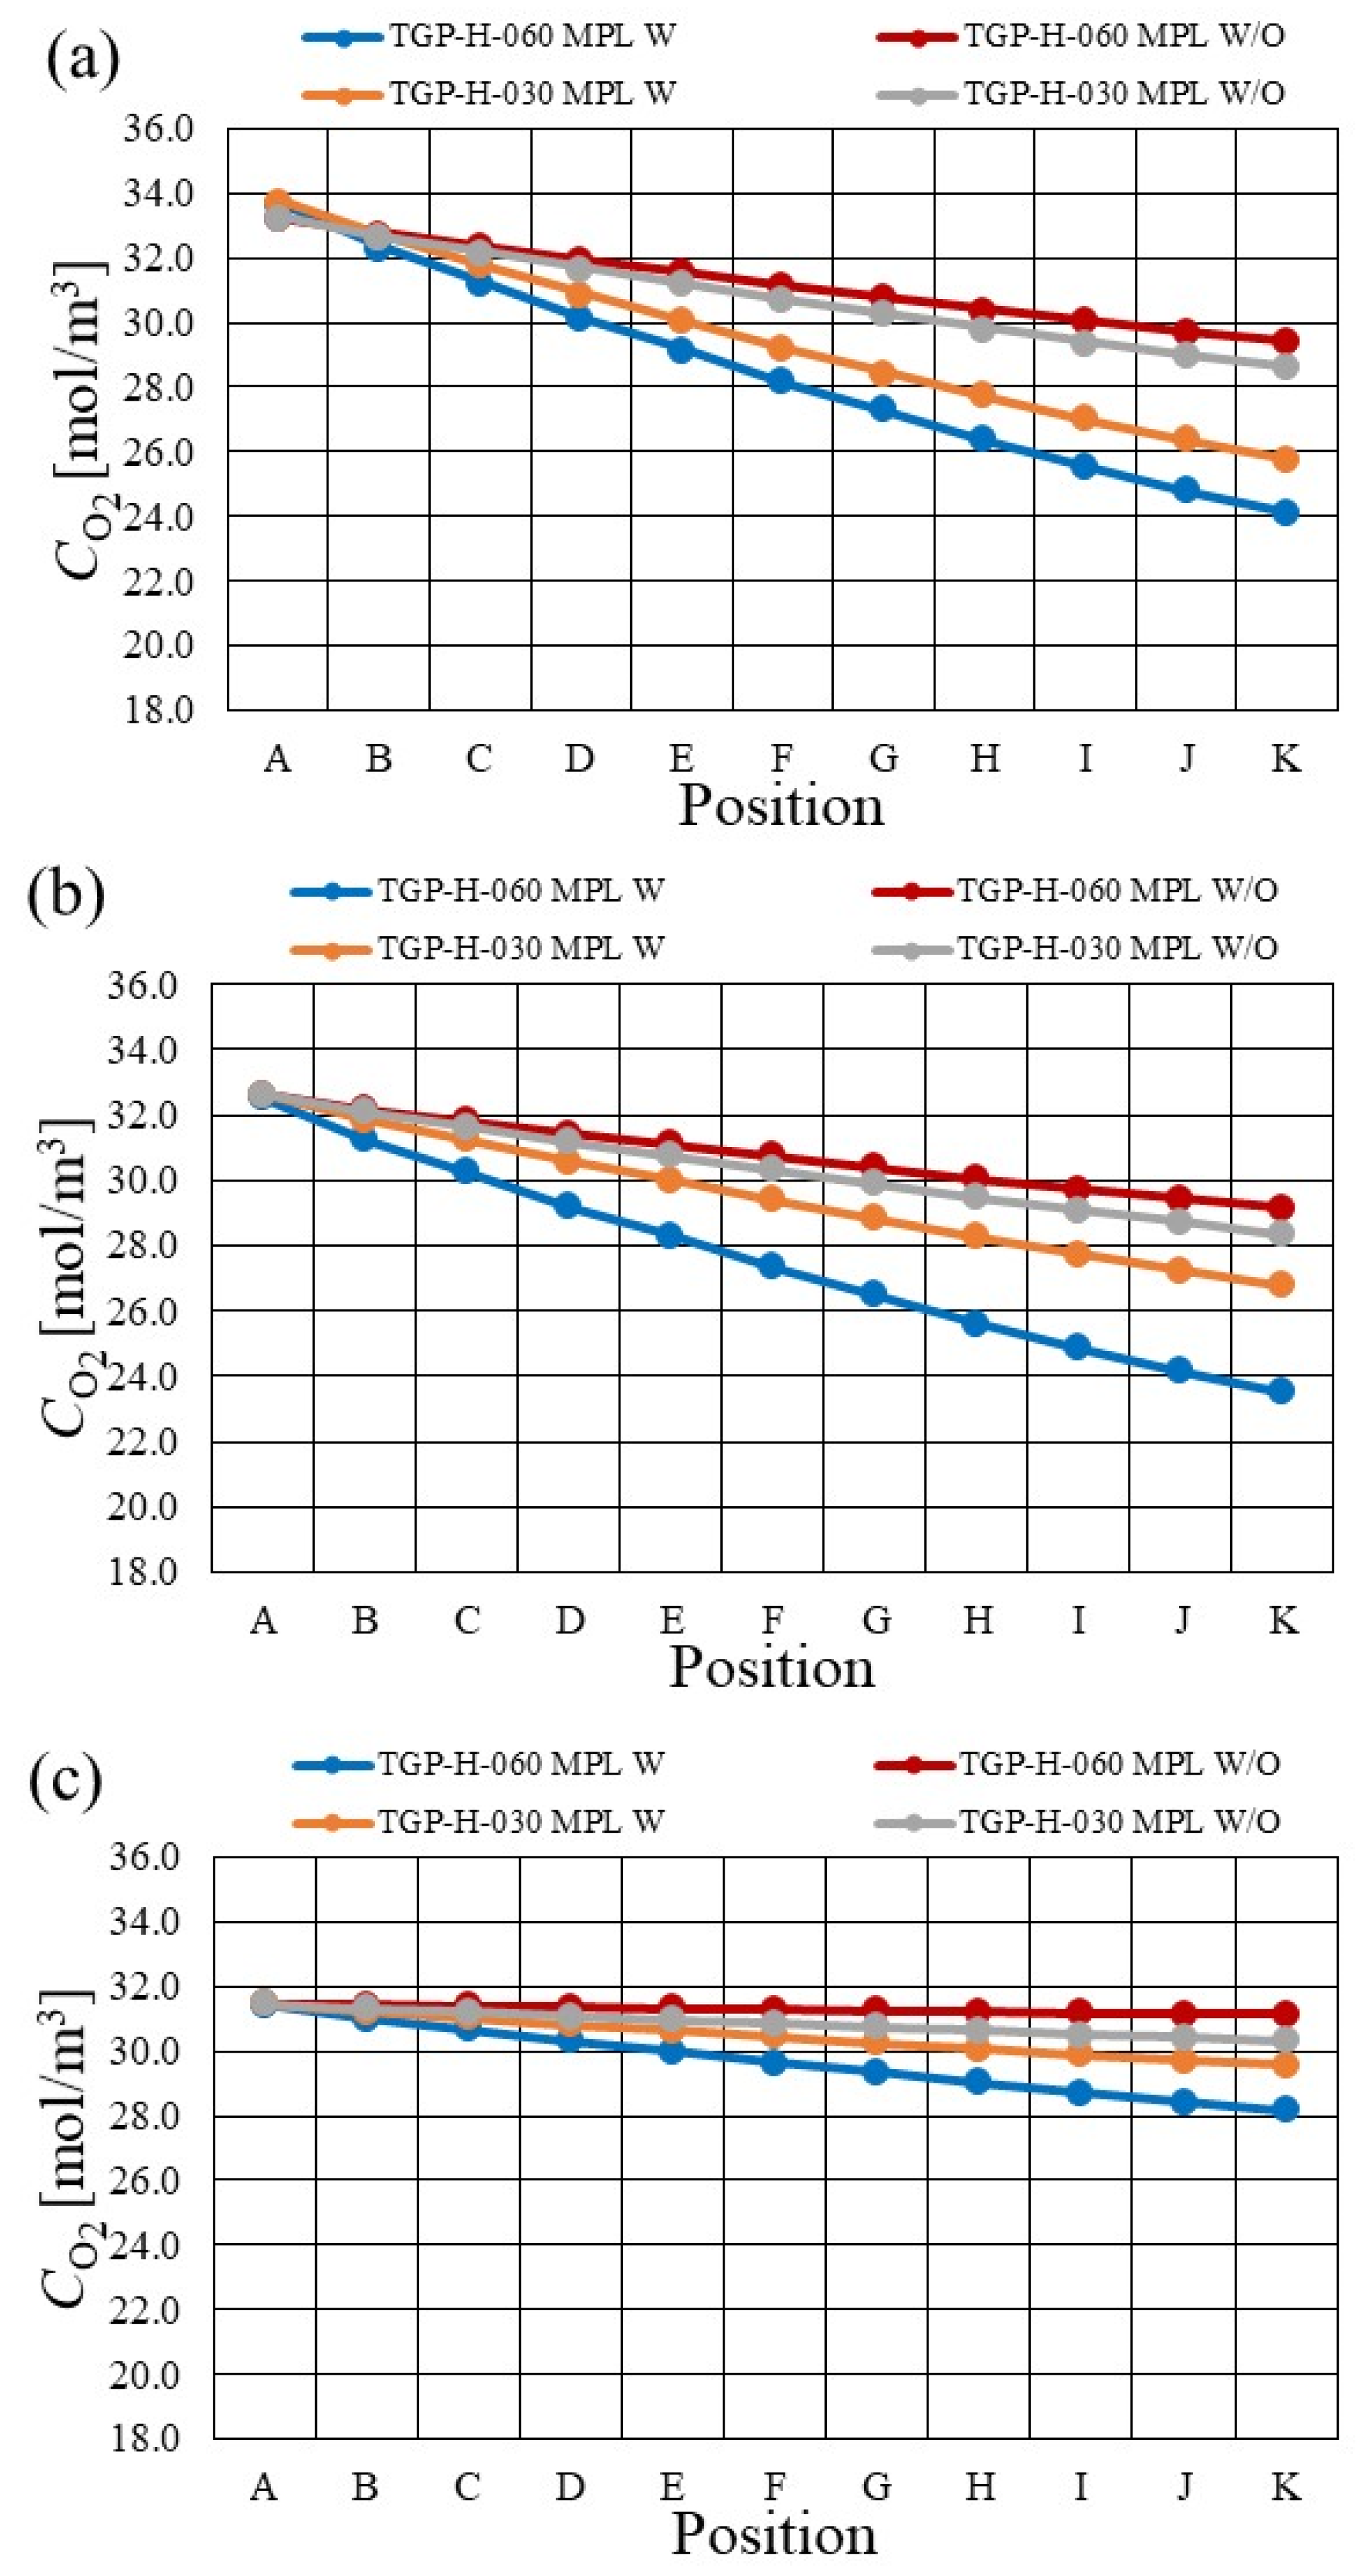
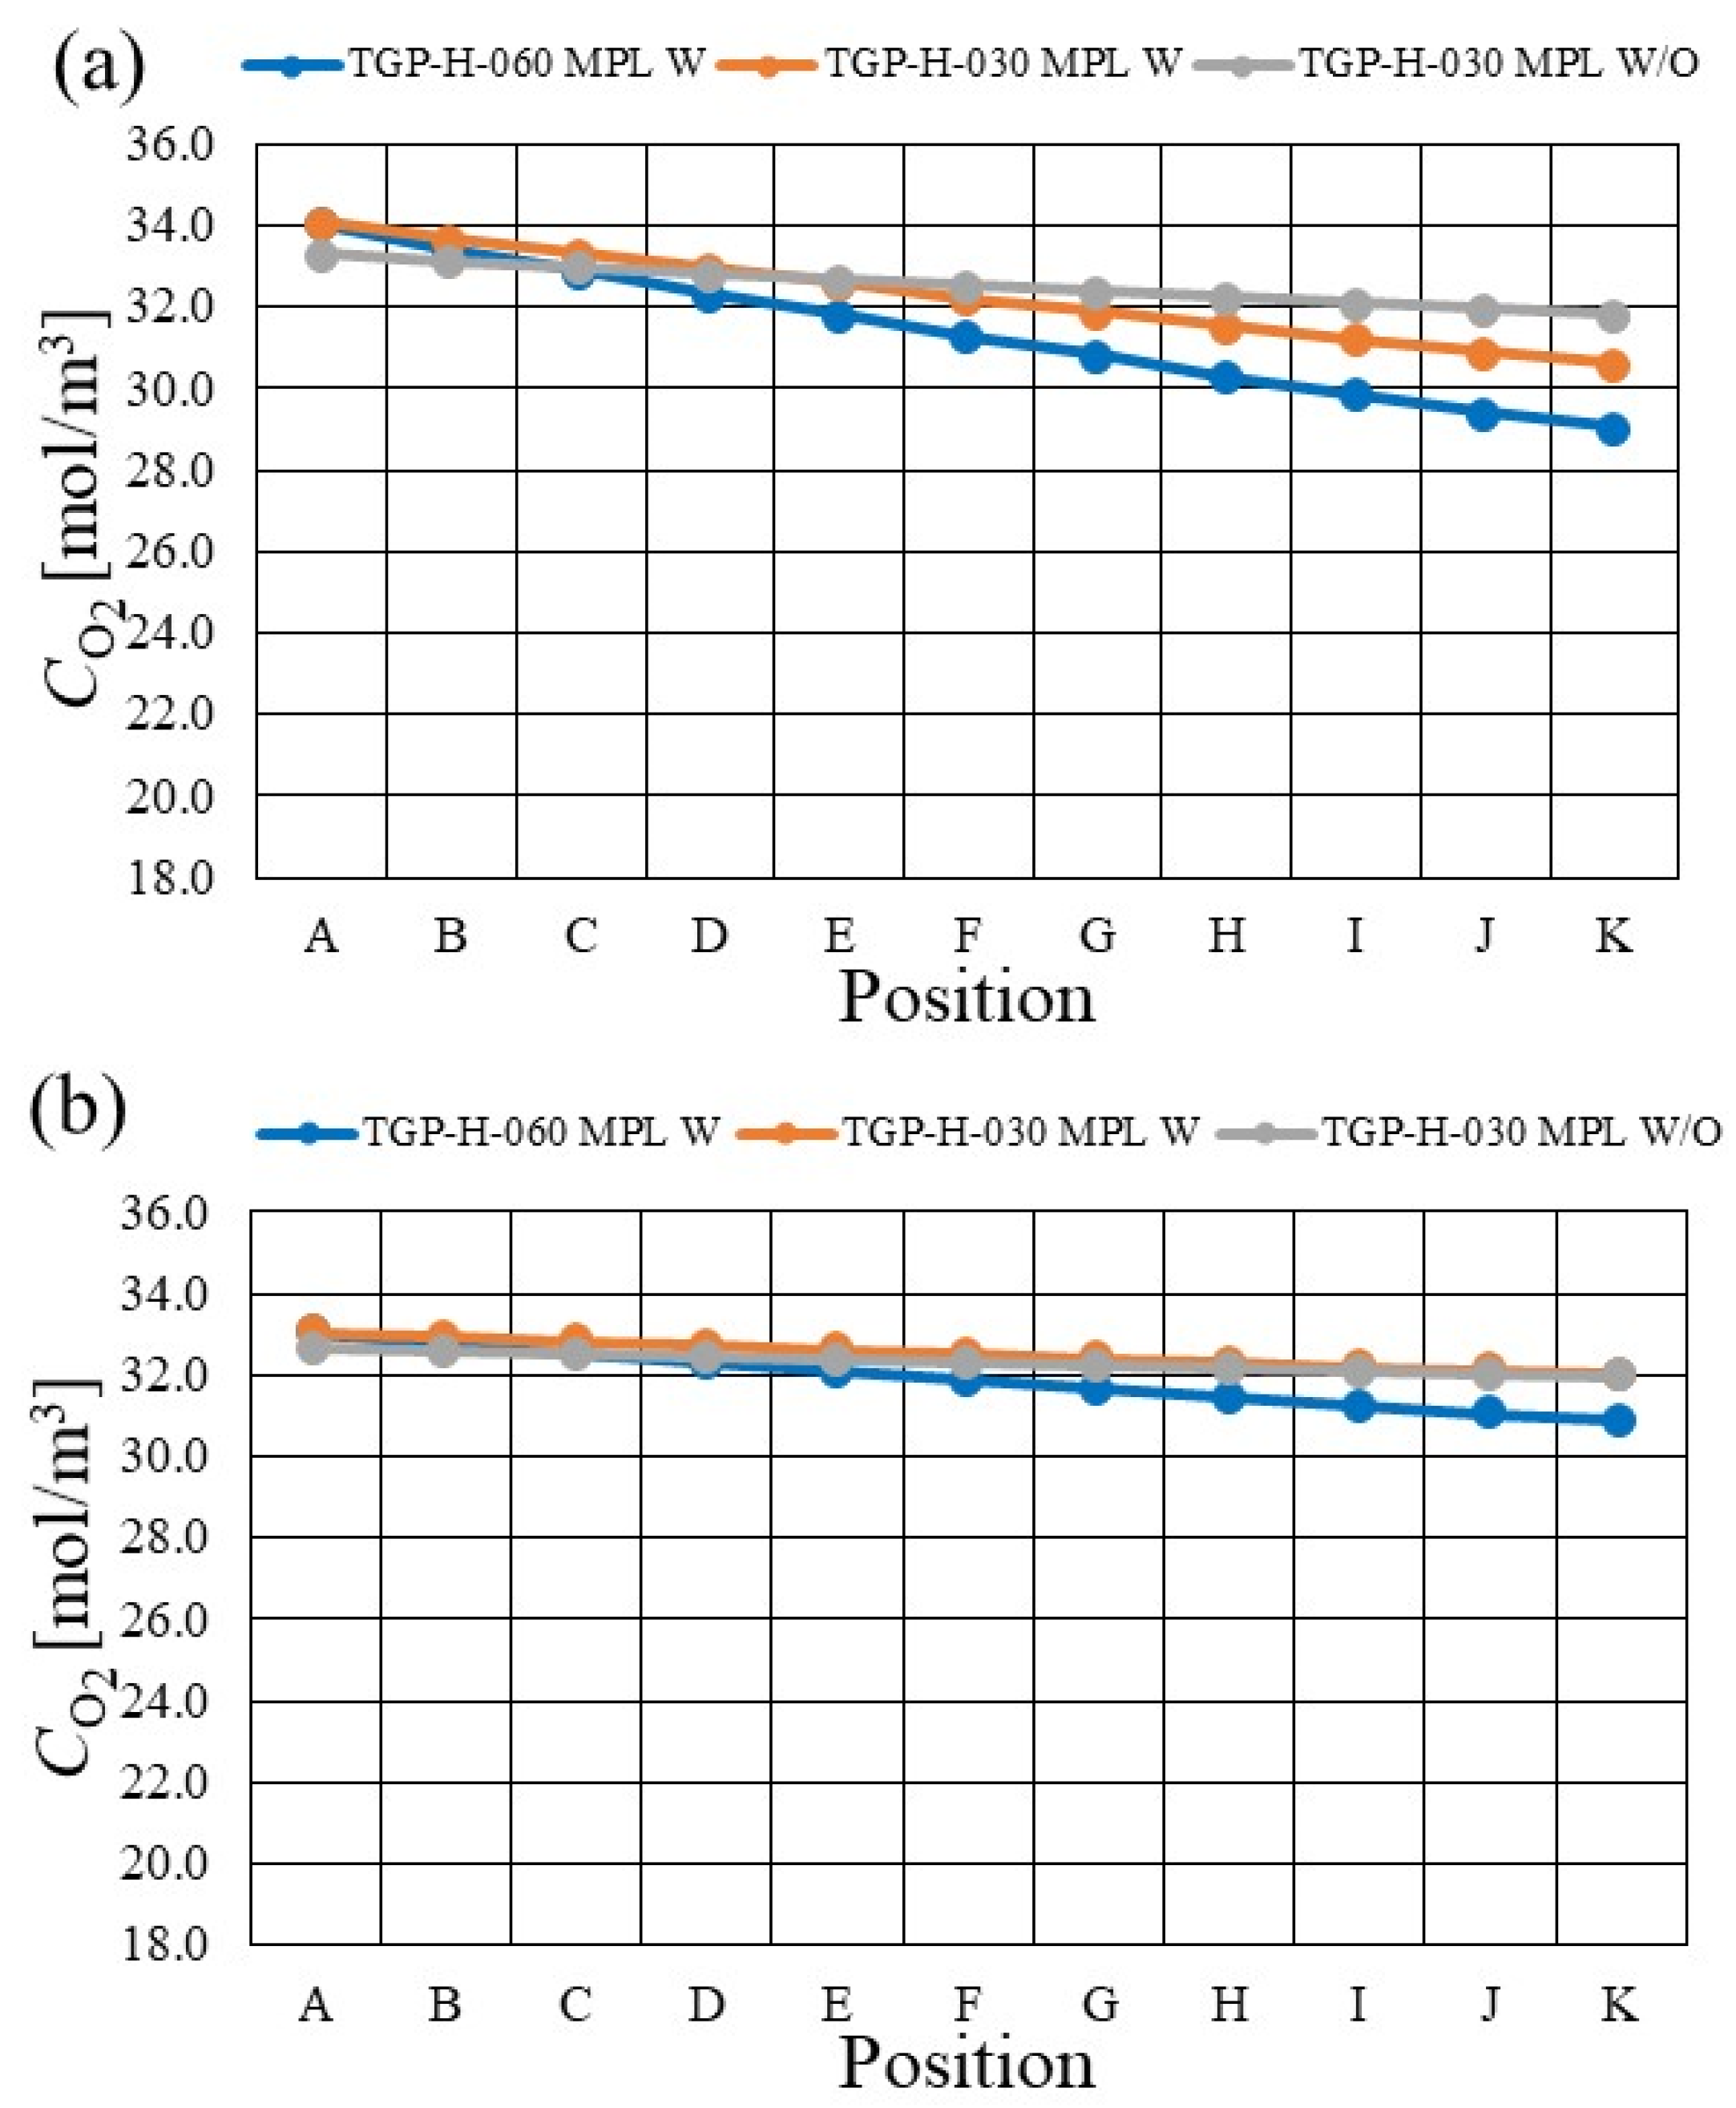
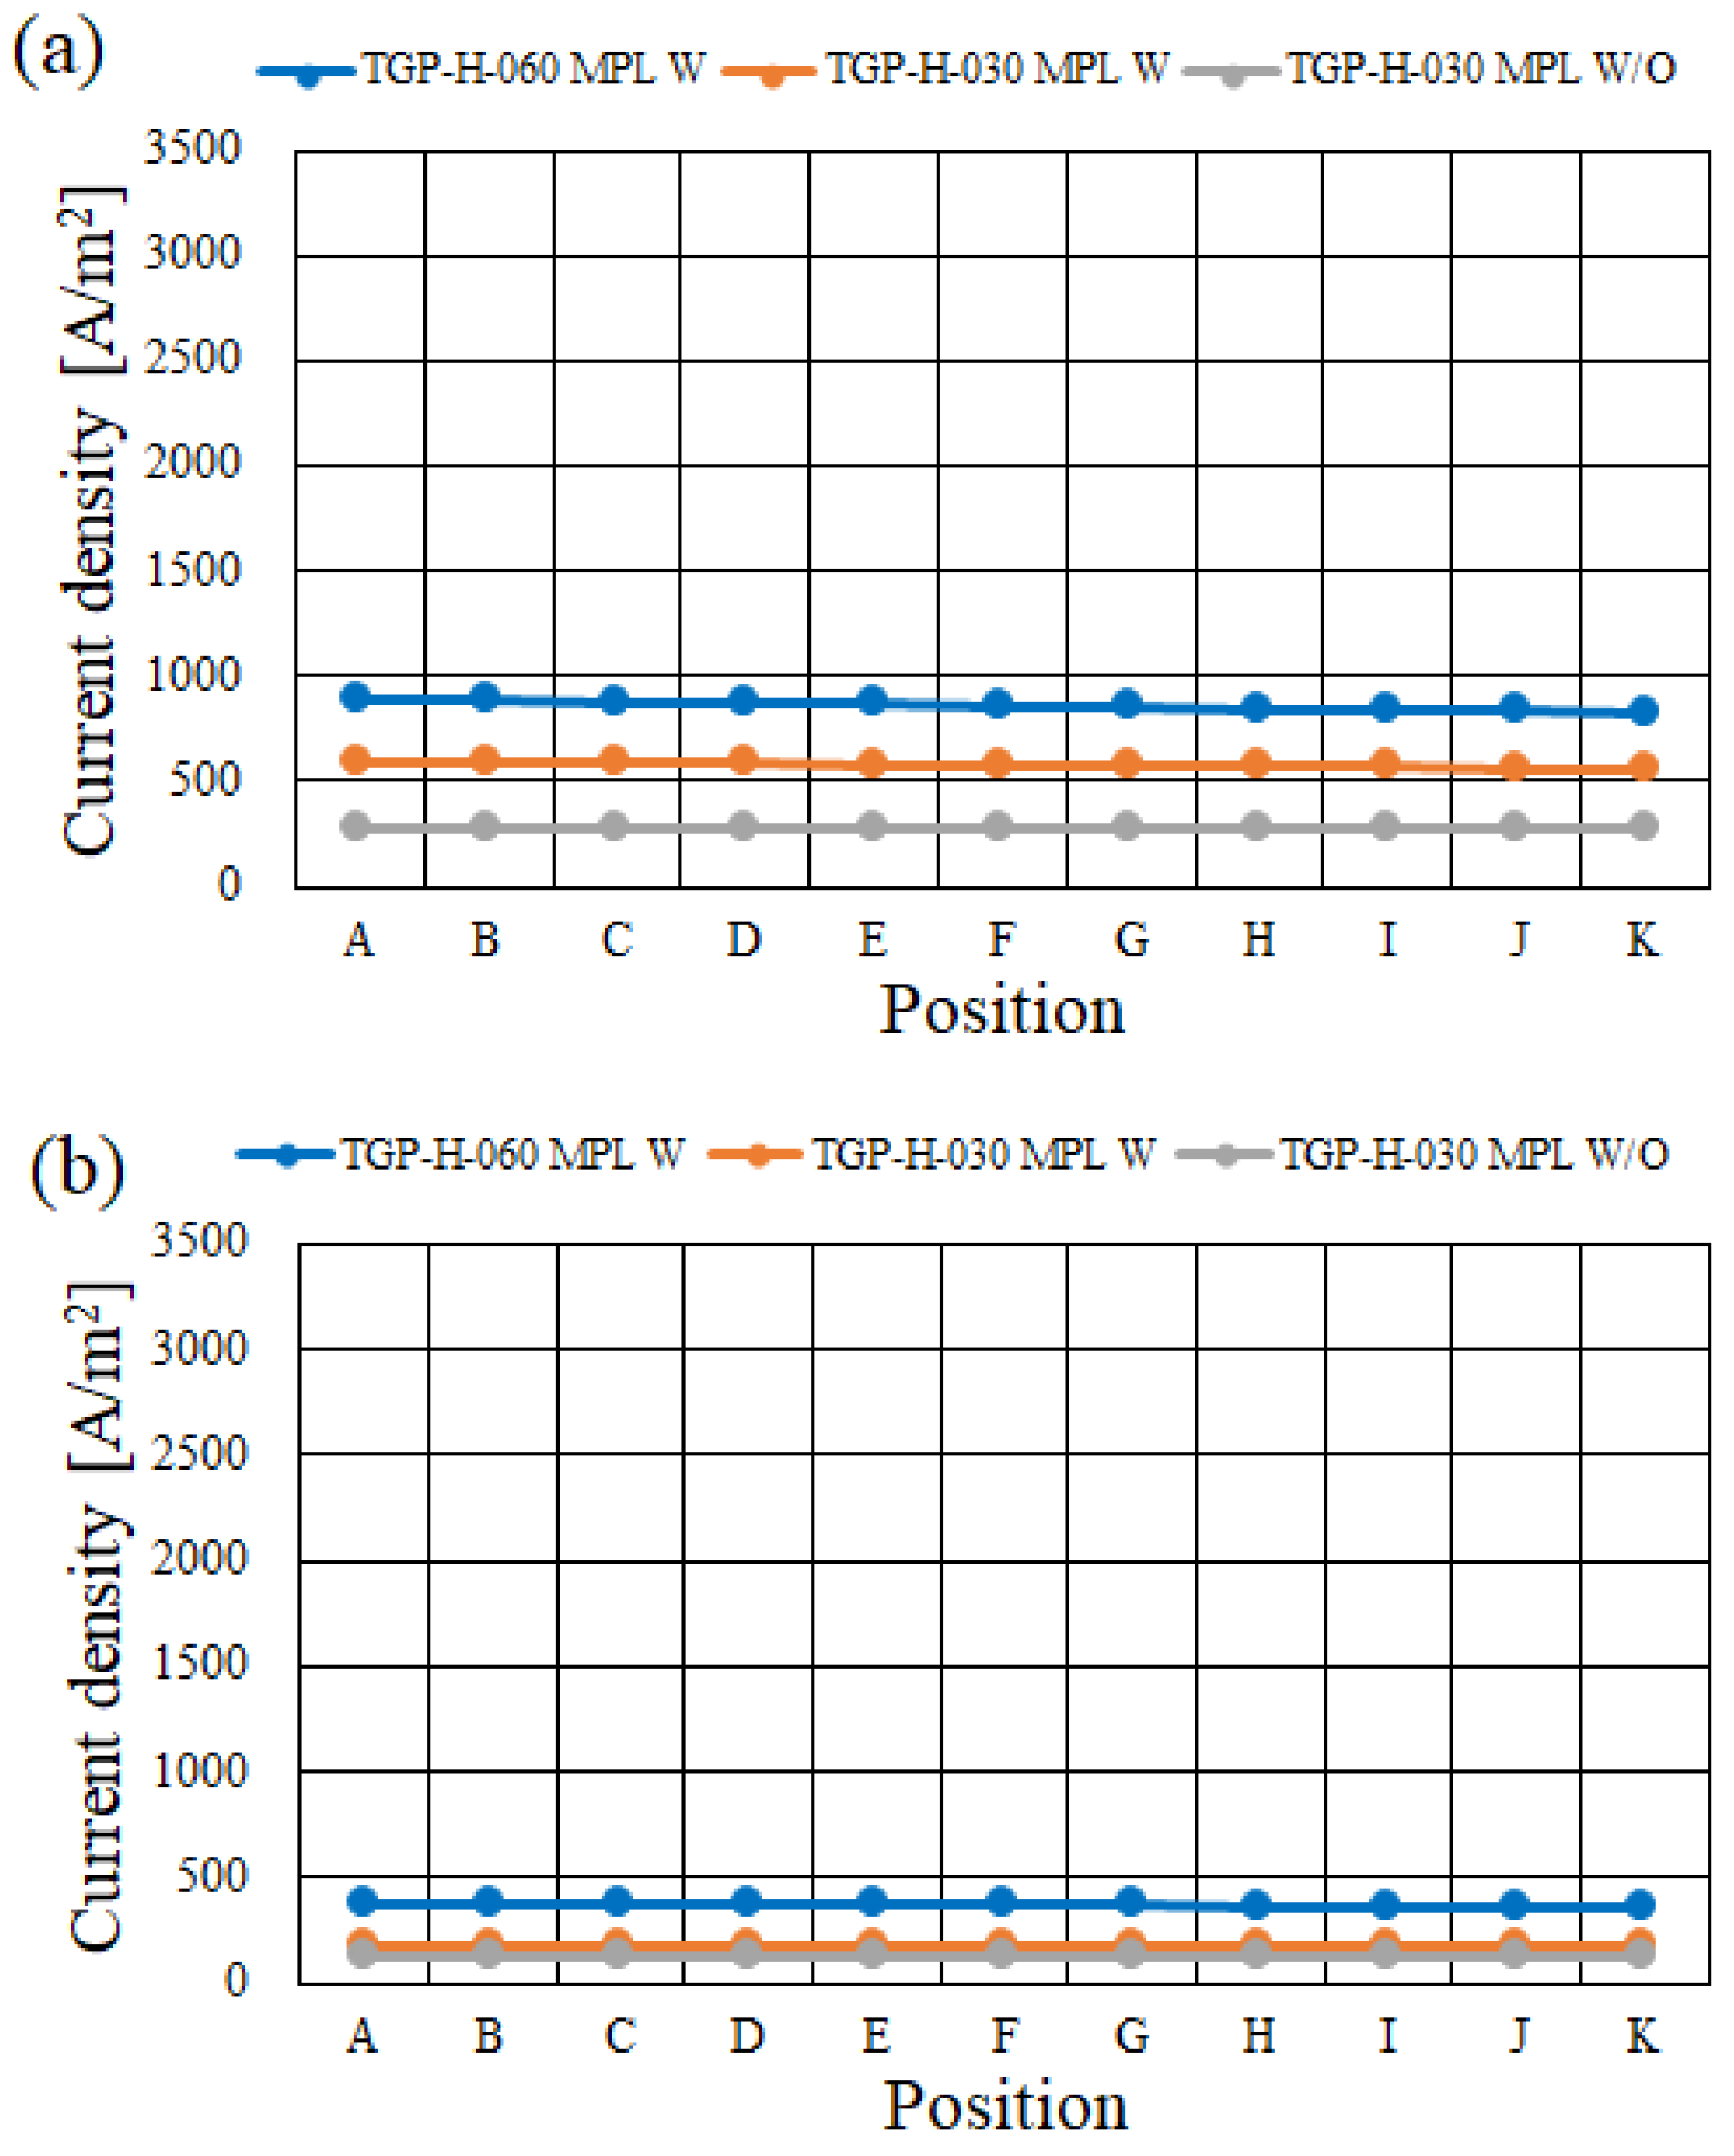
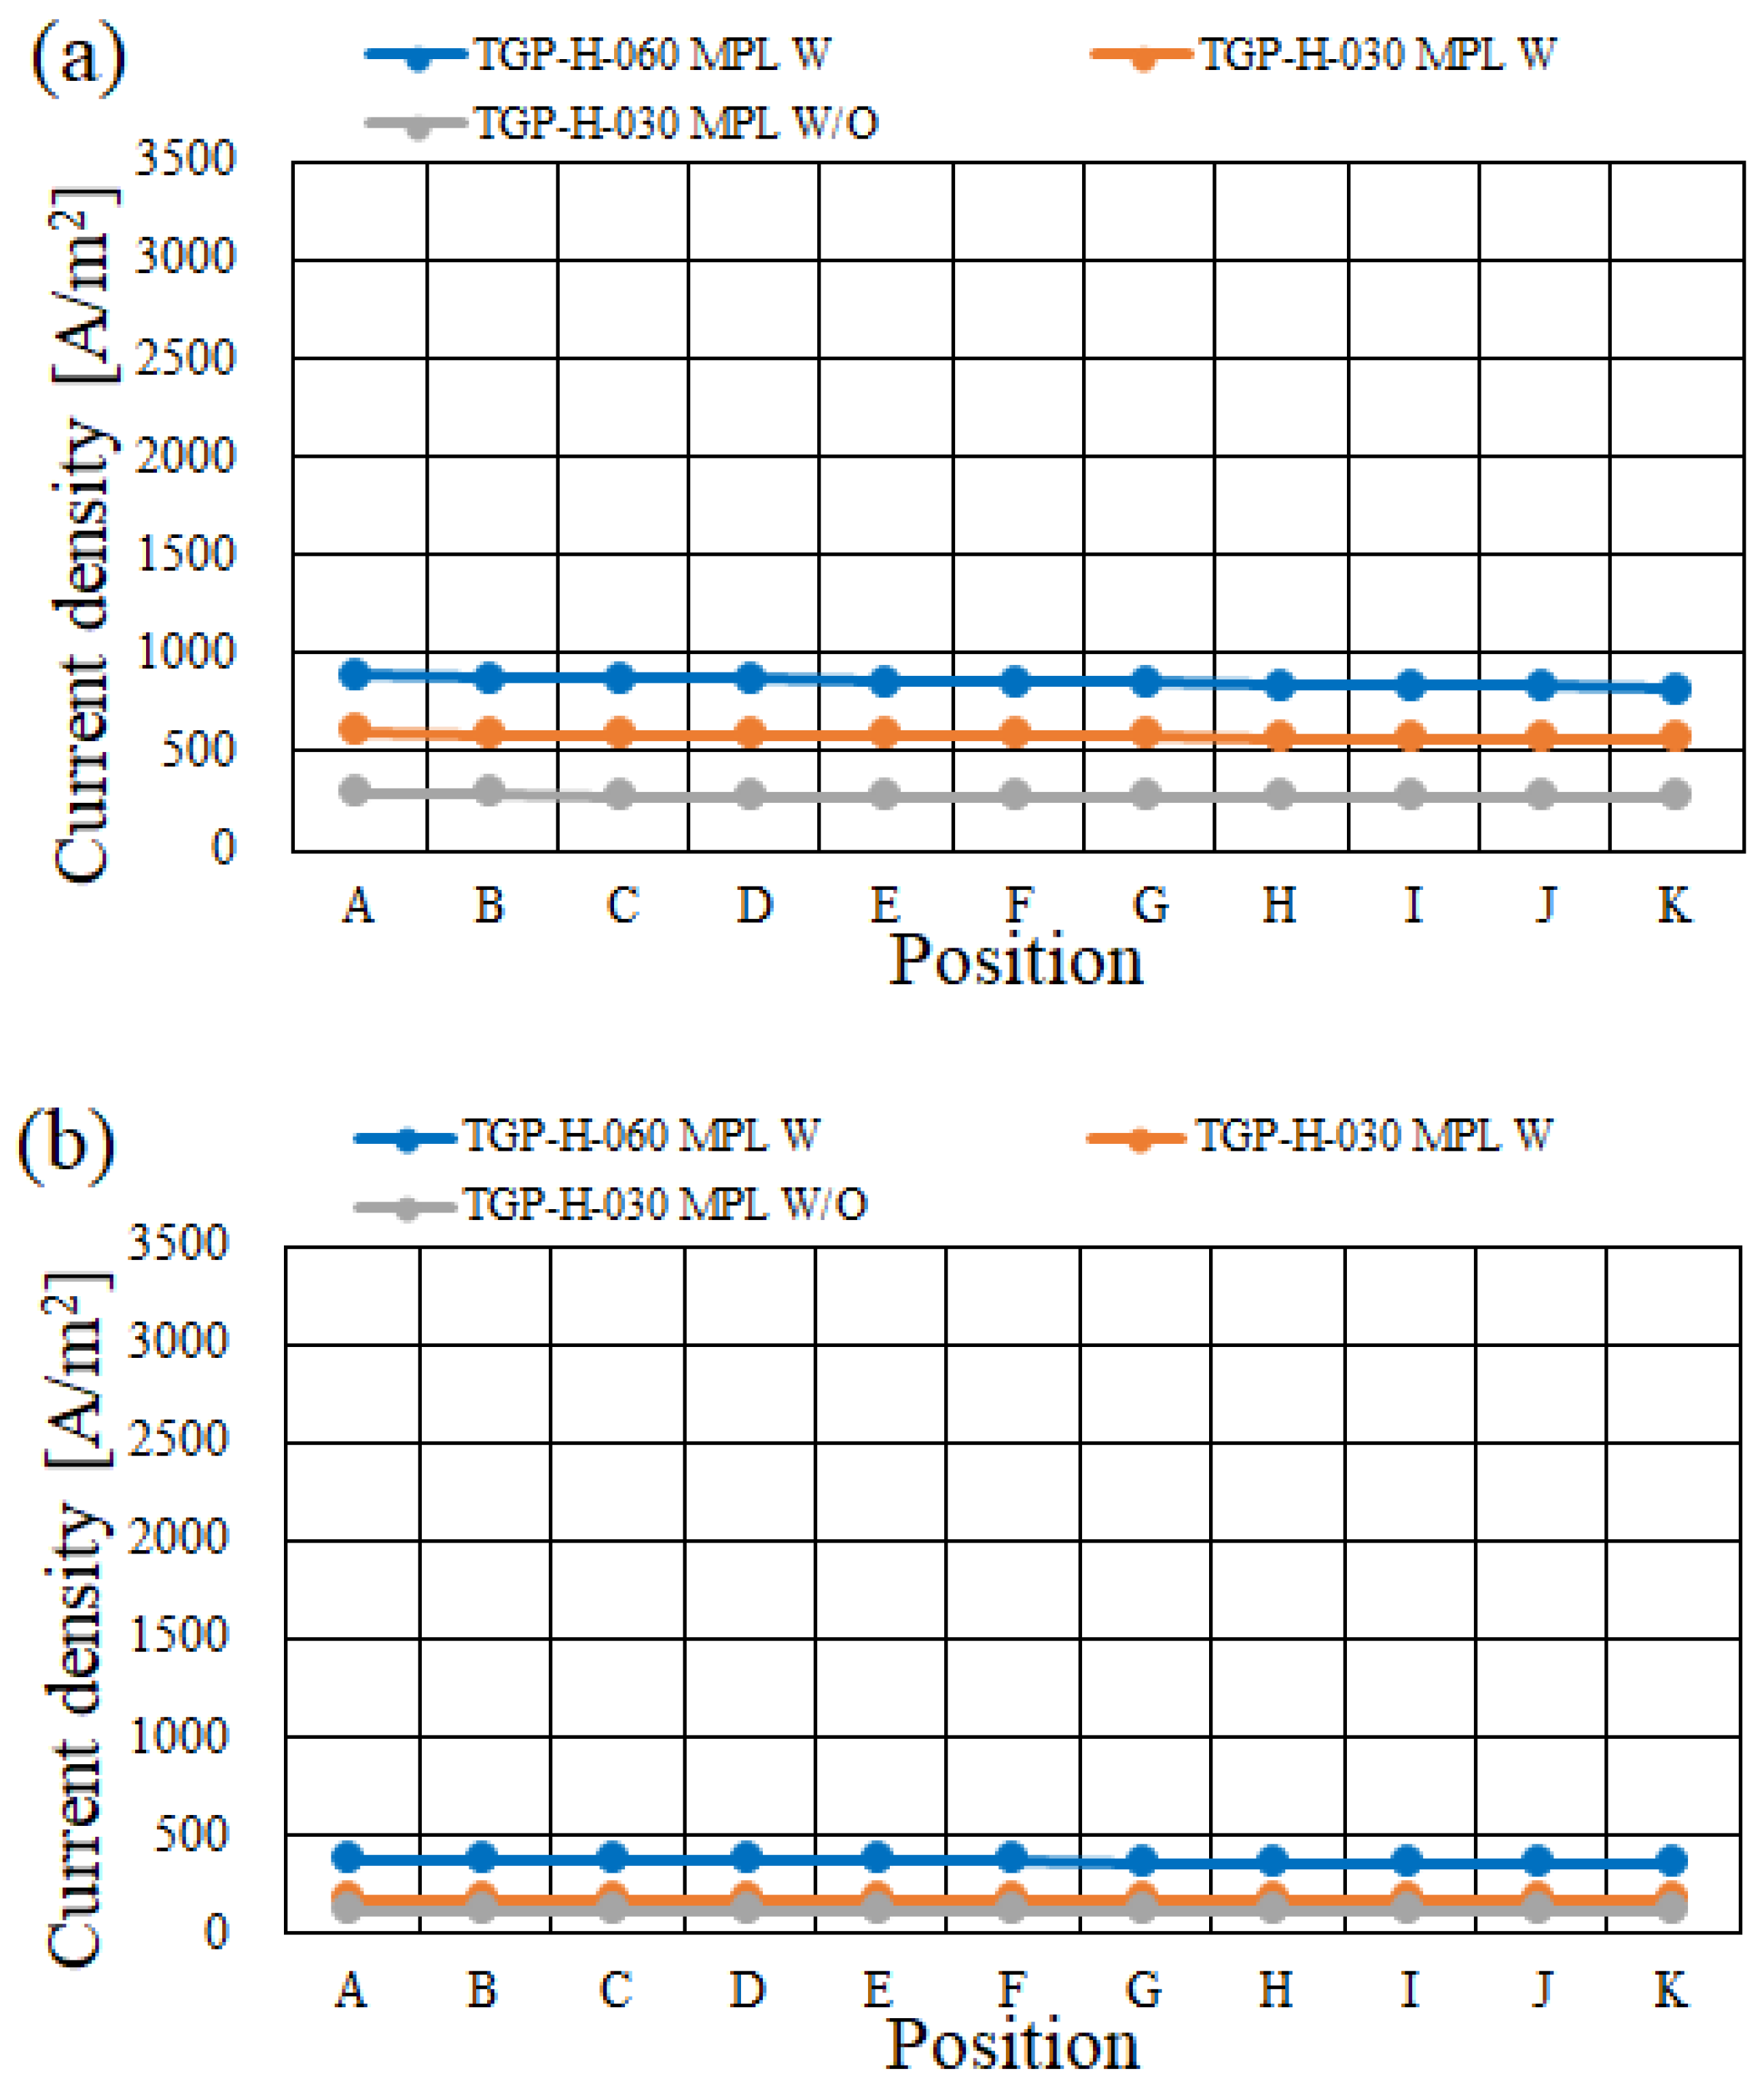
3.2. Analysis on Distribution of O2, H2O and Current Density along with the Gas Flow through the Gas Channel

This study has selected the analysis points from A to K, which are the same as the authors’ previous study [24], to investigate the impact of the thickness of GDL and MPL changing the thickness of PEM on distributions of O2, H2O, and current density. In this analysis, the average value on the cross-sectional area of the interface between PEM and catalyst layer at the cathode at each point, which covers both part under gas channel and that under rib, has been estimated.
Figure 7 and Figure 8 show comparisons of molar concentration of O2 along with the gas flow through the gas channel on the interface between PEM and catalyst layer at cathode among different RH, GDL and Tini with and without MPL in the case of Nafion 115, respectively. The results of A80%RH, C80%RH and A40%RH, C40%RH are shown in Figure 7 and Figure 8, respectively. In addition, the data at Tini = 373 K as well as that of TGP-H-060 without MPL are not shown in Figure 8 since the total voltage obtained at the load current of 0.80 A/cm2, whose data are used for the initial condition in this numerical simulation, could not be carried out due to dry conditions.
According to Figure 7 and Figure 8, it is seen the molar concentration of O2 decreases along with the gas flow through the gas channel irrespective of the thickness of GDL and Tini with and without MPL. It can be understood that the O2 reduction reaction is progressed along with the gas flow through the gas channel. In particular, it is revealed that the change in the molar concentration of O2 from the inlet to the outlet is larger with MPL than that without MPL. Due to the function of MPL which exhausts H2O, it is thought that the mass transfer is promoted, resulting that the O2 reduction reaction is progressed well. The effect of MPL on the promotion of O2 reduction reaction in the case of TGP-H-060 is larger compared with that in the case of TGP-H-030. When the thickness of GDL is larger, the performance of O2 and H2O transfer is lower. Therefore, the function of MPL which exhausts H2O becomes more effective. In addition, the change in the concentration of O2 from the inlet to the outlet decreases with the increase in Tini with and without MPL. It is known from the previous studies [43,44] that the proton conductivity of PEM increases with the increase in temperature as well as the increase in RH. Since the saturation pressure of H2O vapor increases with temperature exponentially [42], it is easy to dehydrate PEM at higher temperature. The proton conductivity of PEM decreases at higher temperature. If the proton conductivity of PEM decreases, the performance of O2 reduction reaction drops due to the lack of proton. Since the hydration of PEM is not enough at Tini = 373 K, the high O2 partial pressure is needed to progress the O2 reduction reaction [42]. Consequently, it is thought that the change in the concentration of O2 from the inlet to the outlet decreases with the increase in Tini. Moreover, it is found that the change in the concentration of O2 from the inlet to the outlet for A40%RH, C40%RH is smaller compared with that for A80%RH, C80%RH. Since A40%RH, C40%RH is the dry condition, PEM and the catalyst layer are dehydrated easily [50,51]. The proton conductivity of PEM is smaller under a dry condition [49] and the RH influences the performance of the O2 reduction reaction occurring on the ionomer in the catalyst layer at cathode [41]. There is the optimum H2O saturation for ionomer in the catalyst layer at cathode [23]. Due to these reasons, the change in the concentration of O2 from the inlet to the outlet for A40%RH, C40%RH is smaller compared with that for A80%RH, C80%RH.
Figure 9 and Figure 10 show comparisons of molar concentration of O2 along with the gas flow through the gas channel on the interface between PEM and catalyst layer at cathode among different RH, GDL and Tini with and without MPL in the case of Nafion NRE-212, respectively. The results of A80%RH, C80%RH and A40%RH, C40%RH are shown in Figure 9 and Figure 10, respectively. In addition, the data at Tini = 373 K as well as that in the case of TGP-H-060 without MPL are not shown in Figure 10 since the total voltage could not be obtained at the load current of 0.80 A/cm2 used for the initial condition in this numerical simulation due to the dry condition.
According to Figure 9 and Figure 10, it is seen the molar concentration of O2 decreases along with the gas flow through the gas channel irrespective of the thickness of GDL and Tini with and without MPL, which is the same tendency as the results for Nafion 115. It can be understood that the O2 reduction reaction is progressed along with the gas flow through the gas channel. Especially, it is revealed that the change in the molar concentration of O2 from the inlet to the outlet is larger with MPL than that without MPL, which shows the same tendency as the results for Nafion 115. Due to the function of MPL which exhausts H2O, it is thought that the mass transfer is promoted, resulting that the O2 reduction reaction is progressed well. The effect of MPL on the promotion of O2 reduction reaction in the case of TGP-H-060 is larger compared with that in the case of TGP-H-030. When the thickness of GDL is larger, the performance of O2 and H2O transfer is lower. Therefore, the function of MPL which exhausts H2O becomes more effective. In addition, the change in the concentration of O2 from the inlet to the outlet decreases with the increase in Tini with and without MPL, which can be explained by the discussion conducted for Figure 7 and Figure 8. Additionally, it is observed that the change in the concentration of O2 from the inlet to the outlet for A40%RH, C40%RH is smaller compared with that for A80%RH, C80%RH, which is the same tendency as the results for Nafion 115. The reason for this phenomenon is the same as described above, resulting that the trend of change in the molar concentration of O2 along with the gas flow through the gas channel on the interface between PEM and catalyst layer at cathode among different RH, GDL and Tini with and without MPL in the case of Nafion NRE-212 is similar to that in the case of Nafion 115.
Figure 11 and Figure 12 show comparisons of molar concentration of H2O along with the gas flow through the gas channel on the interface between PEM and catalyst layer at cathode among different RH, GDL and Tini with and without MPL in the case of Nafion 115, respectively. The results of A80%RH, C80%RH and A40%RH, C40%RH are shown in Figure 11 and Figure 12, respectively. In addition, the data at Tini = 373 K as well as that of TGP-H-060 without MPL are not shown in Figure 12 since the total voltage could not be obtained at the load current of 0.80 A/cm2 used for the initial condition in this numerical simulation due to the dry conditions.
According to Figure 11 and Figure 12, it is seen the molar concentration of H2O increases along with the gas flow through the gas channel irrespective of the thickness of GDL and Tini with and without MPL. It can be understood that the O2 reduction reaction, which produces H2O, is progressed along with the gas flow through the gas channel. It is also revealed that the change in the molar concentration of H2O from the inlet to the outlet is larger with MPL than that without MPL irrespective of the thickness of GDL, Tini, and RH condition. Due to the function of MPL which exhausts H2O, it is thought that the mass transfer is promoted. As a result, it is thought that the O2 reduction reaction producing H2O is progressed well. Additionally, the change in the concentration of H2O from the inlet to the outlet decreases with the increase in Tini with and without MPL. According to the previous studies [43,44], the proton conductivity of PEM increases with not only the increase in temperature but also the increase in RH. Due to the exponential increase in the saturation pressure of H2O vapor with temperature [42], it is easy to dehydrate PEM at higher temperature. As a result, the proton conductivity of PEM decreases at higher temperature. If the proton conductivity of PEM decreases, the performance of O2 reduction reaction drops due to the lack of proton. The hydration of PEM is not enough at higher temperatures, with the result that the high O2 partial pressure is needed to progress the O2 reduction reaction [42]. Consequently, it is thought that the change in the concentration of H2O from the inlet to the outlet, i.e., the amount of produced H2O from the inlet to the outlet, decreases with the increase in Tini. Furthermore, it is confirmed that the change in the concentration of H2O from the inlet to the outlet for A40%RH, C40%RH is smaller compared with that for A80%RH, C80%RH. Since A40%RH, C40%RH is the dry condition, PEM and catalyst layer are dehydrated easily [50]. The proton conductivity of PEM is smaller under a dry condition [49]. In addition, the RH influences the performance of the O2 reduction reaction occurring on the ionomer in the catalyst layer at the cathode [41]. There is the optimum H2O saturation for ionomer in the catalyst layer at cathode [23], which indicates the O2 reduction performance producing H2O is lower for A40%RH, C40%RH. Consequently, it can be claimed that the change in the concentration of H2O from the inlet to the outlet for A40%RH, C40%RH is smaller compared with that for A80%RH, C80%RH.
Figure 13 and Figure 14 show comparisons of molar concentration of H2O along with the gas flow through the gas channel on the interface between PEM and catalyst layer at cathode among different RH, GDL and Tini with and without MPL in the case of Nafion NRE-212, respectively. The results of A80%RH, C80%RH and A40%RH, C40%RH are shown in Figure 13 and Figure 14, respectively. In addition, the data at Tini = 373 K as well as that in the case of TGP-H-060 without MPL are not shown in Figure 14 since the total voltage could not be obtained at the load current of 0.80 A/cm2 used for the initial condition in this numerical simulation due to the dry condition.
According to Figure 13 and Figure 14, it is seen the molar concentration of H2O increases along with the gas flow through the gas channel irrespective of the thickness of GDL and Tini with and without MPL. It can be understood that the O2 reduction reaction, which produces H2O, is progressed along with the gas flow through the gas channel. It is also revealed that the change in the molar concentration of H2O from the inlet to the outlet is larger with MPL than that without MPL in the case of TGP-H-060, while that is smaller with MPL than that without MPL at 353 K and 363 K in the case of TGP-H-030 as shown in Figure 13. Regarding TGP-H-060, which is a thick GDL, the performance of O2 and H2O transfer is lower. Therefore, the function of MPL which exhausts H2O becomes more effective as discussed above. On the other hand, in the case of TGP-H-030 which is the thin GDL, it is thought that the performance of O2 and H2O transfer is higher even when the RH condition is A80%RH, C80%RH. In addition, Nafion NRE-212, which is the thin PEM is used in Figure 13 and Figure 14, resulting that the performance of proton and H2O transfer is better. Although it is believed that the actual RH in cell increases with the decrease in Tini due to the exponential increase in the saturation pressure of H2O vapor with temperature [42], the function of MPL which exhausts H2O works well. As a result, it is thought that the change in the molar concentration of H2O from the inlet to the outlet is smaller with MPL than that without MPL at 353 K and 363 K in the case of TGP-H-030. In addition, the change in the concentration of H2O from the inlet to the outlet decreases with the increase in Tini with and without MPL. The reason for this phenomenon is the same as explained for Figure 11 and Figure 12. Moreover, it is confirmed that the change in the concentration of H2O from the inlet to the outlet for A40%RH, C40%RH is smaller compared with that for A80%RH, C80%RH. Since A40%RH, C40%RH is the dry condition, PEM and catalyst layer are dehydrated easily [50,51]. The reason for this phenomenon is the same as explained for Figure 11 and Figure 12, which can be discussed irrespective of the thickness of PEM.
In this numerical simulation, the H2O is treated as a vapor, in other words, the phase change of H2O is not neglected. To validate this assumption, this study examines the saturation of H2O obtained by the numerical simulation. According to the estimation of saturation of H2O for all conditions investigated in this study, it is revealed that all of them are lower than 1.0, which indicates the H2O is a vapor. Consequently, it is proved that this assumption is reasonable for the investigated conditions in this study.
Figure 15 and Figure 16 show comparisons of current density along with the gas flow through the gas channel on the interface between PEM and catalyst layer at cathode among different RH, GDL and Tini with and without MPL in the case of Nafion 115, respectively. The results of A80%RH, C80%RH and A40%RH, C40%RH are shown in Figure 15 and Figure 16, respectively. In addition, the data at Tini = 373 K as well as that in the case of TGP-H-060 without MPL are not shown in Figure 16 since the total voltage could not be obtained at the load current of 0.80 A/cm2 used for the initial condition in this numerical simulation due to a dry condition.
According to Figure 15 and Figure 16, it is observed that the current density with MPL is larger than that without MPL, irrespective of the thickness of GDL, Tini, and RH condition. Since the thickness of PEM is large, the proton conductivity of PEM is smaller [45]. Therefore, it is believed that the function of MPL such as (i) reduction of ohmic losses due to enhancing the hydration of PEM [46], (ii) O2 diffusion in the catalyst layer due to discharging H2O [47], and (iii) back diffusion from the cathode to the anode caused by the increase in the H2O vaporized due to the increase in the temperature of the catalyst layer at the cathode [48] can work well. As a result, it is claimed that the current density with MPL is larger than that without MPL. In particular, this tendency is remarkable for the thicker GDL, i.e., TGP-H-060. Since the mass transfer performance in GDL is worse with the increase in thickness of GDL, it is thought that the function of MPL as described above works well. In addition, it is found that the current density decreases with the increase in Tini. Since the saturation pressure of H2O vapor increases with temperature exponentially [42], it is easy to dehydrate PEM at higher temperatures. The proton conductivity of PEM decreases with the increase in Tini, with the result that the performance of O2 reduction reaction drops due to the lack of proton. Moreover, since the hydration of PEM is not enough at higher temperatures, the high O2 partial pressure is needed to progress the O2 reduction reaction [42]. Consequently, the current density decreases with the increase in Tini due to the increase in ohmic over-potential and concentration over-potential [42].
To compare the simulation results with the experimental results, Figure 17 and Figure 18 show the polarization curve with and without MPL in the case of Nafion 115 at Tini = 353 K and 363 K [18,19], respectively. The results of A80%RH, C80%RH are shown in Figure 17 and Figure 18. According to Figure 17 and Figure 18, it is observed that the total voltage with MPL is larger, especially at high current density, than that without MPL irrespective of the thickness of GDL and Tini. In addition, this tendency is remarkable for the thicker GDL, i.e., TGP-H-060. This study has conducted the numerical simulation assumed to operate at the current density of 0.80 A/cm2, which follows the experimental condition [18,19]. These experimental results match the simulation results obtained by this study. Consequently, it is claimed that the simulation results obtained by this study can predict the experimental results.
Figure 19 and Figure 20 show comparisons of molar concentration of H2O along with the gas flow through the gas channel on the interface between PEM and catalyst layer at cathode among different RH, GDL and Tini with and without MPL in the case of Nafion NRE-212, respectively. The results of A80%RH, C80%RH and A40%RH, C40%RH are shown in Figure 19 and Figure 20, respectively. In addition, the data at Tini = 373 K as well as that of TGP-H-060 without MPL are not shown in Figure 18 since the total voltage could not be obtained at the load current of 0.80 A/cm2 used for the initial condition in this numerical simulation due to the dry condition.
According to Figure 19 and Figure 20, it is observed that the current density with MPL is larger than that without MPL in the case of TGP-H-060, while that with MPL is smaller than that without MPL at 353 K and 363 K in the case of TGP-H-030 as shown in Figure 20. This tendency matches that discussed for Figure 13 and Figure 14. Regarding TGP-H-060, which is the thick GDL, the performance of O2 and H2O transfer is lower. Therefore, the function of MPL which exhausts H2O becomes more effective as discussed above. As a result, the O2 reduction reaction is progressed, which provides the better power generation. On the other hand, in the case of TGP-H-030 which is the thin GDL, it is thought that the performance of O2 and H2O transfer is higher even the RH condition of A80%RH, C80%RH. In addition, Nafion NRE-211 which is the thin PEM is used in Figure 19 and Figure 20, resulting that the performance of proton and H2O transfer is better. Although it is believed that the actual RH in cell increases with the decrease in Tini due to the exponential increase in saturation pressure of H2O vapor with temperature [42], the function of MPL which exhausts H2O works well. As a result, it is thought that the change in the molar concentration of H2O, i.e., the amount of produced H2O, from the inlet to the outlet is smaller with MPL than that without MPL at 353 K and 363 K in the case of TGP-H-030. Since the actual RH is lower with MPL due to the small amount of H2O, the ohmic loss is larger. Therefore, the current density with MPL is smaller compared with that without MPL.
It is also seen from Figure 19 and Figure 20 that the current density for A80%RH, C80%RH is larger than that for A40%RH, C40%RH irrespective of Tini. High RH of supply gas provides the hydration of PEM and the increase in the H2O diffusivity through PEM as well as the decrease in the ohmic loss, resulting in higher current density [52,53].
From the above results and discussion, it is not easy to obtain high power generation performance by changing the thickness of PEM and GDL as well as using MPL at higher temperature such as 363 K and 373 K. Though the current density under the high RH condition exhibits the larger value compared with that under the low RH condition, it is necessary to investigate the procedure in order to improve the power generation performance more. The authors of this study think the reason why the power generation performance is lower at higher temperatures such as 363 K and 373 K is the dehydration of PEM and catalyst layer. In this study, it is confirmed that the amount of O2 consumption as well as the amount of H2O produced by the O2 reduction reaction is smaller at higher temperature such as 363 K and 373 K. Therefore, it can be suggested that the equipment to humidify the gas is added to the cell of PEFC, e.g., installment into the gas channel of separator. Or, the design and control of thermal properties, e.g., thermal conductivity and heat capacity, of MPL, catalyst layer, GDL, and separator are effective to remove the heat generated from power generation. If the heat is removed smoothly, the dehydration of PEM and catalyst layer can be prevented.
As to the degradation of PEM operated at high temperatures, the authors had conducted the experimental investigation using a Nafion membrane which seems to be degraded easily at higher temperatures such as 363 K and 373 K [19]. In this experiment, it was confirmed that the Nafion membrane could maintain the performance over the power generation operation of 200 h. However, it is necessary to study the characteristics of Nafion membranes operated for longer operation times, e.g., 90,000 h (=10 years), which is the target operation time according to NEDO road map 2010 in Japan [54], for the practical application of the PEFC system. The authors would like to conduct the stability and repetition tests in the near future.

4. Conclusions

The impact of the thickness of GDL and MPL on distributions of gas, H2O, and current density on the interface between PEM and catalyst layer in a single cell of PEFC operated from 353 K to 373 K have been investigated changing the thickness of PEM. The 3D numerical simulation model to estimate the above-described distributions has been developed in this study. The RH of supply gas has been also changed to clarify the characteristics under a well-humidified condition and a dry condition. From the investigation, the following conclusions have been obtained:
(i)
The molar concentration of O2 decreases along the gas channel with and without MPL irrespective of the thickness of PEM and GDL as well as Tini. The change in the molar concentration of O2 from the inlet to the outlet is larger with MPL than that without MPL. In addition, the change in the concentration of O2 from the inlet to the outlet for A40%RH, C40%RH is smaller compared with that for A80%RH, C80%RH irrespective of the thickness of PEM and GDL and Tini.
(ii)
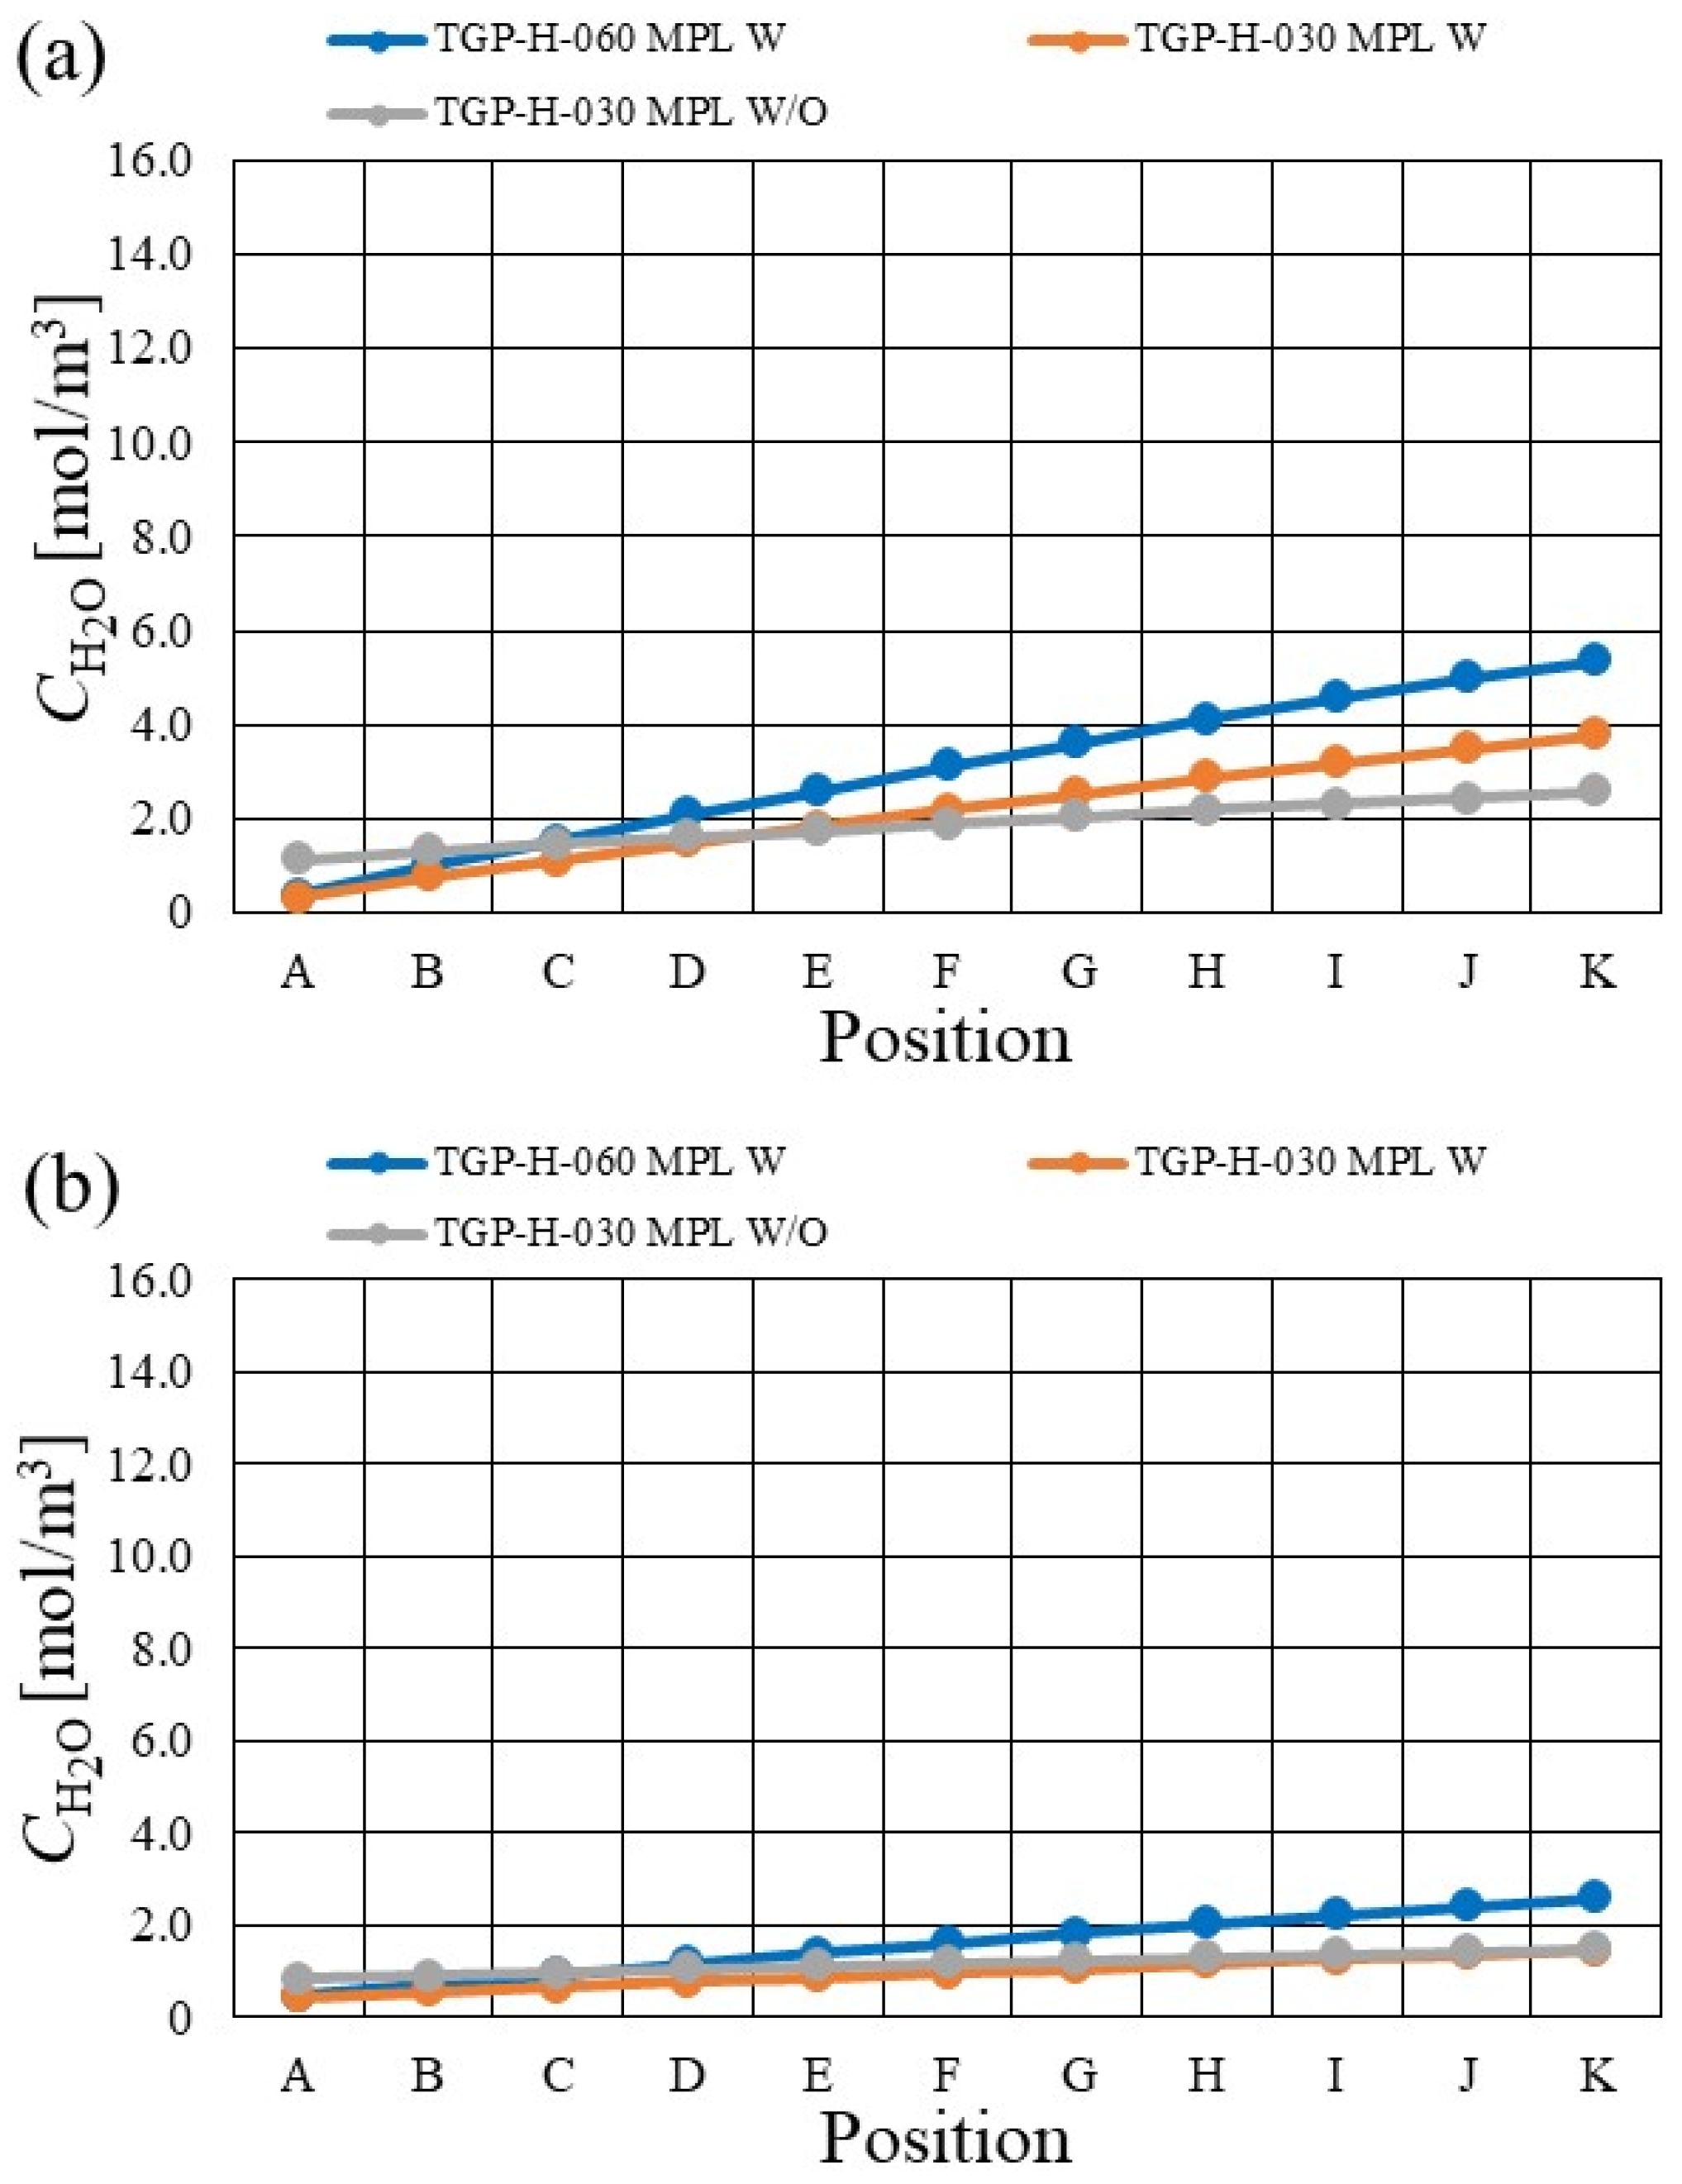
The molar concentration of H2O increases along the gas channel irrespective of the thickness of PEM, GDL and Tini with and without MPL, which follows the progress of the O2 reduction reaction.
(iii)
In the case of Nafion 115 which is the thick PEM, the change in the molar concentration of H2O along the gas channel is larger with MPL than that without MPL irrespective of the thickness of GDL, Tini and RH condition.
(iv)
In the case of Nafion NRE-212 which is the thin PEM, the change in the molar concentration of H2O along the gas channel is larger with MPL than that without MPL in the case of TGP-H-060, while that is smaller with MPL than that without MPL at 363 K and 363 K in the case of TGP-H-030. Although it is believed that the actual RH in cell increases with the decrease in Tini due to the exponential increase in the saturation pressure of H2O vapor with the temperature, the function of MPL which exhausts H2O works well when using thin PEM and GDL. As a result, the change in the molar concentration of H2O from the inlet to the outlet is smaller with MPL than that without MPL at 353 K and 363 K in the case of TGP-H-030.
(v)
The change in the concentration of H2O along the gas channel decreases with the increase in Tini with and without MPL, irrespective of the thickness of PEM and GDL as well as the RH condition.
(vi)
The change in the concentration of H2O along the gas channel for A40%RH, C40%RH is smaller compared with that for A80%RH, C80%RH with and without MPL, irrespective of the thickness of PEM and GDL.
(vii)
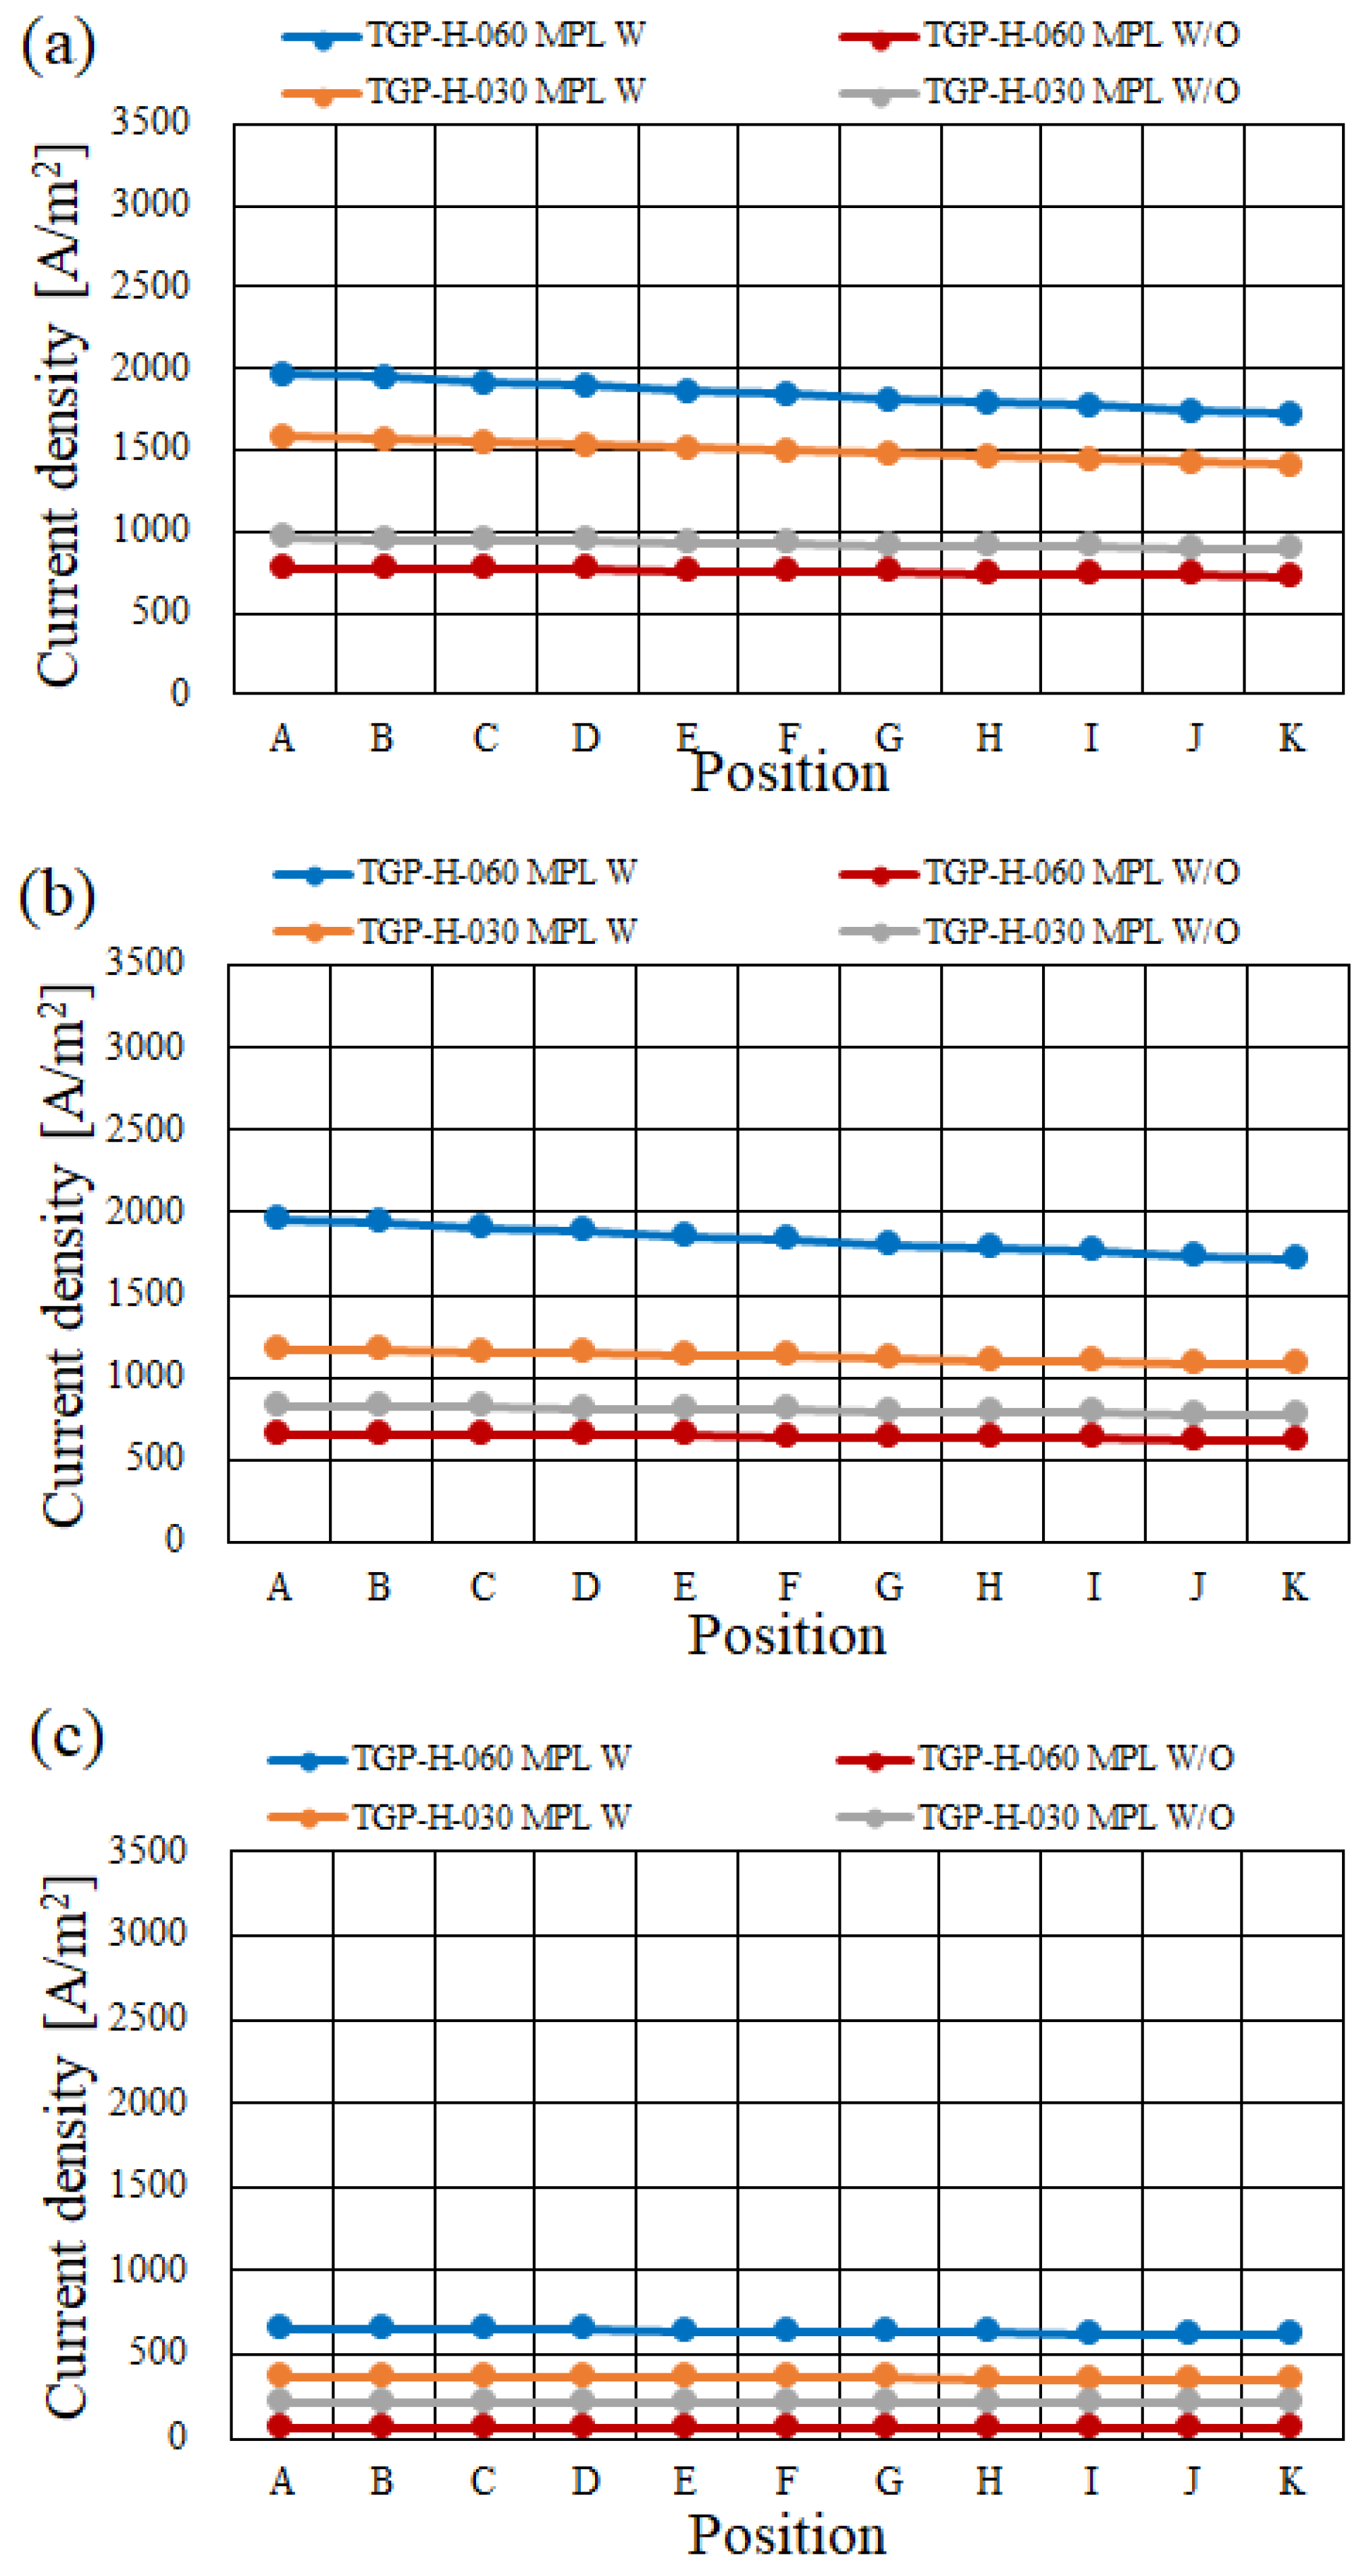
In the case of Nafion 115 which is the thick PEM, the current density with MPL is larger than that without MPL irrespective of the thickness of GDL, Tini and RH condition. Since the proton conductivity of PEM is smaller due to the thick PEM, the function of MPL works well.
(viii)
In the case of Nafion NRE-212 which is the thin PEM, the current density with MPL is larger than that without MPL in the case of TGP-H-060, while that with MPL is smaller than that without MPL at 353 K and 363 K in the case of TGP-H-030. Although it is believed that the actual RH in cell increases with the decrease in Tini due to the exponential increase in the saturation pressure of H2O vapor with temperature, the function of MPL which exhausts H2O works well when using the thin PEM and GDL. Since the actual RH is lower with MPL due to the small amount of H2O, the ohmic loss is larger. Therefore, the current density with MPL is smaller compared with that without MPL.
(ix)
As it is important to prevent the dehydration of PEM and catalyst layer in order to attain the higher power generation performance at higher temperature such as 363 K and 373 K, it is suggested that the equipment to humidify the gas is added to the cell of PEFC as well as the humidifier pre-installed for the gas supplied to the cell, e.g., installing it into the gas channel of the separator. Additionally, the smoothly removal of the heat generated from power generation by means of carefully designing and controlling the thermal properties of MPL, catalyst layer, GDL, and separator is also important.

Author Contributions

Conceptualization and writing—original draft preparation, A.N.; methodology and software, K.T. and D.M.; data curation, S.I.; writing—review and editing, E.H. All authors have read and agreed to the published version of the manuscript.

Funding

This research was funded by Mie University.

Institutional Review Board Statement

Not applicable.

Informed Consent Statement

Not applicable.

Data Availability Statement

Not applicable.

Conflicts of Interest

The authors declare no conflict of interest.

References

  1. NEDO (New Energy and Industry Technology Development Organization). Road Map 2017 of NEDO Fuel Cell and Hydrogen Technology Development. Available online: http://www.nedo.go.jp/cotent/100871973 (accessed on 28 July 2022). (In Japanese)
  2. Zhang, G.; Kandlikar, S.G.A. Critical review of cooling technique in proton exchange membrane fuel cell stacks. Int. J. Hydrogen Energy 2012, 37, 2412–2429. [Google Scholar] [CrossRef]
  3. Agbossou, K.; Kolhe, M.; Hamelin, J.; Bose, T.K. Performance of a stand-alone renewable energy system based on energy storage as hydrogen. IEEE Trans. Energy Convers. 2004, 19, 633–640. [Google Scholar] [CrossRef]
  4. Zhang, J.; Zhang, C.; Hao, D.; Ni, M.; Huang, S.; Liu, D.; Zheng, Y. 3D non-isothermal dynamic simulation of high temperature proton exchange membrane fuel cell in start-up process. Int. J. Hydrogen Energy 2021, 46, 2577–2593. [Google Scholar] [CrossRef]
  5. Li, Q.; He, R.; Jensen, J.O.; Bjerrum, N.J. Approaches and recent development polymer electrolyte membrane for fuel cells operating above 100 °C. Chem. Mater. 2003, 15, 4896–4915. [Google Scholar] [CrossRef]
  6. Lee, C.Y.; Wng, F.; Kuo, Y.W.; Tsai, C.H.; Cheng, Y.T.; Cheng, C.K.; Lin, J.T. In-situ measurement of high-temperature proton exchange membrane fuel cell stack using flexible five-in-one micro sensor. Sensors 2016, 16, 1731. [Google Scholar] [CrossRef]
  7. Lee, C.Y.; Weng, F.B.; Kuo, Y.W.; Cheng, Y.T.; Cheng, C.K.; Tsai, C.H.; Lee, T.J. Persistent effect test for high temperature resistant integrated microsensor embedded in high temperature proton exchange membrane fuel cell stack. Sens. Actuators A Phys. 2016, A250, 202–209. [Google Scholar] [CrossRef]
  8. Ryu, S.K.; Vinothkannan, M.; Kim, A.R.; Yoo, D.J. Effect of type and stoichiometry of fuels on performance of polybenzimidazole-based proton exchange membrane fuel cells operating at the temperature range of 120–160 °C. Energy 2022, 238, 121791. [Google Scholar] [CrossRef]
  9. Jin, Y.; Wang, T.; Che, X.; Dong, J.; Liu, R.; Yang, J. New high-performance bulky N-heterocyclic group functionalized poly(terphenyl piperidinium) membranes for HT-PEMFC applications. J. Membr. Sci. 2022, 641, 119884. [Google Scholar] [CrossRef]
  10. Zhang, J.; Wang, H.; Li, W.; Zhang, J.; Lu, D.; Yan, W.; Xiang, Y.; Lu, S. Effect of catalyst layer microstructure on performance and stability for high temperature polymer electrolyte membrane fuel cells. J. Power Sources 2021, 505, 230059. [Google Scholar] [CrossRef]
  11. Nanadegani, F.S.; Lay, E.N.; Sunden, B. Computational analysis of the impact of a micro porous layer (MPL) on the characteristics of a high temperature PEMFC. Electrochim. Acta 2020, 333, 135552. [Google Scholar] [CrossRef]
  12. Fu, X.; Li, T.; Tang, L.; Deng, X.; Zhang, R.; Hu, S.; Zhao, F.; Li, X.; Liu, Q. Reticulated polyaniline nanowires as a cathode microporous layer for high-temperature PEMFCs. Int. J. Hydrogen Energy 2021, 46, 8802–8809. [Google Scholar] [CrossRef]
  13. Kanchan, B.K.; Randive, P.; Pati, S. Implications of non-uniform porosity distribution in gas diffusion layer on the performance of a high temperature PEM fuel cell. Int. J. Hydrogen Energy 2021, 46, 18571–18588. [Google Scholar] [CrossRef]
  14. Xia, L.; Ni, M.; He, Q.; Xu, Q.; Cheng, C. Optimization of gas diffusion layer in high temperature PEMFC with the focuses on thickness and porosity. Appl. Energy 2021, 300, 117357. [Google Scholar] [CrossRef]
  15. Xu, Y.; Fan, R.; Chang, G.; Xu, S.; Cai, T. Investigating temperature-driven water transport in cathode gas diffusion media of PEMFC with a non-isothermal, two-phase model. Energy Convers. Manag. 2021, 248, 114791. [Google Scholar] [CrossRef]
  16. Zhang, T.; Li, J.; Li, Q.; Yu, M.; Sun, H. Combination effects of flow field structure and assembly force on performance of high temperature proton exchange membrane fuel cells. Int. J. Energy Res. 2021, 45, 7903–7917. [Google Scholar] [CrossRef]
  17. Hoppe, E.; Janssen, H.; Muller, M.; Lehnert, W. The impact of flow field plate misalignment on the gas diffusion layer intrusion and performance of a high-temperature polymer electrolyte fuel. J. Power Sources 2021, 501, 230036. [Google Scholar] [CrossRef]
  18. Nishimura, A.; Kamiya, S.; Okado, T.; Sato, Y.; Hirota, M.; Kolhe, M.L. Heat and mass transfer analysis in single cell of PEFC using different PEM and GDL at higher temperature. Int. J. Hydrogen Energy 2019, 44, 29631–29640. [Google Scholar] [CrossRef]
  19. Nishimura, A.; Okado, T.; Kojima, Y.; Hirota, M.; Hu, E. Impact of MPL on temperature distribution in single polymer electrolyte fuel cell with various thickness of polymer electrolyte membrane. Energies 2020, 13, 2499. [Google Scholar] [CrossRef]
  20. Nishimura, A.; Okado, T.; Kojima, Y.; Hu, E. Impact of microporous layer on heat and mass transfer in a single cell of polymer electrolyte fuel cell using a thin polymer electrolyte membrane and a thin gas diffusion layer operated at a high-temperature range. ACS Omega 2021, 6, 14575–14584. [Google Scholar] [CrossRef]
  21. Nishimura, A.; Sato, Y.; Kamiya, S.; Okado, T.; Yamamoto, K.; Hirota, M.; Hu, E. Impact of thickness of polymer electrolyte membrane and gas diffusion layer on temperature distribution in polymer electrolyte fuel cell operated at temperature around 90 °C. J. Energy Power Eng. 2019, 13, 97–115. [Google Scholar] [CrossRef]
  22. Nishimura, A.; Yamamoto, K.; Okado, T.; Kojima, Y.; Hirota, M.; Kolhe, M.L. Impact analysis of MPL and PEM thickness on temperature distribution within PEFC operating at relatively higher temperature. Energy 2020, 205, 117875. [Google Scholar] [CrossRef]
  23. Nishimura, A.; Kono, N.; Toyoda, K.; Kojima, Y.; Kolhe, M.L. Impact analysis of MPL on a PEFC cell’s temperature distribution with thin PEM and GDL for operating at higher temperature than usual. J. Energy Power Eng. 2021, 15, 39–51. [Google Scholar] [CrossRef]
  24. Nishimura, A.; Toyoda, K.; Kojima, Y.; Ito, S.; Hu, E. Numerical simulation on impacts of thickness of nafion series membranes and relative humidity on PEMFC operated at 363 K and 373 K. Energies 2021, 14, 8256. [Google Scholar] [CrossRef]
  25. Das, S.K.; Gibson, H.A. These dimensional multi-physics modeling and simulation for assessment of mass transport impact on the performance of a high temperature polymer electrolyte membrane fuel cell. J. Power Sources 2021, 499, 161–188. [Google Scholar] [CrossRef]
  26. Zhang, S.Y.; Qu, Z.G.; Xu, H.T.; Talkhoncheh, F.K.; Liu, S.; Gao, Q. A Numerical study on the performance of PEMFC with wedge-shaped fins in the cathode channel. Int. J. Hydrogen Energy 2021, 46, 27700–27708. [Google Scholar] [CrossRef]
  27. Chen, H.; Guo, H.; Ye, F.; Ma, C.F. Improving two-phase mass transportation under non-darcy flow effect in oriented-type flow channels of proton exchange membrane fuel cells. Int. J. Hydrogen Energy 2021, 46, 21600–21618. [Google Scholar] [CrossRef]
  28. Chen, H.; Guo, H.; Ye, F.; Ma, C.F. A numerical study of oriented-type flow channels with porous-blocked baffles of proton exchange membrane fuel cells. Int. J. Hydrogen Energy 2021, 46, 29443–29458. [Google Scholar] [CrossRef]
  29. Penga, Z.; Tolj, I.; Barbir, F. Computational fluid dynamics study of PEM fuel cell performance. Int. J. Hydrogen Energy 2016, 41, 17585–17594. [Google Scholar] [CrossRef]
  30. Freunberger, S.A.; Reum, M.; Evertz, J.; Wokuan, A.; Buchi, F.M. Measuring the current distribution in PEFCs with sub-millimeter resolution. J. Electrochem. Soc. 2006, 153, A2158–A2165. [Google Scholar] [CrossRef]
  31. Nishimura, A.; Sato, A.; Yoshimura, M.; Kamiya, S.; Hirota, M. Impact of thickness of polymer electrolyte membrane on temperature distribution in single cell of polymer electrolyte fuel cell operated at high temperature. J. Energy Power Eng. 2018, 12, 80–92. [Google Scholar] [CrossRef]
  32. Nishimura, A.; Shibuya, K.; Morimoto, A.; Tanaka, S.; Hirota, M.; Nakamura, M.; Kojima, Y.; Narita, M.; Hu, E. Dominant factor and mechanism of coupling phenomena in single cell of polymer electrolyte fuel cell. Appl. Energy 2012, 1, 73–79. [Google Scholar] [CrossRef]
  33. Copper, N.J.; Santamaria, A.D.; Becton, M.K.; Park, J.W. Neutron radiography measurements of in-situ PEMFC liquid water saturation in 2D & 3D morphology gas diffusion layers. Int. J. Hydrogen Energy 2017, 42, 6269–16278. [Google Scholar]
  34. The Japan Society of Mechanical Engineers. JSME Heat Transfer Handbook, 1st ed.; The Japan Society of Mechanical Engineers: Tokyo, Japan; Maruzen: Tokyo, Japan, 1993; p. 387. [Google Scholar]
  35. Reid, R.C.; Prausnitz, J.M.; Poling, B.E. The Properties of Gases and Liquids, 1st ed.; McGraw-Hill: Columbus, TX, USA, 1987; p. 591. [Google Scholar]
  36. Merck. Available online: http://www.sigmaaldrich.com/japan/materialscience/alternative/nafion.html (accessed on 5 November 2021).
  37. Senn, S.M.; Poulikakos, D. Polymer electrolyte fuel cells with porous materials as fluid distributors and comparisons with traditional channeled systems. Trans. ASME 2004, 126, 410–418. [Google Scholar] [CrossRef]
  38. Kang, K.; Ju, H. Numerical modeling and analysis of micro-porous layer effects in polymer electrolyte fuel cells. J. Power Sources 2006, 194, 763–773. [Google Scholar] [CrossRef]
  39. TORAY. Available online: http://www.torayca.com/en/lineup/composites/com_009_01.html (accessed on 5 November 2021).
  40. Takayama, T. Numerical simulation of transient internal states of PEFC cell and stack considering control of anode system. Res. Rep. Mizuho Res. Technol. 2018, 9, 1–14. [Google Scholar]
  41. Rostami, L.; Nejad, P.M.G.; Vatani, A. A numerical investigation of serpentine flow channel with different bend sizes in polymer electrolyte membrane fuel cells. Energy 2016, 97, 400–410. [Google Scholar] [CrossRef]
  42. Xing, L.; Das, P.K.; Song, X.; Mamlouk, M.; Scott, K. Numerical analysis of the optimum membrane/ionomer water content of PEMFCs: The interface of nafion ionomer content and cathode relative humidity. Appl. Energy 2015, 138, 242–257. [Google Scholar] [CrossRef]
  43. Akimoto, F.; Sasabe, T.; Yoshida, T.; Naito, H.; Kawamura, K.; Hirai, S. Investigation of effects of high temperature and pressure on a polymer electrolyte fuel cell with polarization analysis and X-ray imaging of liquid water. J. Power Sources 2019, 431, 205–209. [Google Scholar]
  44. Jia, T.; Shen, S.; Zhao, J.; Jin, J.; Pan, B.; Duan, X.; Meng, C.; Che, Q. Ultrathin membranes formation via the layer by layer self-assembly of carbon natotubes-based inorganics as high temperature proton exchange membranes. Int. J. Hydrogen Energy 2020, 45, 14517–14527. [Google Scholar] [CrossRef]
  45. Wong, C.Y.; Wong, W.Y.; Ramya, K.; Khalid, M.; Loh, K.S.; Daud, W.R.W.; Lim, K.L.; Walvekar, R.; Kadhum, A.A.H. Additives in proton exchange membranes for low- and high-temperature fuel cell applications: A review. Int. J. Hydrogen Energy 2019, 44, 6116–6135. [Google Scholar] [CrossRef]
  46. Ferreria, R.B.; Falcao, D.S.; Oliveira, V.B.; Pinto, A.M.F.R. Experimental study on the membrane electrode assembly of a proton exchange membrane fuel cell: Effects of microporous layer, membrane thickness and gas diffusion layer hydrophobic treatment. Electrochim. Acta 2017, 224, 337–345. [Google Scholar] [CrossRef]
  47. Zamel, N.; Becker, J.; Wiegmann, A. Estimating the thermal conductivity and diffusion coefficient for the microporous layer of polymer electrolyte membrane fuel cells. J. Power Sources 2012, 207, 70–80. [Google Scholar] [CrossRef]
  48. Blanco, M.; Wilkinson, D.P. Investigation of the effect of microporous layers on water management in a proton exchange membrane fuel cell using novel diagnostic methods. Int. J. Hydrogen Energy 2014, 39, 16390–16404. [Google Scholar] [CrossRef]
  49. Zhou, J.; Shukla, S.; Putz, A.; Secanell, M. Analysis of the role of the microporous layer in improving polymer electrolyte fuel cell performance. Electrochim. Acta 2018, 268, 366–382. [Google Scholar] [CrossRef]
  50. Springer, T.E.; Zowodzinski, T.A.; Gottesfeld, S. Polymer electrolyte fuel cell model. J. Electrochem. Soc. 1991, 138, 2334–2342. [Google Scholar] [CrossRef]
  51. Nishimura, A.; Kojima, Y.; Ito, S.; Hu, E. Impacts of separator thickness on temperature distributions and power generation characteristics of a single PEMFC operated at higher temperature of 363 and 373 K. Energies 2022, 15, 1558. [Google Scholar] [CrossRef]
  52. Liu, F.; Lu, G.; Wang, C.Y. Water transport coefficient distribution through the membrane in a polymer electrolyte fuel cell. J. Membr. Sci. 2007, 287, 126–131. [Google Scholar] [CrossRef]
  53. Kim, H.Y.; Kim, K. Numerical study on the effects of gas humidity on proton-exchange membrane fuel cell performance. Int. J. Hydrogen Energy 2016, 41, 11776–11783. [Google Scholar] [CrossRef]
  54. NEDO (New Energy and Industry Technology Development Organization). Road Map 2010 of NEDO Fuel Cell and Hydrogen Technology Development. Available online: http://www.nedo.go.jp/cotent/100642947 (accessed on 2 August 2022). (In Japanese)
Figure 1. Comparison of in-plane molar concentration distribution of O2 on the interface between PEM and catalyst layer at cathode among different PEM, GDL, and Tini with MPL (A80%RH, C80%RH; Left: 353 K, Center: 363 K, Right: 373 K).
Energies 15 05936 g001
Figure 2. Comparison of in-plane molar concentration distribution of O2 on the interface between PEM and catalyst layer at cathode among different PEM, GDL, and Tini without MPL (A80%RH, C80%RH; Left: 353 K, Center: 363 K, Right: 373 K).
Energies 15 05936 g002
Figure 3. Comparison of in-plane molar concentration distribution of H2O on the interface between PEM and catalyst layer at cathode among different PEM, GDL, and Tini with MPL (A80%RH, C80%RH; Left: 353 K, Center: 363 K, Right: 373 K).
Energies 15 05936 g003
Figure 4. Comparison of in-plane molar concentration distribution of H2O on the interface between PEM and catalyst layer at cathode among different PEM, GDL, and Tini without MPL (A80%RH, C80%RH; Left: 353 K, Center: 363 K, Right: 373 K).
Energies 15 05936 g004
Figure 5. Comparison of in-plane current density distribution on the interface between PEM and catalyst layer at cathode among different PEM, GDL, and Tini with MPL (A80%RH, C80%RH; Left: 353 K, Center: 363 K, Right: 373 K).
Energies 15 05936 g005
Figure 6. Comparison of in-plane current density distribution on the interface between PEM and catalyst layer at cathode among different PEM, GDL, and Tini without MPL (A80%RH, C80%RH; Left: 353 K, Center: 363 K, Right: 373 K).
Energies 15 05936 g006
Figure 7. Comparison of molar concentration of O2 along with the gas flow through the gas channel on the interface between PEM and catalyst layer at cathode among different GDL and Tini with and without MPL (Nafion 115; A80%RH, C80%RH; (a) 353 K, (b) 363 K, (c) 373 K).
Energies 15 05936 g007
Figure 8. Comparison of molar concentration of O2 along with the gas flow through the gas channel on the interface between PEM and catalyst layer at cathode among different GDL and Tini with and without MPL (Nafion 115; A40%RH, C40%RH; (a) 353 K, (b) 363 K).
Energies 15 05936 g008
Figure 9. Comparison of molar concentration of O2 along with the gas flow through the gas channel on the interface between PEM and catalyst layer at cathode among different GDL and Tini with and without MPL (Nafion NRE-212; A80%RH, C80%RH; (a) 353 K, (b) 363 K, (c) 373 K).
Energies 15 05936 g009
Figure 10. Comparison of molar concentration of O2 along with the gas flow through the gas channel on the interface between PEM and catalyst layer at cathode among different GDL and Tini with and without MPL (Nafion NRE-212; A40%RH, C40%RH; (a) 353 K, (b) 363 K).
Energies 15 05936 g010
Figure 11. Comparison of molar concentration of H2O along with the gas flow through the gas channel on the interface between PEM and catalyst layer at cathode among different GDL and Tini with and without MPL (Nafion 115; A80%RH, C80%RH; (a) 353 K, (b) 363 K, (c) 373 K).
Energies 15 05936 g011
Figure 12. Comparison of molar concentration of H2O along with the gas flow through the gas channel on the interface between PEM and catalyst layer at cathode among different GDL and Tini with and without MPL (Nafion 115; A40%RH, C40%RH; (a) 353 K, (b) 363 K).
Energies 15 05936 g012
Figure 13. Comparison of molar concentration of H2O along with the gas flow through the gas channel on the interface between PEM and catalyst layer at cathode among different GDL and Tini with and without MPL (Nafion NRE-212; A80%RH, C80%RH; (a) 353 K, (b) 363 K, (c) 373 K).
Energies 15 05936 g013
Figure 14. Comparison of molar concentration of H2O along with the gas flow through the gas channel on the interface between PEM and catalyst layer at cathode among different GDL and Tini with and without MPL (Nafion NRE-212; A40%RH, C40%RH; (a) 353 K, (b) 363 K).
Energies 15 05936 g014
Figure 15. Comparison of current density along with the gas flow through the gas channel on the interface between PEM and catalyst layer at cathode among different GDL and Tini with and without MPL (Nafion 115; A80%RH, C80%RH; (a) 353 K, (b) 363 K, (c) 373 K).
Energies 15 05936 g015
Figure 16. Comparison of current density along with the gas flow through the gas channel on the interface between PEM and catalyst layer at cathode among different GDL and Tini with and without MPL (Nafion 115; A40%RH, C40%RH; (a) 353 K, (b) 363 K).
Energies 15 05936 g016
Figure 17. Comparison of polarization curve with and without MPL (Nafion 115; A80%RH, C80%RH; 353 K; (a) TGP-H-060, (b) TGP-H-030).
Energies 15 05936 g017
Figure 18. Comparison of polarization curve with and without MPL (Nafion 115; A80%RH, C80%RH; 363 K; (a) TGP-H-060, (b) TGP-H-030).
Energies 15 05936 g018
Figure 19. Comparison of current density along with the gas flow through the gas channel on the interface between PEM and catalyst layer at cathode among different GDL and Tini with and without MPL (Nafion NRE-212; A80%RH, C80%RH; (a) 353 K, (b) 363 K, (c) 373 K).
Energies 15 05936 g019
Figure 20. Comparison of current density along with the gas flow through the gas channel on the interface between PEM and catalyst layer at cathode among different GDL and Tini with and without MPL (Nafion NRE-212; A40%RH, C40%RH; (a) 353 K, (b) 363 K).
Energies 15 05936 g020
Table 1. Geometrical parameters of 3D model adopted for the numerical simulation in this study [14,29,30,31,32].
Components of CellSizeCharacteristics
PEM50.0 mm × 50.0 mm × 0.127 mm (for Nafion 115) and 0.051 mm (for Nafion NRE-212)Nafion 115 and Nafion NRE-212 (manufactured by Du Pont Corp.)
Catalyst layer50.0 mm × 50.0 mm × 0.01 mmPt/C (Pt: 20 wt%)
MPL50.0 mm × 50.0 mm × 0.003 mmPTFE + carbon black
GDL50.0 mm × 50.0 mm × 0.19 mm (for TGP-H-060) and 0.11 mm (for TGP-H-030)TGP-H-060 and TGP-H-030 (manufactured by Toray Corp.)
Gas separator50.0 mm × 50.0 mm × 2.00 mm
(thickness of rib: 1.00 mm)
(width of gas channel and rib: 1.0 mm,
thickness of gas channel: 1.0 mm)
Carbon graphite,
serpentine
Table 2. Physical parameters adopted for the numerical simulation in this study.
ParameterValue
Density of H2 [kg/m3]7.10 × 10−2 (353 K), 6.89 × 10⁻² (363 K),
6.69 × 10⁻² (373 K) [33]
Density of O2 [kg/m3]1.11 (353 K), 1.08 (363 K), 1.05 (373 K)
[33]
Density of H2O [kg/m3]2.95 × 10−1 (353 K), 4.26 × 10⁻¹ (363 K),
6.01 × 10⁻¹ (373 K) [33]
Viscosity of H2 [Pa·s]9.96 × 10⁻⁶ (353 K), 1.02 × 10⁻⁵ (363 K),
1.03 × 10⁻⁵ (373 K) [33]
Viscosity of O2 [Pa·s]2.35 × 10⁻⁵ (353 K), 2.40 × 10⁻⁵ (363 K),
2.45 × 10⁻⁵ (373 K) [33]
Viscosity of H2O [Pa·s]1.16 × 10⁻⁵ (353 K), 1.19 × 10⁻⁵ (363 K),
1.23 × 10⁻⁵ (373 K) [33]
Binary diffusion coefficient between H2 and H2O [m2/s]9.27 × 10−5 [34]
Binary diffusion coefficient between O2 and H2O [m2/s]3.57 × 10−5 [34]
Porosity of catalyst layer [-]0.78 [14,22,30,31,32]
Permeability of catalyst layer [m2]8.69 × 10⁻¹² [14,22,30,31,32]
Porosity of MPL [-]0.60 [14,22,30,31,32]
Permeability of MPL [m2]1.00 × 10⁻¹³ [14,22,30,31,32]
Porosity of GDL [-]0.78 [14,22,30,31,32]
Permeability of GDL [m2]8.69 × 10⁻¹² [14,22,30,31,32]
Conductivity of PEM [S/m]10 [35]
Conductivity of catalyst layer [S/m]53 [36]
Conductivity of MPL [S/m]1000 [37]
Conductivity of GDL [S/m]1250 [38]
Anode reference equilibrium potential [V]0
Cathode reference equilibrium potential [V]1.229
Anode reference exchange current
density [A/m2]
1000 [39]
Cathode reference exchange current density [A/m2]1 [39]
Anode charge transfer coefficient [-]0.5 [40]
Cathode charge transfer coefficient [-]0.5 [41]
Table 3. Operation conditions adopted for the numerical simulation in this study.
ConditionValue
The initial temperature of cell (Tini) [K]353, 363, 373
Cell voltage [V]Experimental data are applied [18,19]
Supply gas conditionAnodeCathode
Gas typeH2O2
Temperature of supply gas at inlet [K]353, 363, 373353, 363, 373
RH of supply gas [%RH]40, 8040, 80
Pressure of supply gas at inlet (absolute) [MPa]0.40.4
Flow rate of supply gas at inlet [NL/min] (Stoichiometric ratio [-])0.210 (1.5)0.105 (1.5)
Publisher’s Note: MDPI stays neutral with regard to jurisdictional claims in published maps and institutional affiliations.

