Abstract
In the pursuit of more efficient vehicles on the world’s roads, the vehicle thermal management system has become a limiting factor when it comes to EV range and battery life. In extreme climates, if the thermal system cannot pull down or warm up the EV powertrain in a timely manner, the battery is at serious risk of capacity loss or accelerated degradation. As waste heat is inherently limited with EVs, the way in which we provide the heat for warm-up must be as efficient as possible to reduce the load on the battery. In this paper, a revolutionary waste heat recovery (WHR) thermal management system designed by Tesla, nicknamed the ‘Octovalve’, is described, modelled, and simulated. This paper contributes to collective knowledge by presenting an in-depth breakdown of the key operating modes and outlining the potential benefits. Modelled in the multidomain Simulink Simscape software, the octovalve’s performance is directly compared to a typical EV WHR thermal management system. The system under analysis is shown to significantly reduce EV energy consumption and battery load during warm-up but at the cost of overall warm-up time. Unlike any other WHR system found in literature, this system has a heat pump with can perform air conditioning and heat pump tasks simultaneously, which is shown to have a remarkable impact on energy efficiency and battery life.
1. Introduction
With the International Energy Agency reporting a 57% rise in global carbon dioxide (CO2) emissions from 1990, the world now produces an estimated 30 billion tonnes of CO2 each year, with road transport roughly accounting for 18% of the total [1]. These reported emissions are a direct result of an increased demand for travel, sourced by factors such as population growth, economic growth, and urban sprawl. As a reaction to these figures and increasing demands by legislative authorities to rapidly reduce vehicle emissions, the industry has seen a rise in OEMs announcing the electrification of their vehicle fleets. Soon all automotive companies will move away from the conventional internal combustion engine vehicle (ICEV) to the more efficient hybrid electric (HEV) and battery electric vehicles (BEV).
BEVs currently offer the most efficient and cost-effective mode of transport, with the potential to reduce our dependence on fossil fuels and lower greenhouse gas emissions. At present, the main issues with BEVs are the limited range, charging facilities, and battery life/recyclability. Tesla is currently leading the way with BEV technology, being an exclusively BEV automotive company and selling almost 1 million units in recent years [2]. Ahead of most OEMs, Tesla is already focusing on the flaws with BEVs. Notably, the issue surrounding extreme climates and the effects this has on BEV range, battery life, and performance.
It has been found that the thermal management system (TMS) is one of the largest range limiting systems for BEVs [3]. The TMS is responsible for maintaining the powertrain operating conditions and providing effective climate control to the cabin. For conventional internal combustion engines (ICEV), the purpose of the TMS is to regulate engine temperature to create an environment for optimal combustion and minimal emissions. Furthermore, the TMS controls oil viscosity, so the correct boundary layer is maintained between components to avoid early engine wear, thermal oil breakdown or unnecessary viscous friction. Due to the inherently large heat loss of internal combustion engines (ICE), in cold climates, the engine heat can be used to heat the cabin. While in hot climates, fresh air or a separate air conditioning (AC) system is used.
BEVs do not have this high level of waste heat due to the naturally higher efficiency of the electric powertrain. As a result, heating the cabin by other means, such as the PTC heater, has led to higher energy consumption when exposed to extremely cold climates. However, heating the cabin is not the only issue which arises with the BEV TMS. The TMS now has three major powertrain components to manage: the battery, motor, and inverter. Lithium-ion batteries suffer significant losses in cold temperatures below room temperature. This is because of reduced energy capabilities, increased impedance, as well as severe battery degradation due to lithium plating [4,5,6,7,8]. Whereas, when it is too hot, the battery is at risk of loss of active material, solid electrolyte interface decomposition and internal reaction, which will ultimately lead to thermal runaway [9,10,11,12]. On the other hand, motors and inverters tend to be less sensitive to temperature. Generally, electric motors and inverters suffer limited effects in low-temperature climates. However, electric motors can suffer from demagnetisation and rotor slip in high temperatures [13,14]. While for inverters, higher temperatures can lead to accelerating power loss and material fatigue failure [15,16,17].
BEV TMS design has undergone heavy development in recent years with the help of OEMs and the research community. There are simple TMS designs which use the standard vapour compression cycle and positive temperature coefficient heater (PTC) to serve the cabin and a simple radiator coolant loop to maintain inverter and electric motor temperature [18,19]. For the battery, these systems use the battery management system (BMS) to adjust power limits, reducing heat generation, which leads to battery overheating [20]. To combat lithium-ion battery ageing, degradation, and thermal runaway, it has become a common practice to include a third loop responsible for controlling lithium-ion battery temperature to a 15 °C to 35 °C range [21]. This temperature range is so close to normal ambient that cooling using a radiator would not be feasible. Thus, it is common to see the battery loop connected to the AC refrigeration circuit using a two-phase thermal liquid evaporator, known as a chiller [21]. To prevent battery increased impedance and lithium plating due to cold temperatures, it is normal to see a PTC heater for heating coolant entering the battery or to directly heat the battery casing. Running an AC compressor naturally requires a lot of power, resulting in a reduction in BEV range. Consequently, some systems include a second radiator for battery cooling in cold climates [22]. The radiator works in unison with the chiller for battery cooling to cover battery temperature regulation in all climates. In cold climates, using the radiator instead of the chiller will significantly reduce energy consumption. New waste heat recovery (WHR) systems have been the focus of research lately [23]. These systems tend to use complex coolant circuits with many valves to connect the battery, inverter, electric motor, and HVAC to move waste heat to limited systems, rather than rejecting waste heat straight to ambient.
This paper will discuss a new WHR system designed by Tesla with a unique heat pump and coolant circuit. It is the only system of its kind to have a single heat exchanger in the radiator pack, which functions as a radiator, condenser, and evaporator. The novelty of this paper is in the discussion, modelling, and simulation of the new WHR system. This report is separated into four key sections, a discussion of the patent and all its key operating modes, a discussion of the difference between the patent and the system in production, followed by modelling, simulation, and a discussion of the results.
2. Octovalve Patent
Tesla, the world’s leading electric vehicle manufacturer, has developed a revolutionary heat pump thermal management system for the Model Y, which is a patented design [24] and is analysed by Sandy Munro [25]. Sandy Munro [25] describes the octovalve system, which is capable of redirecting coolant to control all heating/cooling demands with 15 operating modes for extreme ambient conditions [24].
There are a few differences between the systems patent and the system in production; however, the way in which these systems operate is largely the same. The following sections contain a brief description of the patented heat pump design, present the differences between the patent and production system, and summarise the modes of operation.
2.1. Thermo-Fluid Circuit Design
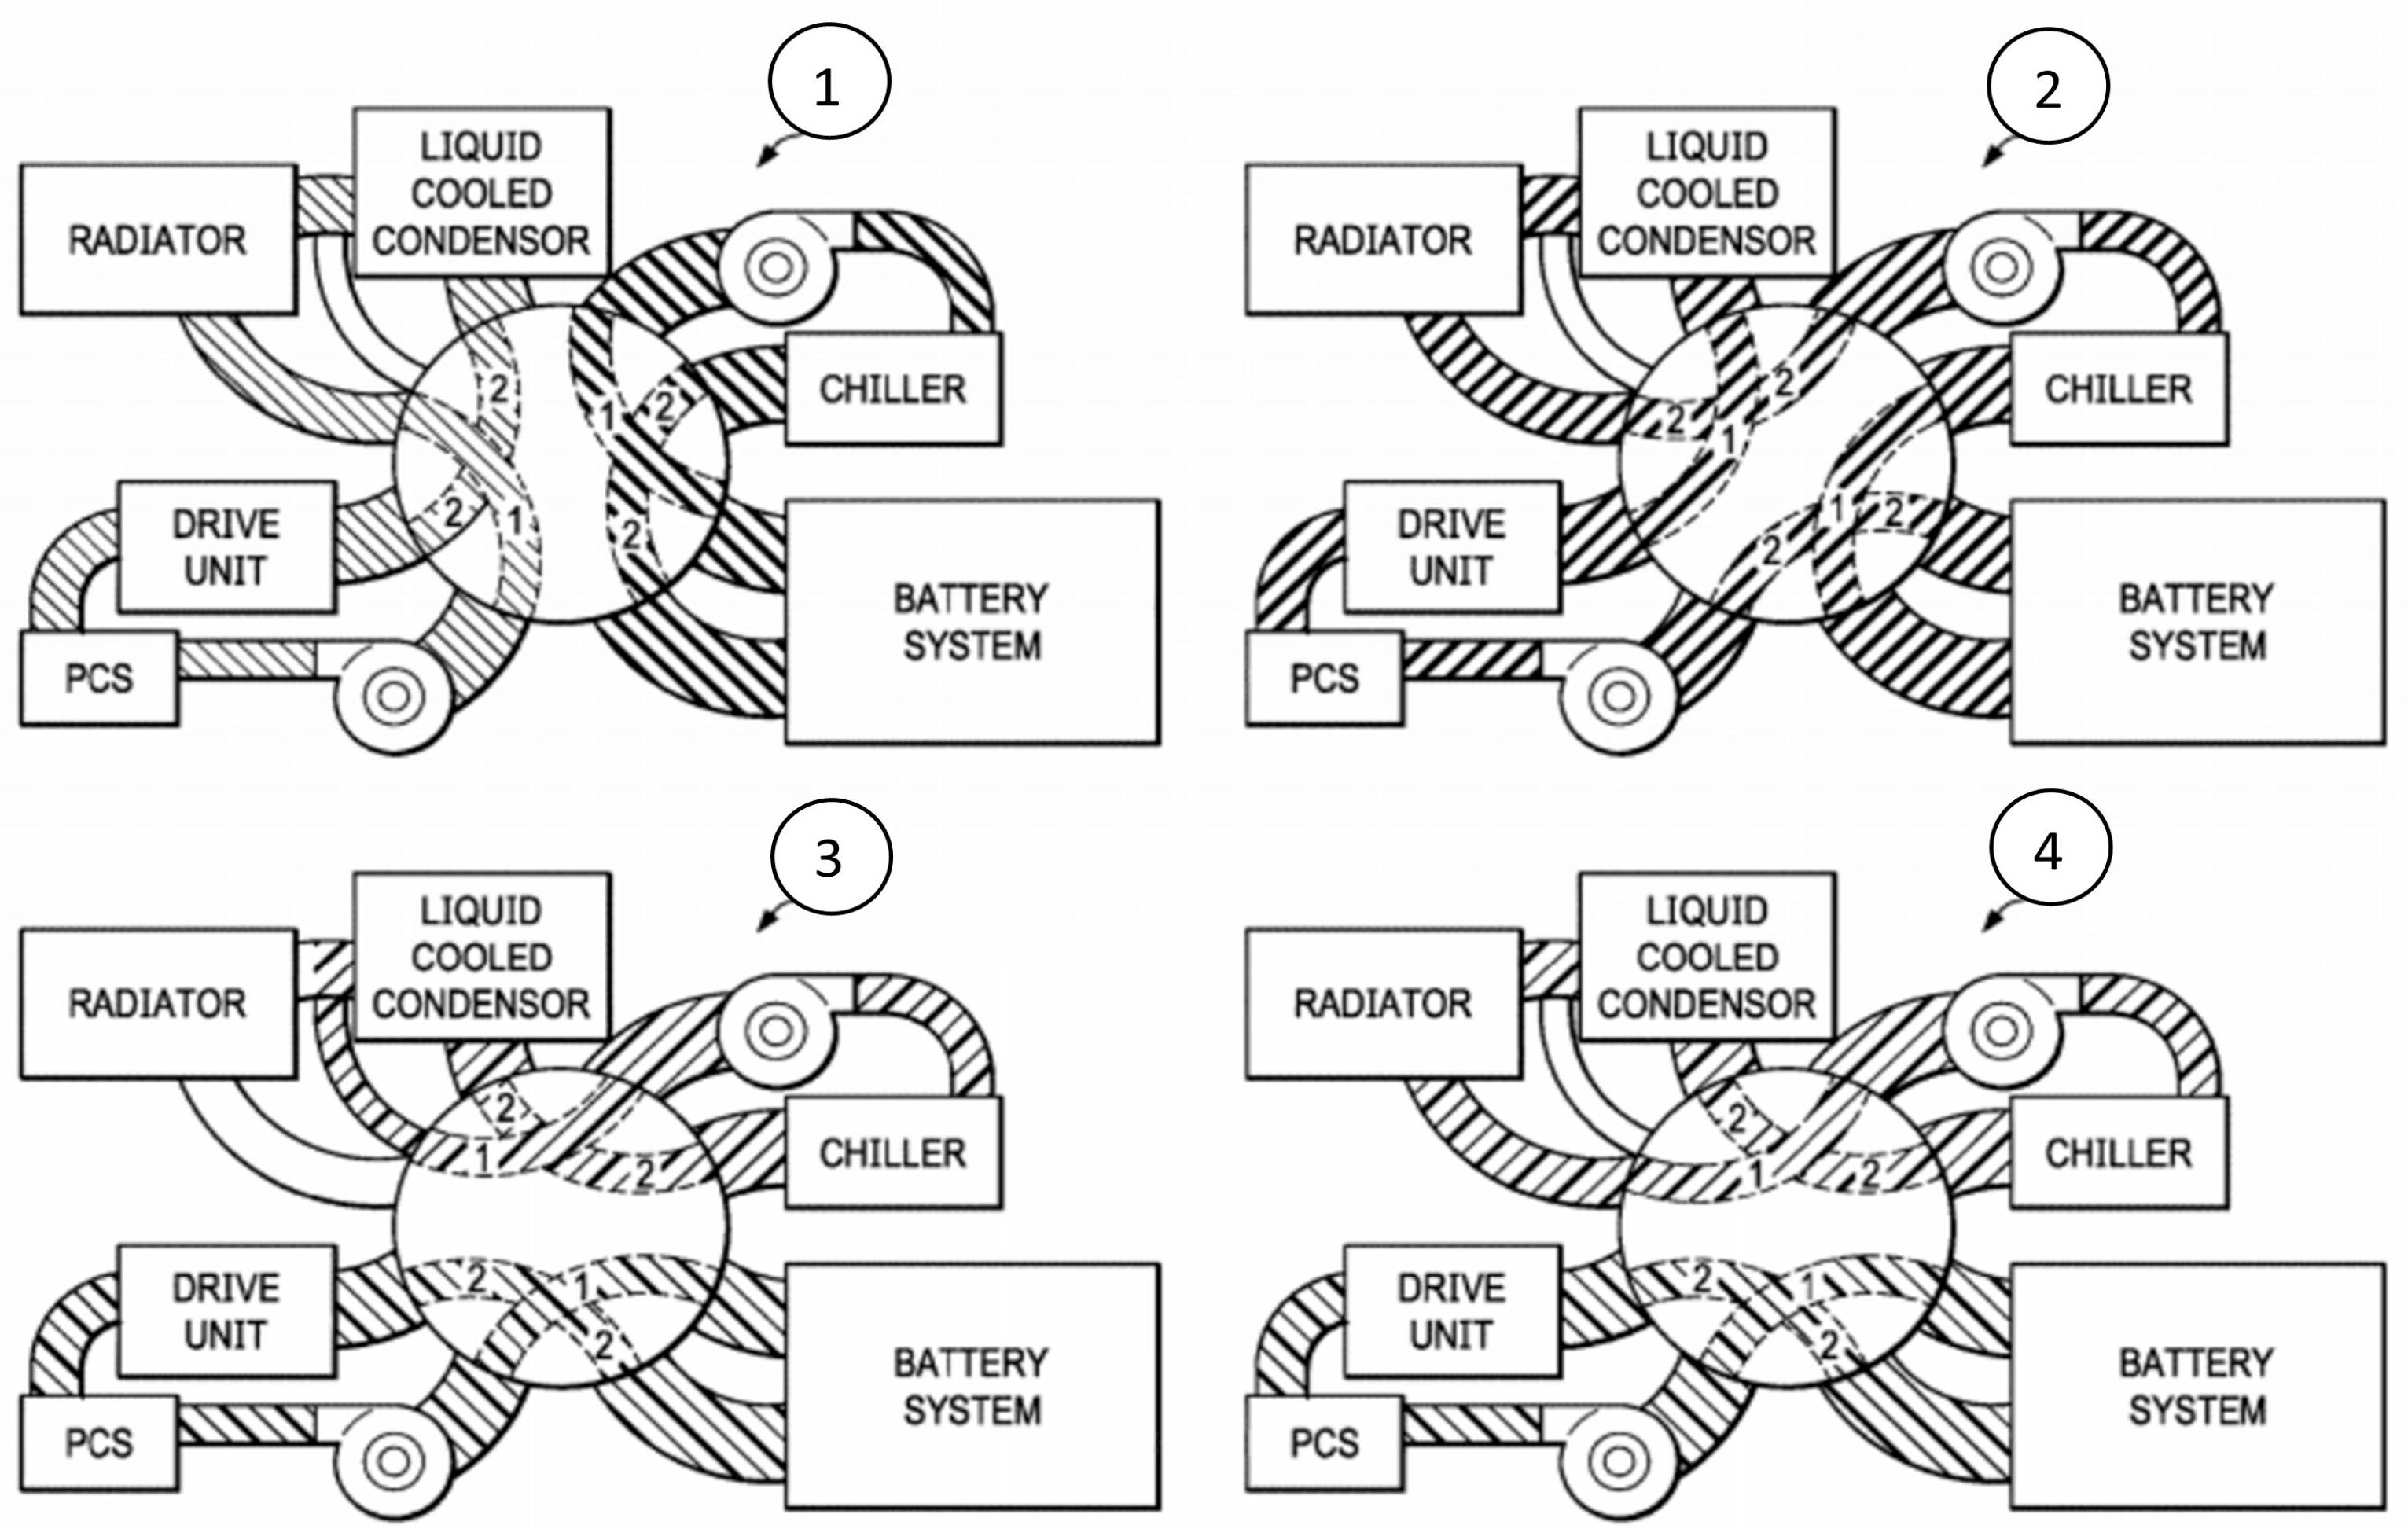
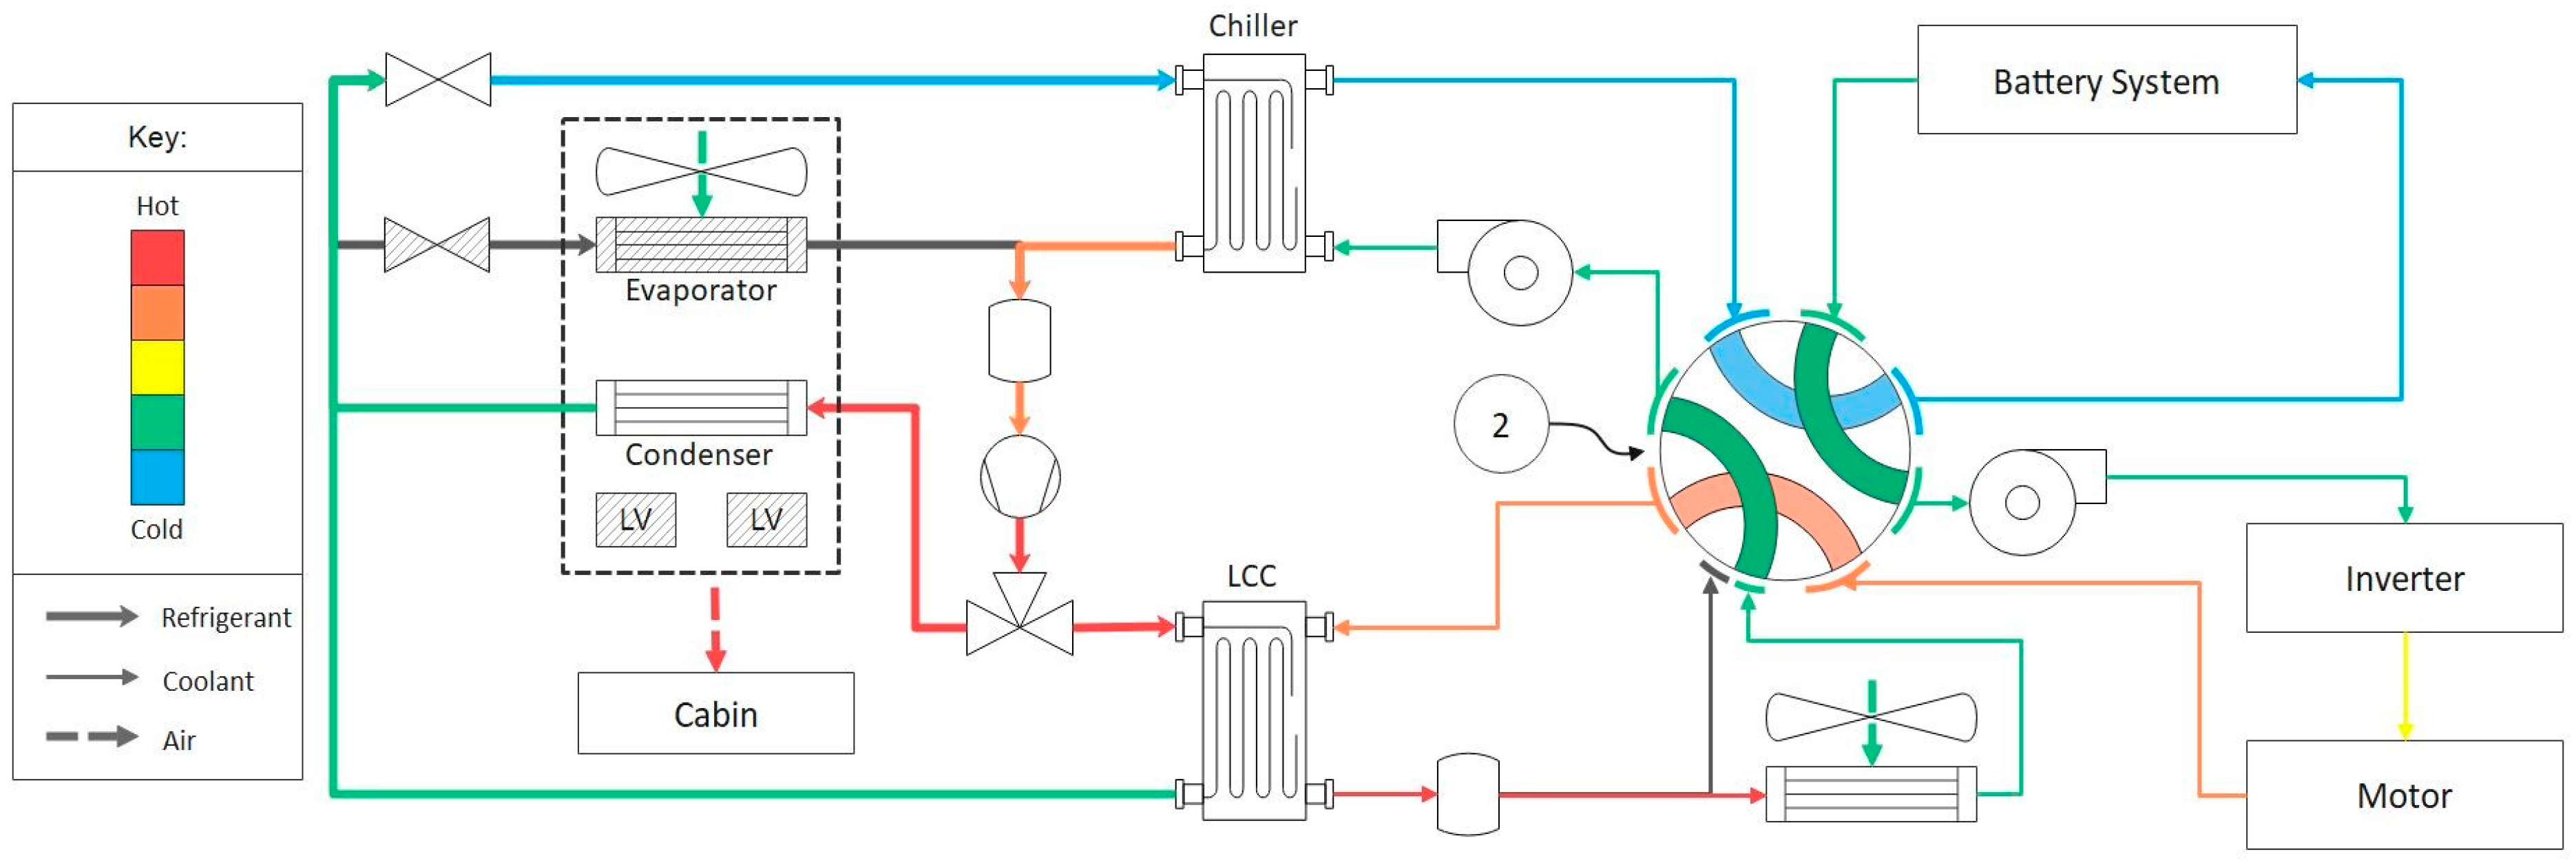
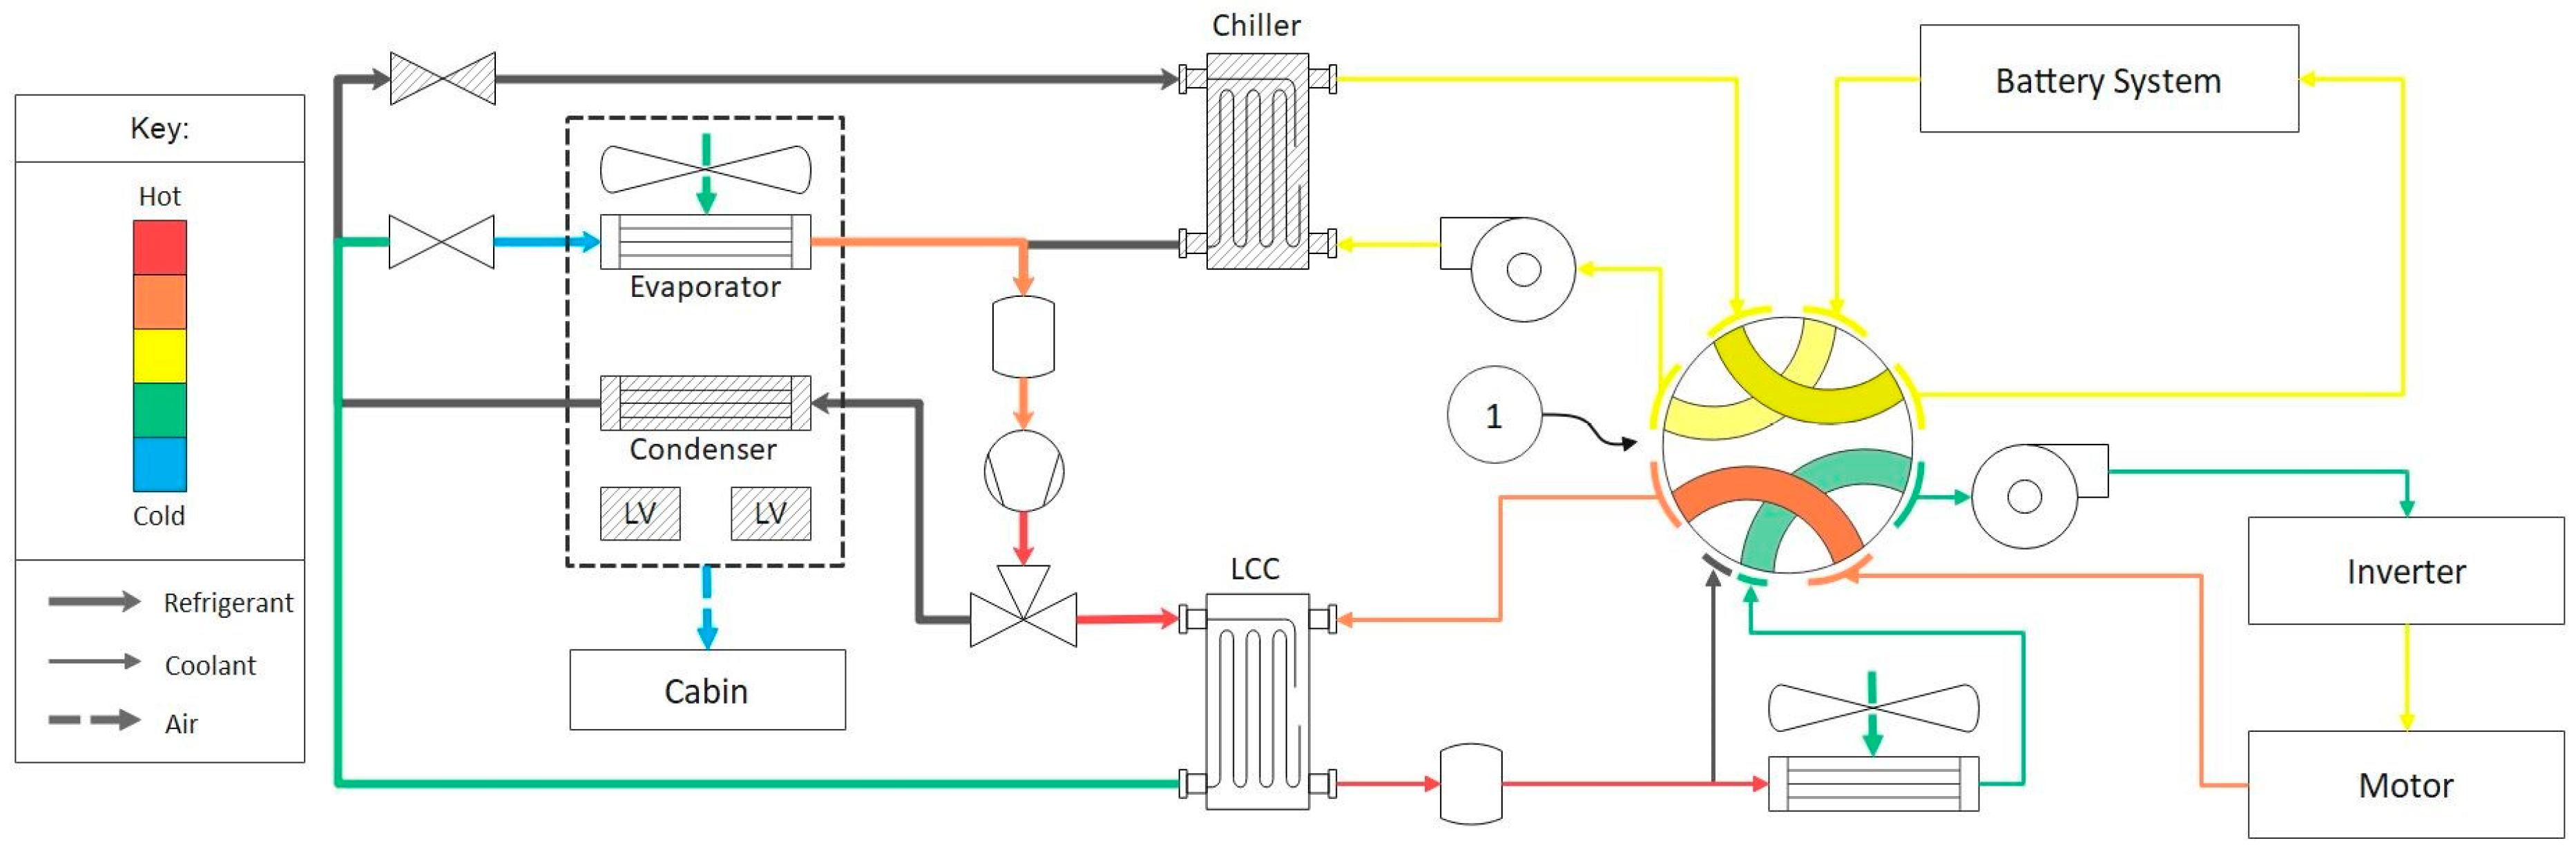
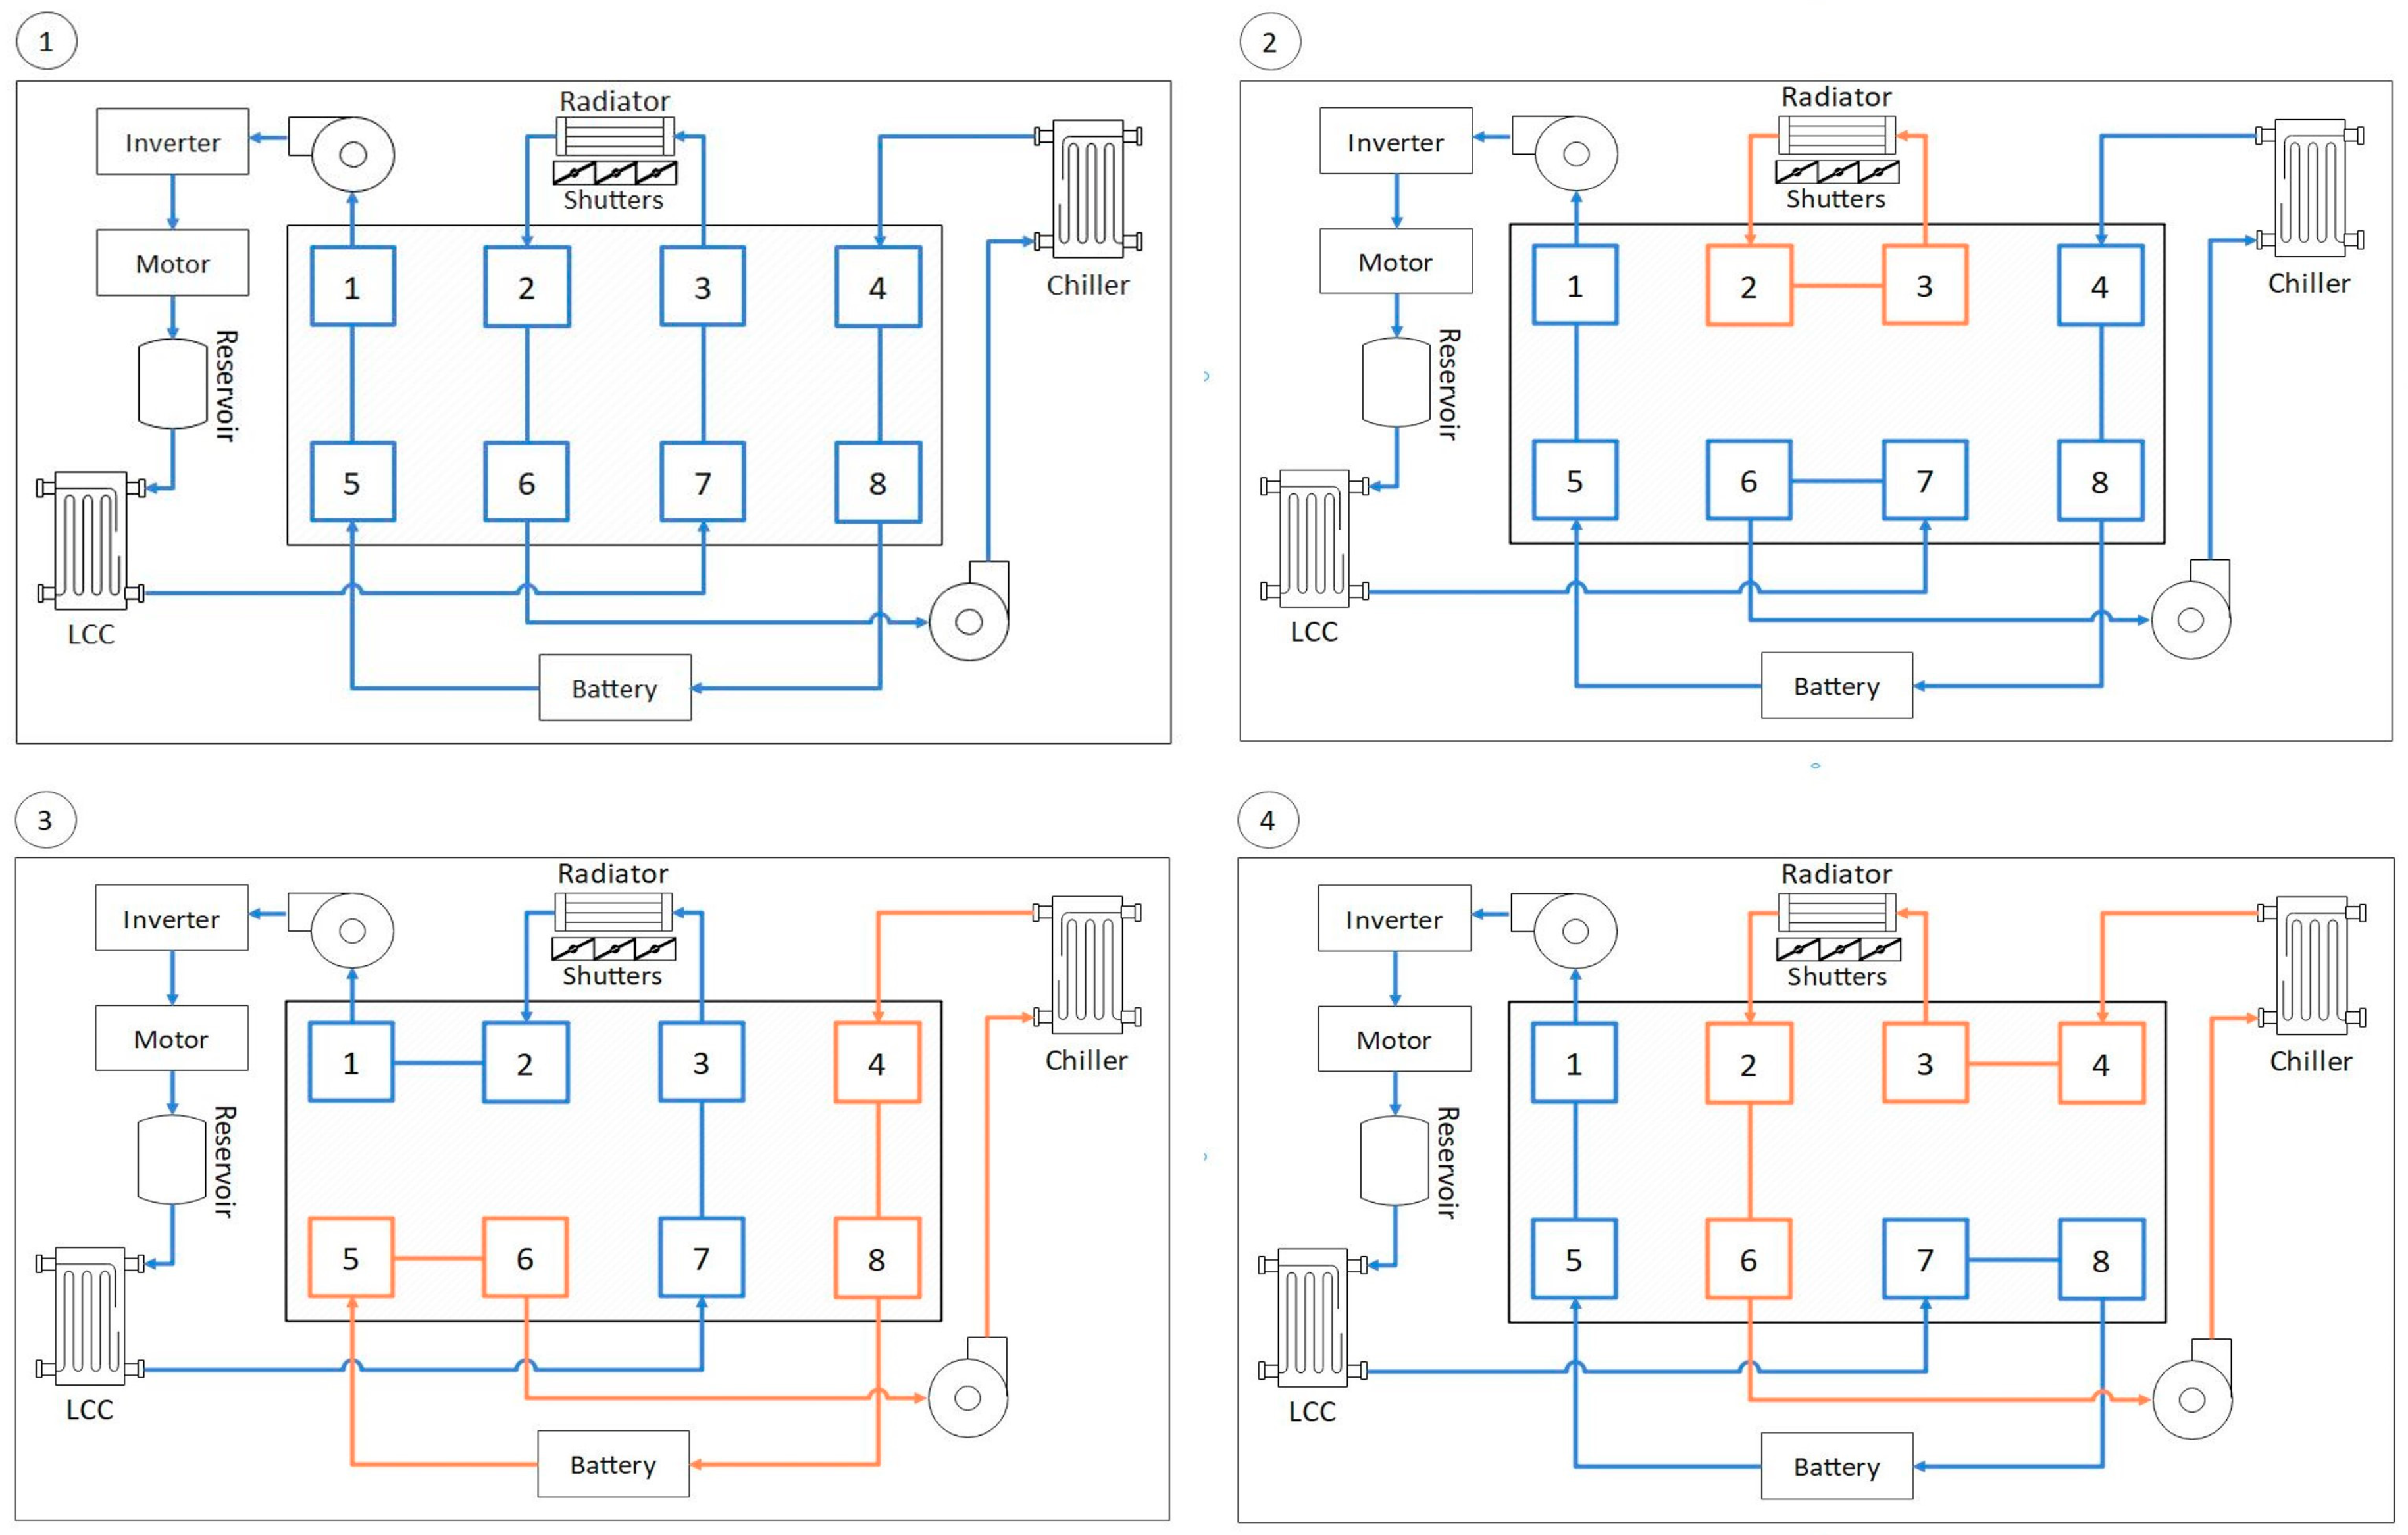
At the core of the system’s design is a fully integrated, multi-functional heat pump connected to a coolant circuit which can be heavily manipulated by a single valve. Where most EVs have a coolant circuit which does not interact with the cabin, this system uses a single heat pump which can interact with both cabin and coolant and provide a link between the two. The way in which the heat pump is designed allows heat to be transferred from the cabin to coolant (and ambient) or vice versa. To help control the flow of heat between the cabin, powertrain and ambient, Tesla has developed a new valve named the ‘octovalve’. This valve is a rotation valve with eight ports that allows coolant to flow in five unique loops. Each loop is capable of multiple functions depending on heat pump operation. The patent illustrates the valve operation of the four coolant loops with a simple diagram, shown in Figure 1.
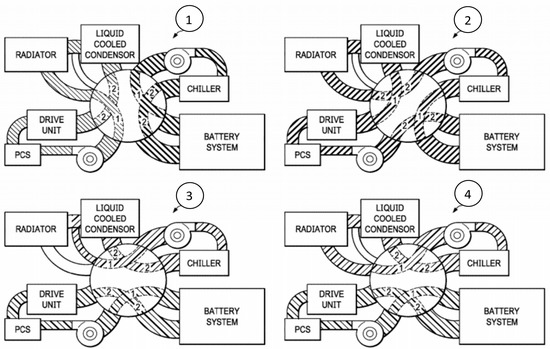
Figure 1.
Octovalve states from the Tesla patent [24].
The valve in state 1 shows the coolant circuit in 2 parallel loops. The drive unit (inverter and motor), radiator and LCC in loop, and the chiller and battery on a separate loop. The valve in state 2 shows the coolant circuit in a complete series loop, with coolant flowing through all the components. The valve in state 3 shows the coolant circuit in different parallel loop configurations, with the battery and drive unit in loop and the LCC and chiller in loop. The valve in state 4 shows the same parallel circuit as state 3 but with the radiator in loop with the LCC and chiller.
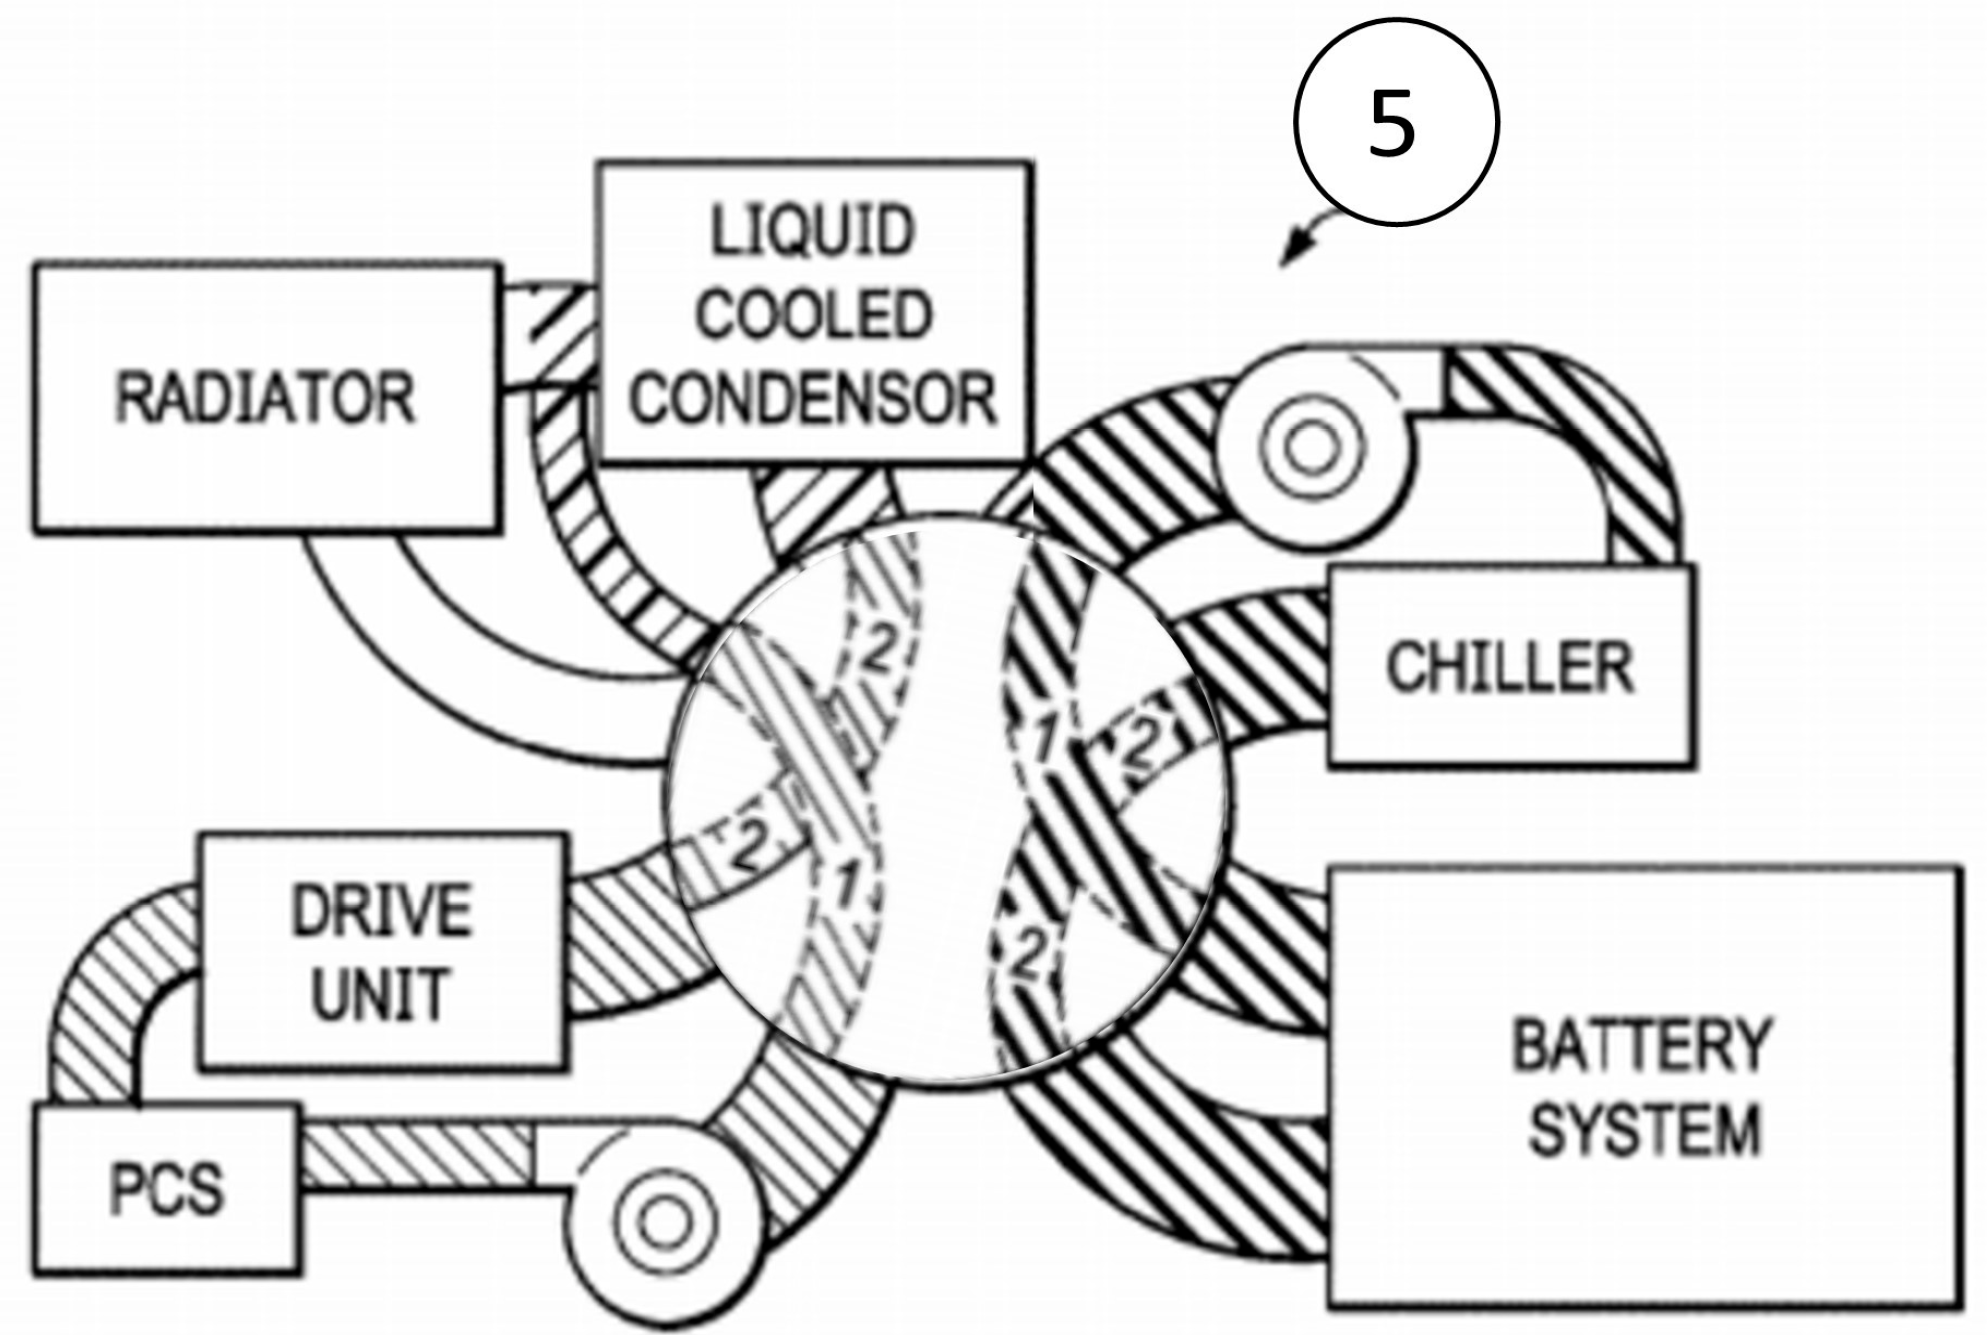
Figure 1 shows an 8-port valve with the ability to change the routing between nine ports. The ninth port acts as a radiator bypass. In the patent’s supporting diagrams, this is shown as two 4-way valves and a 3-way valve for the bypass [24]. As a result, valve states 1 and 2 can be adjusted to bypass the radiator, like states 3 and 4. A mode referenced in the patent but not shown using the simple coolant flow diagram has been created using the style of Figure 1. This mode is shown in Figure 2 and named mode 5 for this paper.

Figure 2.
Additional octovalve state described in the patent.
2.2. Heat Pump Design
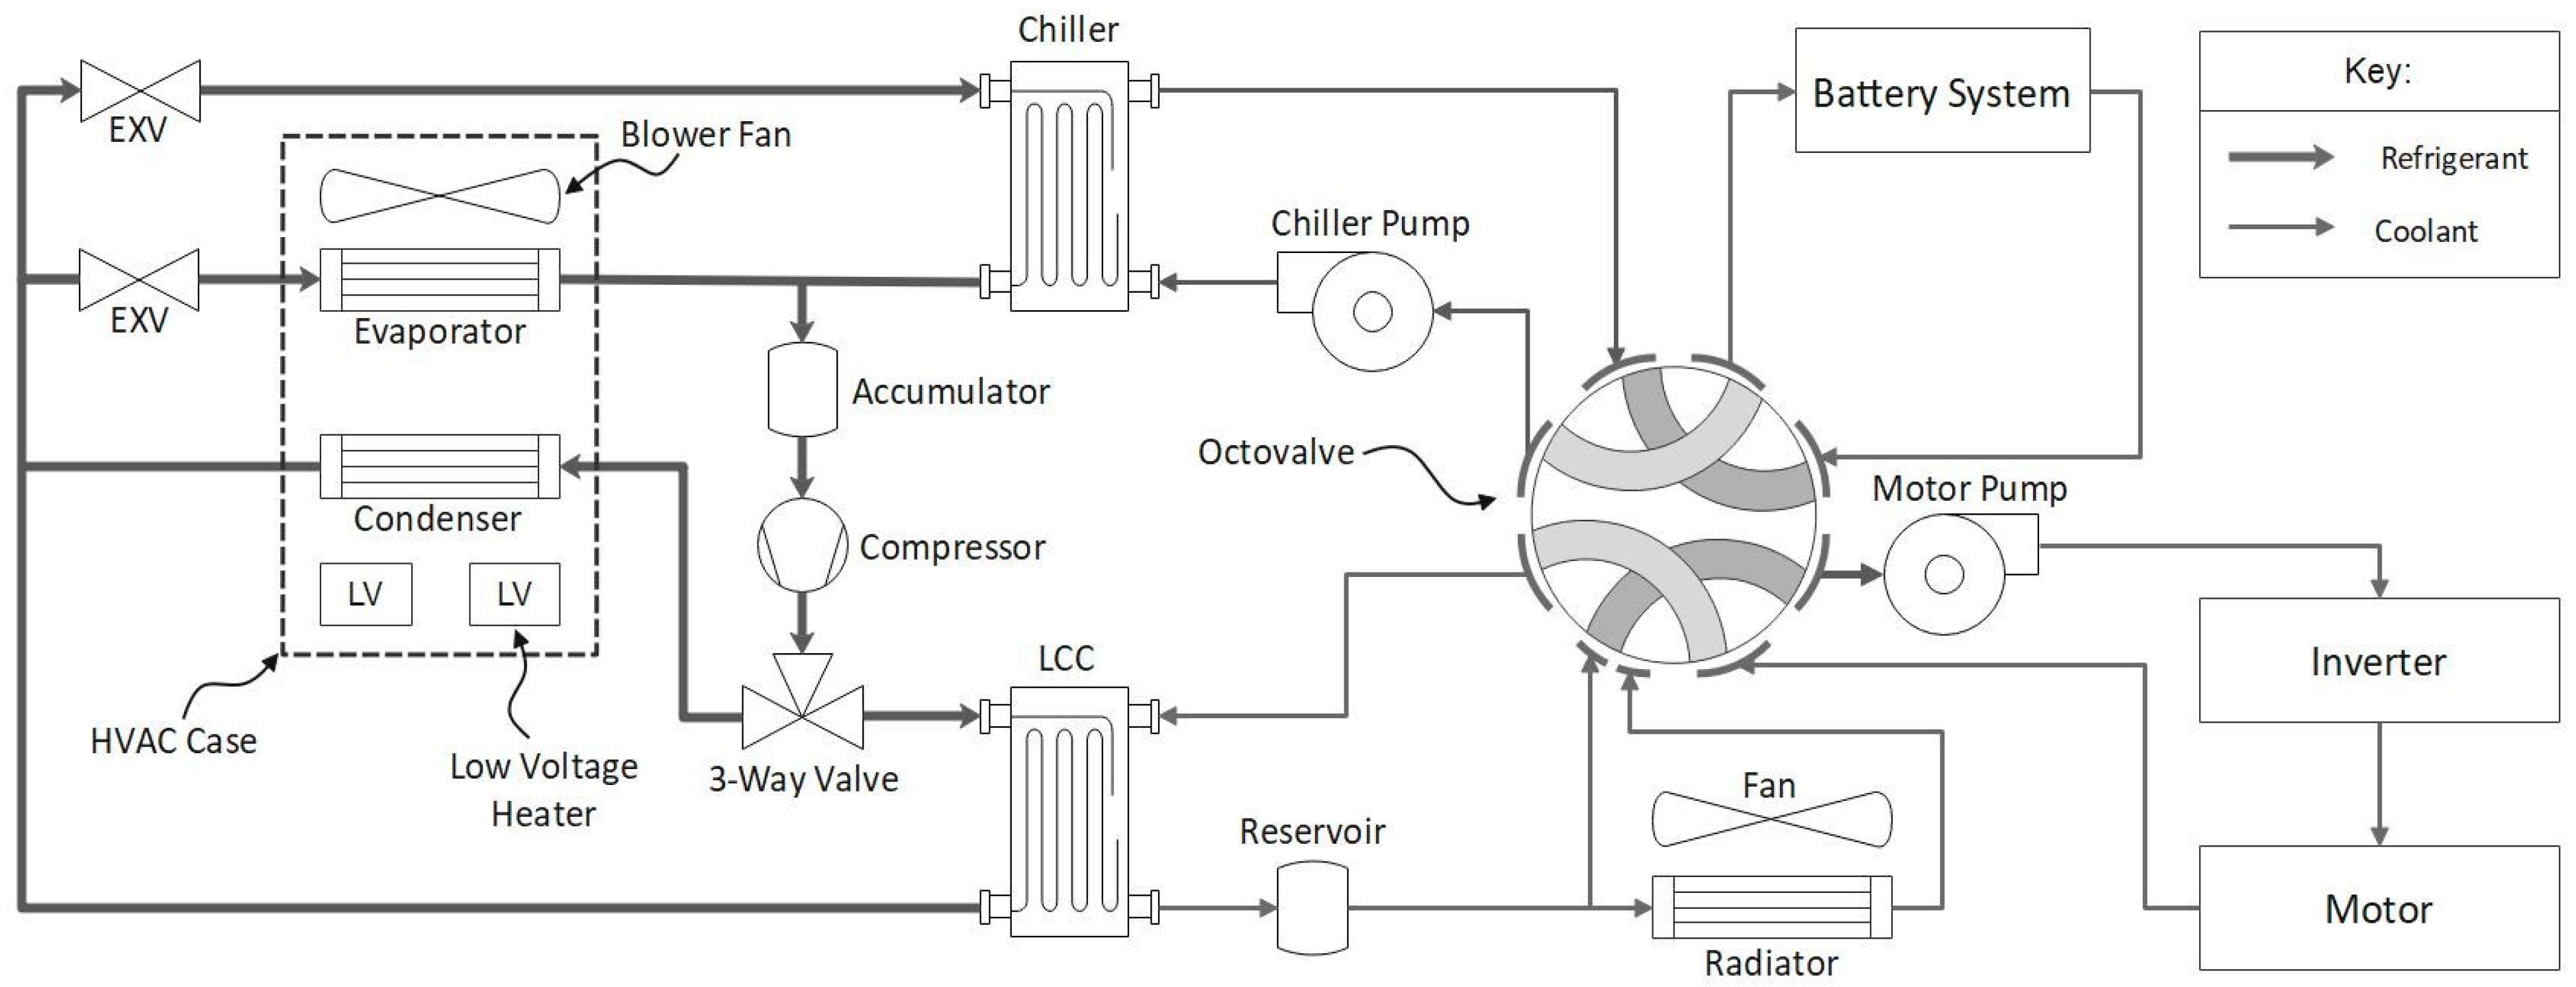
The Model Y heat pump consists of a single electrical compressor, 3-way valve, LCC, cabin condenser, two electronic expansion valves (EXVs), chiller, cabin evaporator, and accumulator, as shown in Figure 3. This differs from the standard compression cycle by having two condensers (condenser and LCC) in parallel and two evaporators (evaporator and chiller) in parallel. To support this layout, Tesla has designed a fully controllable 3-way valve for delivering hot, high-pressure refrigerant to the desired condenser(s). Likewise, EXVs are used to actively control the superheat set point of the evaporators or even completely block flow to an evaporator when not required. This system is a large shift from the refrigeration layout used by many OEMs. With no external condenser, the heat must use the cabin condenser or radiator to transfer heat to ambient.
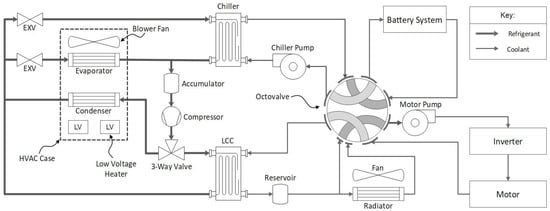
Figure 3.
Complete heat pump schematic.
2.3. HVAC Case Design
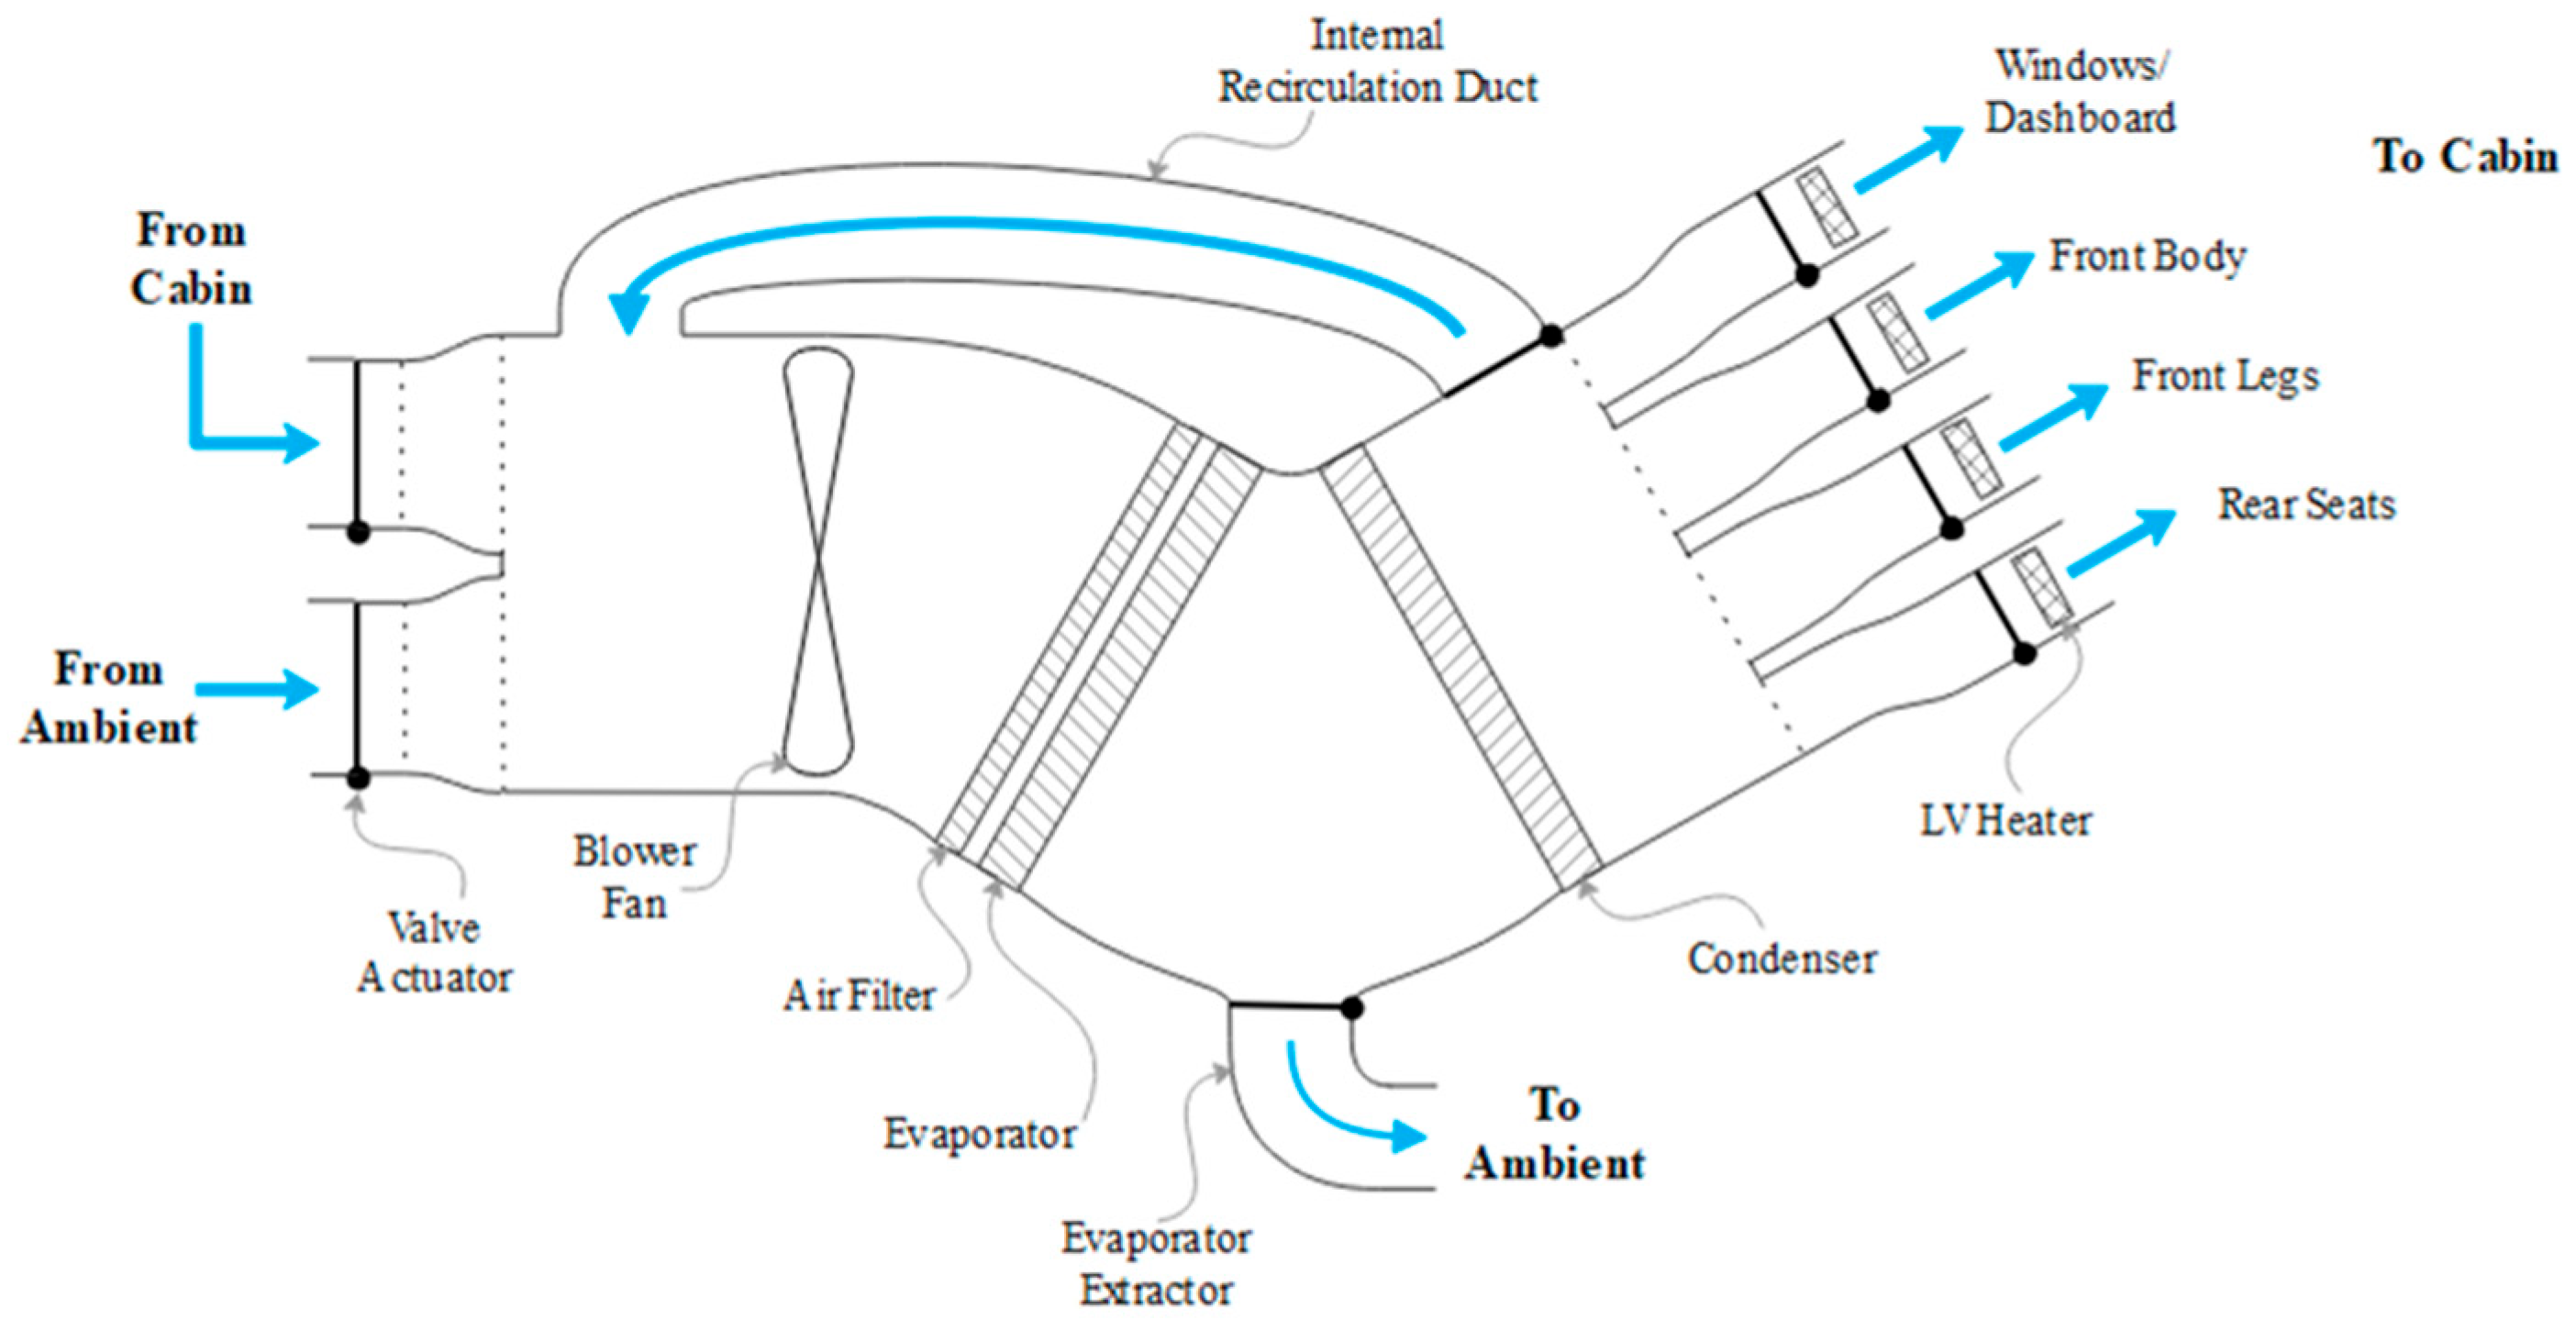
As a result of having a cabin condenser, Tesla has designed a new HVAC case which houses the condenser, as shown in Figure 4. The case is a V-shape design to allow water to flow off the evaporator and through the extractor without contacting the condenser. There is a recirculation duct which resides within the HVAC case to route condenser exhaust back to the evaporator inlet. The reason for this internal recirculation duct will become apparent in the sections following.
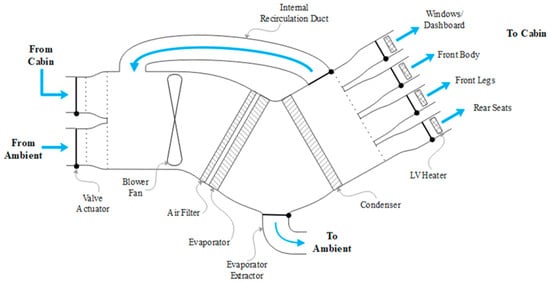
Figure 4.
HVAC case diagram.
2.4. Heating Modes
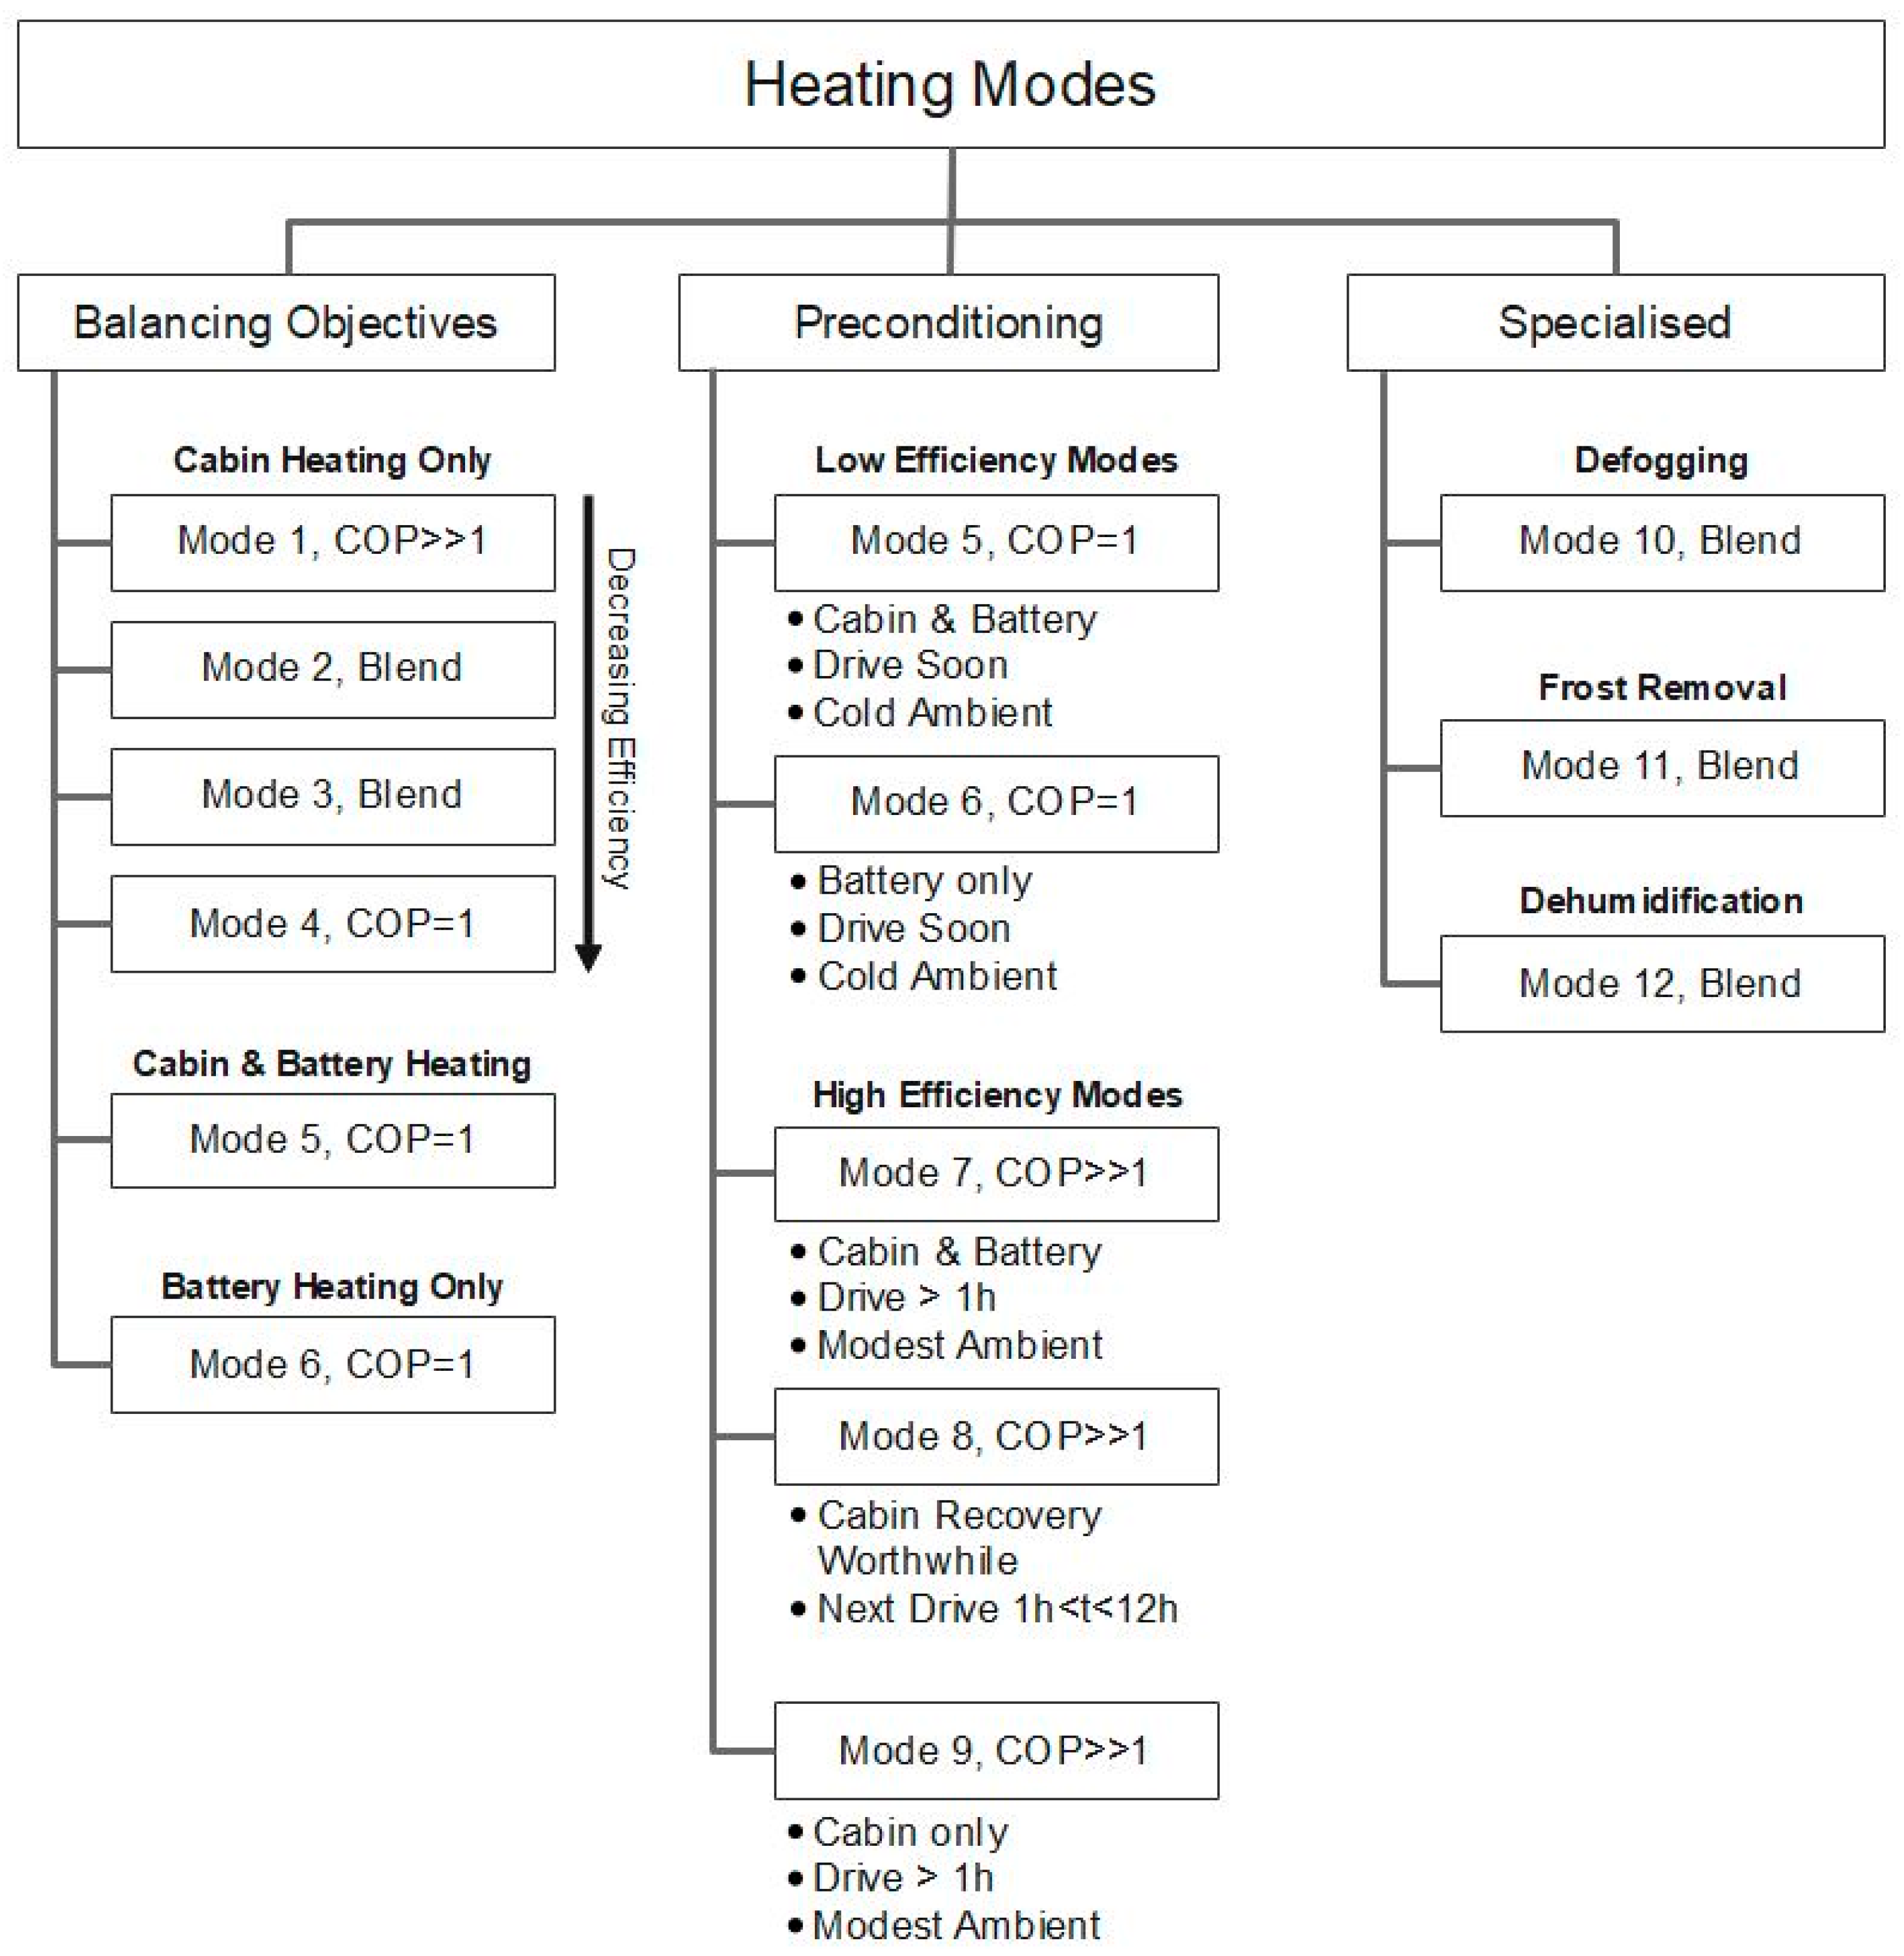
The system under analysis has a total of 12 heating modes shown in Figure 5, each with a primary objective(s) where the criteria that the net energy to the target components(s) is >0. These are categorised under three titles. Balancing objectives: the main group of heating modes where there is a primary target component requiring thermal energy (cabin, battery, or combined) and, depending on other component needs, sourcing energy to maximise efficiency. Preconditioning: modes designed to store energy between drives and transfer the energy to target components to reduce warm-up time and unnecessary energy consumption. Specialised: modes designed for very specific tasks, not necessarily improving thermal comfort or improving powertrain performance. In this paper, we will not consider preconditioning modes or specialised modes. Only the core “Balancing Objectives” modes for heating are explored.
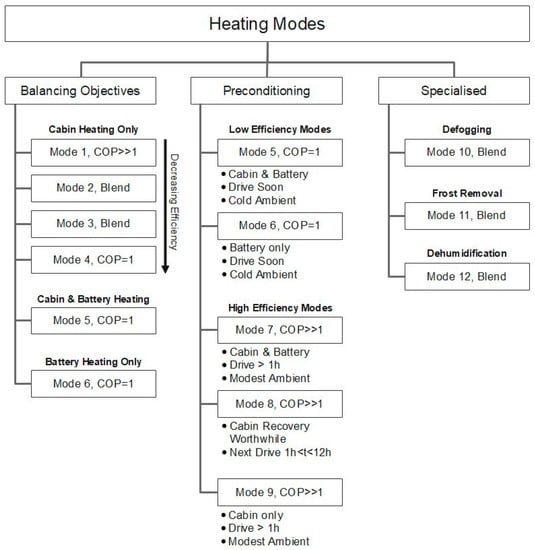
Figure 5.
Octovalve heating modes.
Each mode has a generalised coefficient of performance (COP) which describes the heat pump’s ability to source energy. From the definition:
COP = Q/W
When the primary objective of the heat pump is heating, the equation can be expressed as,
COPheating = |Qh|/W = (|Qc| + W)/W
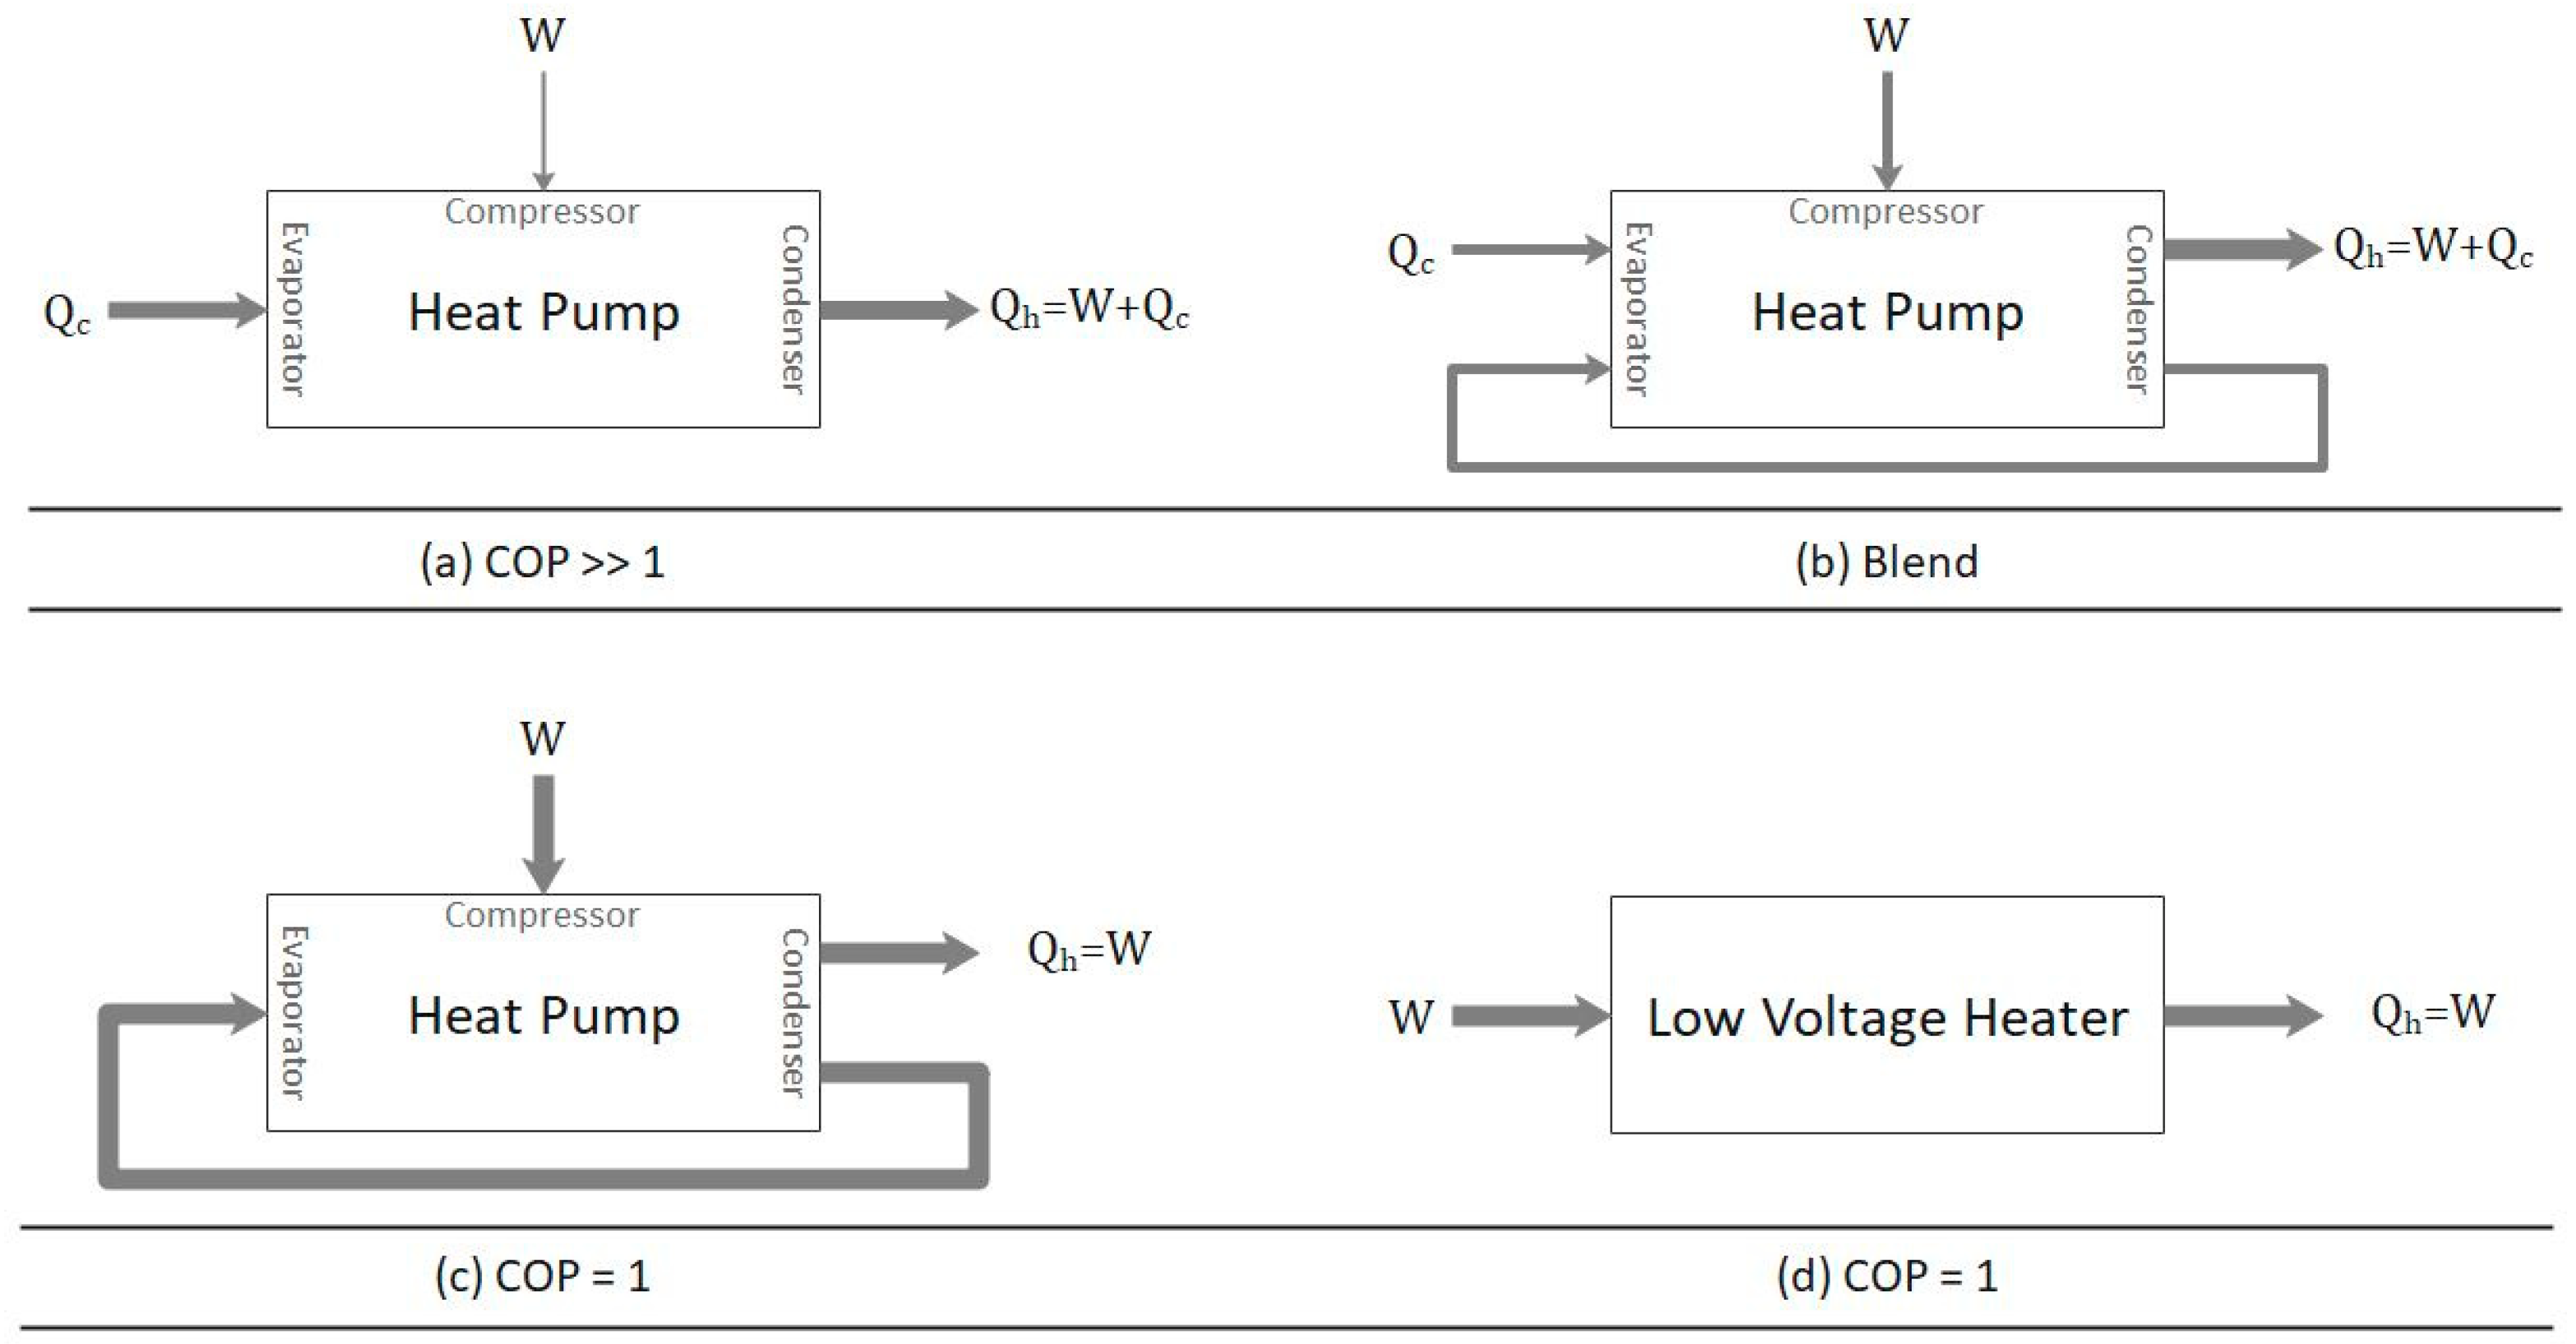
Therefore, the most efficient heating modes are capable of sourcing energy from thermal reservoirs with little input energy resulting in a COP >> 1 (Figure 6a). Conversely, the least efficient methods of heating are where the electrical energy is equal to the output thermal energy (COP = 1). Figure 6d shows a low voltage heater which uses resistive heating to produce thermal energy, a typical example of COP=1 heating. A heat pump can perform a similar function where the compressor effectively becomes the heater. The cabin evaporator and condenser are active; the condenser cancels absorbed energy at the evaporator and releases the equivalent energy in the compressor. The effect is that the compressor energy is equal to the incremental energy given to the cabin (Figure 6c). Finally, if there is a heat reservoir available but more thermal energy is required, the heat pump can operate as a ‘blend’ of COP >> 1 and COP = 1. Hence, the heat pump operates as previously but partially sources energy from the heat reservoir (Figure 6b). Low voltage heaters can also work in harmony with the system to produce more COP = 1 energy.
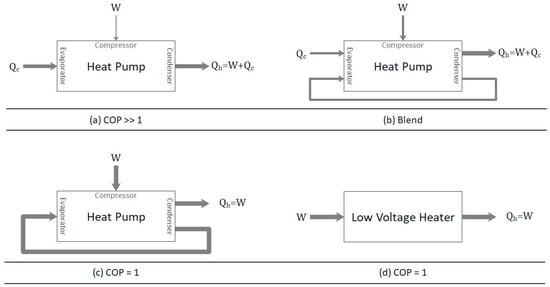
Figure 6.
Heat pump coefficient of performance diagram.
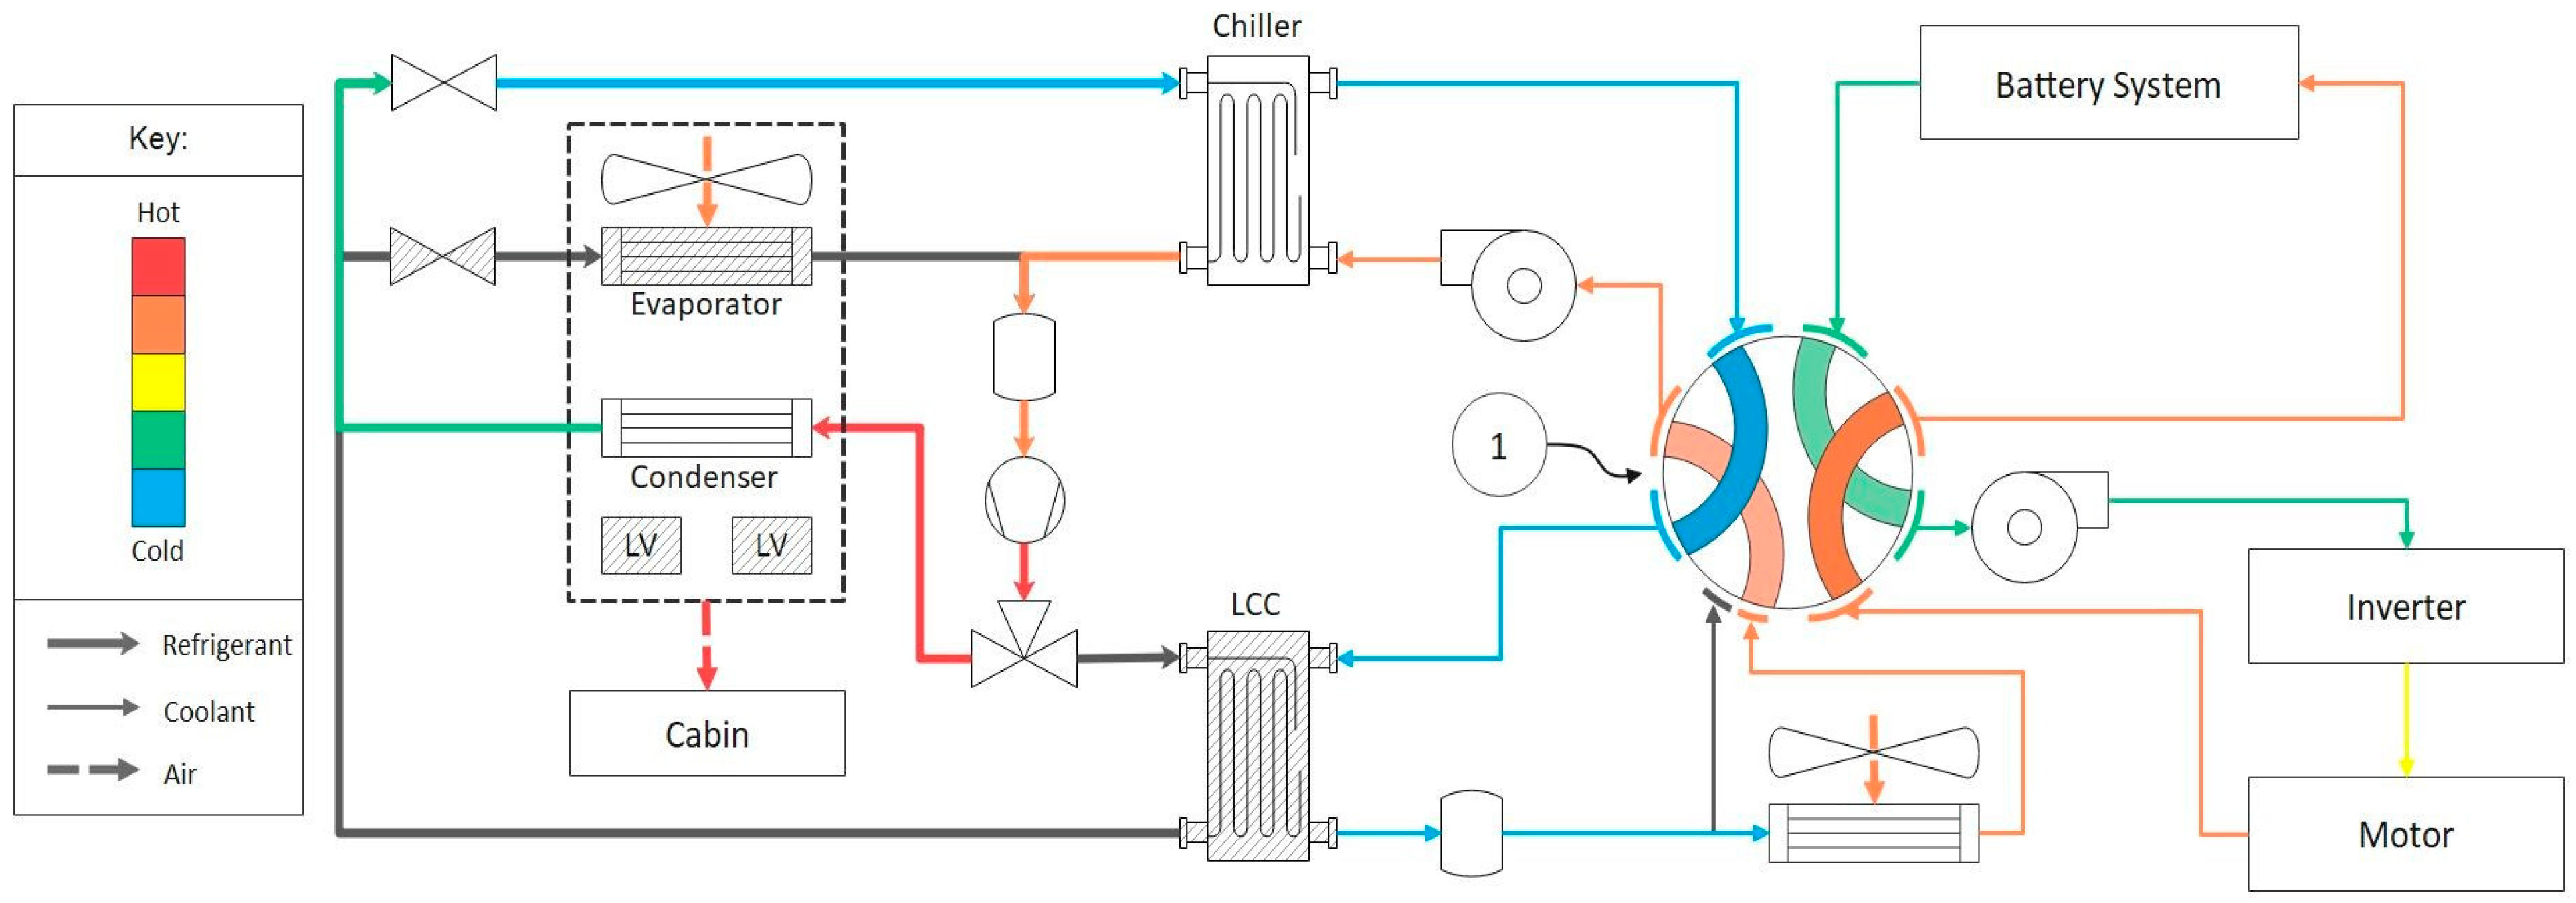
2.4.1. Mode 1
Mode 1 is the most efficient cabin heating mode operating in a COP >> 1 state (pure heat pump). In this mode, energy is sourced by either the ambient air or the battery system/drive unit (considered to be ‘free’ from a cycle efficiency perspective) shown in Figure 7. The heat pump compressor operates in an efficient mode to maximise vehicle range. Heat can be sourced from the ambient air if the atmospheric temperature is above −10 °C (coolant thermal energy is greater than the refrigerant and the chiller). However, the closer to −10 °C, the less effective the system becomes. If the drivetrain is above ambient or the battery requires cooling, it is more effective to source energy from these components as shown in Figure 8. In both instances, the 3-way valve routing fluid to the LCC is closed, EXV to the cabin evaporator is fully closed, and the chiller and cabin condenser are active. On the coolant side, the octovalve is set to position 1 for ambient sourcing and 5 for drivetrain sourcing. In both cases, heat from the coolant side is transferred to the chiller refrigerant to be rejected at the cabin condenser.

Figure 7.
Heating mode 1a: Thermal circuit diagram with relative fluid temperatures.
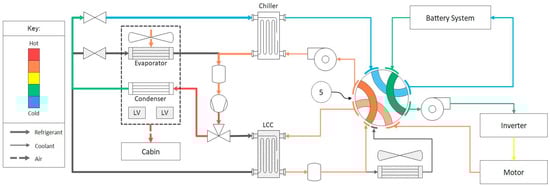
Figure 8.
Heating mode 1b: Thermal circuit diagram with relative fluid temperatures.
2.4.2. Mode 2
Figure 9 shows the system in a second heating mode, used when either of the mode 1 configurations cannot supply the demand. Given that conditions remain the same as heating mode 1b, mode 2a will be active. In this mode, the configuration will remain the same as 1b, now with the LV heaters active. The LV heaters will contribute to a COP = 1. This mode is known as a ‘blend’ as the COP >> 1 and COP = 1 heating methods combine to form to set COP > 1 (roughly 1–2). In this mode, the proportion of heat sourced from the battery to LV can be controlled if the battery still requires warming. Having the LV heaters active provides a slightly higher thermal output to the cabin and left/right differential heating if the driver and passenger demands differ.
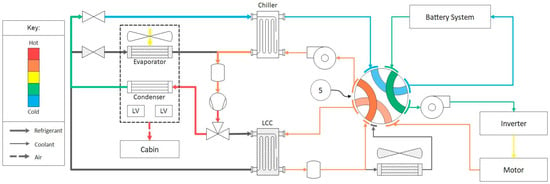
Figure 9.
Heating mode 2a: Thermal circuit diagram with relative fluid temperatures.
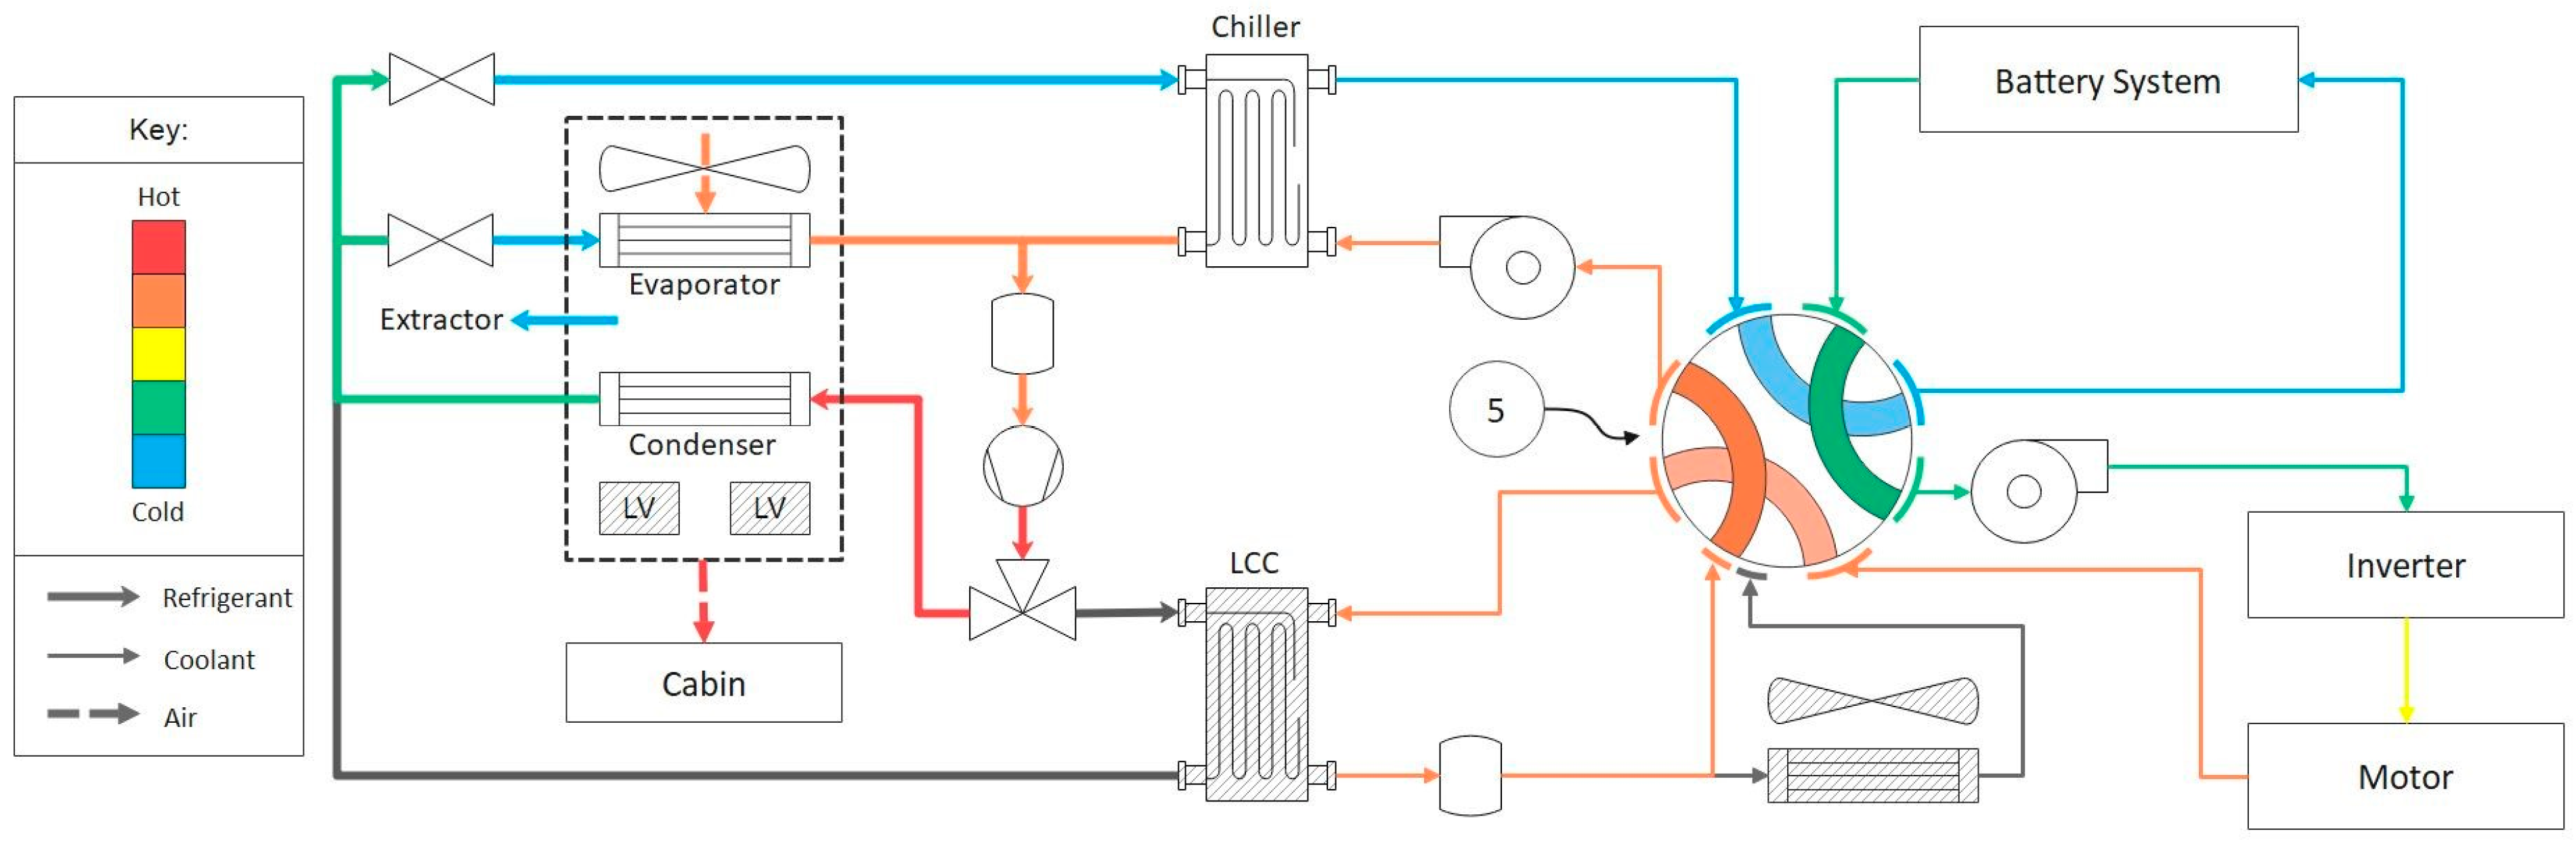
Alternatively, if there is still energy available in the ambient air, the system will operate as shown in Figure 10. Instead of using the LV heaters, it is possible to produce the same ‘blending’ effect using the cabin evaporator. Within the HVAC casing, there is an extractor in between the cabin evaporator and condenser. If this is open and the condenser, evaporator, and chiller are active, it is possible to source energy from the powertrain and ambient. As a result, the sourcing from the battery and ambient, which leaves via the extractor, contributes to COP >> 1. The air which continues through the condenser contributes to COP = 1.
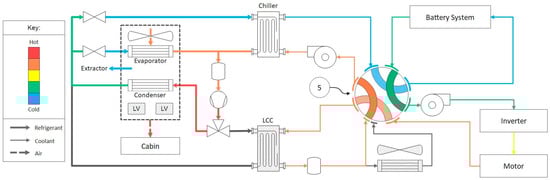
Figure 10.
Heating mode 2b: Thermal circuit diagram with relative fluid temperatures.
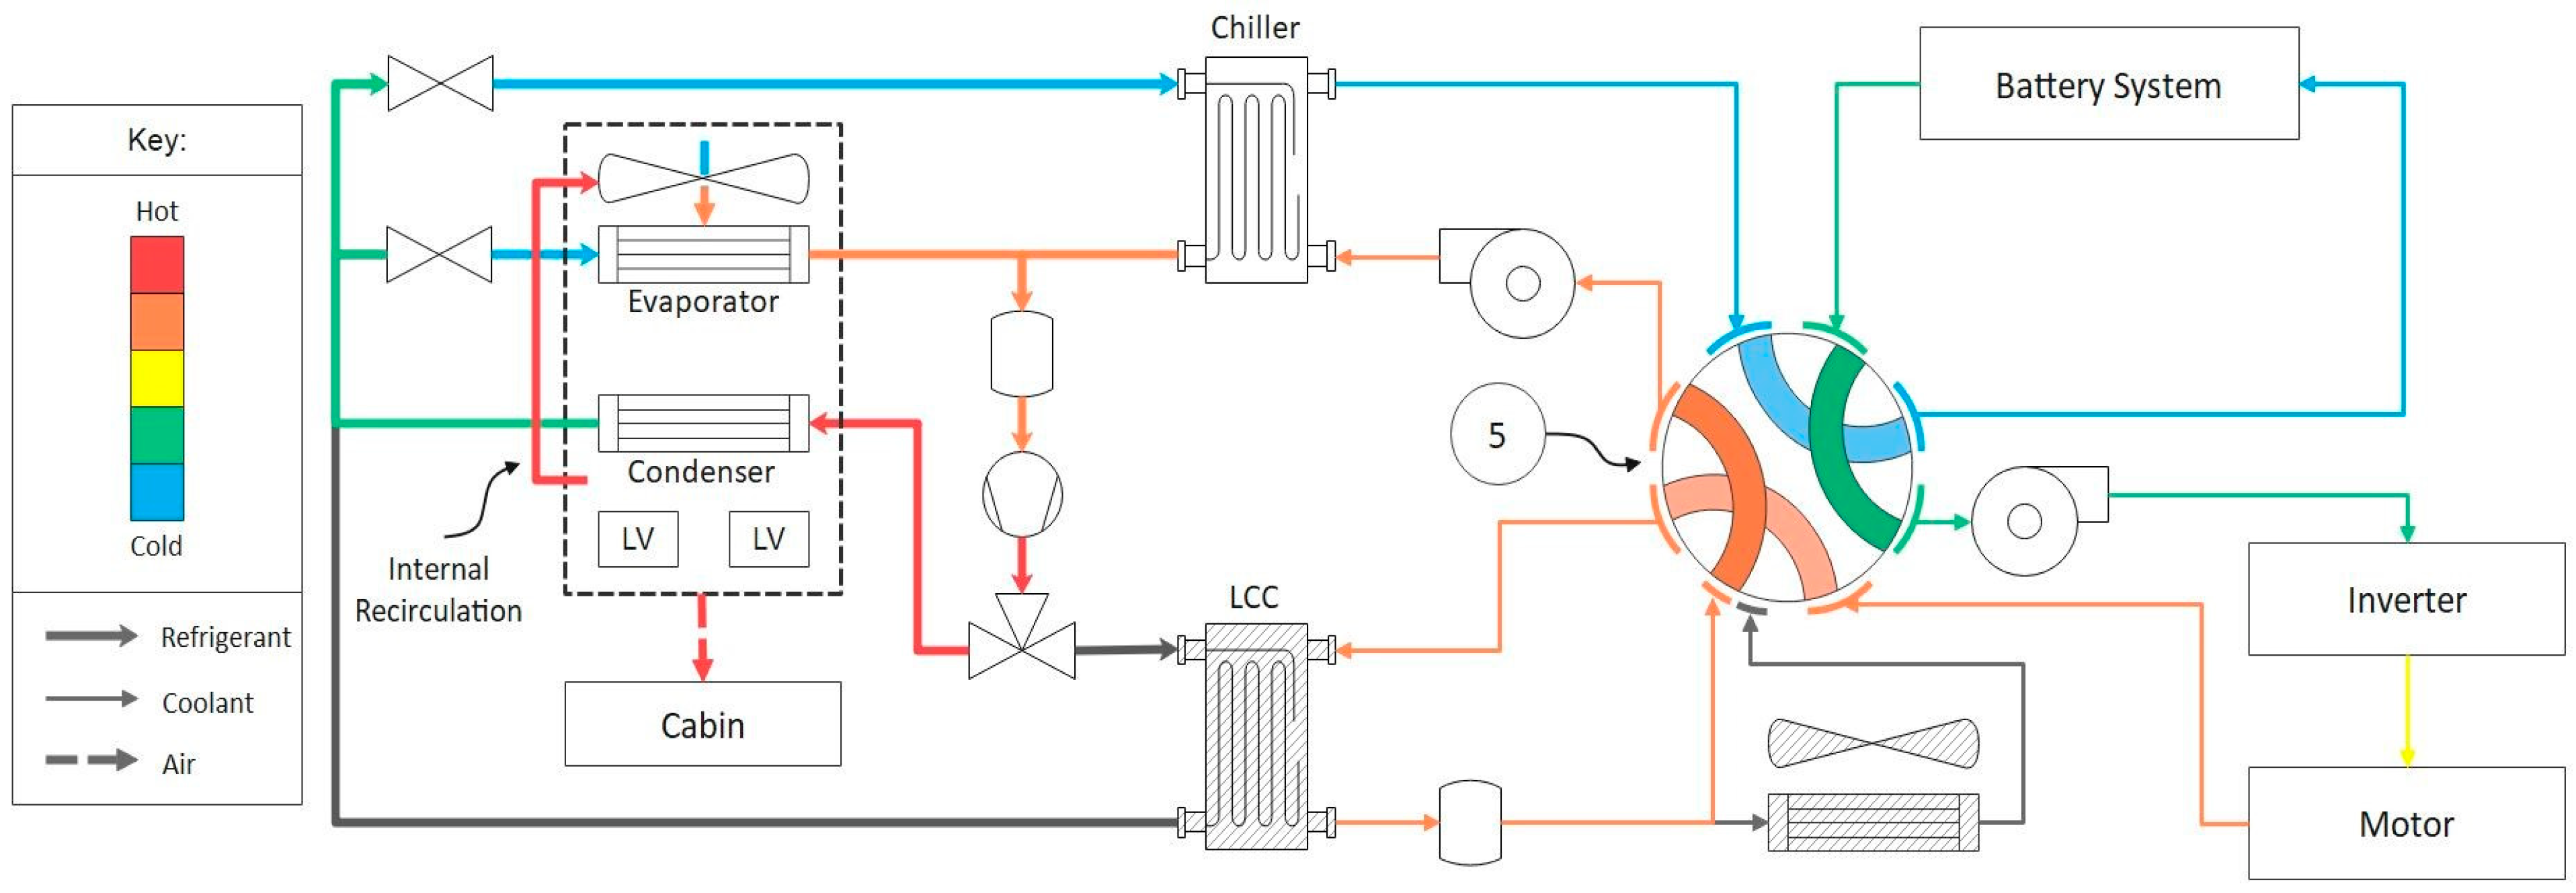
2.4.3. Mode 3
If the system still cannot supply the demand and the ambient temperature is lower than −10 °C, heating mode 3 shown in Figure 11 will activate. In this mode, the system operates in a similar manner to mode 2b, with the extractor closed and LV heaters on. The HVAC internal recirculation duct is now open and moderating condenser exhaust heat back to the evaporator. Having the configuration in this way will increase the temperature of the evaporator, which will allow the compressor to run at higher power. By increasing the internal recirculation, the ambient source COP tends to 1. The recirculation duct requires optimal control to balance the heating objective with thermal comfort. Too much recirculation will result in starving the cabin of airflow and may cause the cabin to fog. Here there is finite powertrain heat sourcing which contributes to COP >> 1.
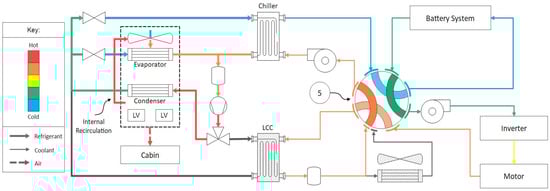
Figure 11.
Heating mode 3: Thermal circuit diagram with relative fluid temperatures.
2.4.4. Mode 4
If the drivetrain coolant loop is not unfeasible and the conditions of mode 3 remain, mode 4 shown in Figure 12 will be activated. Mode 4 is the least efficient cabin heating only mode, where the compressor acts as the heater at COP = 1. Here the octovalve can remain in position 2 with an inactive chiller so the drive unit can assist the natural warm-up of the battery system. On the heat pump side, only the cabin evaporator and condenser are active, and the internal recirculation mode is active. In this state, there is no thermal link between the drivetrain and the heat pump. The compressor acts as a high voltage heater, and if demands further increase or driver and passenger demands differ, the low voltage heat can be activated.
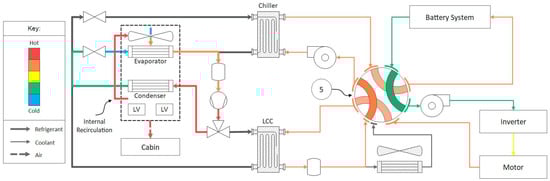
Figure 12.
Heating mode 4: Thermal circuit diagram with relative fluid temperatures.
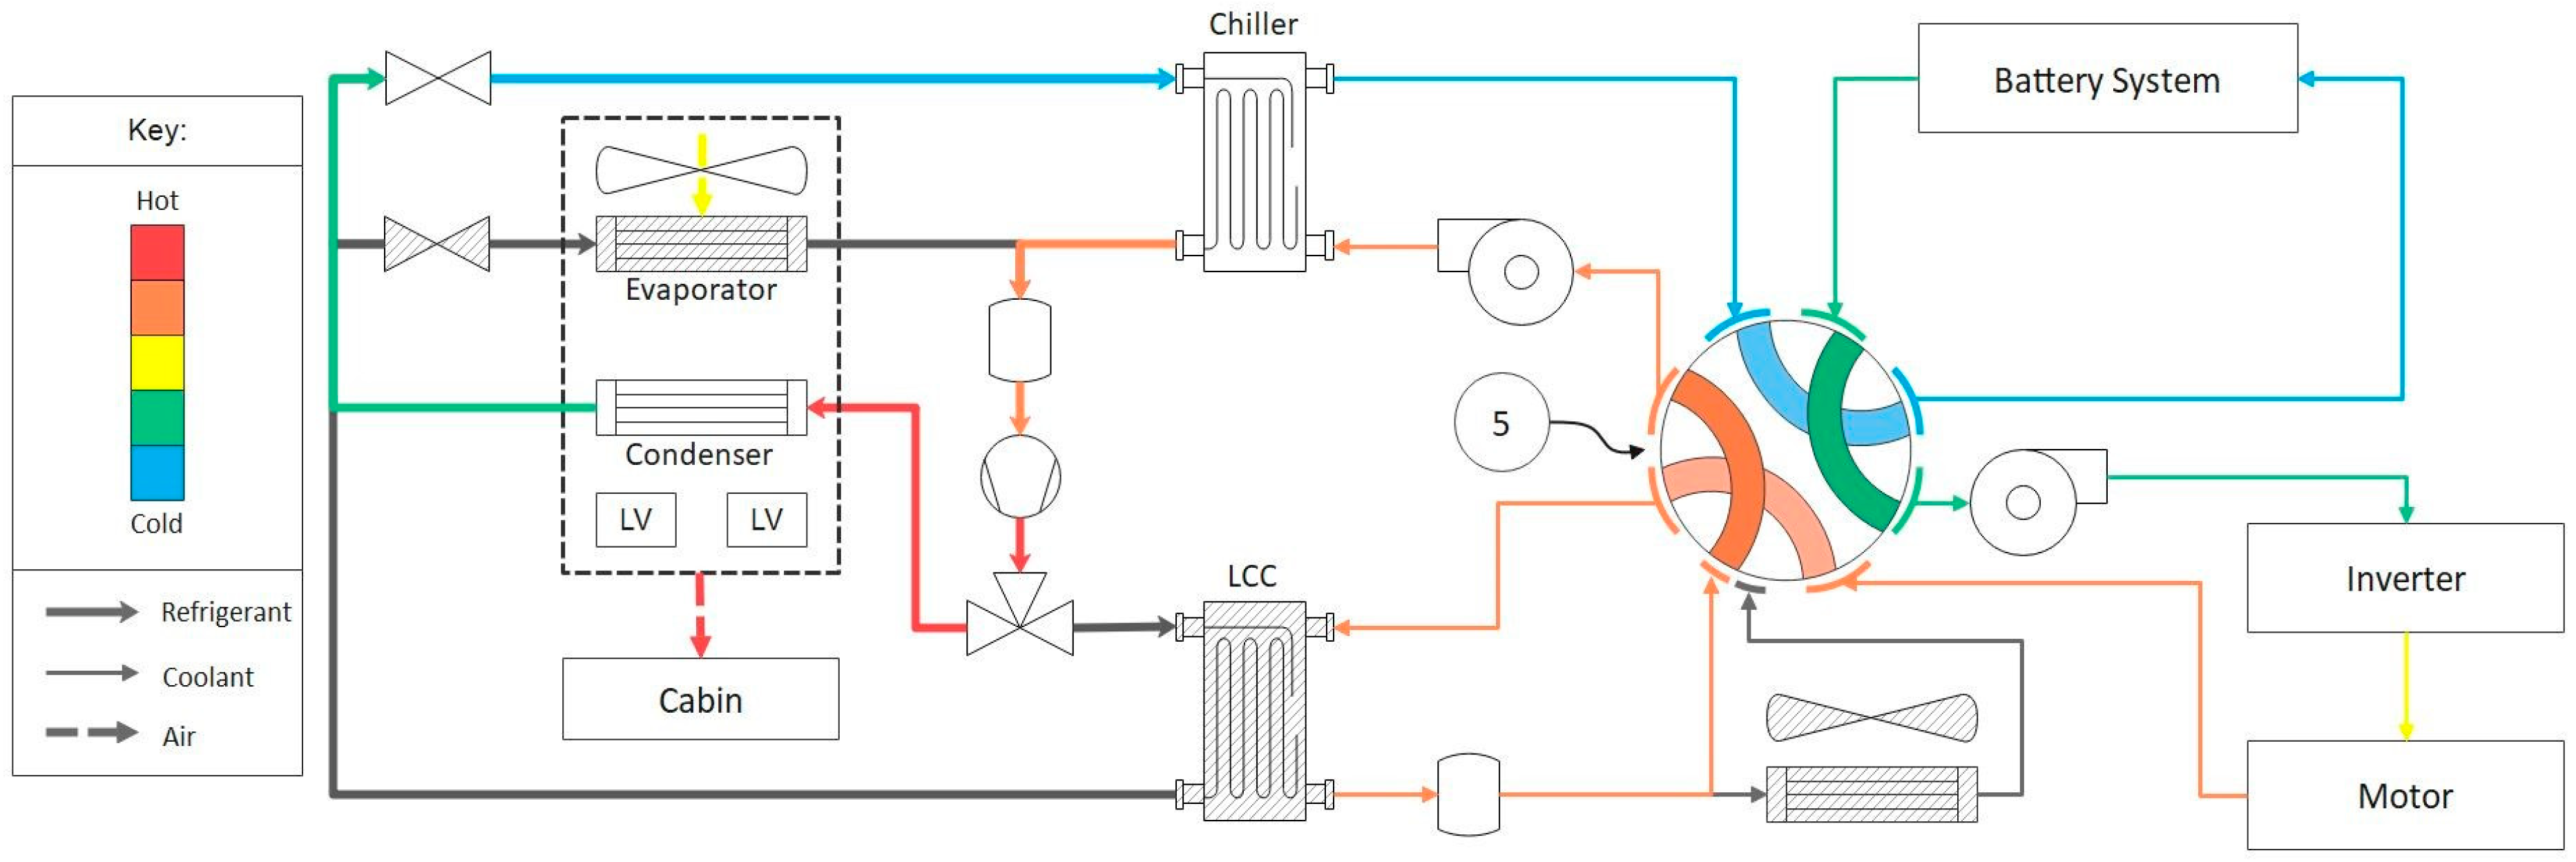
2.4.5. Mode 5
If the cabin requires heating in ambient < −10 °C and the battery system is in urgent need of preconditioning to be ready to drive, mode 5 shown in Figure 13 is activated. The system operates in a similar manner to mode 4, but now the LCC is active (3-way valve directs refrigerant to both cabin condenser and LCC). This provides a thermal link between the heat pump and the drivetrain so the heat pump can supply energy to the drivetrain coolant. In this mode, the octovalve is in position 2, connecting the whole drivetrain coolant loop in series. Heat generated by the drivetrain and energy gained by the heat pump at the LLC is transferred to the battery for preconditioning. The heat pump is still operating at COP = 1 but sharing the output between the cabin and battery; the low voltage heaters can be activated to serve the cabin at higher demands.
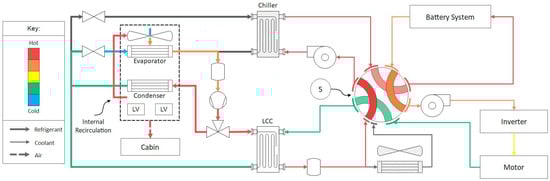
Figure 13.
Heating mode 5: Thermal circuit diagram with relative fluid temperatures.
2.4.6. Mode 6
Figure 14 shows the system in mode 6, which is a battery heat only mode. Active during the same conditions as mode 5, excluding demands to heat the cabin. The mode may also be active when charging the vehicle in extremely cold ambient conditions, heating the battery up to a temperature which will speed up charging and prevent long-term damage to the battery. On the heat pump side, the 3-way valve routes the refrigerant to the LCC, which returns via the EXV, chiller, and compressor. Having the LCC and chiller active sets the system in a compressor as heater mode (COP = 1). This is because, on the coolant side, the coolant absorbs heat at the LCC and the heat is then partially reabsorbed by the chiller. The addition to the coolant is equal to the energy input to the compressor. Therefore, in this mode, compressor input energy and drive unit waste heat are used to heat the battery system.
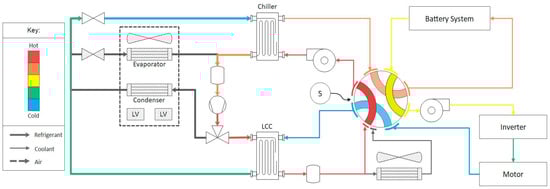
Figure 14.
Heating mode 6: Thermal circuit diagram with relative fluid temperatures.
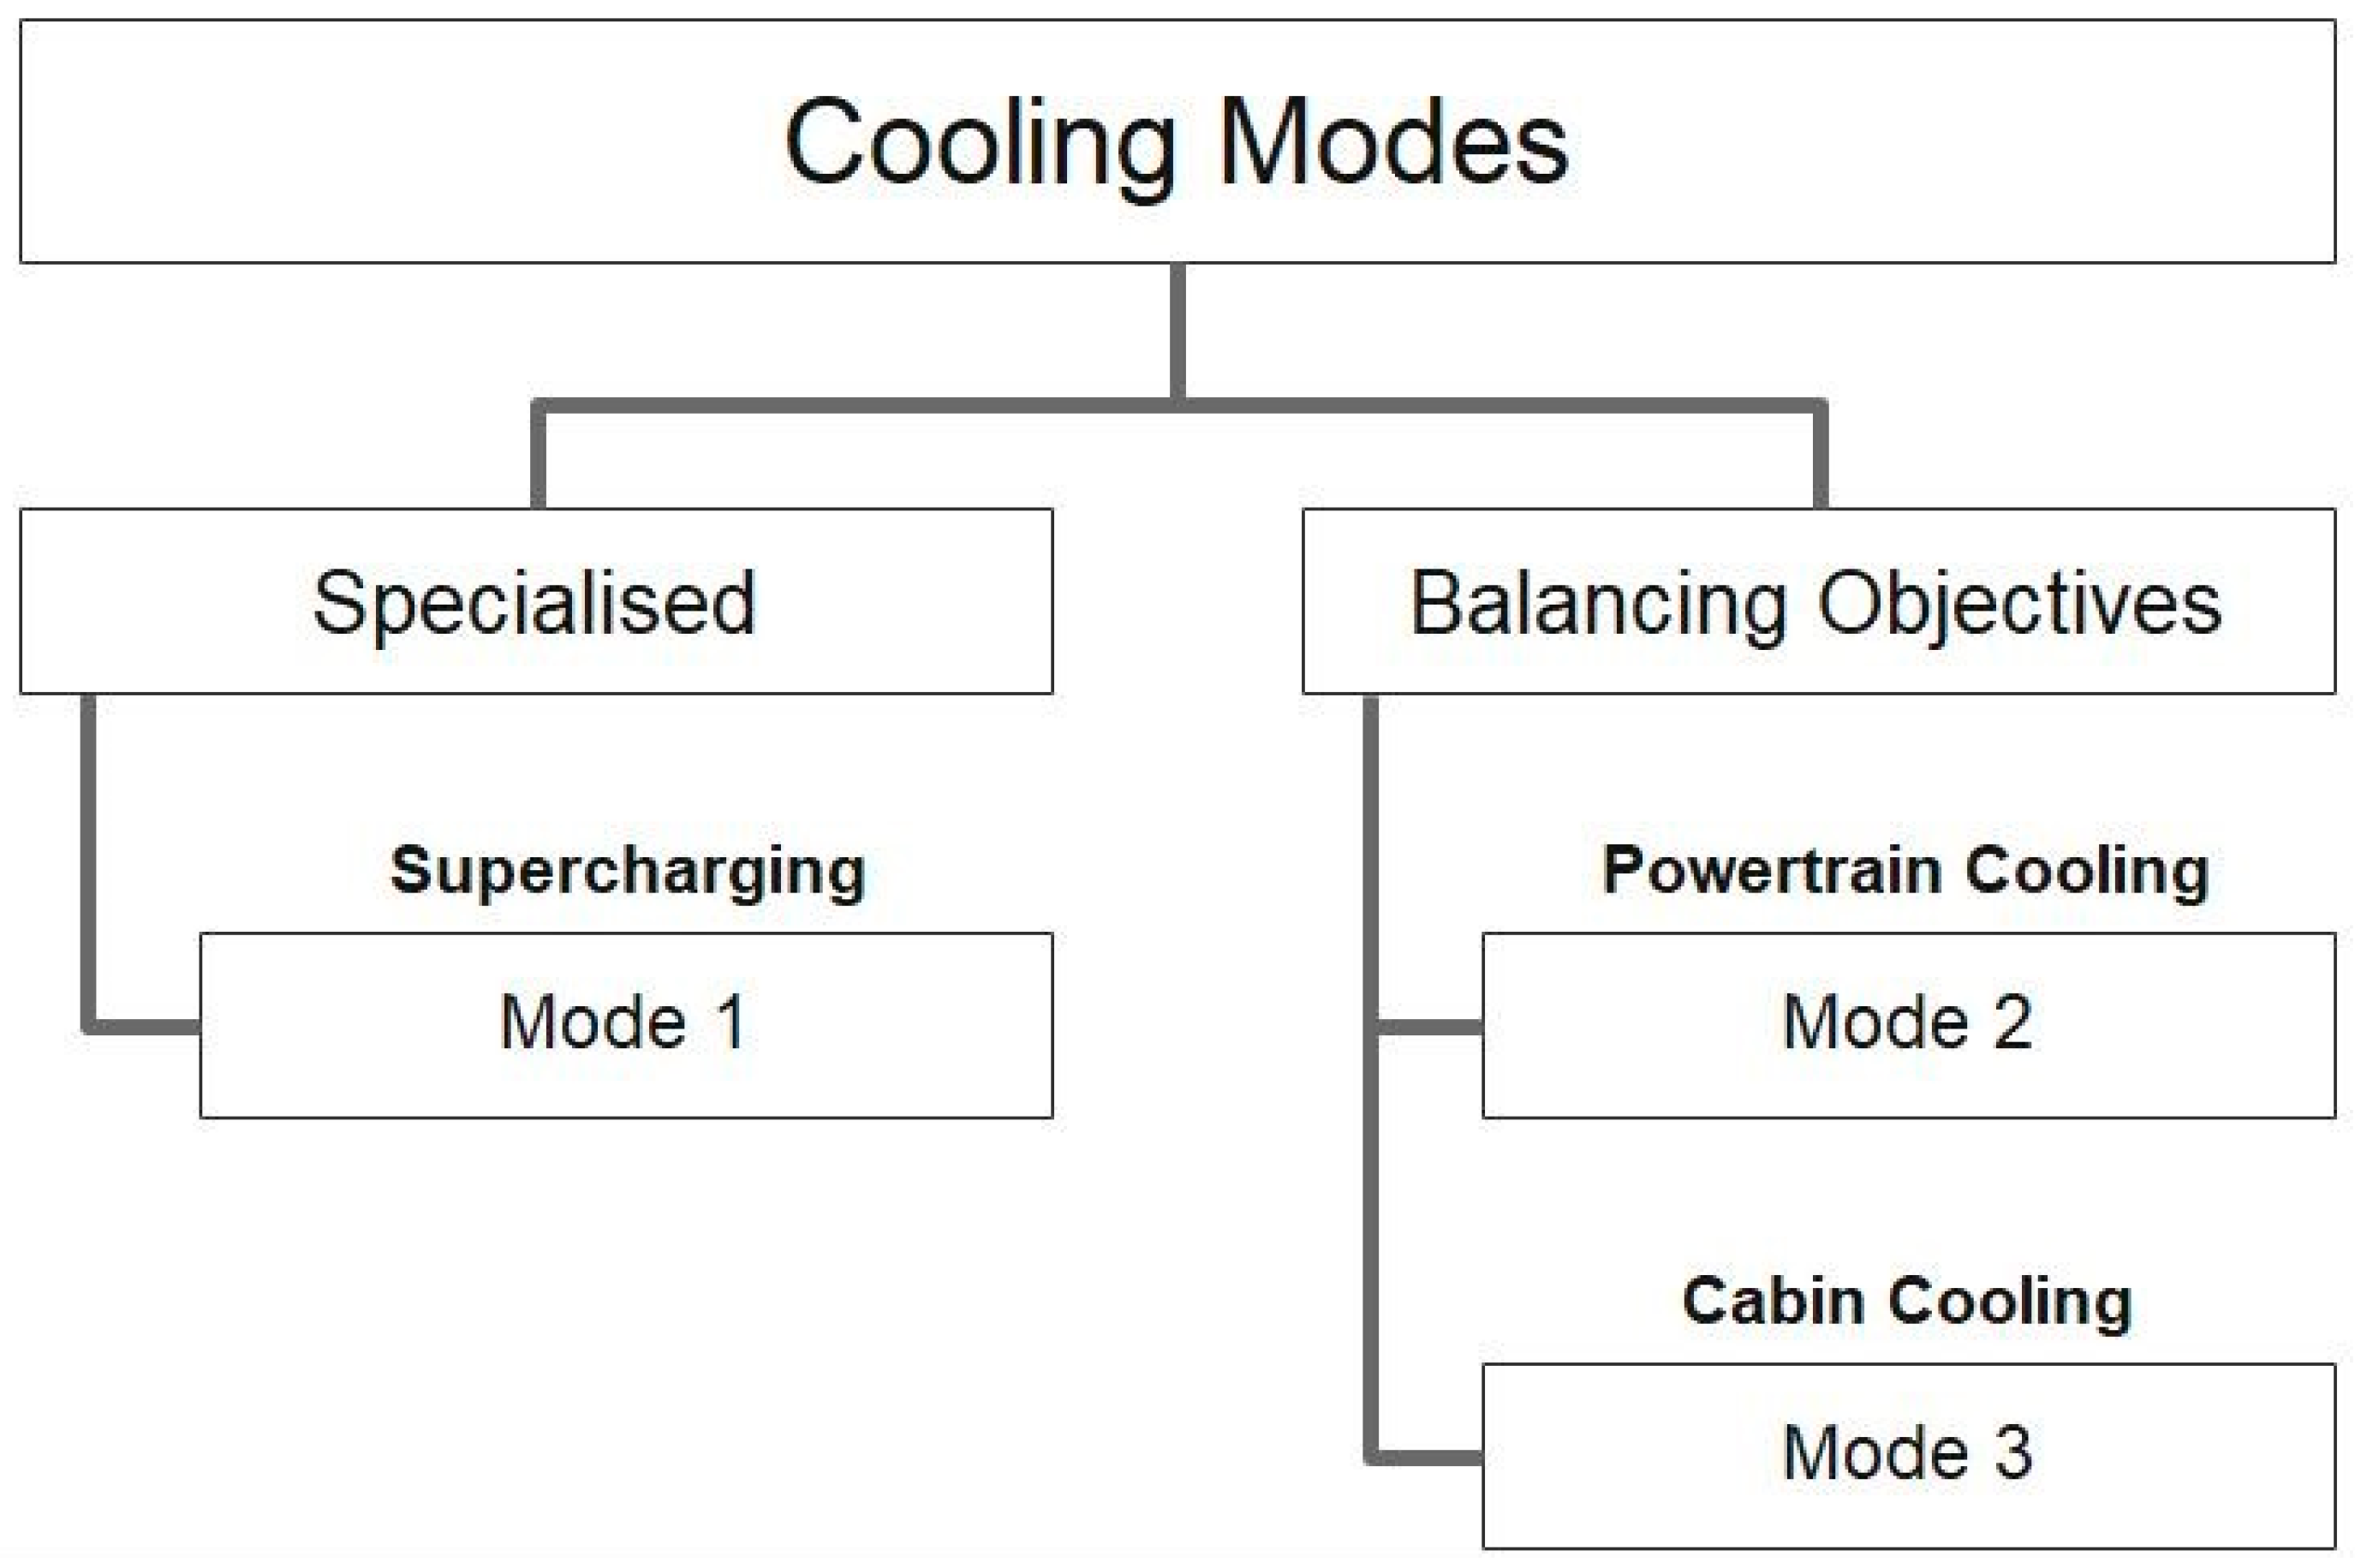
2.5. Cooling Modes
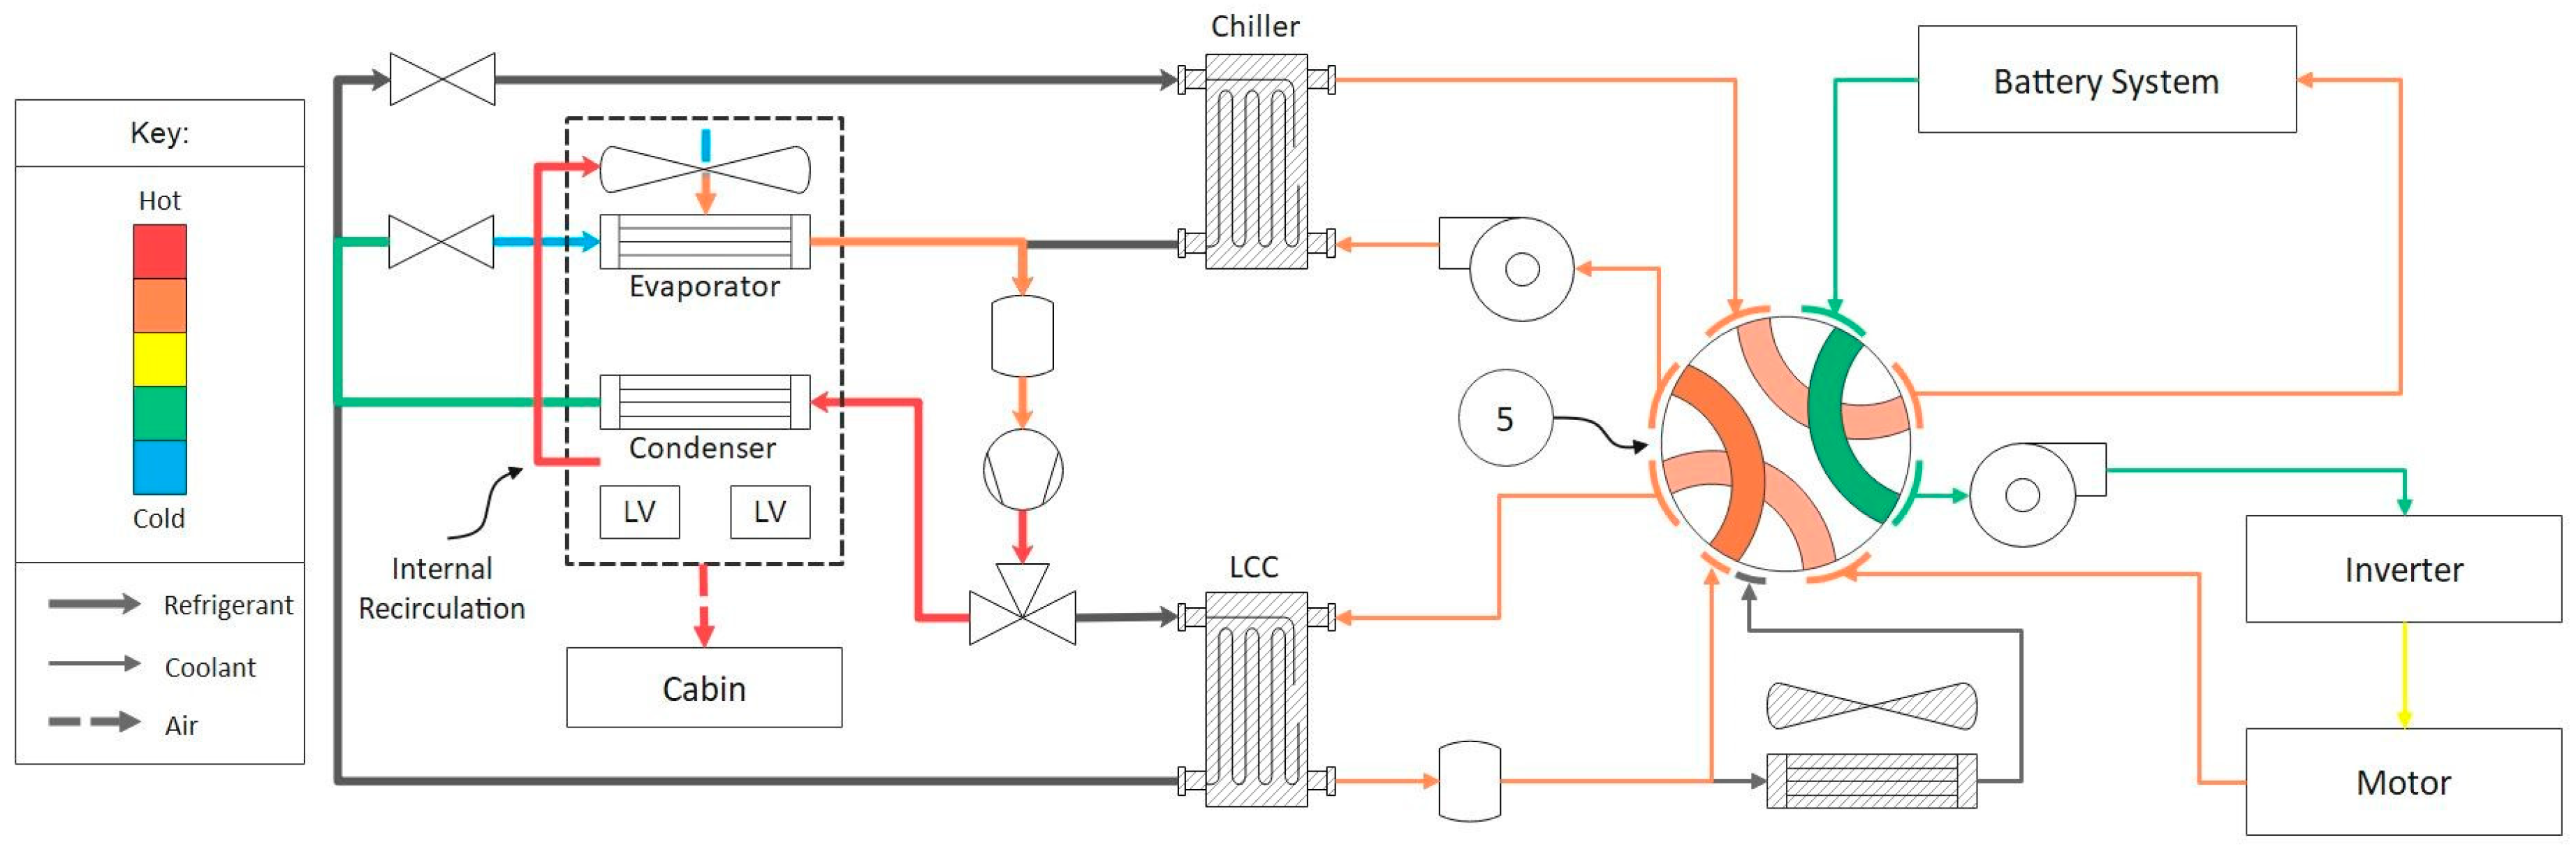
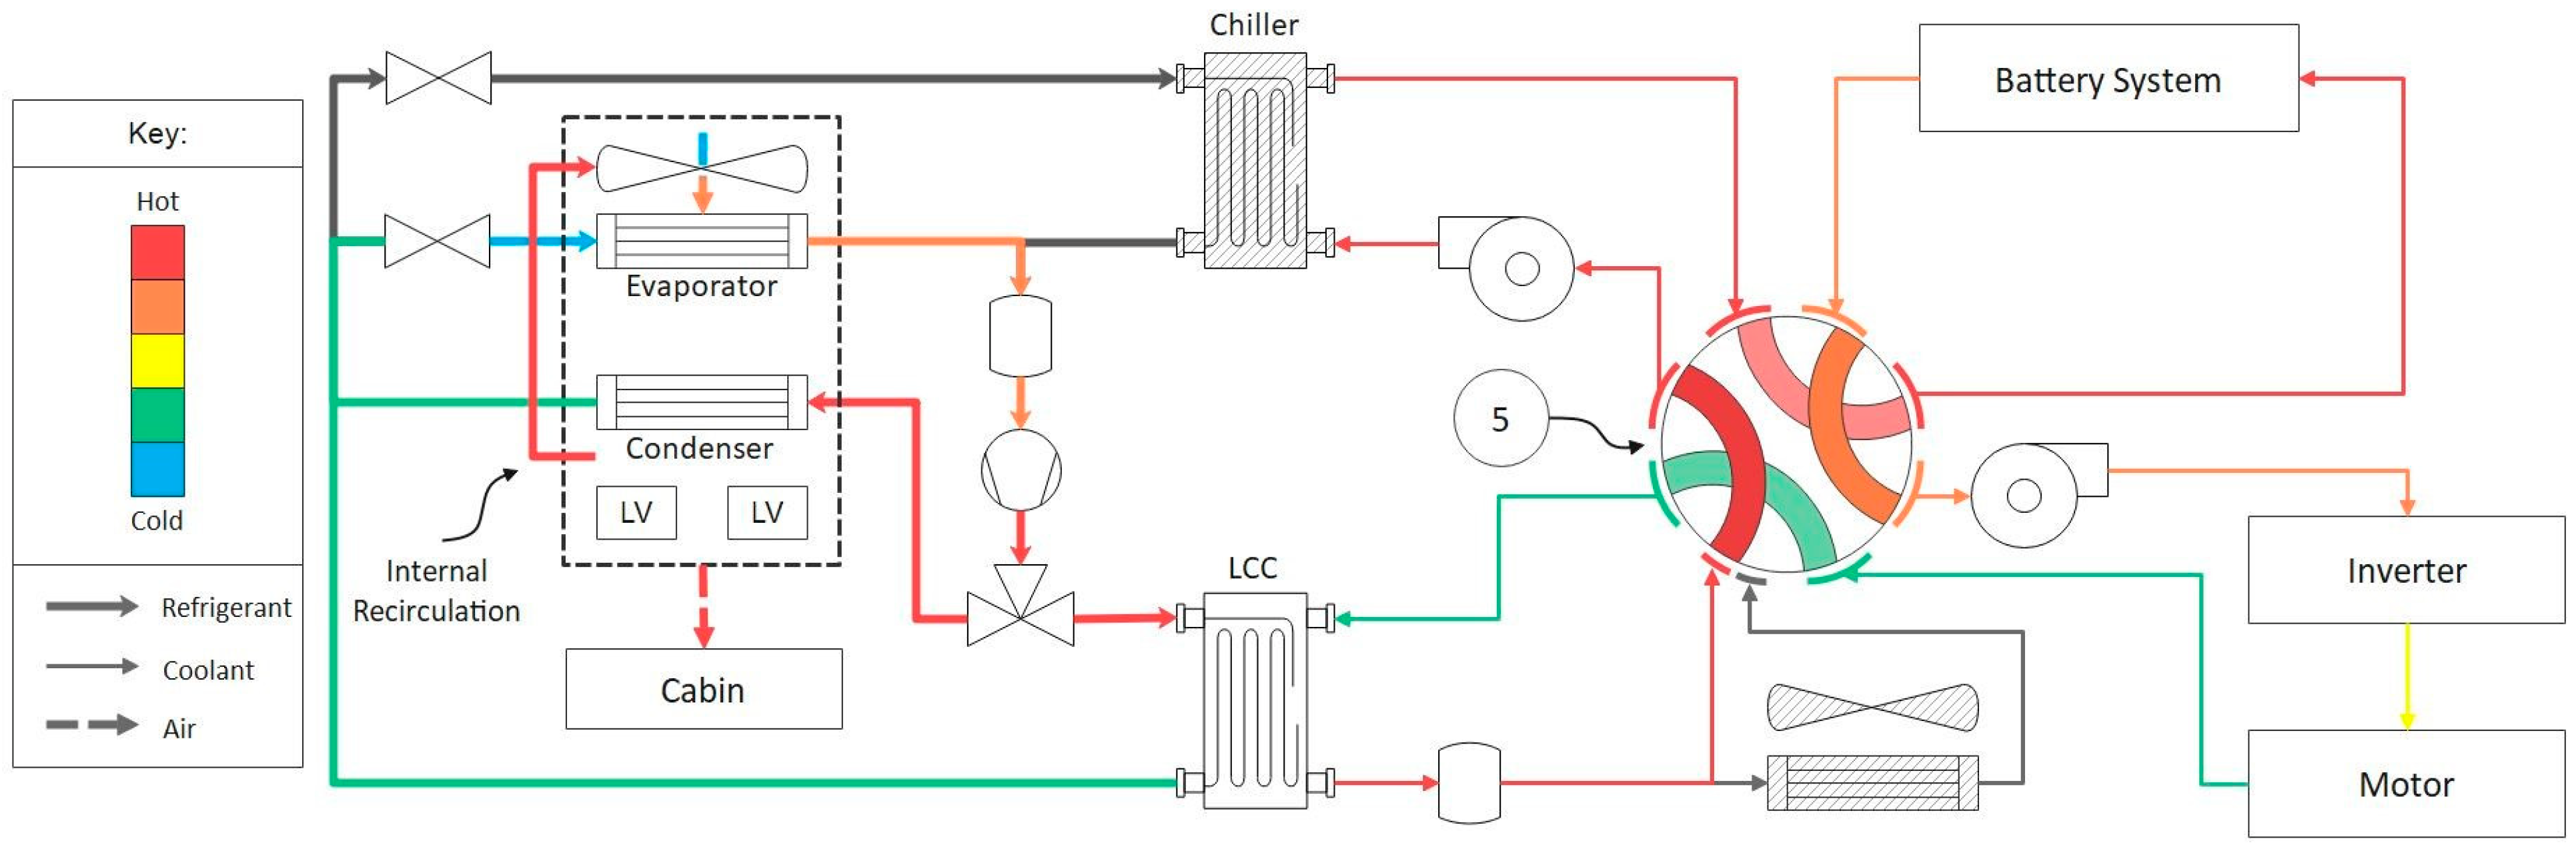
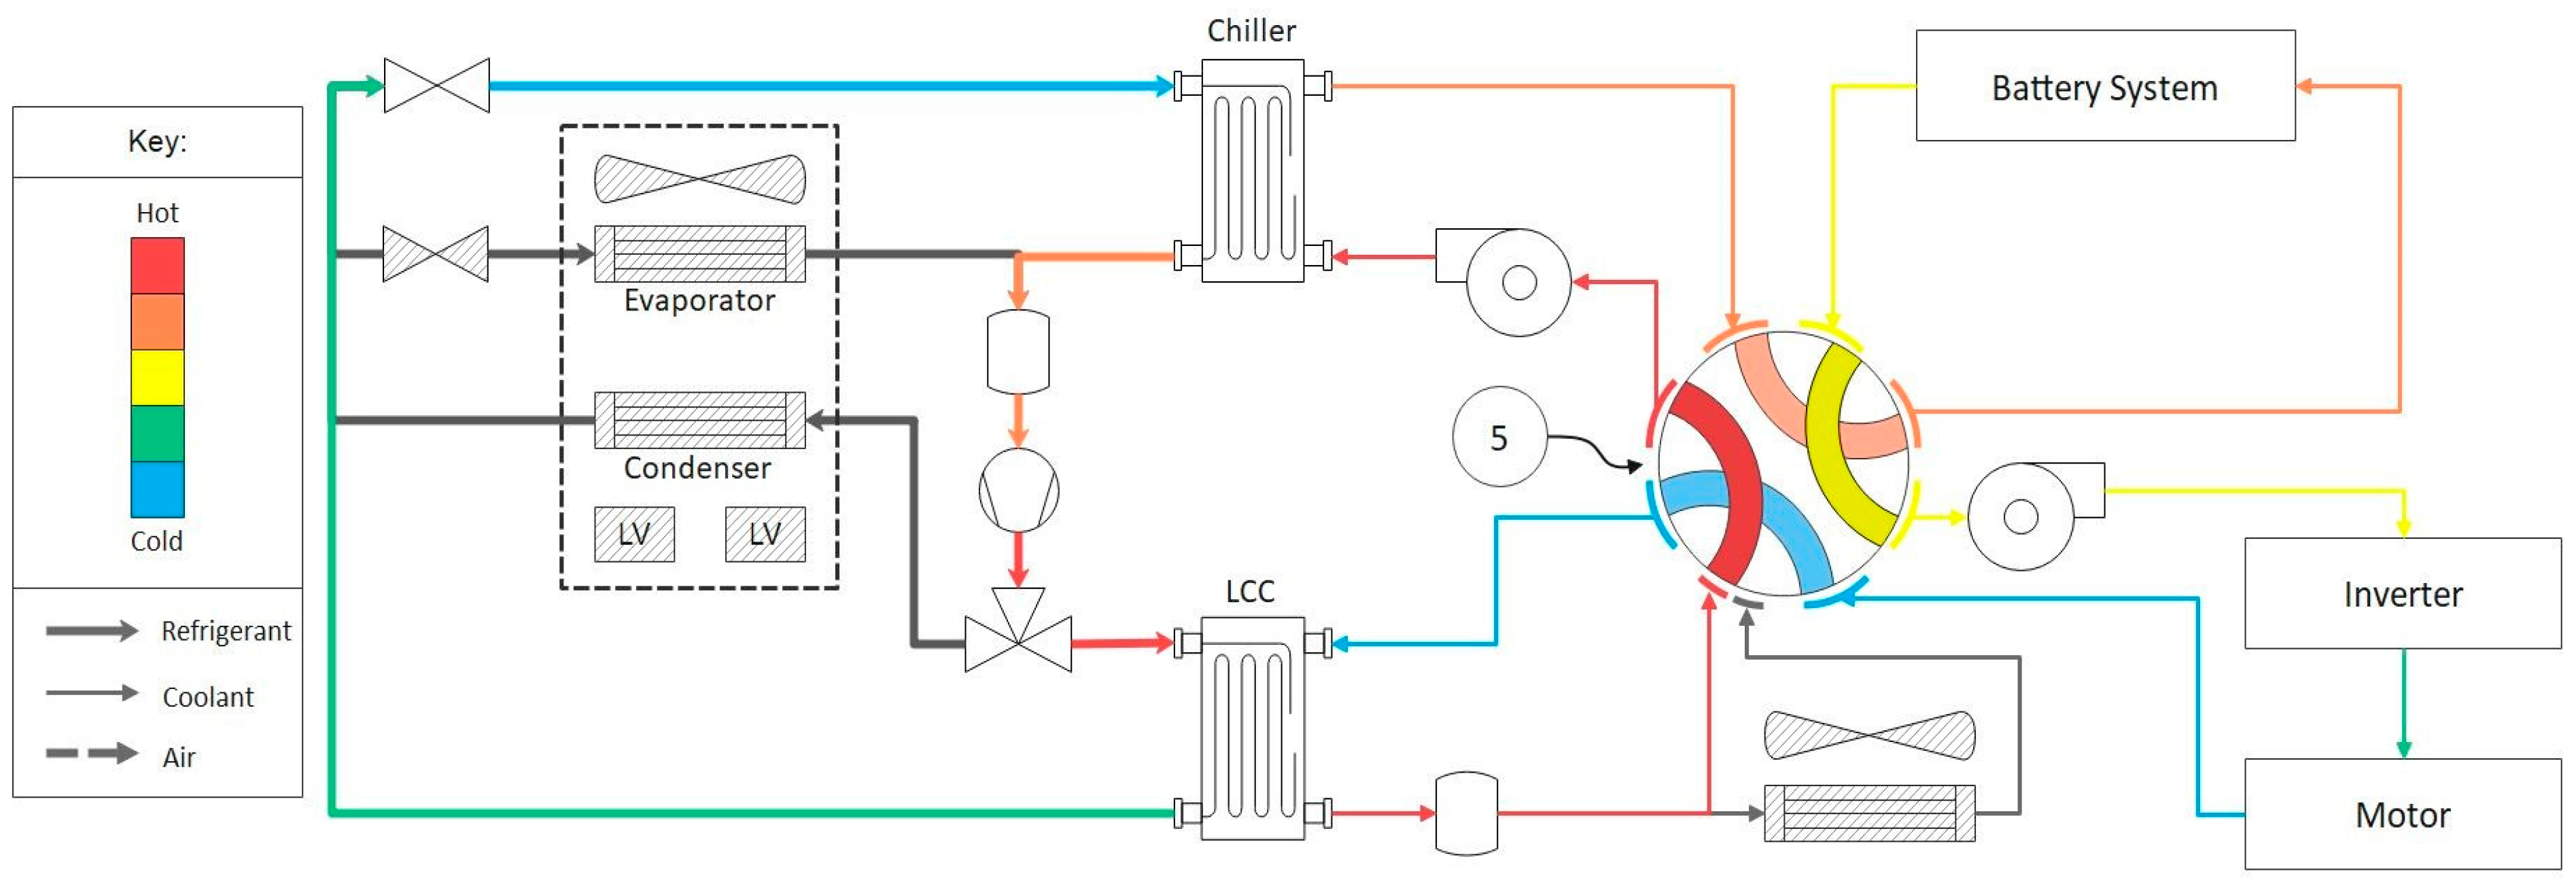
The system under analysis has a total of 3 cooling modes, each with a primary objective(s) where the net energy to the target components(s) is <0. There is one specialised mode for assisting battery cooling during supercharging and two balancing objectives modes, shown in Figure 15. Only the core “Balancing Objectives” modes for cooling are explored.
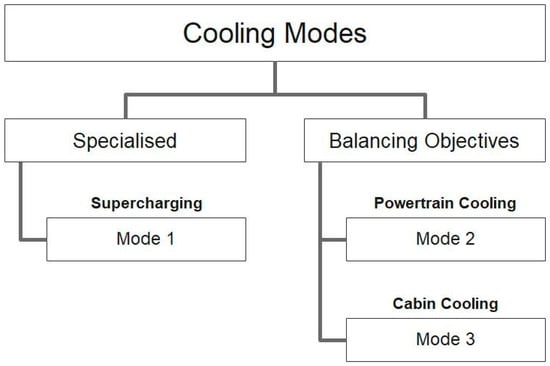
Figure 15.
Octovalve cooling modes.
2.5.1. Mode 2
Mode 2 shown in Figure 16 is a cooling mode used for optimal vehicle performance (e.g., on a track or a Vmax hill climb). In this mode, the chiller is active, removing heat from the coolant entering the battery. The heat transferred to the refrigerant is rejected through the radiator via the LCC. If the radiator cannot reject all the heat, then the condenser can be used to reject heat into the cabin if necessary. This mode operates with the octovalve in either position 1 or 2, depending on which powertrain component is limiting performance.
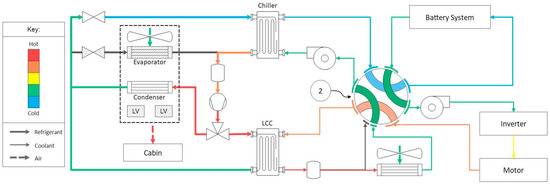
Figure 16.
Cooling mode 2: Thermal circuit diagram with relative fluid temperatures.
2.5.2. Mode 3
Figure 17 shows the cooling mode 3, a pure cabin pull-down mode. After a long day in the sun, the occupants may want to fill the cabin with cool air. The heat pump deactivates the condenser and the chiller and re-activates the evaporator to absorb heat from the air entering the cabin. The LLC rejects the heat to the coolant. If the battery is sufficiently cooled, the octovalve will move to position 2 so heat is rejected to ambient, drive unit, and battery. Otherwise, all heat will be rejected to ambient in position 1, and the battery will remain in a closed loop.

Figure 17.
Cooling mode 3: Thermal circuit diagram with relative fluid temperatures.
2.6. Operating Mode Summary
To summaries the operating modes described in Section 2.3 and Section 2.4, Table 1 has been created. Table 1 shows the heating modes listed as H1-H6 and cooling modes listed as C2-C3. Each mode has an objective description, conditions for operation and the operating states of the octovalve and heat pump.

Table 1.
This table is a summary of all the heating and cooling for extreme conditions.
3. Octovalve Production System
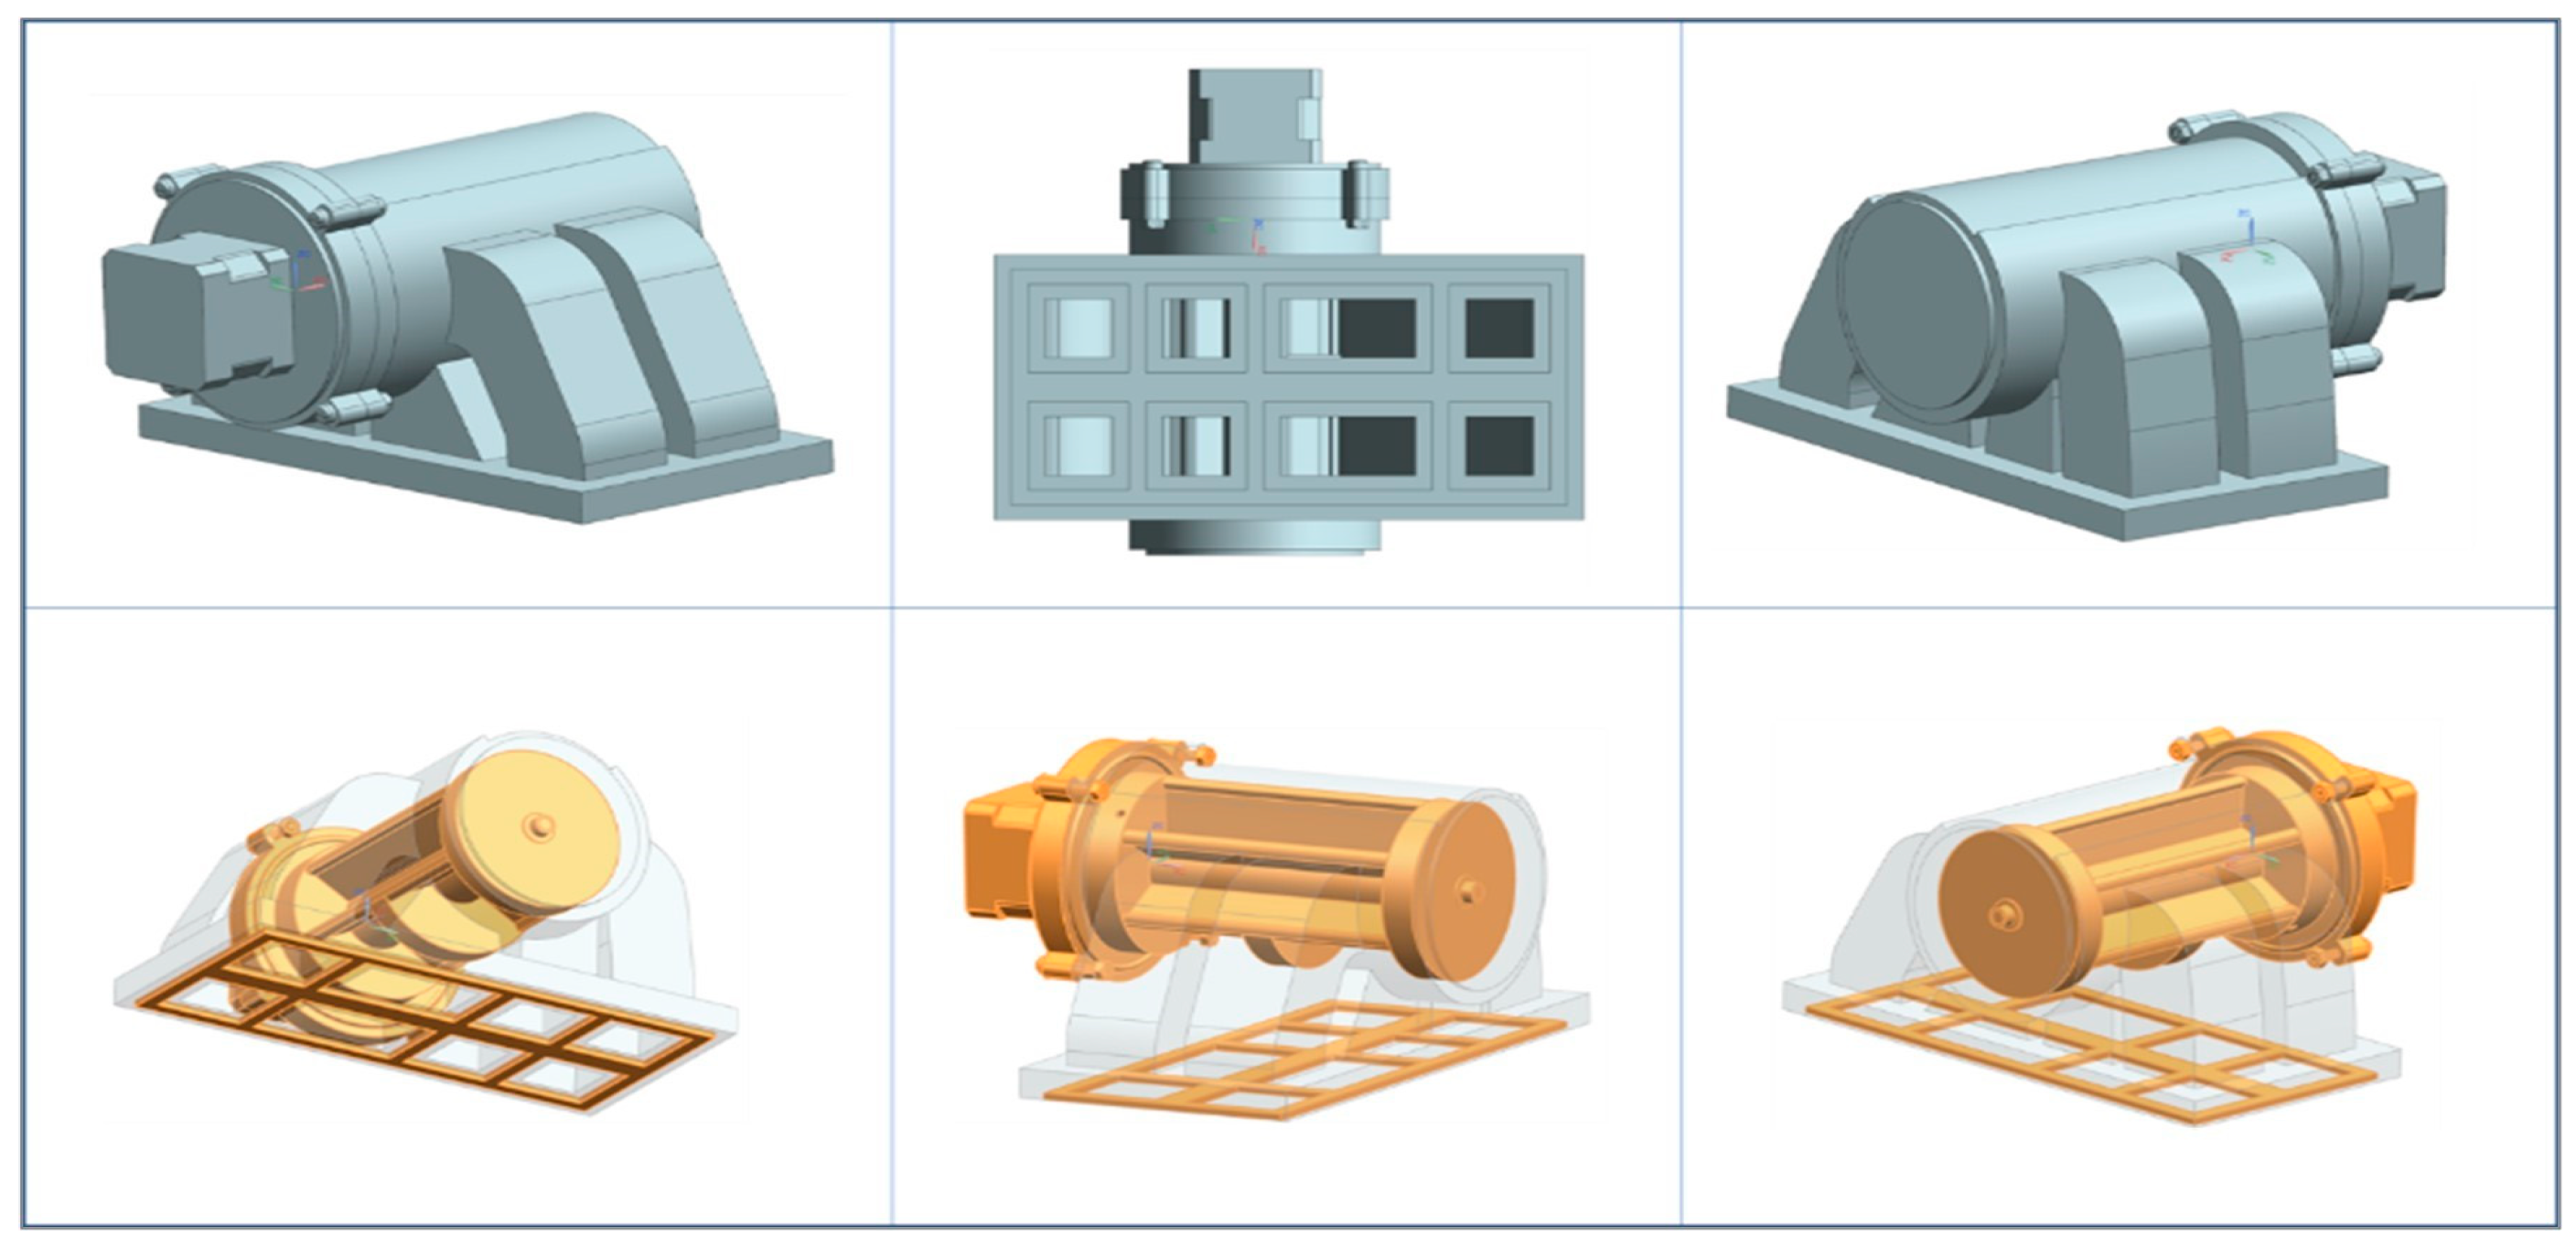
Sandy Munro [25] released a CT scan of the octovalve internals. This details a rotation wheel with a housing containing eight ports: four ports along the radius by two ports along the axial length. The wheel has four dividers, each directing flow between two axially opposite ports and two adjacent divides directing flow between two neighbouring radial ports. From the scan, an NX model has been developed to help better understand the inner workings of the octovalve (Figure 18).

Figure 18.
Siemens NX model of the octovalve: eight port rotational valve design.
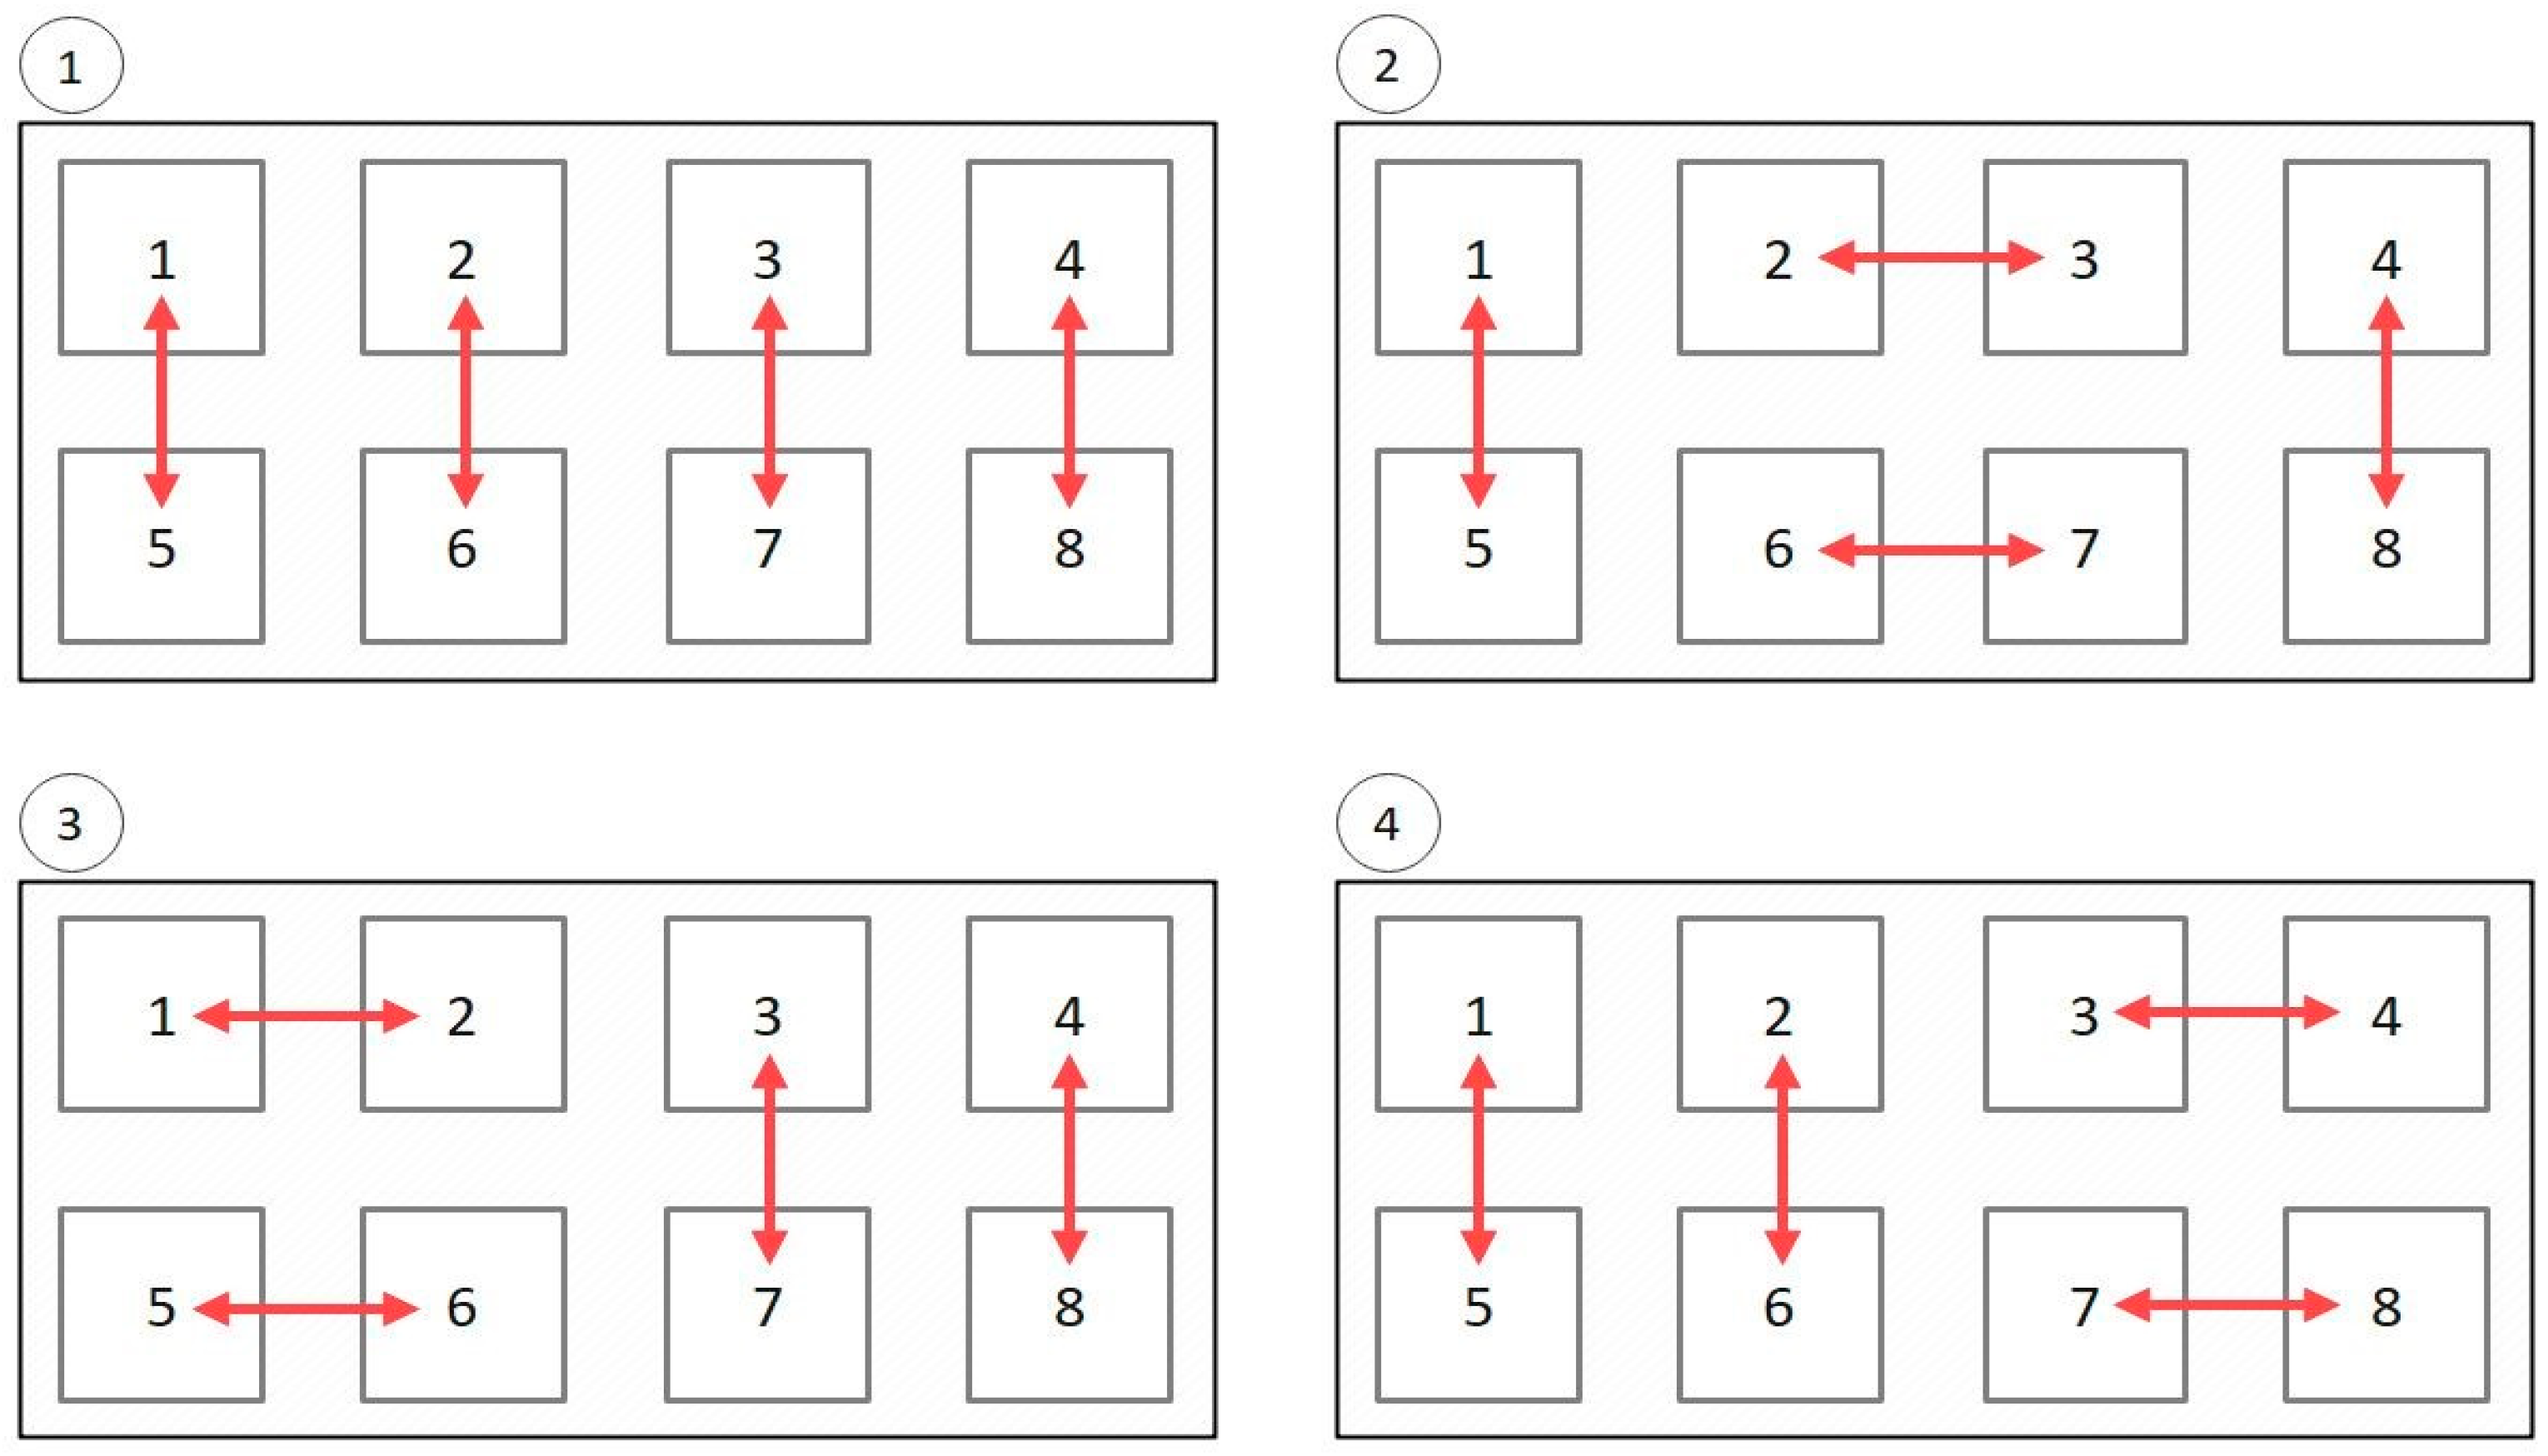
From Figure 18, it can be determined that the valve has only four possible states, which does not align with the number of states in the patent. The four port combinations are shown in Figure 19.
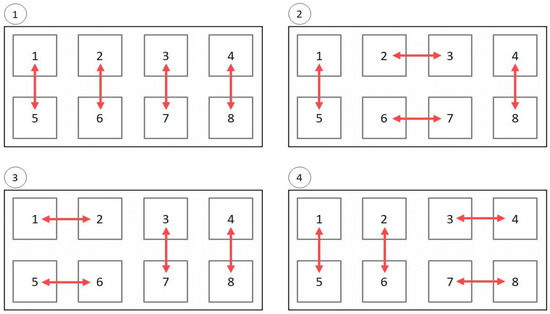
Figure 19.
Octovalve: eight port valve combinations that are possible with design shown in Figure 18. The ports are label from 1–8 and the arrows show the coolant flow between ports for combinations 1–4.
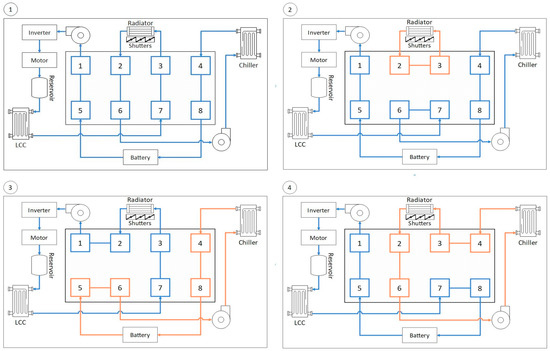
From Sandy Munro’s and his colleagues’ descriptions of the production system [25], along with the detailed footage of the system with labels, the following coolant layout has been assumed (Figure 20). On the production system, the LCC is now in series following drive unit and reservoir. This is believed to have been changed to reduce the complexity of the octovalve or reduce the total number of electronic actuators required to obtain the ninth output port shown in Figure 1. Munro’s colleague confirms the only actuators on the coolant side of the system are the single valve (octovalve), the two pumps, fan, and radiator shutters to open/close air flow to the radiator. As a result, it is not possible to have the six octovalve states present in the patent. With both the battery loop and chiller loop remaining the same, the only viable layout is shown in Figure 20.
4. Modelling and Simulation
4.1. Octovalve Thermal Model (OTM)
For this paper, Simulink Simscape has been used to develop a 1D thermal model of the OTS. Simscape’s multidomain platform makes it easy to build thermal, thermo-liquid, 2phase fluid, and moist air networks with an integrated control strategy designed in Simulink. The parameters used to build the following model are obtained by using parameters from the comparison model discussed in Section 4.2. This is acceptable as the purpose of this paper is to present the pros and cons of the architecture and the way it operates. Keeping parameters similar makes for a better comparison and mitigates the need for validation as used in the literature [26,27].
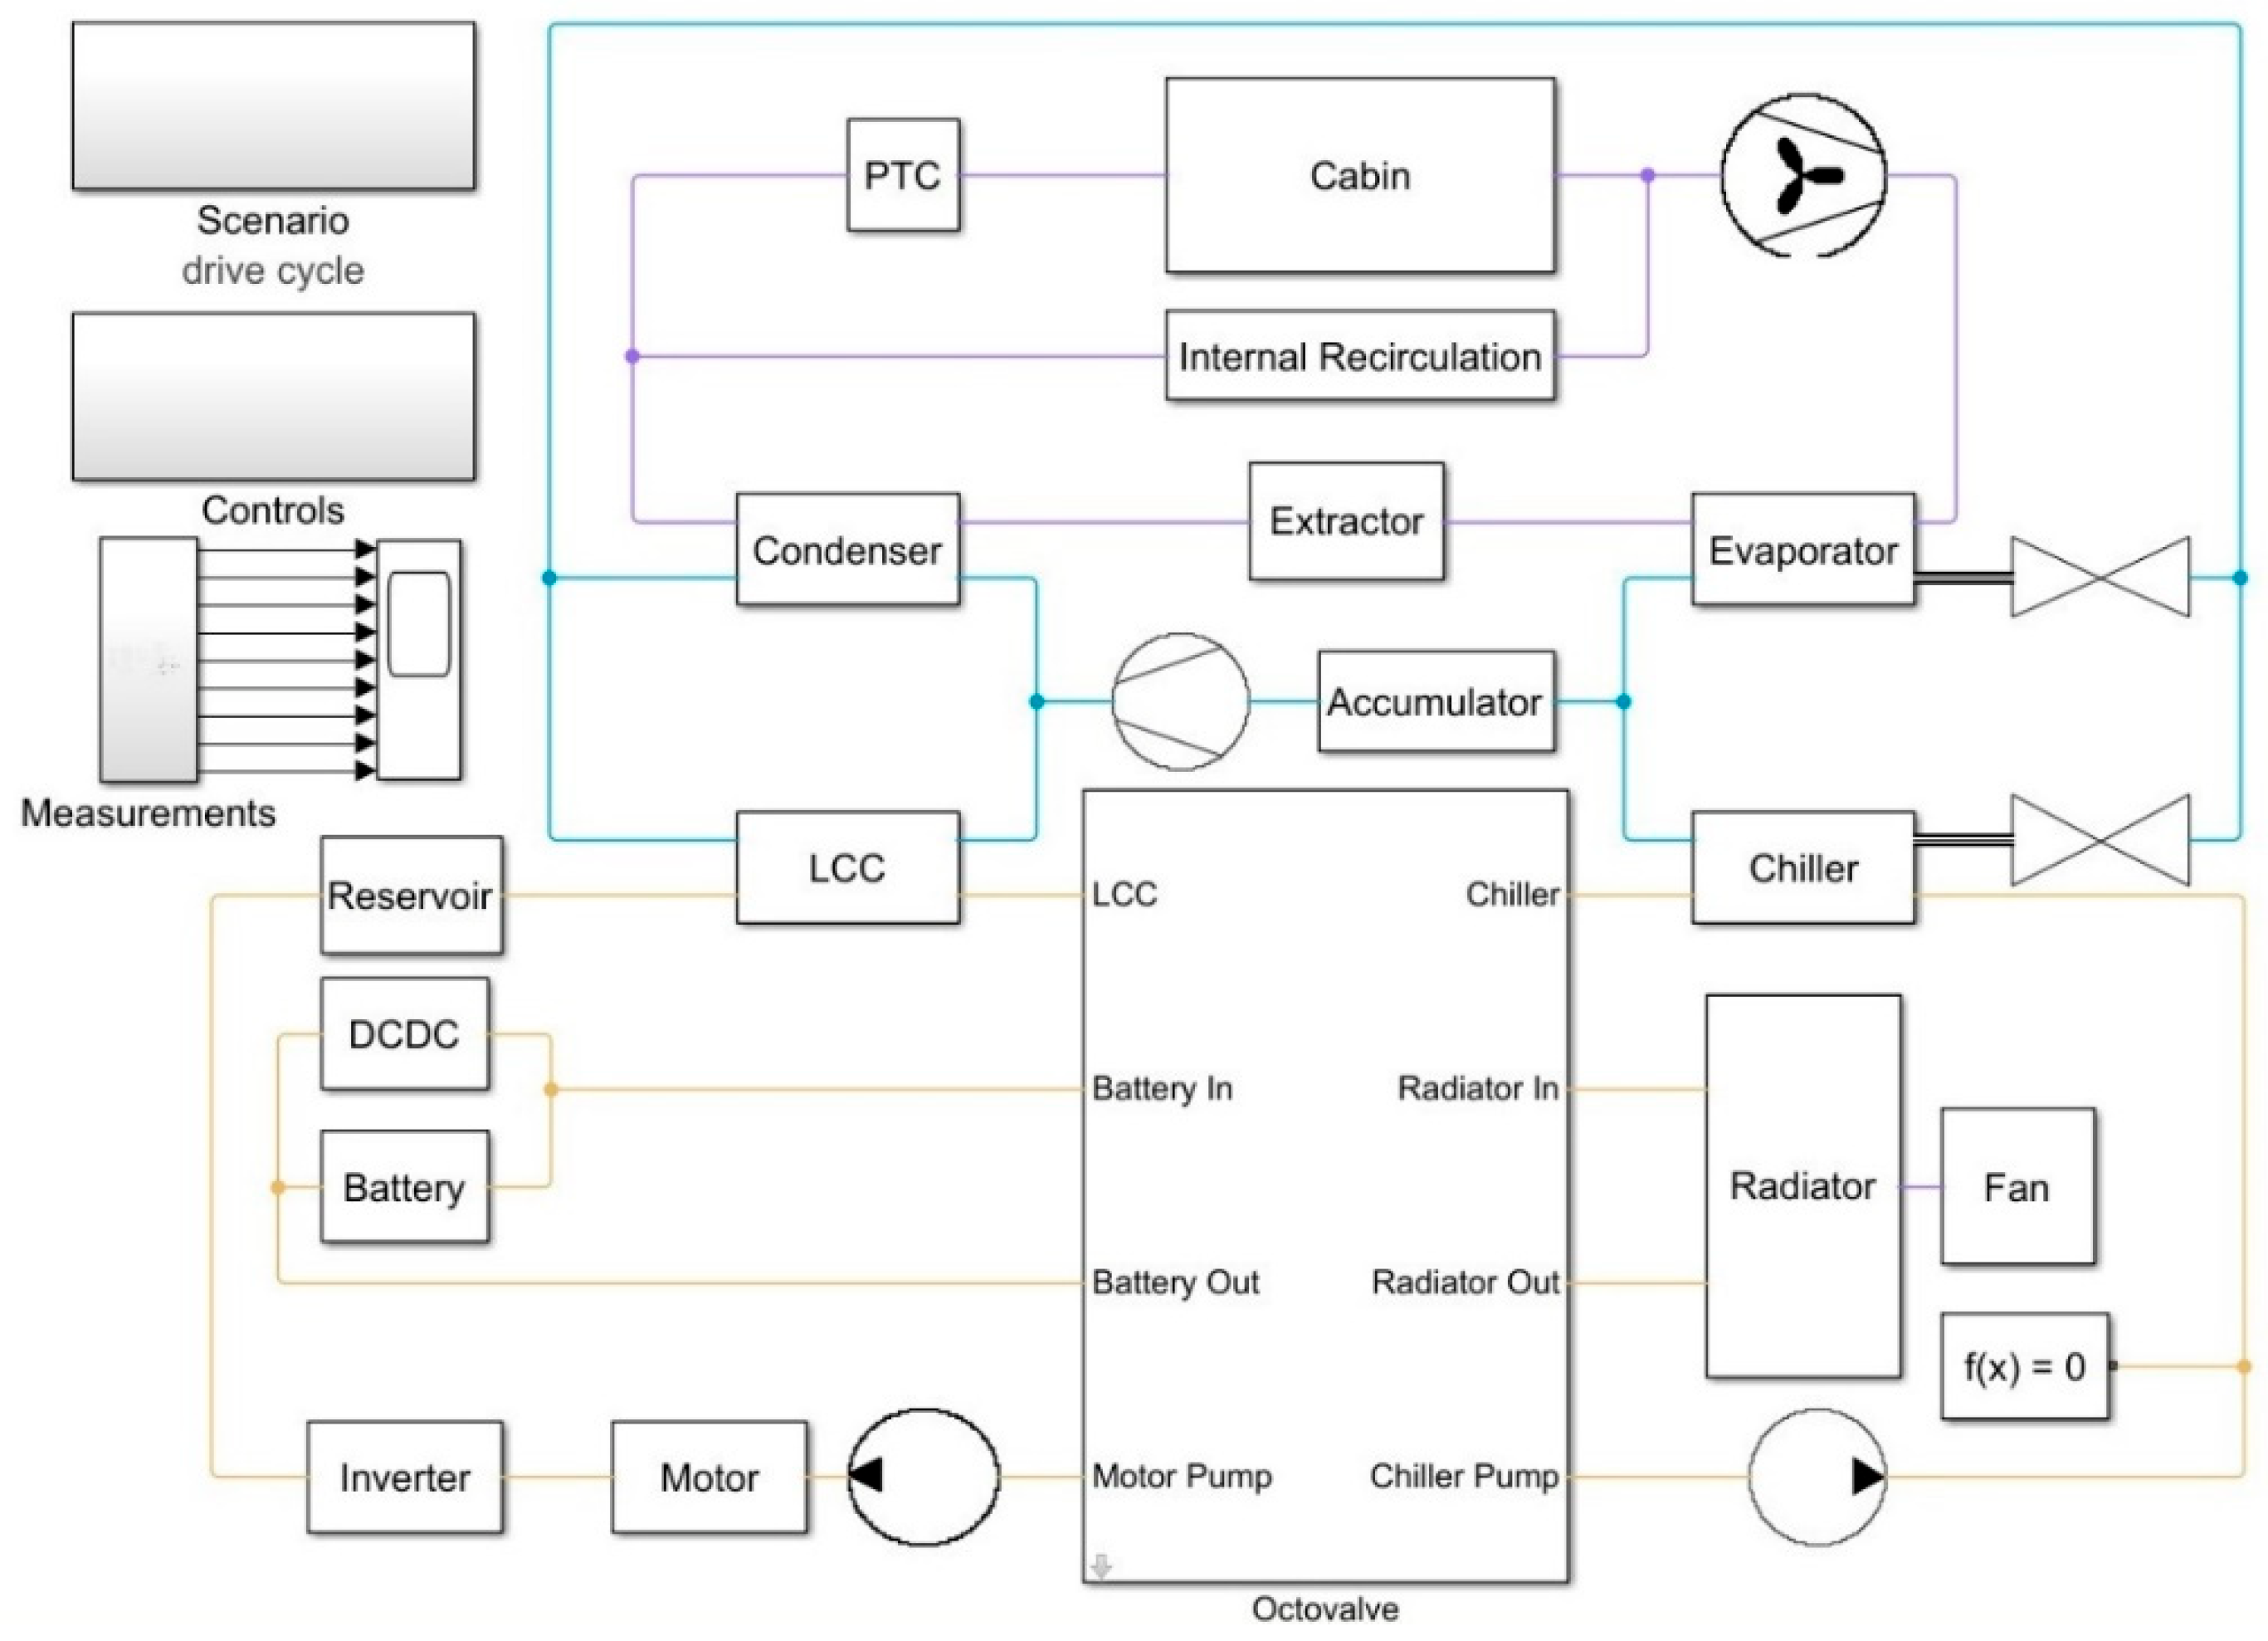
Figure 21 shows the octovalve thermal model (OTM). The thermo-fluid architecture has been designed using the coolant routes in Figure 20, and the refrigerant circuit and HVAC case have been built using Figure 3 and Figure 4. The model uses a single zone cabin model; therefore, the HVAC case outlet is a single outlet instead of the four shown in Figure 4.
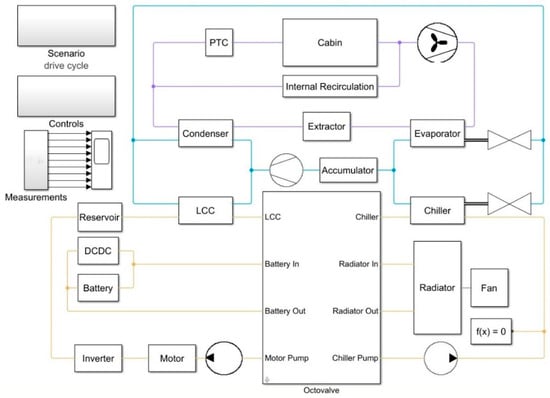
Figure 21.
Simulink Simscape octovalve thermal model (OTM).
4.2. Electric Vehicle Thermal Model (ETM)
MathWorks has an example model named ’sscfluids_ev_thermal_management’, which is a simscape model of a typical WHR EV thermal system (ETS) which will be used for comparison for analysis of the OTM’s performance. For an accurate comparison of the two systems, subsystems from the MathWorks example have been reused in developing the OTM. The aim is to reduce the dissimilarities between the models, so only the core design differences are assessed. New subsystems included in the OTM include:
- Octovalve;
- Reservoir;
- LCC;
- Accumulator;
- Extractor;
- Internal Recirculation.
4.3. Tese Case and Control
In this paper, the operation of the OTS will be assessed in normal ambient conditions shown in Table 3. Therefore, this paper will not focus on cabin warm-up or pull-down. Instead, a powertrain warm-up will be the focus of the analysis.
Table 3.
Table of test cast environmental conditions.
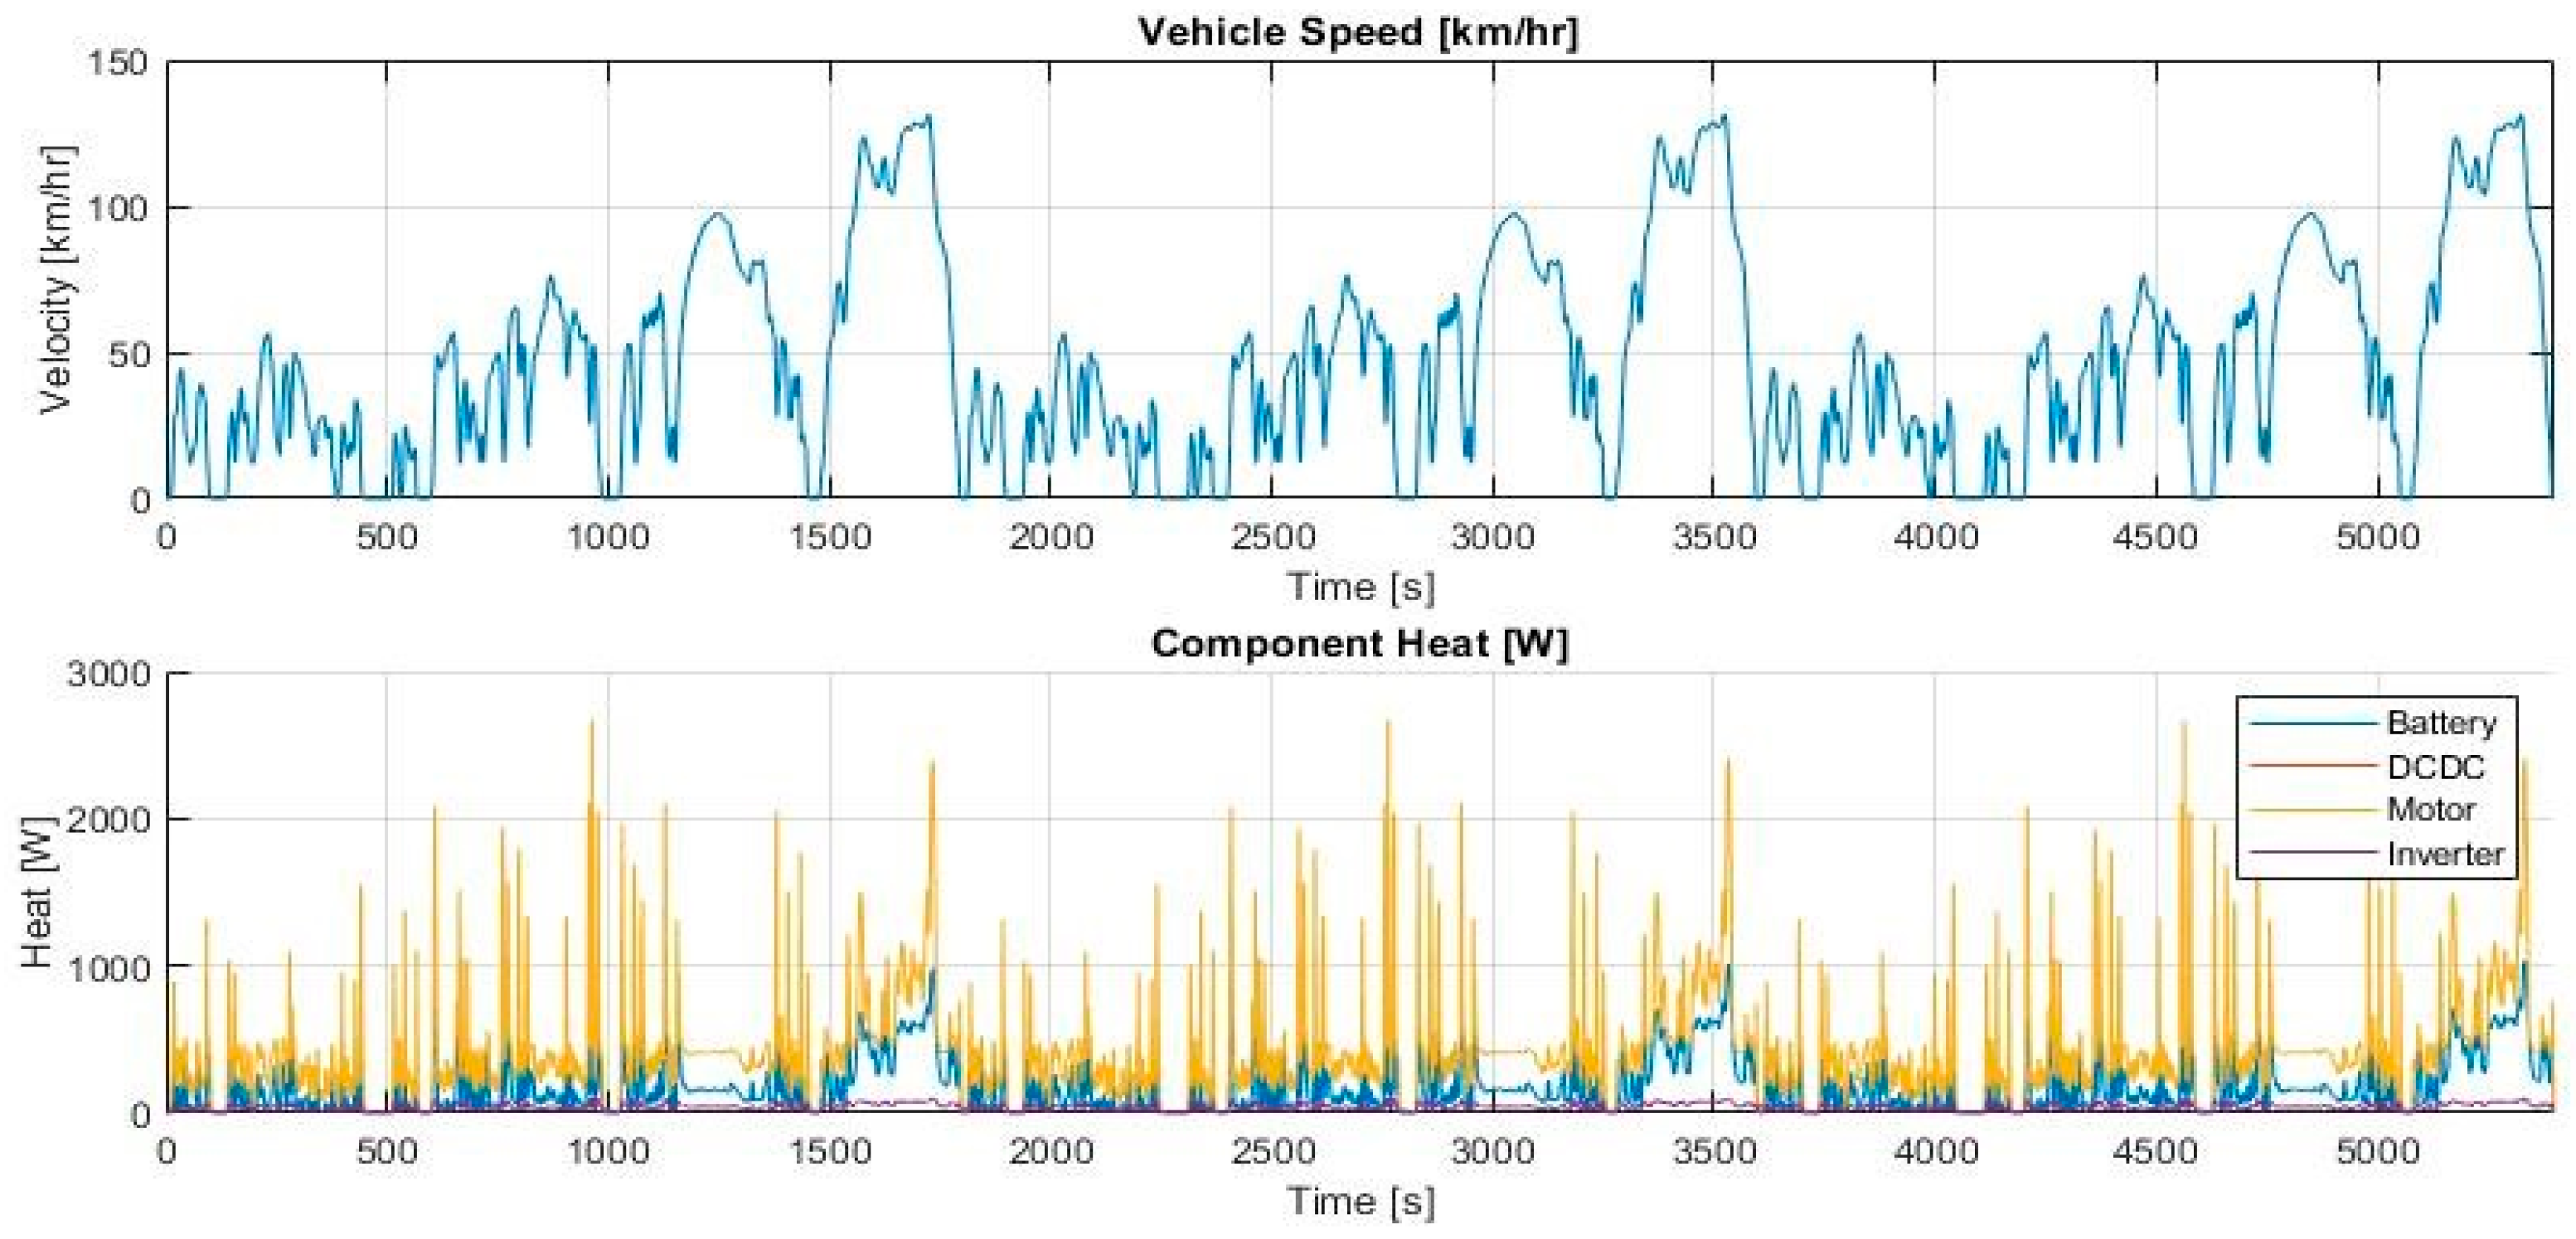
The models will operate three continuous WLTP drive cycles to capture powertrain warm-up and constant operating temperature behaviour. Heat generated for each of the powertrain components is mapped against vehicle speed and acceleration as in the MathWorks example [28]. The resulting test case input is shown in Figure 22.
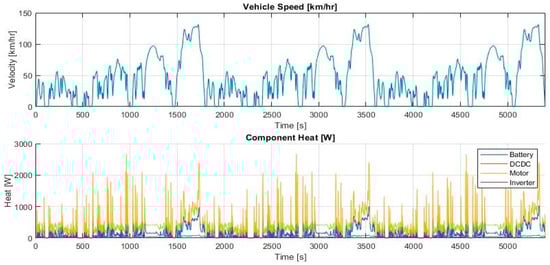
Figure 22.
Simulation test case under analysis.
To ensure similarities between the models are maximised, the control strategies are kept as similar as possible. For both models, the pump and fan are a function of temperature; this remains unchanged from the MathWorks example. The target powertrain operating temperature is shown in Table 4. The octovalve heat pump in its heating mode will activate under the same condition as the battery heater on the EV thermal model (ETM).
Table 4.
Table of powertrain target/optimal operating temperature.
Some updates have been made to the ETM control strategy. These have been made for the model to operate the new test case without issues. It was discovered that the compressor stalls if it is shut off after its first cycle. Instead of shutting off the compressor, the new control reduces compressor speed to a minimum to avoid stalling when not in operation. The thermostat now has a PID controller to fully open at inverter/motor operation temperature, rather than being fully open over 20 °C. This strategy is used for the OTS’s radiator shutters. Table 5 shows a summary of all the control strategies used on both models.
Table 5.
This table shows the controls applied to the OTM and ETM for the test case under analysis.
The pump, compressor, and fan performance are constant between the two models. Therefore, the energy consumption of the actuators will be used in the analysis. This will be used to assess the trade-off between warm-up time and auxiliary load. Both models are not capable of assessing complete powertrain losses or battery degradation which may occur due to slow warm-up time.
5. Results
5.1. Powertrain Temperature Profile
The powertrain temperature profile is split into two sections, the warm-up period where all components reach their operating temperature and the constant temperature period thereafter. Observing Figure 23, the powertrain warm-up period can then be split into two further sections, the complete powertrain warm-up period and the motor warm-up/battery cooling period.
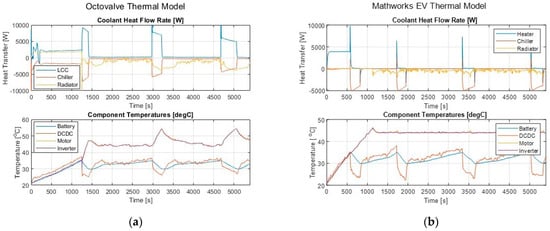
Figure 23.
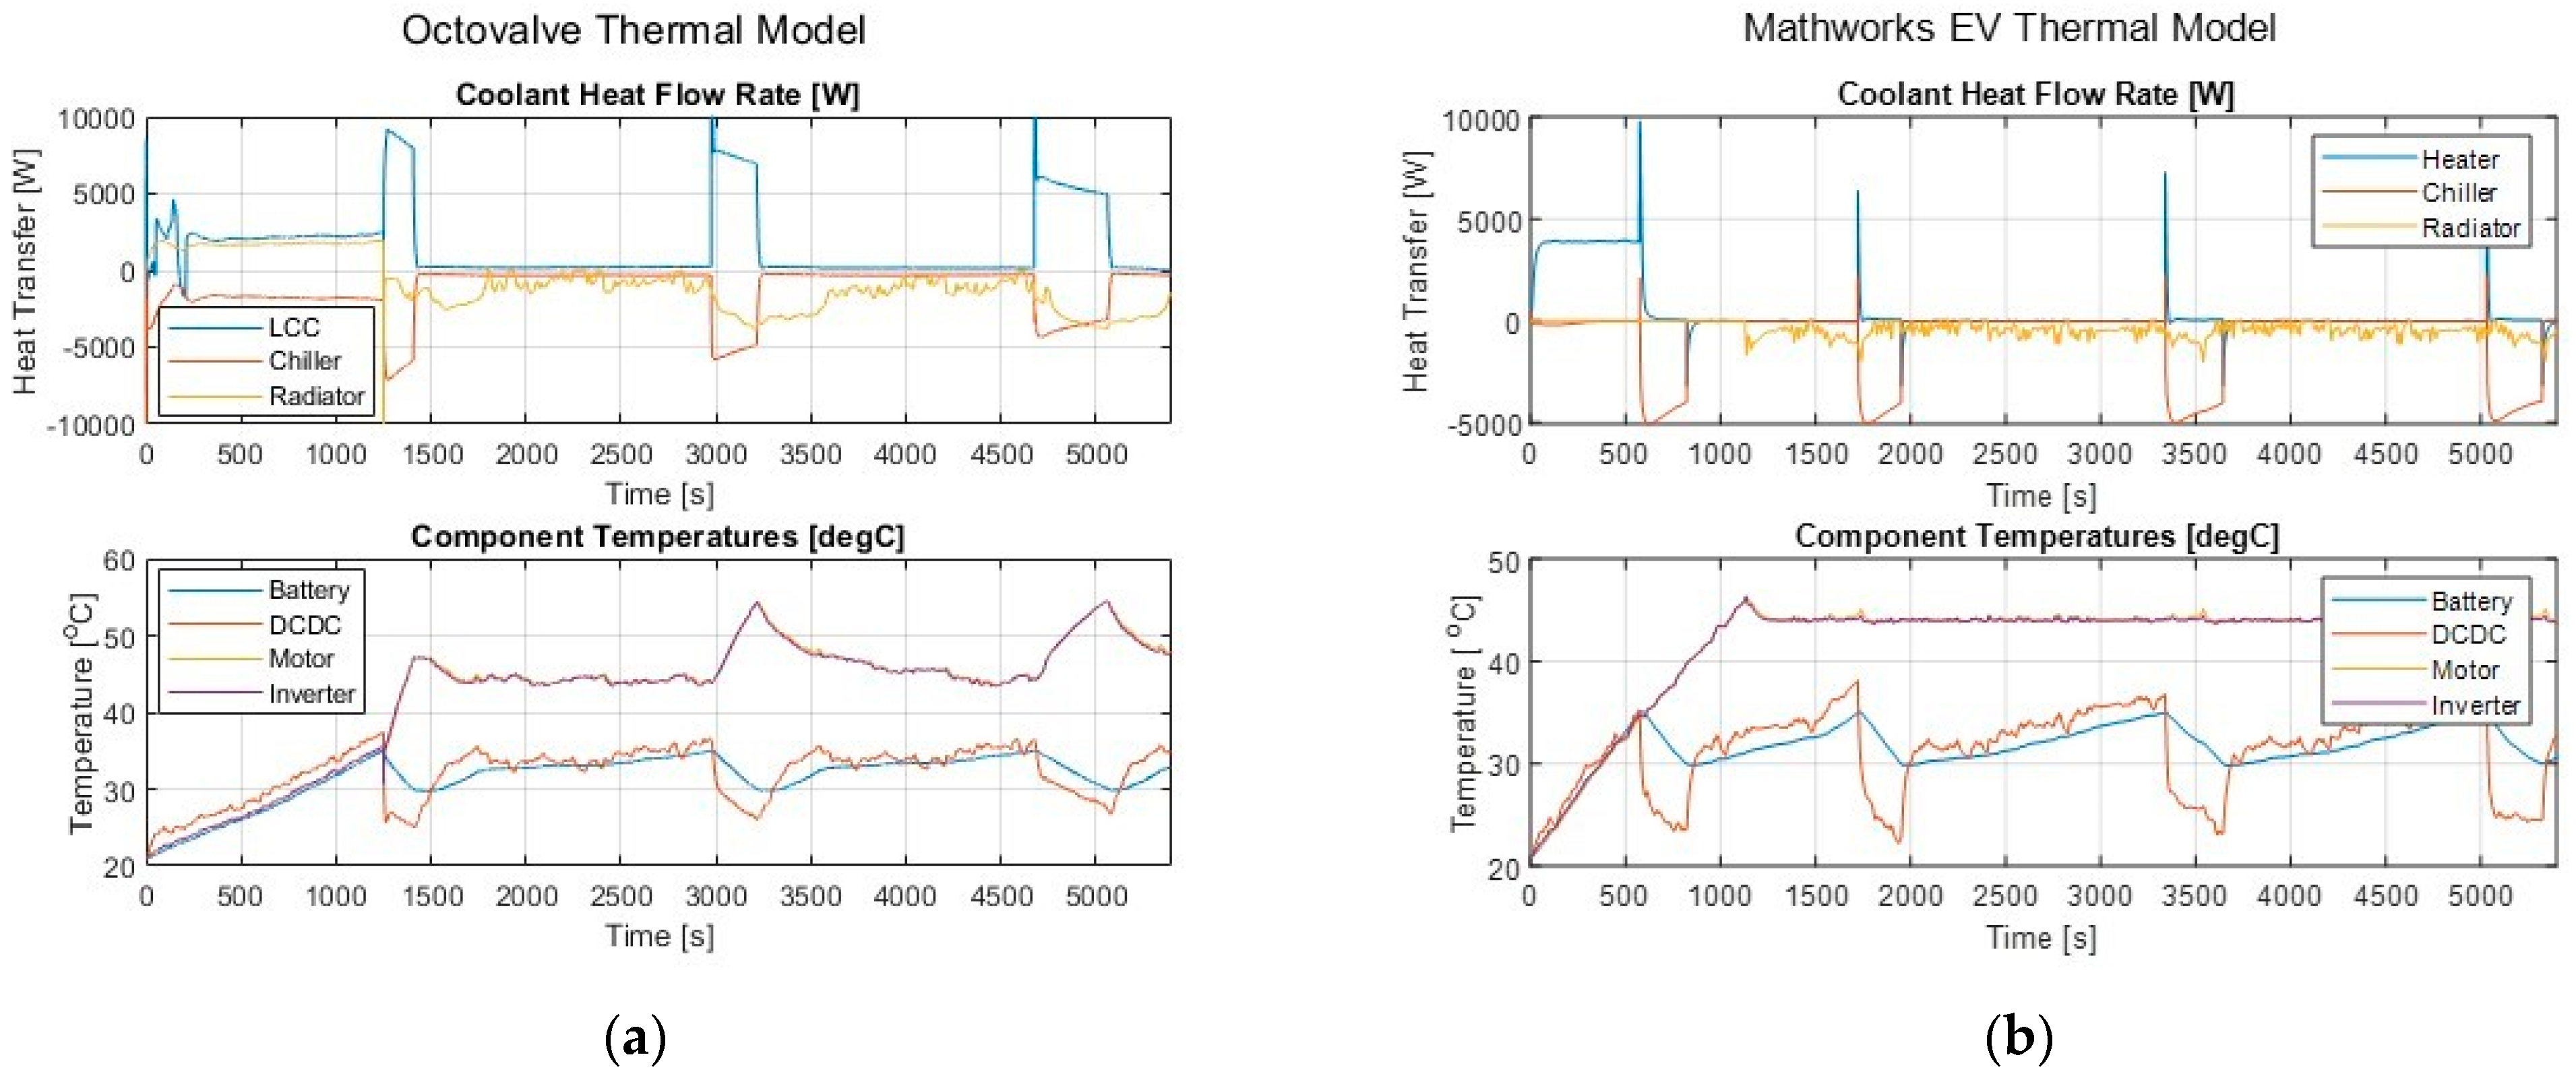
Simulation results show components’ heat flow rates into the coolant and powertrain component temperature. (a) Results for the OTM. (b) Results for the ETM.
The data in Figure 23 shows the OTM achieves the battery’s upper-temperature limit at 1245 s, whereas the ETM only takes 580 s, almost half the time. Both systems are operating in a way where the powertrain coolant is in series, as shown in Figure 24. The octovalve is in position 4, referring to the coolant circuit 4 shown in Figure 20. The aim for both systems is to ensure equal warm-up of the complete powertrain while all components are below their operating temperature. Figure 23 shows powertrain coolant is only supplied with 2.5 kW of heat by the LCC in this state compared to the constant 4 kW available with the battery heater.
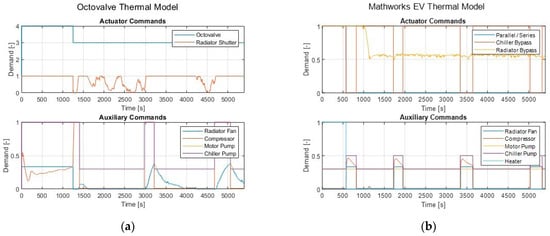
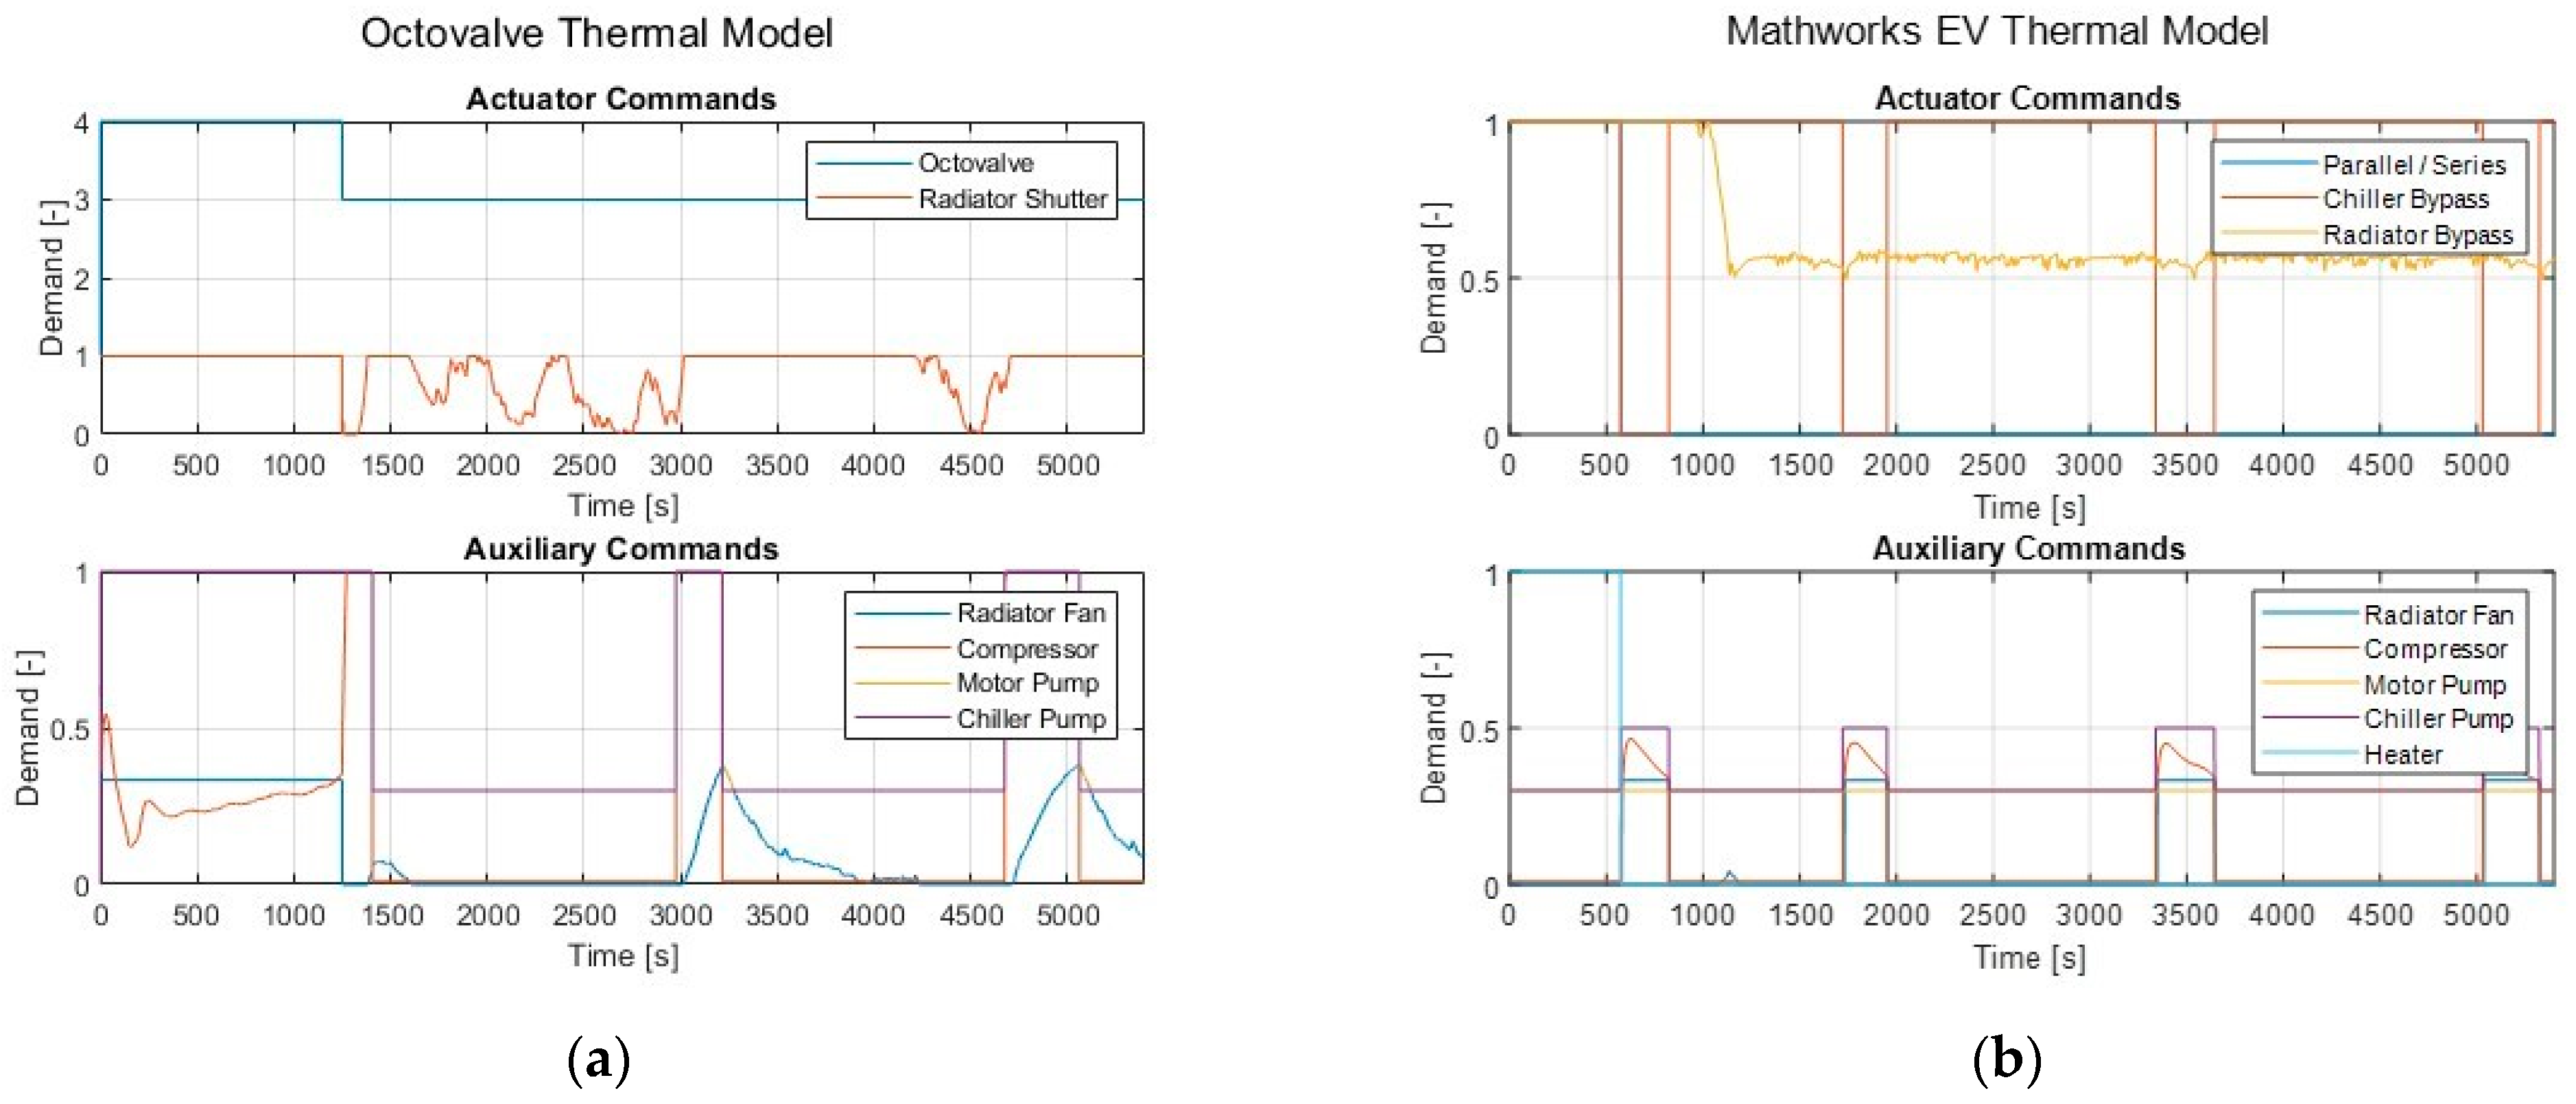
Figure 24.
Simulation results showing actuator commands and auxiliary commands. (a) Results for the OTM. (b) Results for the ETM.
In both cases, when the batteries reach the upper operating temperature, they are subsequently isolated from the rest of the powertrain and cooled with their respective chillers. Figure 24 shows the ETM in parallel, where the motor and battery are on separate coolant loops, and the OTM in mode 3. The ETM rejects this heat to ambient while the OTM moves heat from the battery loop to the motor loop through the chiller and LCC. During this time, 8–9 kW of heat is rejected to the motor loop, assisting its warm-up, while the ETM’s motor is left to warm up naturally. This results in the OTM heating the powertrain from 35 °C to 45 °C in just 135 s compared to 530 s for the ETM. Consequently, the OTM completes its full warm-up in 1362 s, whereas the ETM only takes 1115 s.
At 1400 after the motor/inverter reaches the operating temperature system, the OTM radiator shutter reopens, and the fan is activated to reject heat from the coolant using the radiator. This process continues until enough heat is rejected from the battery coolant to cool the battery to its lower limit of 30 °C. The radiator cannot reject enough heat to hold the motor/inverter to a steady 45 °C. From 1400 s to 5400 s, the OTM repeats this process of rejecting heat from the battery loop into the motor loop when the battery’s upper-temperature limit is reached. In between these battery cooling periods, for example, 3200 s to 4700 s, the motor loop temperature is regulated using the radiator shutter, fan, and pump shown in Figure 24.
Conversely, the ETM does not have this option. The only way to cool components is to reject the heat directly to ambient via the condenser or radiator. Following the battery reaching its upper-temperature limit the first time at 580 s, there is no interaction between the two coolant loops. The battery rejects its coolant to ambient using the chiller and condenser until reaching 30 °C. Then the chiller bypass opens, the compressor is deactivated, and the battery is left to warm up naturally (Figure 24). For the motor loop, the main actuator controlling the temperature of the coolant is the radiator bypass valve.
5.2. Auxiliary Energy Consumption
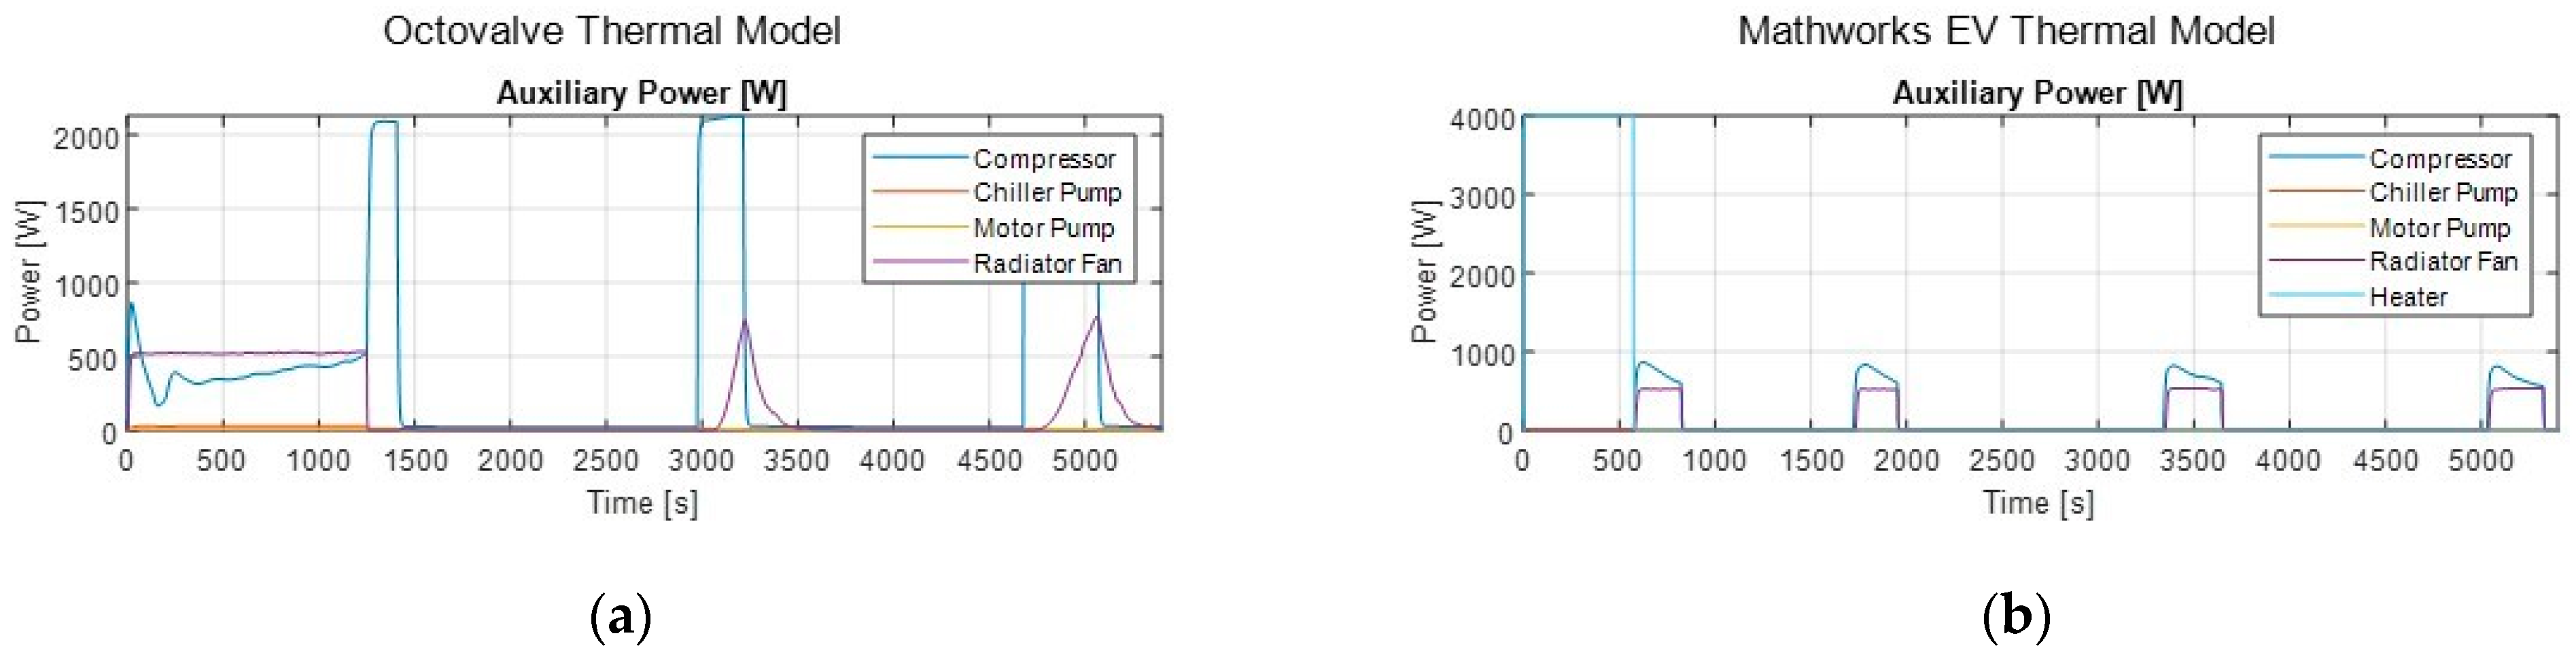
From an energy perspective, during the complete powertrain warm-up, the auxiliary loads are much lower on the OTM. Although only supplying 2.5 kW of heat during this period, Figure 25 shows the compressor operating at only 180 W to 500 W, resulting in a COP of 4 to 6, as shown in Figure 26. In addition, the fan operates at a constant 500 W, resulting in a total of 680 W to 1000 W during this period. On the other hand, the ETM is limited to a COP = 1 heat source. Therefore, the 4 kW of heat supplied requires 4 kw of input power, 3 kW to 3.32 kW more than the OTM during this period. Figure 26 shows that the OTM consumes only 300 Wh of energy during this warm-up phase compared to 640 Wh for the ETM.
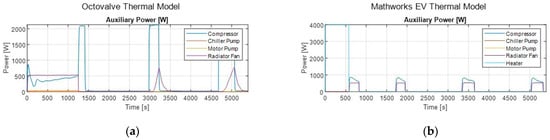
Figure 25.
Simulation results showing auxiliary power. (a) Results for the OTM. (b) Results for the ETM.
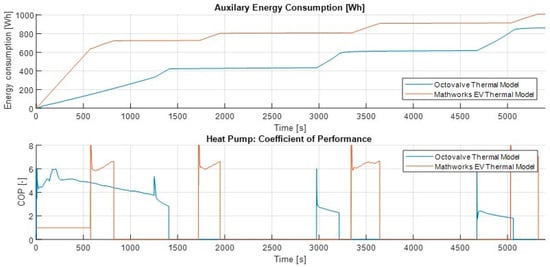
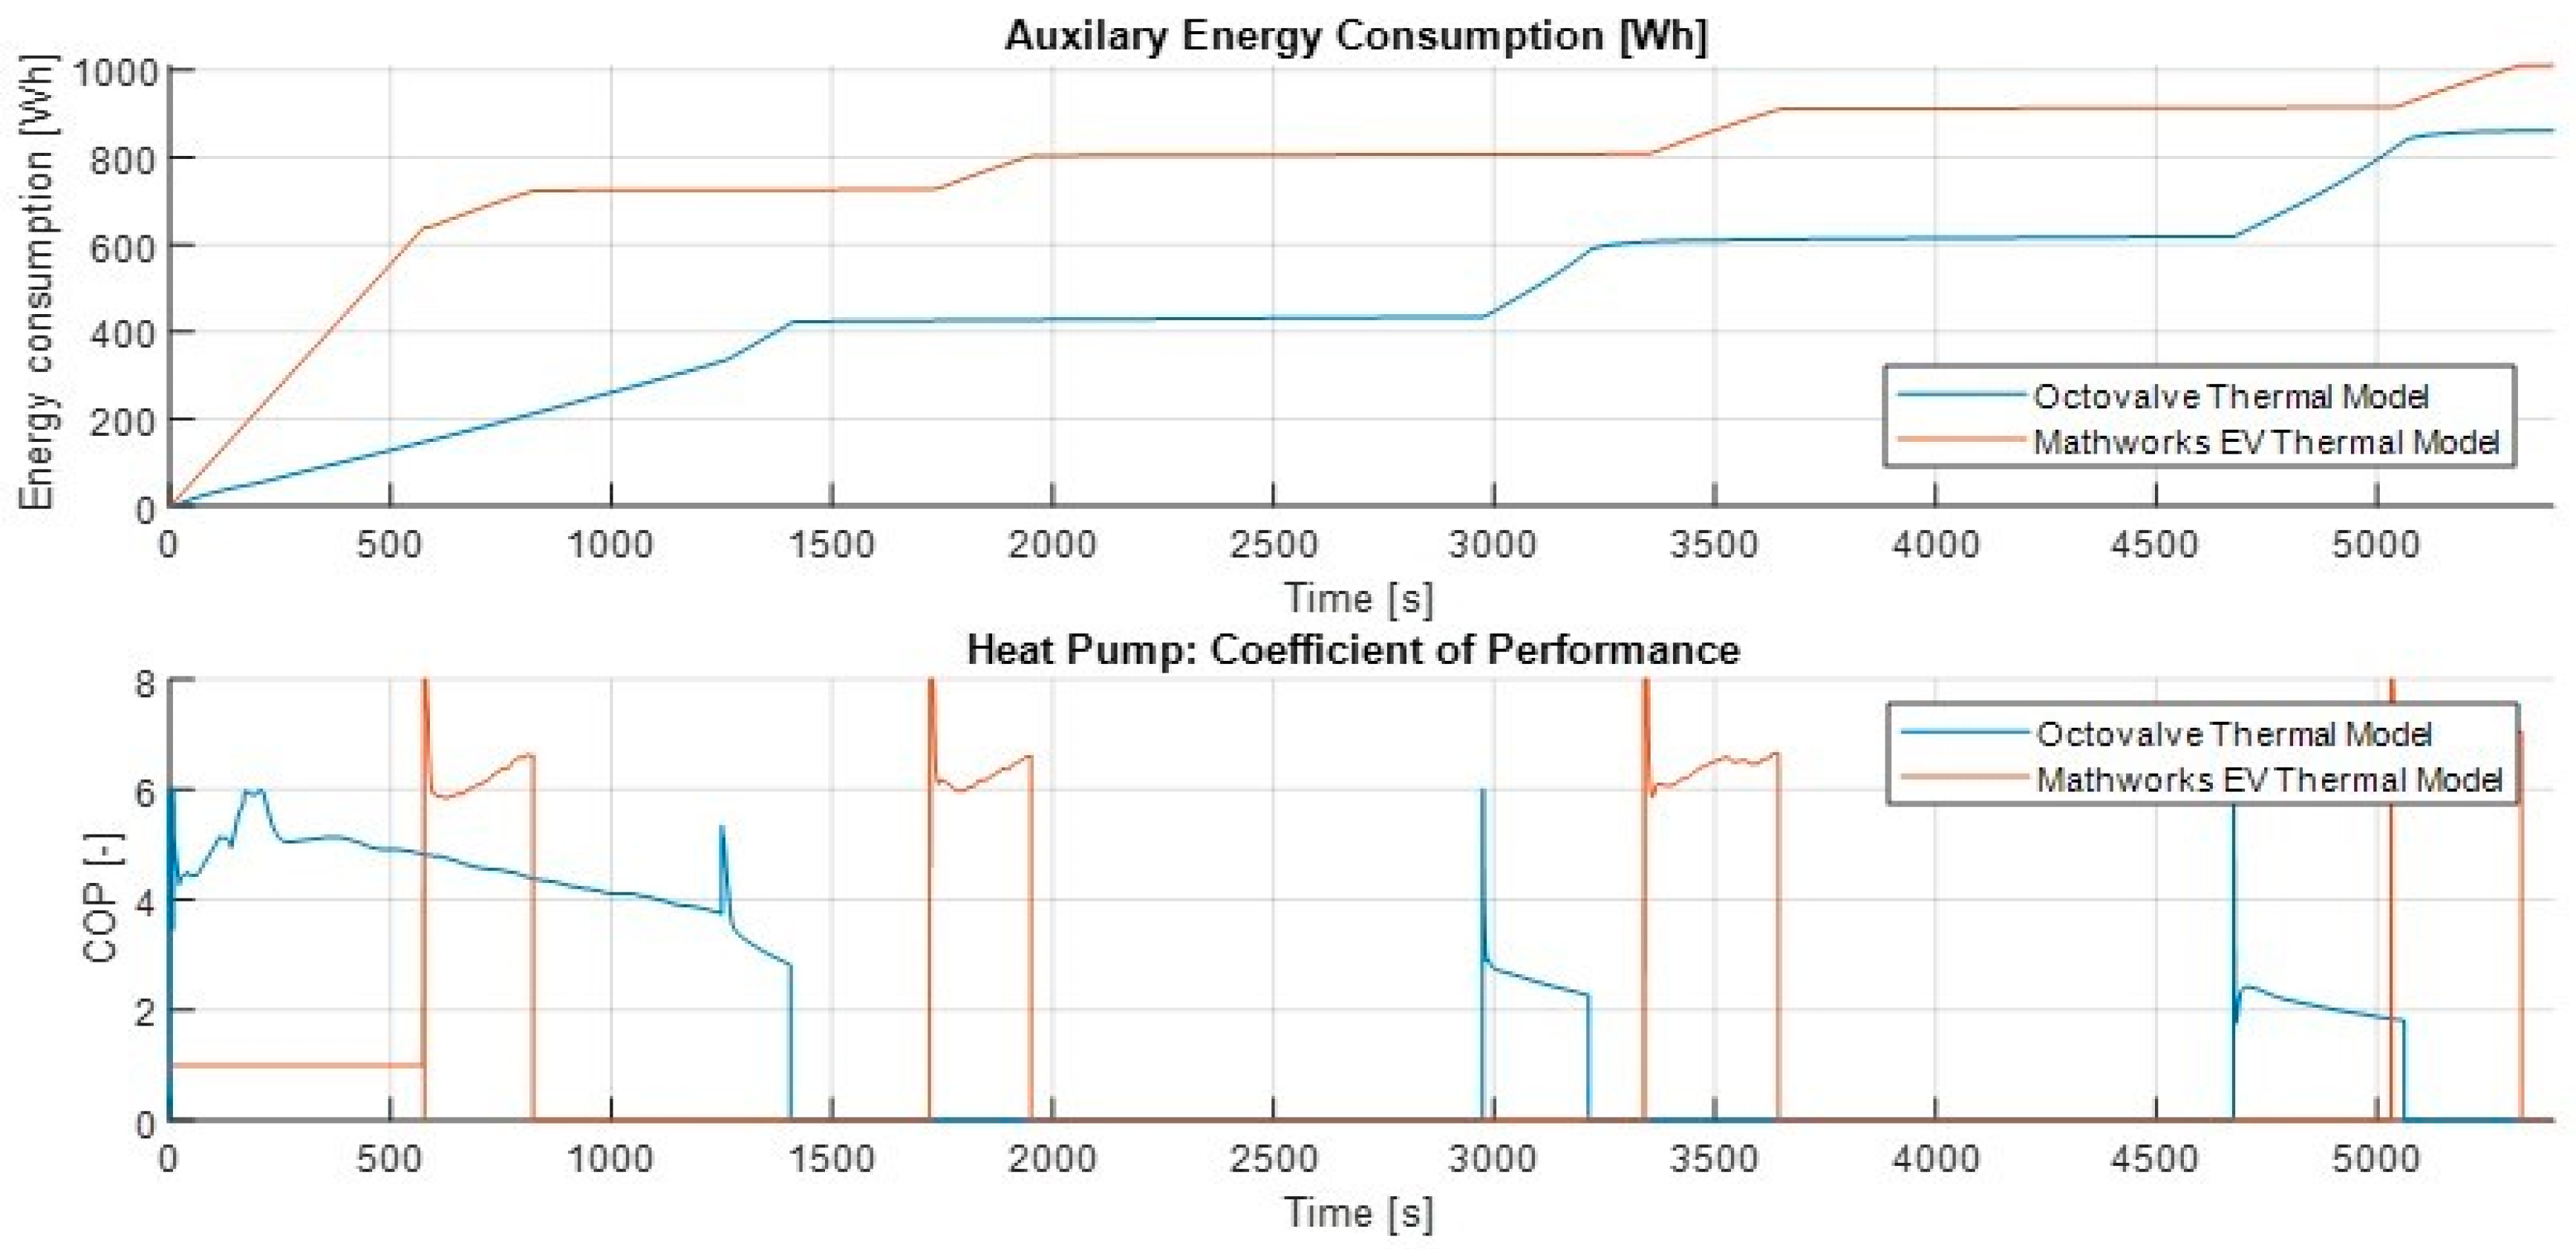
Figure 26.
Simulation results showing auxiliary energy consumption and the heat pump coefficient of performance.
Following complete powertrain warm-up, both refrigerant loops begin to actively cool the batteries back to the lower limit. This takes 170 s for the OTM and 240 s for the ETM. The OTM’s compressor spools up to maximum compressor speed (Figure 24), resulting in the compressor drawing 2.1 kW, shown in Figure 25, and operating with a COP of 2 to 4. In contrast, the ETM’s compressor operates at a much lower power level of 600–900 W during these periods, with a COP = 6. For both models, the fan runs; however, the ETM runs a constant 500 W to serve the condenser requirement as the OTM depends on motor temperature.
Figure (Figure 26) clearly shows the energy consumed during these battery cooling periods. The ETM consumes 91 Wh, 78 Wh, 103 Wh, and 97 Wh of energy for each of its battery cooling periods; 575 s to 825 s, 1725 s to 1960 s, 3345 s to 3650 s, and 5033 s to 5341 s, respectively. The OTM consumes 88 Wh, 156 Wh, and 226 Wh of energy for each of its battery cooling periods; 1255 s to 1410 s, 2970 s to 3225 s, and 4676 s to 5070 s, respectively. The periods in between the battery cooling consume a minimal amount of energy in comparison. During these periods, energy is consumed by the auxiliary pumps, and in OTM’s case, the fan, as shown in Figure 25.
As a result, over the whole drive cycle, the OTM consumes 862 Wh of energy compared to the ETM’s 1011 Wh. That is a 150 Wh reduction in energy consumption with OTM measured over 3 WLTP drive cycles.
6. Discussion
6.1. Battery Warm-Up
Cycling lithium-ion cells operating between 15 °C to 35 °C is deemed the desired temperature for minimal battery degradation [8,29]. Therefore, the slow warm-up from 21 °C to ambient is not a cause for concern. However, the higher cell temperature leads to improved discharge capacity resulting in a higher vehicle range [4]. Thus, a fast warm-up to the 30 °C to 35 °C temperature range would be beneficial. The leading cause for the OTM’s slow battery warm-up time is the low heat output during this period. Naturally, the refrigerant circuit is very efficient when using the refrigerant circuit components and parameters from the ETM. The compressor operates at a low rpm, hence, a low energy consumption compared to heat output. Typical heat pumps using R134a can achieve heat outputs of 2 kW to 6 kW at 10 °C ambient, even more with increased ambient temperature [30]. With optimisation, the system could be designed in a way to reduce heat pump efficiency to increase the heat load.
6.2. Battery Cooling
The OTM compressor operates at maximum rpm for all 3 cooling cycles and consumes 470 Wh compared to the ETM, which consumes 369 Wh in 4 cooling cycles. The ETM refrigerant circuit is rejecting heat to a constant 21 °C ambient temperature using the condenser. In contrast, the OTM heat pump can only reject heat via the LCC and, subsequently, the radiator. Because the LCC and radiator are on the same coolant circuit as the motor and inverter, the heat pump LCC is essentially rejecting to a high-temperature reservoir. As the temperature of the reservoir the LCC is rejecting to increases, so does the energy consumed by the compressor [31]. This is the reason for the 2.1 kW power drawn during all these cooling cycles, an unavoidable consequence of the OTS’s design. Another characteristic of a hot LCC reservoir is a reduction in heat pump capacity [31]. Figure 23a shows a decrease in cooling capacity with each cooling cycle. This increases the time for each cooling period which results in the incremental energy consumption observed. The reason for decreasing cooling capacity is the increasing motor/inverter temperature and the radiator’s inability to reject heat from the coolant. The radiator’s inability to reject heat from the coolant is not a result of low radiator heat transfer capacity, but instead, it is the fan’s control strategy. The fan does not get up to speed until the end of each cycle; only at this point, the radiator is able to reject all the heat the coolant absorbs at the LCC. The slow response of the fan results in the motor/inverter coolant loop warming up to above 55 °C. To improve the OTS, the control could be corrected to increase the response of the fan and reduce the motor coolant loop temperature pre-battery cooling cycle.
7. Future Work
Future work should focus on the optimisation of the OTM heat pump. This paper has maximised similarities between the OTM and ETM, so the OTM is not the best representation of the real OTS. The optimisation should include the system heat exchanger dimensions and auxiliary performance and control. It would also be useful to integrate the thermal system model with an electric vehicle model to quantify the OTM’s effect on EV performance, including range and battery degradation. The model should include controls for the extreme ambient conditions discussed in this paper and review the model’s performance for cabin and powertrain warm-up and pull-down in these extremes.
Author Contributions
Conceptualization, A.W. and K.E.; methodology, A.W.; software, A.W.; validation, A.W.; formal analysis, A.W.; investigation, A.W.; resources, A.W. and K.E.; data curation, A.W.; writing—original draft preparation, A.W.; writing—review and editing, A.W. and K.E.; visualization, A.W.; supervision, K.E.; project administration, K.E. All authors have read and agreed to the published version of the manuscript.
Funding
This research received no external funding.
Institutional Review Board Statement
Not applicable.
Informed Consent Statement
Not applicable.
Data Availability Statement
Not applicable.
Conflicts of Interest
The authors declare no conflict of interest.
Abbreviations
The following abbreviations are used in this manuscript:
| OTS | Octovalve Thermal System |
| OTM | Octovalve Thermal Model |
| ETS | EV Thermal System |
| ETM | EV Thermal Model |
| HVAC | Heating Ventilation and Air Conditioning |
| LCC | Liquid Cooled Condenser |
| COP | Coefficient of performance |
| PTC | Positive Temperature Coefficient (Heater) |
| LV | Low Voltage (Heater) |
| EXV | Electronic expansion valve |
| DC | Duty Cycle |
Nomenclature
| Q | Heat Transfer [W] |
| QCabin | Heat Output to Cabin [W] |
| Qc | Heat Transfer to Cold Reservoir [W] |
| Qh | Heat Transfer to Hot Reservoir [W] |
| QTrg | Target Heat Output [W] |
| TAmb | Ambient Temperature [°C] |
| TBattery | Battery Temperature [°C] |
| TCabin | Cabin Temperature [°C] |
| TOp | Operating Temperature [°C] |
| Tpt | Powertrain Temperature [°C] |
| TTrg | Target Temperature [°C] |
| W | Work [W] |
References
- IEA. CO2 Emissions from Fuel Combustion 2018; IEA: Paris, France, 2018. [Google Scholar] [CrossRef]
- IEA. Electric Cars Fend off Supply Challenges to More than Double Global Sales; IEA: Paris, France, 2022; Available online: https://www.iea.org/commentaries/electric-cars-fend-off-supply-challenges-to-more-than-double-global-sales (accessed on 1 November 2021).
- Farrington, R.; Rugh, J. Impact of Vehicle Air-Conditioning on Fuel Economy, Tailpipe Emissions, and Electric Vehicle Range; National Renewable Energy Lab: Golden, CO, USA, 2000. [Google Scholar]
- Wang, F.; Lin, Z.; Liu, L.; Wei, X.; Lin, S.; Dai, L.; Wei, Y.; Liang, C.; Liaw, B.Y. Does Polarization Increase Lead to Capacity Fade? J. Electrochem. Soc. 2020, 167, 090549. [Google Scholar] [CrossRef]
- Aris, A.M.; Shabani, B. An Experimental Study of a Lithium Ion Cell Operation at Low Temperature Conditions. Energy Procedia 2017, 110, 128–135. [Google Scholar] [CrossRef]
- Łebkowski, A. Temperature, Overcharge and Short-Circuit Studies of Batteries used in Electric Vehicles. Prz. Elektrotech. 2017, 93, 67–73. [Google Scholar] [CrossRef]
- Sun, P.; Bisschop, R.; Niu, H.; Huang, X. A Review of Battery Fires in Electric Vehicles; Springer: New York, NY, USA, 2020; pp. 1–50. [Google Scholar] [CrossRef]
- Petzl, M.; Kasper, M.; Danzer, M.A. Lithium plating in a commercial lithium-ion battery—A low-temperature aging study. J. Power Sources 2015, 275, 799–807. [Google Scholar] [CrossRef]
- Bodenes, L.; Naturel, R.; Martinez, H.; Dedryvère, R.; Menetrier, M.; Croguennec, L.; Pérès, J.-P.; Tessier, C.; Fischer, F. Lithium secondary batteries working at very high temperature: Capacity fade and understanding of aging mechanisms. J. Power Sources 2013, 236, 265–275. [Google Scholar] [CrossRef]
- Song, H.; Cao, Z.; Chen, X.; Lu, H.; Jia, M.; Zhang, Z.; Lai, Y.; Li, J.; Liu, Y. Capacity fade of LiFePO4/graphite cell at elevated temperature. J. Solid State Electrochem. 2013, 17, 599–605. [Google Scholar] [CrossRef]
- Abada, S.; Petit, M.; Lecocq, A.; Marlair, G.; Sauvant-Moynot, V.; Huet, F. Combined experimental and modeling approaches of the thermal runaway of fresh and aged lithium-ion batteries. J. Power Sources 2018, 399, 264–273. [Google Scholar] [CrossRef]
- Ren, D.; Hsu, H.; Li, R.; Feng, X.; Guo, D.; Han, X.; Lu, L.; He, X.; Gao, S.; Hou, J.; et al. A comparative investigation of aging effects on thermal runaway behavior of lithium-ion batteries. eTransportation 2019, 2, 100034. [Google Scholar] [CrossRef]
- Al-Din, N.A.N.; Ibrahim, H.A.; Maksoud, S.A.A.; Dessouky, S.S. Increased Temperature Effect on Induction Motor Parameters. Port-Said Eng. Res. J. 2017, 21, 109–115. [Google Scholar] [CrossRef]
- Baranski, M.; Szelag, W.; Lyskawinski, W. Analysis of the Partial Demagnetization Process of Magnets in a Line Start Permanent Magnet Synchronous Motor. Energies 2020, 13, 5562. [Google Scholar] [CrossRef]
- Sathik, M.H.M.; Sundararajan, P.; Sasongko, F.; Pou, J.; Natarajan, S. Comparative Analysis of IGBT Parameters Variation Under Different Accelerated Aging Tests. IEEE Trans. Electron Devices 2020, 67, 1098–1105. [Google Scholar] [CrossRef]
- Ni, Z.; Lyu, X.; Yadav, O.P.; Cao, D. Review of SiC MOSFET Based Three-Phase Inverter Lifetime Prediction; IEEE Applied Power Electronics Conference and Exposition (APEC): Tampa, FL, USA, 2017. [Google Scholar] [CrossRef]
- Huang, H.; Mawby, P.A. A Lifetime Estimation Technique for Voltage Source Inverters. IEEE Trans. Power Electron. 2012, 28, 4113–4119. [Google Scholar] [CrossRef]
- 2011 Nissan LEAF—Repair Manual—High Voltage Cooling System (HCO). 2015. Available online: https://ownersmanuals2.com/nissan/leaf-2011-repair-manual-high-voltage-cooling-system-hco-43099 (accessed on 1 August 2022).
- 2011 Nissan LEAF—Repair Manual—Heater & Air Condition (Section HA). 2015. Available online: https://ownersmanuals2.com/nissan/leaf-2011-repair-manual-heater-air-condition-section-ha-43101 (accessed on 1 August 2022).
- Lee, S.; Cherry, J.; Lee, B.; McDonald, J.; Safoutin, M. HIL Development and Validation of Lithium-Ion Battery Packs; SAE Technical Papers; SAE: Warrendale, PA, USA, 2014. [Google Scholar] [CrossRef]
- Shelly, T.J.; Weibel, J.A.; Ziviani, D.; Groll, E.A. A Dynamic Simulation Framework for the Analysis of Battery Electric Vehicle Thermal Management Systems. In Proceedings of the 2020 19th IEEE Intersociety Conference on Thermal and Thermomechanical Phenomena in Electronic Systems (ITherm), Orlando, FL, USA, 21–23 July 2020; pp. 538–546. [Google Scholar] [CrossRef]
- Chowdhury, S.; Leitzel, L.; Zima, M.; Santacesaria, M.; Titov, G.; Lustbader, J.; Rugh, J.; Winkler, J.; Khawaja, A.; Govindarajalu, M. Total Thermal Management of Battery Electric Vehicles (BEVs); No. NREL/CP-5400-71288; National Renewable Energy Lab.(NREL): Golden, CO, USA, 2018. [Google Scholar]
- Shelly, T.; Weibel, J.; Ziviani, D.; Groll, E. Evaluation of Heat Pumping and Waste Heat Recovery for Battery Electric Vehicle Thermal Management. In Proceedings of the International Refrigeration and Air Conditioning Conference, Purdue University, West Lafayette, IN, USA, 24–28 May 2021. [Google Scholar]
- Mancini, N.; Stratford, J.; Mardall, M.; Kopitz, J.; O’Donnell, C.R.; Hanks, D.F.; Li, H. Optimal Source Electric Vehicle Heat Pump with Extreme Temperature Heating Capability and Efficient Thermal Preconditioning. Available online: https://patents.google.com/patent/US20190070924A1/en (accessed on 1 November 2021).
- Sandy, M. Munro Live. 2021. Available online: https://leandesign.com/ (accessed on 1 November 2021).
- Strušnik, D. Integration of machine learning to increase steam turbine condenser vacuum and efficiency through gasket resealing and higher heat extraction into the atmosphere. Int. J. Energy Res. 2022, 46, 3189–3212. [Google Scholar] [CrossRef]
- Strušnik, D.; Avsec, J. Exergoeconomic machine-learning method of integrating a thermochemical Cu–Cl cycle in a multigeneration combined cycle gas turbine for hydrogen production. Int. J. Hydrogen Energy 2022, 47, 17121–17149. [Google Scholar] [CrossRef]
- Electric Vehicle Thermal Management. Available online: https://uk.mathworks.com/help/physmod/hydro/ug/sscfluids_ev_thermal_management.html (accessed on 1 August 2022).
- Bajaj, H.; Chandrakant, R.K. Thermal management systems for EV’s and HEV’s. ARPN J. Eng. Appl. Sci. 2019, 14, 265–269. [Google Scholar]
- Lee, D. Experimental study on the heat pump system using R134a refrigerant for zero-emission vehicles. Int. J. Automot. Technol. 2015, 16, 923–928. [Google Scholar] [CrossRef]
- Yin, P.; Pate, M.B.; Sweeney, J.F.; Kading, J. The effect of high ambient temperature on the performance of an R410a air conditioner. In Proceedings of the 1st International Conference on Energy and Indoor Environment for Hot Climates, Doha, Qatar, 24–26 February 2014; pp. 350–357. [Google Scholar]

Publisher’s Note: MDPI stays neutral with regard to jurisdictional claims in published maps and institutional affiliations. |
© 2022 by the authors. Licensee MDPI, Basel, Switzerland. This article is an open access article distributed under the terms and conditions of the Creative Commons Attribution (CC BY) license (https://creativecommons.org/licenses/by/4.0/).