1. Introduction
The role of flexible power units such as hydraulic turbines is becoming increasingly relevant for integrated electrical grids in which the introduction of intermittent renewable energy sources, such as solar and wind power, is constantly growing. In this scenario, the capabilities and flexibility of hydropower plants make the hydraulic energy source extremely attractive [
1]. However, under these circumstances, hydraulic turbines are required to work under non-ideal conditions where they are subjected to more deleterious phenomena and transient events [
2,
3,
4,
5,
6]. These off-design working conditions decrease both the turbine efficiency and the life expectancy [
7]. For this reason, it is of paramount importance to understand the hydraulic phenomena occurring at off-design operations, as they can lead hydraulic turbines to severe failures such as fatigue cracks [
8,
9,
10,
11,
12] and rotor vibrations.
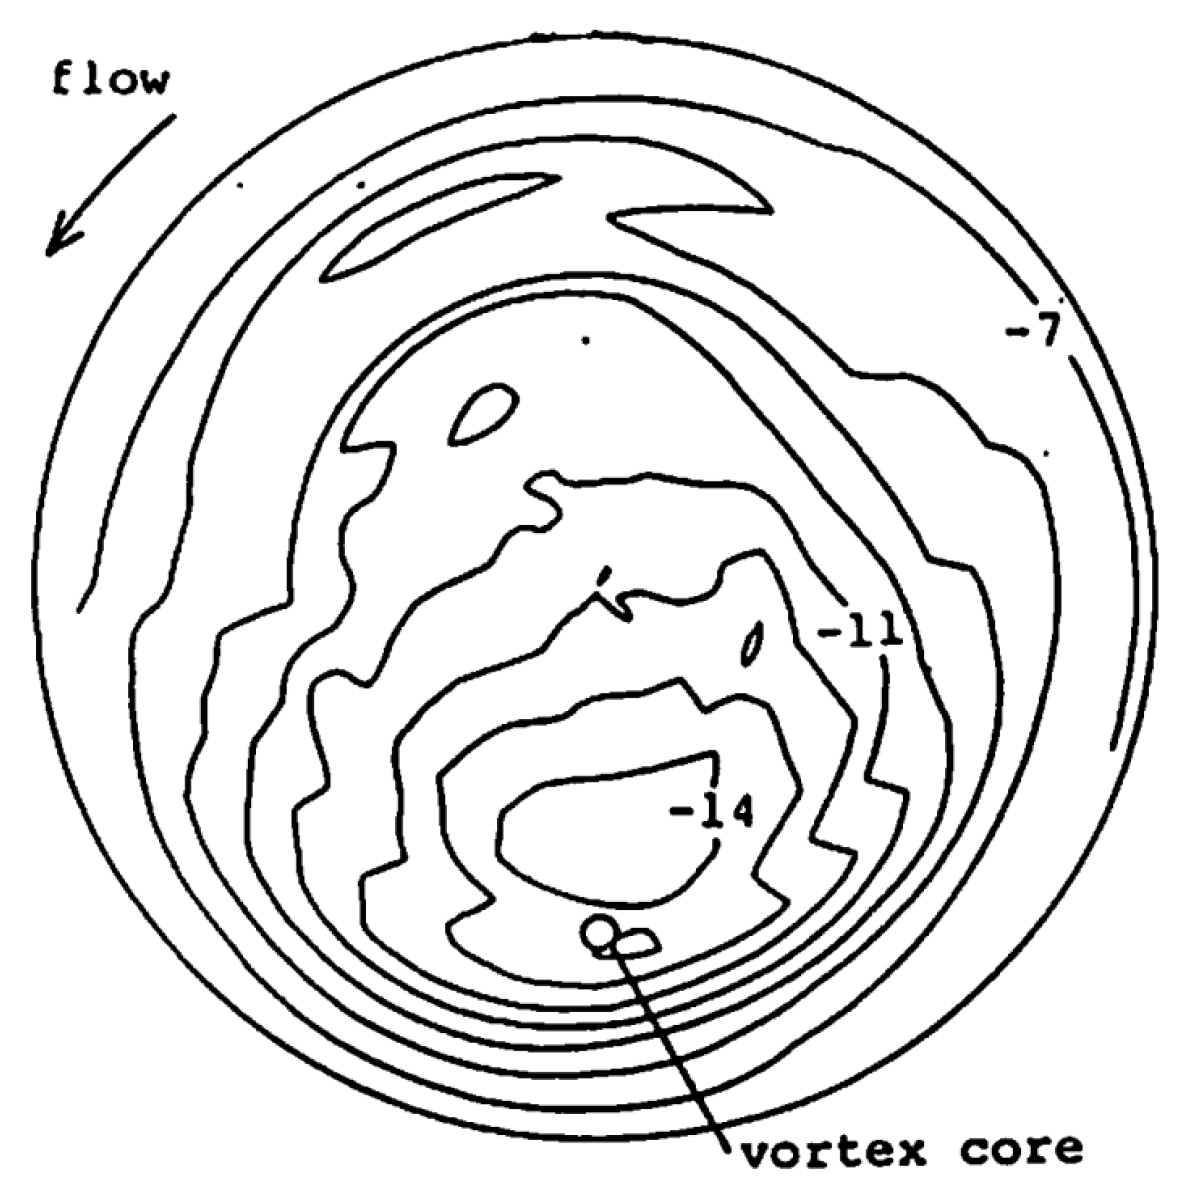
A particular phenomenon that occurs in the draft tube flow of hydraulic turbines operating at part load (PL) is a precession helical vortex rope. This rotating vortex rope (RVR) whirls around a low-flow region developed at the center of the draft tube and occurs primarily due to a high swirl flow leaving the runner and the formation of a stagnation region along the axis of the draft tube [
13,
14]. The RVR rotates in the same direction as the runner at a precession frequency usually referred to as the Rheingans frequency, which is found between 20 and 40% of the turbine rotating frequency [
15]. The RVR, which initiates at the runner outlet and expands further downstream in the draft tube, alters the pressure distribution as it can be seen in
Figure 1. This pressure pattern, with a region of low pressure at the RVR core, rotates around the axis of the draft tube due to the RVR precession. The pressure detected at the cone wall oscillates periodically at the precession frequency. This type of pressure fluctuation, characteristic of each cross section, is referred to as the rotating mode (RM). In the case of an elbow-type draft tube, the flow usually separates from the small-radius side of the elbow wall leading to a stalled region [
16]. However, when the high flow velocity near the RVR core moves towards this stalled region, the flow is energized and the separation of the boundary layer is prevented. In contrast, when the RVR core is close to the large-radius side of the elbow, the boundary layer separation is not prevented. This periodic alteration of the stalled region results in a fluctuation of the pressure recovery and of the draft tube inlet pressure which triggers a pressure wave travelling along the draft tube at the precession frequency, referred to as the plunging mode (PM) [
17]. Similarly, Fanelli [
18] proposed a mathematical model to describe the RVR motion at PL based on the superposition of the two flow motions corresponding to the PM and RM. The formation of the PM was attributed to the presence of the elbow in the draft tube cone and the formation of the RM to the development of a rotating pressure field. More recently, Pasche et al. [
19] have also described the physical mechanism leading to the RVR and interpreted it as a globally unstable eigenmode through the analysis of numerical results. The RVR was concluded to emerge from the growth of a single-helix disturbance developed around the time-averaged flow field.
The RVR characteristics and its formation and mitigation mechanisms have been experimentally investigated by some authors. For instance, Amiri et al. [
20] performed pressure measurements on blades and stationary parts of a Kaplan turbine model during load variations that captured the RM and the PM. The RVR was observed to begin to form at the end of the draft tube cone and to trigger a wide band pressure fluctuation on the suction side of the runner blades. Subsequently, the RVR travelled upstream when the guide vanes were closed further. Whilst the RVR formation was abruptly, its mitigation took place more smoothly. The PM was found to result in a flow oscillation throughout the entire turbine unit, while the RM to cause local pressure fluctuations. Trivedi et al. [
21] also performed pressure measurements, but in this case in the draft tubes of one vertical and one horizontal axis Francis turbine prototype. For the vertical axis turbine, the pressure pulsations derived from the RM were 20 times higher than those derived from the PM, but they were 2 times smaller for the horizontal turbine. During the same measurement campaign, it was observed that the amplitude of the RVR pressure fluctuations during a ramp up from 50 to 70% load was 1.6 times higher than during a steady state operation at 50% load [
22]. Goyal et al. [
23,
24] investigated the RVR by means of PIV and pressure measurements in the draft tube cone of a high head Francis turbine model. The precession frequency and its harmonics were successfully captured by both pressure and velocity measurements. The results demonstrated that the disappearance of the shear layer and stagnation regions mitigates the RVR. The PM was also observed to appear before the RM during load rejection. Kumar et al. [
25] also investigated the RVR through PIV and pressure measurements in the draft tube cone of a Francis turbine. High velocity fluctuations were found at the RVR precession frequency with highest values in the regions with large velocity gradients. A pressure wave travelling circumferentially was also measured. Favrel et al. [
26] used two-component PIV to investigate the flow field at the runner outlet of a reduced scale Francis turbine model. The evolution of the RVR with the discharge was determined based on its trajectory and the circulation. The increase of the excitation intensity was induced by an enlargement of the vortex trajectory and a simultaneous increase in the precession frequency in addition to the vortex circulation. Below a certain value of discharge, the topology of the RVR changed and led to a drastic reduction in the intensity of the induced excitation source. Ciocan et al. [
27] investigated the dynamics of the RVR in the discharge ring of a Francis turbine, working at PL, experimentally and numerically. 2D laser Doppler velocimetry, 3D PIV, and pressure measurements were performed, and a good agreement was found between the numerical results and the experimental data.
The impact of the RVR on structural parts of hydraulic turbines has also been investigated experimentally on both prototype and model turbines. Duparchy et al. [
28] studied the impact of both the PM and the RM on a Francis runner operating at PL through pressure and strain runner measurements, from a structural perspective. The investigation revealed that the RM is the predominant source of mechanical excitation when compared to the PM. Moreover, they also concluded that a hydro-acoustic resonance primarily affected the PM resulting in a significant increase in pressure fluctuations, not observed on the strains. Houde et al. [
29] performed pressure and strain measurements on two runner blades of a low head propeller turbine operating at PL. Unlike the previous study, in this investigation, no clear dominance of the RM over the PM was found. Shi [
30] investigated the characteristic frequencies in pressure fluctuations, shaft torsional oscillations, and structural vibrations in a 700 MW Francis turbine prototype. They concluded that the RVR frequency dominates the pressure fluctuations, vibrations on the head cover, and the torsional oscillations of the shaft at PL. Dehkharqani et al. [
31] performed synchronized unsteady pressure and strain measurements on a runner blade of a Kaplan turbine during steady-state and load variations under off-cam conditions. The PM and RM were observed at a low discharge operating point and during transient cycles in both pressure and strain measurements. The PM was found to appear before the RM during load reduction and last longer during the load increase. During load increase, they observed an increase in the RM frequency and a decrease in the PM frequency when measured from a sensor on-board. The measurements also showed that strain fluctuations were primarily induced by the RM and those resulting from the PM were negligible.
As previously mentioned, most studies were focused on the characterization of the RVR by means of pressure measurements from stationary parts or strain measurements on the runner blades. However, there is a need to further investigate the induced structural response of the RVR not only on runner blades but also on the rotor shaft, bearings and structural supports. The importance of this study is due to the fact that hydraulic turbines are increasingly operated at PL. These investigations would have the aim of deepening insight into the RVR, and thus improving the existing monitoring systems and be the foundation of future structural health monitoring systems protecting the turbines against wear and tear.
Therefore, the present study investigates the particular behavior of both PM and RM in terms of associated frequencies and evolution of their induced amplitudes on different parts of a turbine model. All tests were carried out in a homologous turbine model, with a reduced scale of 1:3.875, of the 10 MW Porjus U9 Kaplan turbine prototype. Pressures, forces, torques, accelerations, displacements, and strains were measured on-board and off-board. More specifically, the tests were carried out at different operating conditions on the same propeller curve with a fixed blade angle and changing the guide vane angles. The present study reveals the frequency evolution of the RVR excitation, the amplitude evolution of each mode of the RVR individually and the relative dominance of one mode over the other at multiple PL operating conditions. Moreover, the particular frequencies at which each mode is detected on different frames of reference and parts of the turbine are presented. Finally, recommendations about the detection and quantification of the RVR at turbine prototypes are given and will be used as a base for the development of a structural health monitoring system from off-board measurements in full-scale prototypes.
This study is part of the work carried out in the frame of the research and innovation project Active Flow Control System for Improving Hydraulic Turbine Performances at Off-design Operation (AFC4Hydro) funded under the European H2020 program (
https://afc4hydro.eu/ on 1 June 2022). The Active Flow Control system is being developed for full-scale prototypes when they operate at off-design conditions and during load variations in order to reduce wear and tear and increase reliability and flexibility.
2. Experimental Setup
2.1. Test Stand Description
The experimental campaign was carried out in a test stand with a Kaplan turbine model at the Vattenfall Research and Development Center in Älvkarleby, Sweden. The model turbine is homologous with the 10 MW turbine U9 prototype located at the Luleå river in Porjus, Sweden. This full-scale Kaplan turbine is owned by Vattenfall AB, GE Power, and Andritz Hydro AB and is exclusively used for education, research, and development [
32].
The model turbine runner has a reference diameter (
D) of 400 mm and 6 blades. The distributor is composed of 18 unequally distributed stay vanes and 20 equally distributed guide vanes. The rotating shaft is supported by a hydrostatic turbine bearing located on the top of the headcover above the runner, and two generator ball bearings, where one is located at the top and the other at the bottom of the generator. A schematic of the test stand is shown in
Figure 2. The test stand fulfills the requirements of IEC60193 test code (hydraulic turbines, storage pumps and pump-turbines—model acceptance tests).
2.2. Instrumentation
Off-board sensors to measure absolute and relative vibrations, pressures, forces, and torques were mounted in the following positions:
Accelerometer A0x on the draft tube cone in radial direction.
Accelerometers A2x and A2z on the spiral casing in radial and axial directions, respectively.
Accelerometer A5x on the bottom generator ball bearing in radial direction.
Accelerometer A6x on the upper generator ball bearing in radial direction.
Pressure transducers P0x0°, P0x180°, P1x0°, and P1x180° on the draft tube cone at 180° apart, measuring in radial direction at two different levels.
Displacement laser sensors D3x and D4x along the shaft line at two different levels in radial direction.
Force sensor FSR on the turbine bearing in radial direction.
Force sensor FSA on the turbine bearing in axial direction.
Torque sensor TGV on the guide vane stem.
On-board sensors to measure strains and torques were mounted in the following positions:
Strain gauge SBR on the suction side of a runner blade.
Strain gauge SSBM on the shaft measuring the strains derived from bending moments.
Strain gauge SST on the shaft measuring the strains derived from shaft torques.
Strain gauge SSA on the shaft measuring the strains derived from axial forces.
Torque sensor TRB on the runner blade trunnion.
Figure 3 shows the location of the sensors which were conditioned and recorded simultaneously with a multichannel acquisition system at a sampling rate of 5000 Hz. The signals from on-board sensors installed on the runner blades and shaft were extracted with a telemetry system.
2.3. Operating Conditions
The operating conditions were selected to capture the growth and disappearance of the RVR along a propeller curve. Consequently, the runner blades were fixed at a runner blade angle (
β) of 0.8°, where
β = −17° represents the closed runner. The turbine discharge (
) was changed with the guide vane angle (α) varying from 12° to 26° at a fixed speed factor
where
is the rotational speed and
is the head. The discharge factors (
) corresponding to each operating point measured are listed in
Table 1, which were calculated using Equation (1).
In particular, the turbine was operated in steady-state conditions at the best efficiency point (BEP) with an α of 26° and at lower discharges with α of 12°, 14°, 15°, 16°, 17°, 18°, 20°, 22°, and 24°. Continuous measurements of around 5 min were taken after reaching stable and steady flow conditions for each guide vane angle.
2.4. Methodology
In order to determine how the excitations associated to the PM and RM are transmitted from the draft tube flow to the different parts of the test stand, the frequency and amplitude of the pressure fluctuations for each RVR mode were taken as a reference. Then, these excitation levels were compared with the corresponding responses induced at different parts of the machine and measured with different types of sensors.
As introduced previously, the RM, also called asynchronous mode, is characteristic of the precession induced at each draft tube cross section. The RM measured along a cross section perimeter presents different phases depending on the angular position. The phase difference between two locations corresponds to their angle. The PM, also called synchronous mode, results in a travelling pressure wave along the draft tube which is independent of the draft tube cross section. The PM presents the same phase in each location of a cross section perimeter. Based on the methodology proposed by Nishi [
17] and verified by Duparchy et al. [
33], the fluctuating component of wall pressure measurements at a given location,
, and at 180° apart in the same cross section,
, can be approximated as:
where
is the RVR precession period. Subsequently, the abstraction of Equation (3) from Equation (2) cancels the PM pressure fluctuation and the sum of Equations (2) and (3) cancels the RM pressure fluctuation:
The pressure transducers on the draft tube cone closer to the runner measured stronger RVR fluctuations than those mounted further downstream. For this reason, the pressure signals from sensors P1x0° and P1x180° at the same section and 180° apart have been taken as the reference ones to evaluate the evolution in amplitude and frequency of the RVR modes as a function of the operating point.
To calculate the RMS amplitude levels of the dominant frequencies, the averaged Fast Fourier Transform (FFT) with a Hanning window was computed. The time signals were divided into five segments of 60 s each to calculate the average and the standard deviation. The FFT was directly applied to all signals except for the accelerations measured with the accelerometers which were previously integrated to obtain the vibration velocity. All the spectra presented in the present article were plotted as a function of the reduced frequency, f* = f/fn, where fn is the turbine rotating frequency.
3. Results
3.1. RVR Dynamic Behavior
The RVR frequency peak appears suddenly and disappears smoothly in the α range from 14° to 24° as shown on the spectra of the pressure signals measured below the runner in position P1x
0°, see
Figure 4. A possible reason for this particular behavior could be that for guide vane angles smaller than 14°, the flow already presents a high swirl but it is not until 15° that the stagnation region along the draft tube axis reaches the necessary dimensions to suddenly trigger the RVR. Subsequently, both the swirl and the stagnation region decrease smoothly when increasing the discharge and thus inducing a smooth disappearance of the RVR. Other authors also observed previously this particular RVR behavior in both a Kaplan and Francis turbine models [
20,
26]. The highest RVR pressure fluctuations are found for 15° with a frequency around 0.2
fn and an average amplitude of around 0.03 bar.
As
Figure 4 shows, when α is 14°, a low amplitude peak with a wide base is observed, meanwhile for the rest of discharges, the peak is thinner and well defined. The wider shape of the peak at α = 14° might be related to the stochastic flow conditions. Other researches have also observed frequency peaks associated with the RVR with low amplitudes and wide bases at the beginning of the RVR formation in both a Kaplan turbine model and a Kaplan turbine prototype [
20,
31].
As shown in Figure 7a, the reduced frequency of the RVR,
f*rvr, decreases mainly linearly from 0.21 to 0.18 as the discharge increases, corresponding to opening angles from 15° to 20°. However,
f*rvr remains almost constant with a value of 0.21 at the RVR appearance, corresponding to 14° and 15°, and suffers an abrupt reduction from 0.18 to 0.15 before the RVR disappears completely, corresponding to opening angles from 20° to 22°. Other studies also measured a reduction of
f*rvr as the output load increases in a Kaplan turbine prototype but, in their case, from 0.17 to 0.13 [
31]. These differences could be due to several reasons such as the fact that they measured a transient rather than a steady state operating condition and at different runner blade angles or that their turbine was a full-scale unit instead of a model.
Figure 5 and
Figure 6 show the spectra of the RM and PM pressure signals calculated using the previous Equations (4) and (5), respectively. It can be seen that the appearance and mitigation of the amplitudes corresponding to each mode differ from the previous observations with the no-decomposed pressure signals presented in
Figure 4. Concretely, the peaks of both modes appear suddenly at the same α of 14°, and when the discharge increases, the PM abruptly disappears at 24° while the RM gradually disappears at 24°. A reason for the sudden development of the RM and PM could be the instantaneous apparition of the RVR along the entire draft tube from the runner outlet until the elbow. For further guide vanes openings, the RVR would start disappearing firstly at the runner outlet smoothly and continue towards the draft tube elbow leading to a smooth disappearance of the RM. The RVR would evolve differently in the elbow, where it would keep the intensity of the PM and it would disappear abruptly at higher angles, as it has been observed in previous investigations [
20].
The RM and PM amplitudes also evolve differently when changing the discharge. The RM presents its highest amplitude for a α of 15°, while the PM presents its maximum at both 16° and 22°. Consequently, the dominance of a given mode over the other depends on the operating point. Computing the ratio of amplitudes between the RM and the PM peaks, shown in
Figure 7b, it can be seen that the ratio decreases as the discharge increases. The figure shows that the RM is stronger than the PM in all the operating conditions, being almost 6 times higher than the PM at α of 14° and 15°. However, the exception remains at a α of 22°, where the PM dominates over the RM, the ratio being below 1. The dominance of the RM over the PM at the runner outlet could be attributed to a small stalled region associated to the current elbow design and/or to a low intensity of the RVR in the elbow. In a different investigation in a prototype Francis turbine, an even stronger dominance of the RM over the PM was observed where the RM was up to 20 times higher than the PM [
21].
3.2. RVR Detection
The RVR induces fluctuations at frvr in the draft tube cone which account for both the PM and the RM. However, when the RVR excitation is applied to the rotating rotor, each mode induces an on-board fluctuation at a different frequency due to the different nature of each mode. The PM consists in a travelling pressure wave along the draft tube and the RM in a rotating pressure wave. Hence, on the rotating rotor, the PM induces fluctuations at frvr and the RM at the relative frequency frr = fn − frvr, i.e., the relative frequency of the RM rotating at frvr and observed from a reference frame rotating at fn in the same direction. Similarly, when the PM and RM responses are transmitted from the rotating rotor to surrounding stationary parts, e.g., the bearings, each mode continues being detected at its particular relative frequency. In this case, the fluctuations at frvr correspond to the PM and the fluctuations at fsr = fn + (fn − frvr) correspond to the RM, i.e., the absolute frequency of the RM rotating at fn-frvr relative to a reference frame rotating at fn in the same direction. According to these statements, it is then expected that: (i) the off-board sensors on stationary parts that measure the responses induced directly by the RVR in the draft tube cone flow will detect the RVR at frvr, (ii) the on-board sensors on the rotor will detect the PM at frvr and the RM at frr, (iii) the off-board sensors that only measure the responses coming from the rotor will detect the PM at frvr and the RM at fsr, and (iv) the off-board sensors that measure both the responses coming directly from the RVR excitation in the draft tube cone flow and the responses occurring in the rotor will detect the RVR at frvr, the PM at frvr and the RM at fsr.
Figure 8 presents the spectra of the pressure signals measured on the draft tube cone below the runner (P1x
0°), of the shaft bending strains (SS
BM), and of the vibration velocities measured on the draft tube cone (A0x) at α of 15°, 18°, and 20°. These sensors have been selected as representative of sensors on stationary parts measuring the excitation directly, on the rotating rotor and on stationary parts measuring both the excitation directly, and transmitted from the rotor, respectively.
All pressure spectra show the RVR at f*rvr accounting for the contribution of both the PM and RM as the main source of excitation, and the corresponding second and third harmonics, but with very low amplitudes.
All strain spectra show a PM and a RM corresponding to the RVR and its harmonics, previously distinguished in the pressure spectra. More specifically, the PM is detected at f*rvr and the RM is detected at the corresponding relative frequency seen from the rotating frame. Moreover, a harmonic of the RM with two side bands induced by a modulation at f*rvr can also be seen which have been highlighted with an orange square.
Finally, all vibration spectra show a series of peaks corresponding to the RM, its harmonic, and the modulations, previously distinguished in the strain spectra, at frequencies displaced +fn Hz due to being transmitted from the rotor. Additionally, the spectra also show peaks corresponding to the RVR at f*rvr and its harmonics accounting for the contribution of both the RM and the PM, previously distinguished in the pressure spectra, because they are transmitted directly from the excitation in the draft tube cone to the sensor support.
It must be noted that for all the vibrations, turbine bearing radial forces, and shaft relative displacements, a peak at
fn appears which presents a higher amplitude than the rest of peaks associated to the RVR. For example, see in
Figure 8 the spectrum of the draft tube cone vibration. This finding differs from the vibration measurements carried out in the head cover of a prototype turbine where a dominance of the RVR excitation relative to the rotating frequency excitation was observed [
30]. This difference may reside in the fact that the present results correspond to a Kaplan turbine model instead of a Francis prototype. Nevertheless, in the present results the peaks associated with the RVR governs the whole spectra of the draft tube pressures, the on-board strains, the guide vane torque, the runner blade torque, and the turbine bearing axial force.
3.3. RVR Induced Levels
In this section, the response levels induced by the RVR at different parts of the turbine are presented and quantified based on a series of representative signals. Additionally, the influence of the transmission paths followed by the excitation and determining the frequency and amplitude of the induced response is discussed.
3.3.1. RVR Excitation Amplitudes Measured at Different Parts of the Turbine
The amplitudes of the PM and RM frequency peaks at
frvr found from decomposed pressure signals measured below the runner (P1
PM and P1
RM) are shown in
Figure 9a,b and the amplitudes measured downstream on the draft tube cone before the elbow (P0
PM and P0
RM) are shown in
Figure 9c,d.
Just downstream the runner, the RM presents higher amplitudes than the PM. Moreover, the evolution of the amplitude as a function of the operating point is also different for each mode. For instance, the PM increases until a guide vane angle of 16° and decreases until 20° before increasing again at 22° prior to its total disappearance. Nonetheless, the RM reaches a maximum amplitude at 15° followed by a progressive decrease until its disappearance at 24°. These results indicate that the amplitude of the RM is strongly related to the discharge whereas the amplitude of the PM does not show such dependence.
Further downstream the draft tube cone, the PM amplitudes present the same trend and similar values than those measured below the runner which confirms that this particular RVR mode is a travelling pressure wave along the draft tube. However, the trends and magnitudes of the RM show significant differences depending on the measurement section along the draft tube cone with higher amplitudes below the runner than further downstream. These results also confirm that the RM is more intense just below the runner as found by other researchers [
16,
20] and that the RVR changes its morphology and amplitude as develops in the draft tube cone towards the elbow. The similitude between the RM amplitude evolution close to the elbow,
Figure 9d, and the PM amplitude evolution,
Figure 9a,c, suggest that the PM is induced by the RVR precession in the elbow as observed in previous investigations [
17,
18].
Figure 10a presents the amplitudes of the RVR detected at
frvr on the guide vane torque (TGV) that account for the contribution of both PM and RM. The fact that the evolution is very similar to the one observed on the draft tube P1
RM pressure confirms that the contribution of the RM is dominant over the one from the PM for all guide vane angles, with the exception of 22° when this condition is reversed and the PM dominates over the RM, see
Figure 7b.
Figure 10b,c present the amplitudes of the PM detected at
frvr on the turbine bearing axial force (FS
A) and on the runner blade torque (TRB).
Figure 10d,e present the amplitudes of the RM at
fsr on the turbine bearing radial force (FS
R) and at
frr on the runner blade torque (TRB). All these amplitudes show the same trend as that of the draft tube P1
PM and P1
RM pressures, respectively.
3.3.2. RVR-Induced Structural Responses Measured at Different Parts of the Turbine
Figure 11 shows the amplitudes of the structural responses induced by the RVR at
frvr on the vibrations measured on the draft tube cone (A0x), spiral casing (A2z) and upper generator ball bearing (A6x). The trends, reassembling that of P1
RM pressures, indicate that although this induced structural response accounts for the contribution of both PM and RM, the RM dominates. Even the responses measured in axial direction (A2z) are dominated by the RM. It must be noted that some sensors present an unexpected response increase at 20°.
Figure 12 shows the amplitudes of the structural responses induced by the PM at
frvr on the runner blade strains (SB
R), shaft torque strains (SS
T) and shaft axial strains (SS
A). All the amplitudes show the same trend as that of the P1
PM pressure.
Figure 13 presents the amplitudes of the structural response induced by the RM at
frr on runner blade strains (SB
R), shaft torque strains (SS
T), and shaft bending strains (SS
BM), and at
fsr on the relative displacements above the turbine bearing (D3x) and on the draft tube cone (A0x) and the upper ball generator bearing vibrations (A6x). The amplitudes of the strains and the relative displacements show the same trend as that of the P1
RM pressure. However, the amplitudes of the vibrations show a constant growth until 20° and they do not follow the trend of the P1
RM pressure. This particular behavior cannot be explained based only on the expected RVR excitation and assuming a linear transmissibility to the accelerometers. It should be investigated whether a structural resonance is occurring, or other excitations related to mechanical or hydraulic unbalance at
fn are causing such behavior.
3.4. Summary of the Results
Based on the previous observations, it can be concluded that:
The runner blade and guide vane torques primarily show the RM at frr and frvr, respectively, with higher amplitudes on the blades.
The turbine bearing axial forces show the PM at frvr and the turbine bearing radial forces the RM at fsr with higher amplitudes on the axial forces induced by the PM.
The runner blade, shaft bending, and shaft torque strains show both the RM at
frr and the PM at
frvr. The RM presents higher amplitudes than the PM on the runner blade and shaft bending strains with an exception at
α = 22° when this condition is reversed on the blade strains. This finding agrees with [
28,
31], who concluded that the RM was the predominant source of mechanical excitation on a blade of a Francis runner and Kaplan runner prototypes, respectively, and disagrees with [
29], who did not find a clear dominance of any mode on the blade strains of a propeller turbine. The PM presents higher amplitudes than the RM on the shaft torque strains. On the other hand, the shaft axial strains only show the PM due to its measuring direction. Among all strain measurements, the highest amplitudes of both RM and PM are found on the shaft bending strains.
The shaft relative displacements show the RM at fsr with similar amplitudes at different positions along the shaft.
The vibration velocities show mainly the RM at both fsr and frvr with only the amplitudes at frvr correlating with those of the P1RM. The RM at fsr presents higher amplitudes than the RM at frvr. The RM at frvr presents similar amplitudes at different turbine locations. However, the RM at fsr shows the highest amplitude at the bearings and the lowest at the spiral casing in axial direction. Even though the PM acts axially, the axial vibration measured at frvr on A2z is mainly induced by the RM. This finding seems to confirm that the RM excitation is stronger than the PM and provokes a significant response in most of the accelerometers independently of their position and orientation.
To summarize these conclusions,
Table 2 indicates for each type of sensor, location, and orientation its capability to detect the frequency peaks associated to: (i) the RVR accounting for both PM and RM, (ii) the PM, and (iii) the RM.
3.5. Expected Dynamic Response Induced by the RVR in a Full-Scale Prototype Turbine
The accelerometers mounted on the draft tube cone and spiral casing of the turbine model have proven to be very sensitive to the RVR and this is also expected to be the case in prototypes. However, in some cases, this type of measurements might not be possible or seriously limited in the case of having these components fully or partially embedded in concrete. Moreover, the stiffness of the draft tube cone and spiral casing is expected to be higher in full scale prototypes due to thicker walls and stronger fixing conditions which might reduce the sensitivity.
Similarly, a good sensitivity to the RVR from the accelerometers on the bearings is also expected in prototypes but with lower transmissibility than in the model because the supporting structure is more rigid and better isolated from the turbine.
In relation to the RM, it must be checked if the frequency peak at fsr can also be detected in radial directions on the bearings. In relation to the PM mode, it should be verified if an accelerometer on the turbine head cover in axial direction is able to monitor effectively its excitation at frvr.
The shaft relative displacements in radial direction are also expected to be an effective way of monitoring the RM at fsr. Nevertheless, it has not been possible to evaluate in the model if axial displacements of the shaft would also detect the PM at frvr.
The best sensors for monitoring separately the RM and the PM are obviously those mounted on-board on the shaft. The advantage of this type of mounting in prototypes is that it avoids the need to instrument the runner blades which is very complicated and costly in operating full-scale units.
The use of force sensors on the turbine bearing to measure axial forces for detecting the PM at frvr and radial forces for detecting the RM at fsr could also be considered. Unfortunately, this type of measurement is difficult and costly to install in operating full-scale prototypes and its useful live time might be usually short, which makes it not suitable in most cases. Thus, alternative sensors such as accelerometers and displacement sensors mounted off-board must be prioritized.
4. Conclusions
Draft tube pressure fluctuations at PL show that the frequency associated with the RVR decreases when the discharge is increased. Moreover, they show that the evolution of the RM and PM amplitudes differ between them and follow different trends. In general terms, the amplitude of the RM is significantly higher than that of the PM.
The RM and the PM induce responses at the same frequency on the draft tube cone. The PM is also transmitted at this particular frequency to all the rest of measuring positions. However, the RM is transmitted at different frequencies depending on the frame of reference and the transmission path from the excitation source to the measuring position.
The RVR induces fluctuating forces on the hydrostatic turbine bearing and fluctuating torques on runner blades and guide vanes. The hydrostatic turbine bearing axial forces follow the amplitude trend of the PM pressure whereas the radial forces follow those of the RM. Similarly, the runner blade and the guide vane torque fluctuations also follow primarily those of the RM.
The on-board sensors, such as the strain gauges, permit to precisely quantify the individual contribution of each RVR mode on the rotor-induced response. The separation of both contributions on the turbine-induced response is also possible with off-board sensors when they directly measure the shaft, such as with the displacement sensors, or when they are located close to the bearings, such as with the accelerometers, where they receive the vibrations coming from the shaft.
The evolution in amplitude of the RVR-induced structural responses by each mode correlate with those of the pressure signals when measuring on-board strains. In contrast, the amplitudes of the RM-induced structural response measured with off-board sensors, especially the accelerometers located close to the bearings, are not perfectly correlated with the amplitudes of the RM pressure fluctuations. Possible reasons for this uncorrelation might be the existence of structural resonances or other sources of excitation of mechanical or hydraulic origin. Therefore, care must be taken when using this type of measurements for quantification purposes.
The present findings will be used as a reference to design optimized monitor systems devoted to control the RVR phenomena and its effects on the dynamic response of full-scale prototypes.

 ,
, 


