Article

Strain-Sensing Mechanism and Axial Stress Response Characterization of Bolt Based on Fiber Bragg Grating Sensing

1
School of Energy Science and Engineering, Henan Polytechnic University, Jiaozuo 454000, China
2
Shanxi Huaxia Construction Engineering Consulting Co., Ltd., Taiyuan 030032, China
3
School of Energy Engineering, Xi’an University of Science and Technology, Xi’an 710054, China
4
China United Northwest Institute for Engineering Design and Research Co., Ltd., Xi’an 710054, China
*
Author to whom correspondence should be addressed.
Energies 2022, 15(17), 6384; https://doi.org/10.3390/en15176384
Submission received: 4 August 2022 / Revised: 23 August 2022 / Accepted: 30 August 2022 / Published: 1 September 2022

Abstract

:
The anchoring quality of bolts is related to roadway safety and the surrounding rock stability. Due to the limitations of conventional monitoring methods in capturing strain, there still exists a gap in the real-time perception of the mechanical properties of bolts at the micro-scale. This paper proposes a new approach to detecting bolts’ anchoring qualities based on the fiber Bragg grating sensing principle. Moreover, it studies the strain transmission mechanism between the surface-bonded fiber Bragg grating and the bolt. A fiber-optic monitoring test platform of anchor bolt anchoring quality is built. The full-length anchor bolt’s strain evolution law and axial force distribution characteristics are studied during the pull-out test. The study results have shown that the theoretical value of the fiber strain transfer coefficient can be used to calculate the strain of the bolt. The bolt pull-out test verified the accuracy of using the fiber Bragg grating bolt axial force characterization equation to estimate the bolt stress. On the other hand, the correlation between the bolt axial force and the fiber Bragg grating monitoring value follows an exponential pattern. This study provides an important basis for improving the understanding of a bolt anchoring mechanism and the stability control of a roadway’s surrounding rock.

1. Introduction

Nowadays, it is believed that increasing mining depths and heights and roadway sections increase the deformation of a roadway’s surrounding rock, which results in high demand for improved support technologies to overcome the complexity of such roadway designs [1,2]. Bolt support has become the most widely used active support method in the coal industry [3]. Under continuous coal seam mining, the surrounding rock of the roadway presents concealments and complexities. In addition, internal instability is not easy to detect. This makes monitoring the stress state of the bolt anchoring system very challenging. The anchoring quality of bolts has always been a focus of research due to roadway safety and stability concerns [4,5]. The force condition of the rock bolts during the supporting process is a significant basis for assessing their anchorage performance [6]. Typically, bolt stress monitoring methods are divided into contact and non-contact types. The contact type senses the stress distribution through force-measuring sensors installed on the bolt body. This technique uses resistance strain gauges, differential resistance strain gauges, steel strings, and hydraulic pillows. On the other hand, the non-contact methods utilize acoustic frequency stress waves, electromagnetic and infrared radiation monitoring, etc. [7,8]. The sensitive electromechanical components have been widely adopted. However, some shortcomings still exist such as their poor moisture-proof and waterproof abilities, anti-interference performance, and complex signal processing. In addition, they cannot achieve distributed measurement or meet the long-term monitoring requirements of bolt quality in complex engineering environments [9]. Currently, the literature still lacks comprehensive experimental research on the mechanical evolution process of the bolt interface at this stage, which restricts the development of bolt support design and theory [10].
Optical fiber sensing technology is a new optoelectronic technology that takes advantage of the benefits of optical fiber communication and fiber optics. In 1978, Hill [11] discovered the photosensitive effect of fiber in the germanium-doped quartz fiber, making the world’s first fiber grating using the standing wave writing method. In 1992, Prohaska [12] embedded fiber Bragg grating (FBG) into civil structures to measure strain. Indeed, FGB sensing technology has the advantages of high precision and sensitivity, anti-electromagnetic interference, corrosion resistance, long service life, and long-distance transmission. Additionally, it has been applied to mining, bridges, electrical power, and other fields [13,14]. The coaxial pull test is a commonly practiced procedure for assessing the in situ load capacity of tendon support elements including rock bolts, cables, and other ground anchor variations [15]. It is of great practical significance to explore the FBG monitoring method’s suitability in anchor bolts and improve engineers’ understanding of the anchoring mechanism and surrounding rock’s deformation and failure mechanism by monitoring bolts’ anchoring quality with the help of optical fiber sensing technology.
The application of FBG sensing technology in bolt anchoring quality monitoring mainly focuses on the strain transmission mechanism between the optical fiber and bolt body and the optical fiber characterization of the bolt stress distribution. Many research efforts have been made to investigate the strain transmission mechanism between the optical fiber and anchor rod. In 1952, Cox [16] proposed using the shear lag theory to analyze the stress transfer of single fiber composites, which pointed out the direction for studying the stress transfer of FBG sensors. Nanni [17] obtained the strained relationship between the sensor and the concrete matrix structure by assuming that the concrete structure matrix is well-adhered to the optical fiber and that the concrete matrix is subjected to a uniform normal stress parallel to the axial direction of the optical fiber. Ansari [18] assumed the strain at the center of an FBG to be the same as the matrix and proposed an embedded strain transfer model that ignores the stress coupling effect of the cemented layer on the fiber. Lau [19] considered the role of the cemented layer based on Ansari’s model [18] and further modified the variable transfer model. Li et al. [20] corrected the assumption that the strain at the center of an FBG sensor’s adhesive length is the same as the matrix structure’s strain and deduced the strain transmission rate of each point of an FBG sensor. Considering the characteristics of drilling packaging materials and the size influence, Zhang et al. [21] developed a new transfer relationship between FBG strain and loose layer strain, further improving the FBG strain transfer theory. Li [22] implemented the glass-fiber-reinforced polymer (GFRP) bolt with an FBG sensor to conduct an on-site pull-out test to study the GFRP bolt’s anchoring mechanism and stress distribution. Liang [23] designed an FBG force-measuring bolt and derived its optical force conversion equation. Li et al. [24] used GFRP bars with built-in FBG to make a bolt structure model and study the stress failure mechanism of large-diameter sandblasted GFRP bolts under the anchoring condition of frame beams. When the optical fiber is pasted to the bolt surface, the surface-pasted grating is only affected by the force on one side of the matrix, which is asymmetric in terms of the force characteristics. Therefore, the surface-pasted grating and the embedded grating will have different strain transmission laws.
This paper investigates the strain transfer mechanism between the surface-bonded bare fiber grating and the bolt. Furthermore, a fiber characterization model for the bolt’s axial force is developed. A fiber Bragg grating force-measuring bolt is designed. Within the study context, the axial force distribution characteristics of the bolt body under various load conditions are studied through the bolt pull-out test to provide a theoretical basis for the reliability evaluation of bolt anchoring.

2. Bolt Force Characterization Method in Surface-Bonded FBG

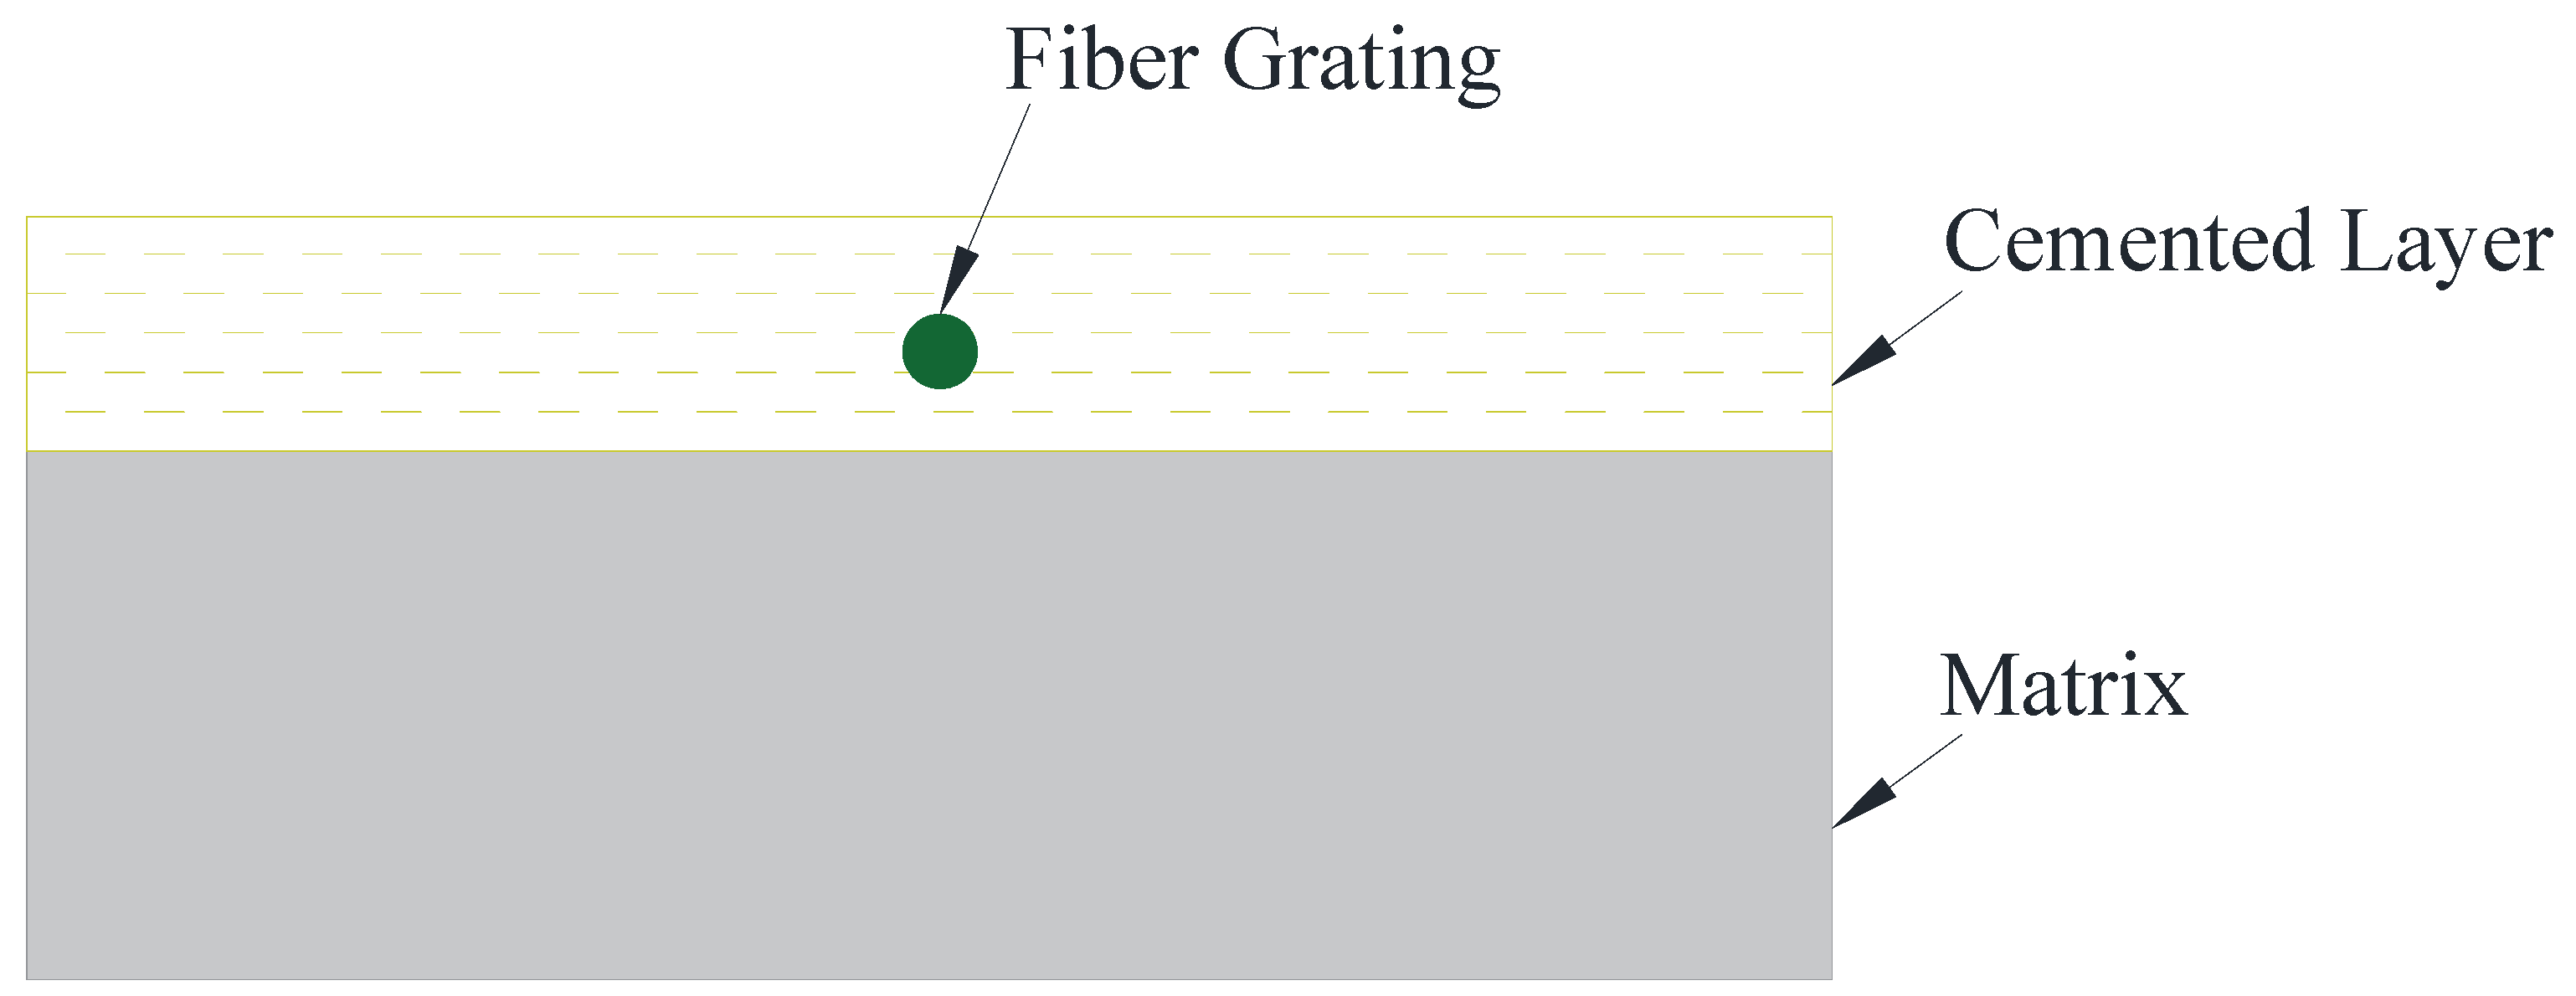
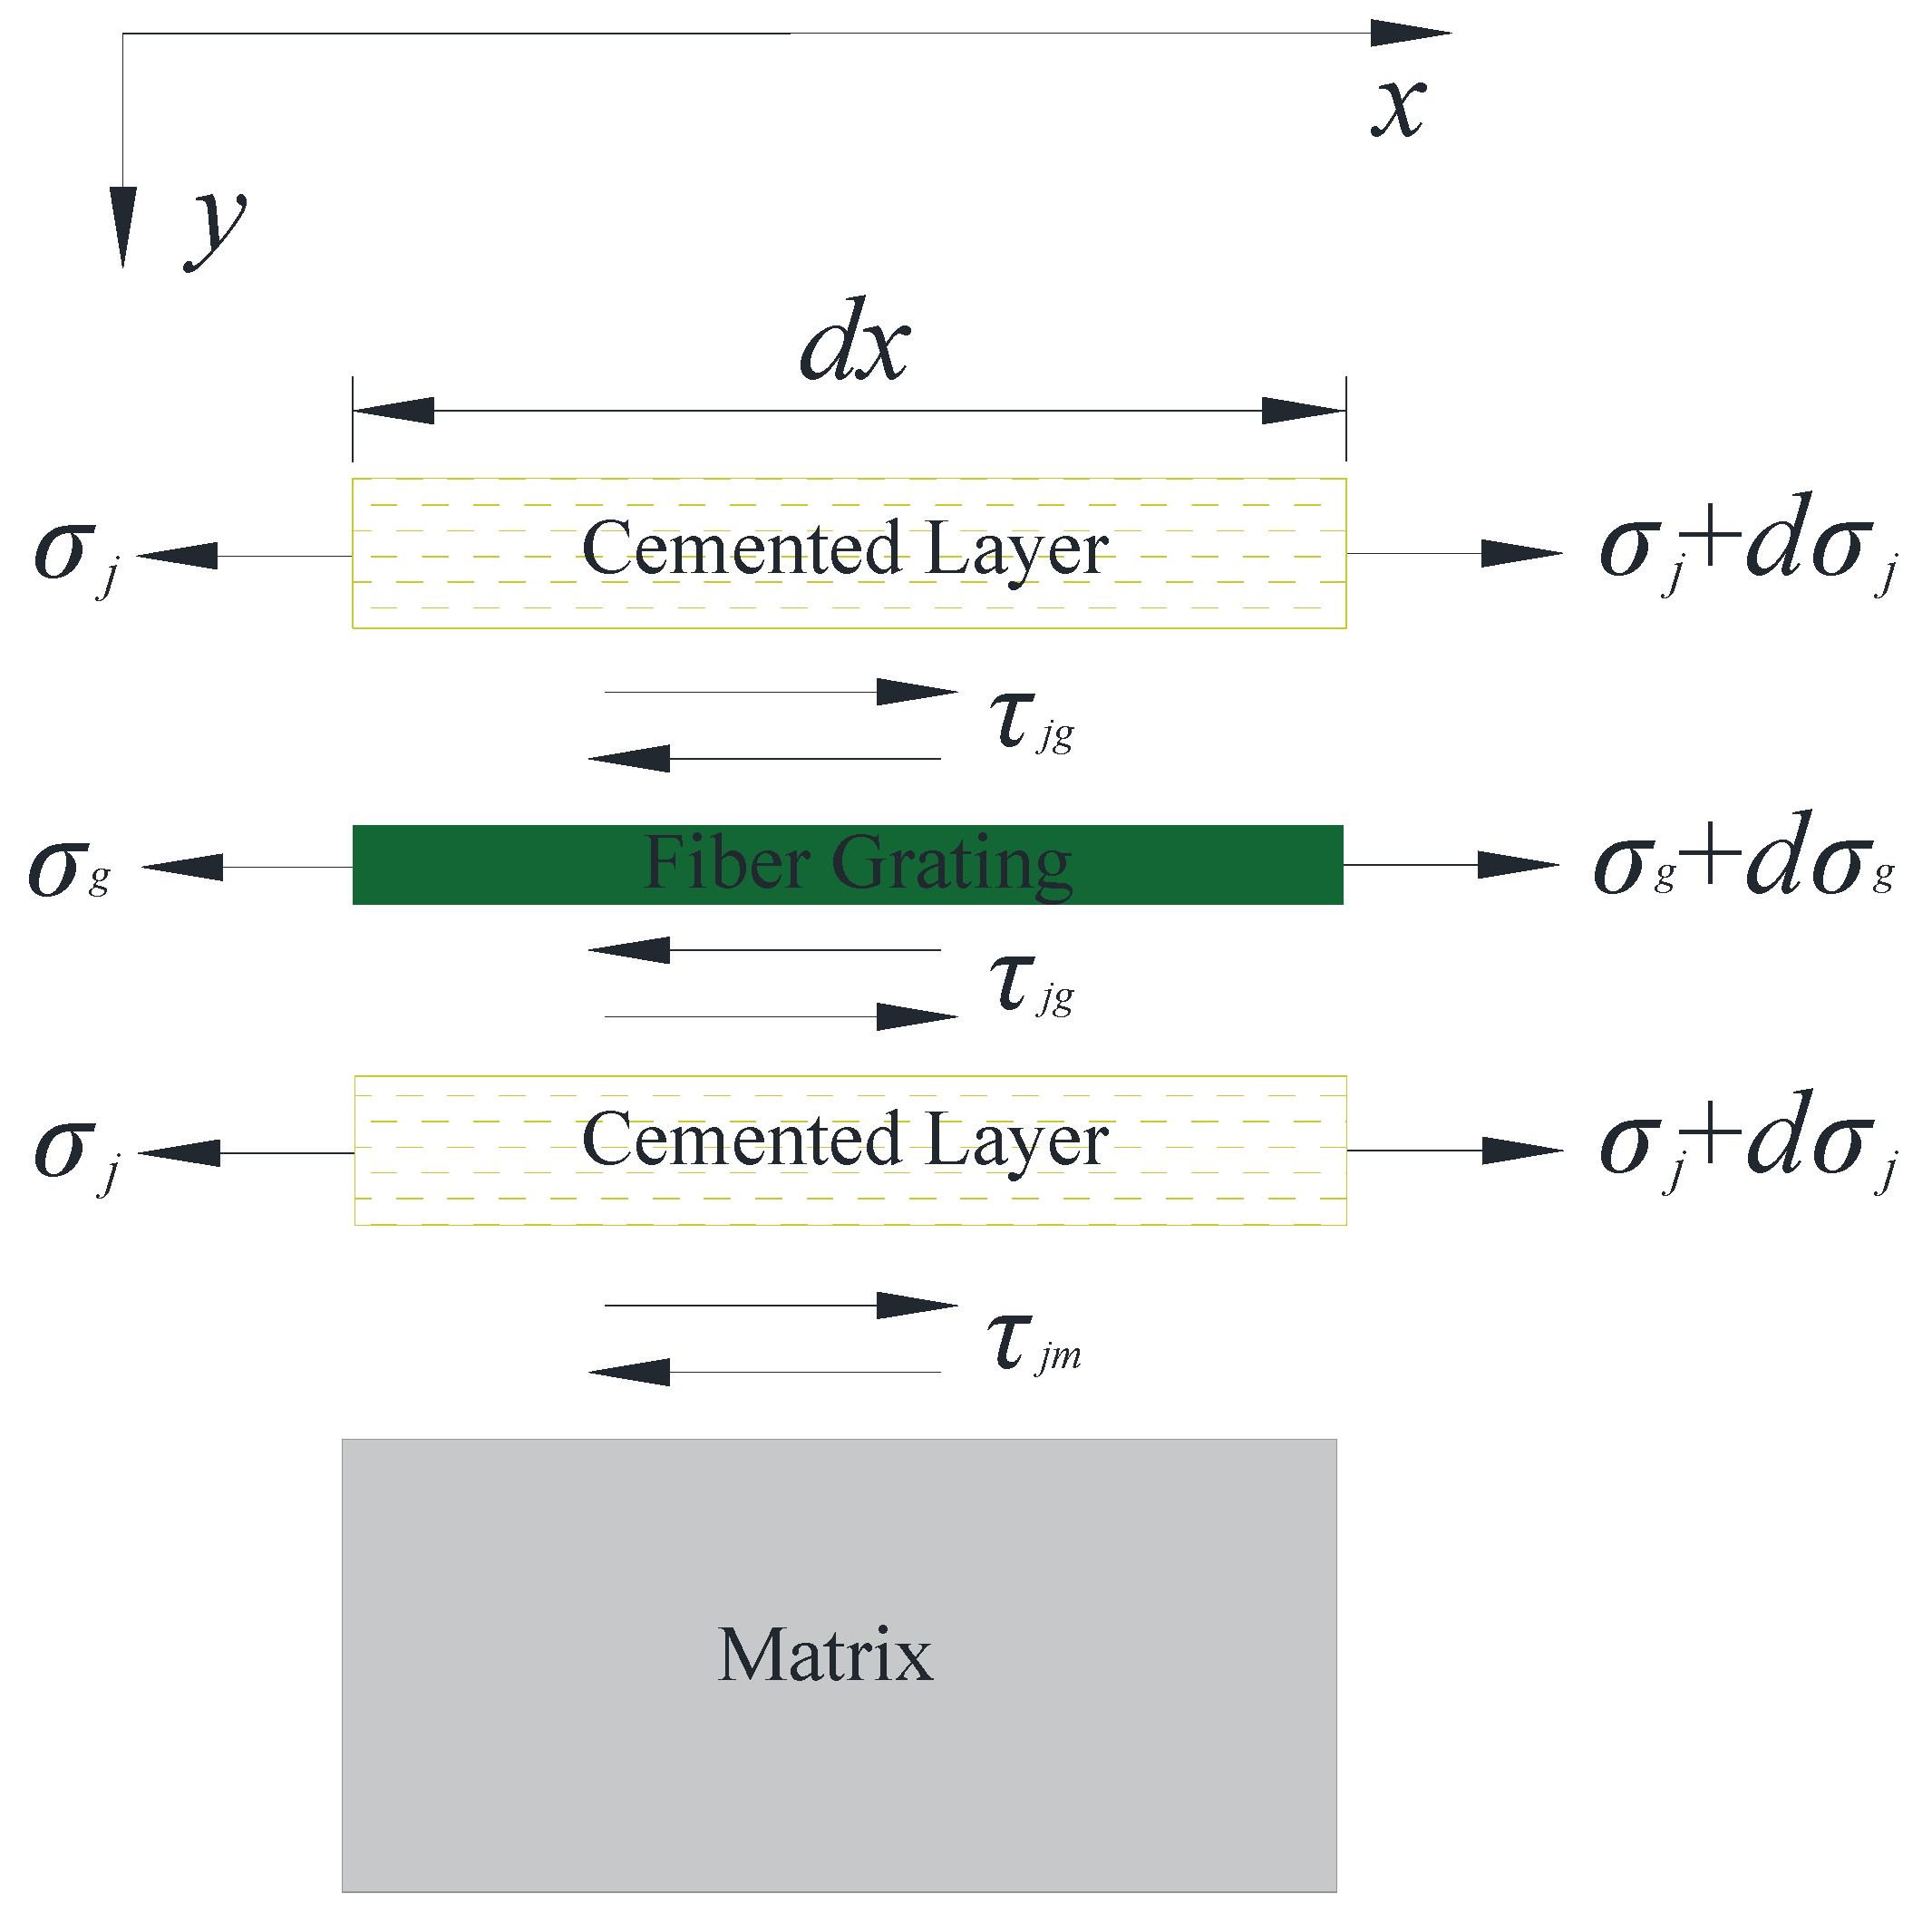
2.1. Analysis of Strain Transmission between Bolt and FBG

Due to the limitations of conventional monitoring methods in capturing strain, there still exists a gap in the real-time perception of the mechanical properties of bolts at the micro-scale [25]. In the process of a full-length, anchored, bolt-supported surrounding rock, the rock’s surface produces axial tensile stress on the bolt under the action of the self-weight and structural stresses. When the surrounding rock stress is at a certain angle with the axial direction of the bolt, the bolt body is subjected to shear force. In this paper, the stress direction of the surrounding rock is considered consistent with the axial direction of the bolt. Under the shear force effects at the interface between the bolt and rock mass, the bolt undergoes tensile deformation and even failure. The shear stress evolution process between the bolt body and the rock mass interface is the basis of the mechanical evolution of the bolt support system and it is also a weak link that plays a vital role in the bolt’s load transmission and failure process [26,27].
Once the optical fiber is installed on the bolt surface along its axial direction, the axial strain of the optical fiber occurs under the action of the interface shear stress. Therefore, the bolt’s body strain and axial force change can be obtained by sensing the axial strain of the FBG sensor. The surface-bonded FBG sensor installation has the characteristics of a simple operational process and is not easily affected by the external environment. However, when the bare FBG is directly bonded to the substrate surface, its strain is inconsistent with that of the substrate due to the adhesive layer thickness. Therefore, it is necessary to deduce the relationship between the strain measured by bare FBG and the strain of the bolt matrix.
The following mechanical assumptions are made in this paper: (1) The mechanical properties of the fiber core and cladding are the same; (2) The interface between fiber Bragg grating, cemented layer, and the matrix is closely combined without relative sliding; (3) The strain gradient of the FBG and cemented layers are the same; (4) The shear stress in the cemented layer changes linearly with the thickness; and (5) The intermediate layer reacts with the matrix, thereby reducing its strain. The influence depth of the intermediate layer on the matrix is expressed in hm, and hm is taken as 1 mm. The schematic diagram of bare FBG sticking to the substrate surface is shown in Figure 1, and the side view is shown in Figure 2.
Taking the microcells with any length of dx on the FBG sensor, the strain transfer relationship between the different media of the microcell media is shown in Figure 3.
The mechanical analysis of each microelement layer is carried out. According to the static equilibrium of force [28], the stress of the cemented layer is analyzed as follows:
d σ j ( b h π r g 2 ) + τ j g 2 π r g d x + τ j m b d x = 0
where σj is the axial stress of the cemented layer, b is the bonding width of the bare fiber grating, h is the bonding thickness, rg is the radius of the fiber, τjg is the shear stress between the cemented layer and the interface of the fiber layer, and τjm is the shear stress between the cemented layer and the interface of the matrix.
Indeed, Equation (1) is simplified to
d σ j d x = τ j m b τ j g 2 π r g b h π r g 2
The force in the x direction is balanced for the optical fiber layer.
d σ g π r g 2 τ j g 2 π r g d x = 0
where σg is the axial stress of the optical fiber.
Then, it is possible to obtain the shear stress at the optical fiber boundary as follows:
τ j g = r g 2 d σ g d x
By substituting Equation (4) into Equation (2), the shear stress between the cemented layer and the interface of the matrix is expressed as follows:
τ j m = d σ j d x ( h π r g 2 b ) d σ g d x π r g 2 b
Assuming that the strain gradient of the fiber Bragg grating layer and the cemented layer are the same, it is obtained that
d ε g d x = d ε j d x
where εg and εj are the axial strain of the optical fiber and cemented layers, respectively.
The relationship between the axial stress and axial strain of each layer is expressed as follows:
d σ g d x = E g d ε g d x ,   d σ j d x = E j d ε j d x
where Eg and Ej are the elastic moduli of the optical fiber layer and the cemented layer, respectively.
Substituting Equations (6) and (7) into Equations (4) and (5), respectively, obtain the shear stress τjg at the fiber boundary and the shear stress τjm at the matrix boundary as follows:
τ j g = E g r g 2 d ε g d x
τ j m = [ E j ( h π r g 2 b ) + E g π r g 2 b ] d ε g d x
Assuming that the shear stress of each layer changes linearly, the shear stress τm on the matrix surface increases linearly with the value of y up to meet the boundary conditions when y = h + hm, τm is 0. Indeed, when y = h, τm = τmj and the expression of the shear stress of the matrix layer is obtained as follows:
τ m = τ j m h m y + τ j m h m ( h + h m )
where hm is the influence depth of the intermediate layer on the matrix.
Substituting Equation (9) into Equation (10) yields the value of τm as follows:
τ m = ( h + h m y ) 1 h m [ E j ( h π r g 2 b ) + E g π r g 2 b ] d ε g d x
Simultaneously solving Equation (11) and τ m = G m d u d y by integrating y on both sides yields the following:
G m ( μ m μ j ) = 1 2 h m [ E j ( h π r g 2 b ) + E g π r g 2 b ] d 2 ε d x 2
where Gm is the shear modulus of the matrix. For the derivation of x on both sides of Equation (12), the axial strain of matrix εm is expressed as
ε m = ε j 1 2 h m G m [ E j ( h π r g 2 b ) + E g π r g 2 b ] d 2 ε d x 2
The shear stress of the cemented layer is also obtained and τj is expressed as
τ j = τ j m τ j g h 2 r g y + τ j m ( r g h 2 ) + τ j g h h 2 r g
Substituting Equation (14) into τ j = G j d u d y , and then integrate y on both sides:
h 2 + r g h G j d u d y dy = h 2 + r g h [ τ j m τ j g h 2 r g y + τ j m ( r g h 2 ) + τ j g h h 2 r g ] d y
where Gj is the shear modulus of the matrix.
The above equation can be simplified as follows:
G j ( μ j μ g ) = ( τ j m + τ j g ) ( h 4 r g 2 )
where μg and μj are the axial displacements of the optical fiber and cemented layers.
Substituting Equation (7) and Equation (8) into Equation (16), the axial strain of the cemented layer can be obtained by deriving x on both sides as follows:
ε j = ε g E g G j ( π r g 2 b + r g 2 ) ( h 4 r g 2 ) d 2 ε g d x 2
Substituting Equation (17) into Equation (13) to obtain the axial strain of the matrix, εm is expressed as:
ε m = ε g E g G j ( π r g 2 b + r g 2 ) ( h 4 r g 2 ) d 2 ε g d x 2 1 2 h m G m [ E j ( h π r g 2 b ) + E g π r g 2 b ] d 2 ε g d x 2
The expression of K can be obtained from the above equation as
1 k 2 = E g G j ( π r g 2 b + r g 2 ) ( h 4 r g 2 ) + 1 2 h m G m [ E j ( h π r g 2 b ) + E g π r g 2 b ]
Then, Equation (18) is transformed into
k 2 ε m = d 2 ε g d x 2 k 2 ε g
The general solution of the above equation is given as follows:
ε g ( x ) = C 1 e k x + C 2 e k x + ε m ( x )
where C1 and C2 are the integral constants determined by the boundary conditions, and the boundary conditions are εg(L) = εg(−L) = 0, which are obtained using the boundary conditions:
C 1 = C 2 = ε m 2 cosh ( k L )
Therefore, Equation (21) can be converted into
ε g ( x ) = ε m ( x ) [ 1 cosh ( k x ) cosh ( k L ) ]
The average strain of the optical fiber over the entire bonding length is expressed as follows:
ε g = 2 0 L [ 1 cosh ( k x ) cosh ( k L ) ] d x 2 L ε m = [ 1 sinh ( k L ) k L cosh ( k L ) ] ε m
The average strain transfer coefficient α over the entire fiber bonding length is expressed as follows:
α = ε m ( x ) ε g ( x ) = 1 1 sinh ( k L ) k L cosh ( k L )
where L is the half length of the bonded bare fiber grating.

2.2. FBG Characterization Model of Bolt Axial Force

The relationship between the axial force on the bolt and the bolt strain is [29]:
N x = 1 4 π D 2 E m ε m ( x )
where Nx is the axial force at point x on the bolt, Em is the bolt’s elastic modulus, εm(x) is the strain value at point x on the bolt, and D is the bolt diameter.
Combining Equations (25) and (26), the optical fiber characterization equation of the bolt axial force is
N x = 1 4 π D 2 E m α ε g ( x ) = π D 2 E m ε g ( x ) 4 4 sinh ( k L ) k L cos h ( k L )

3. Bolt Optical Fiber Testing System and Pull-Out Test Scheme

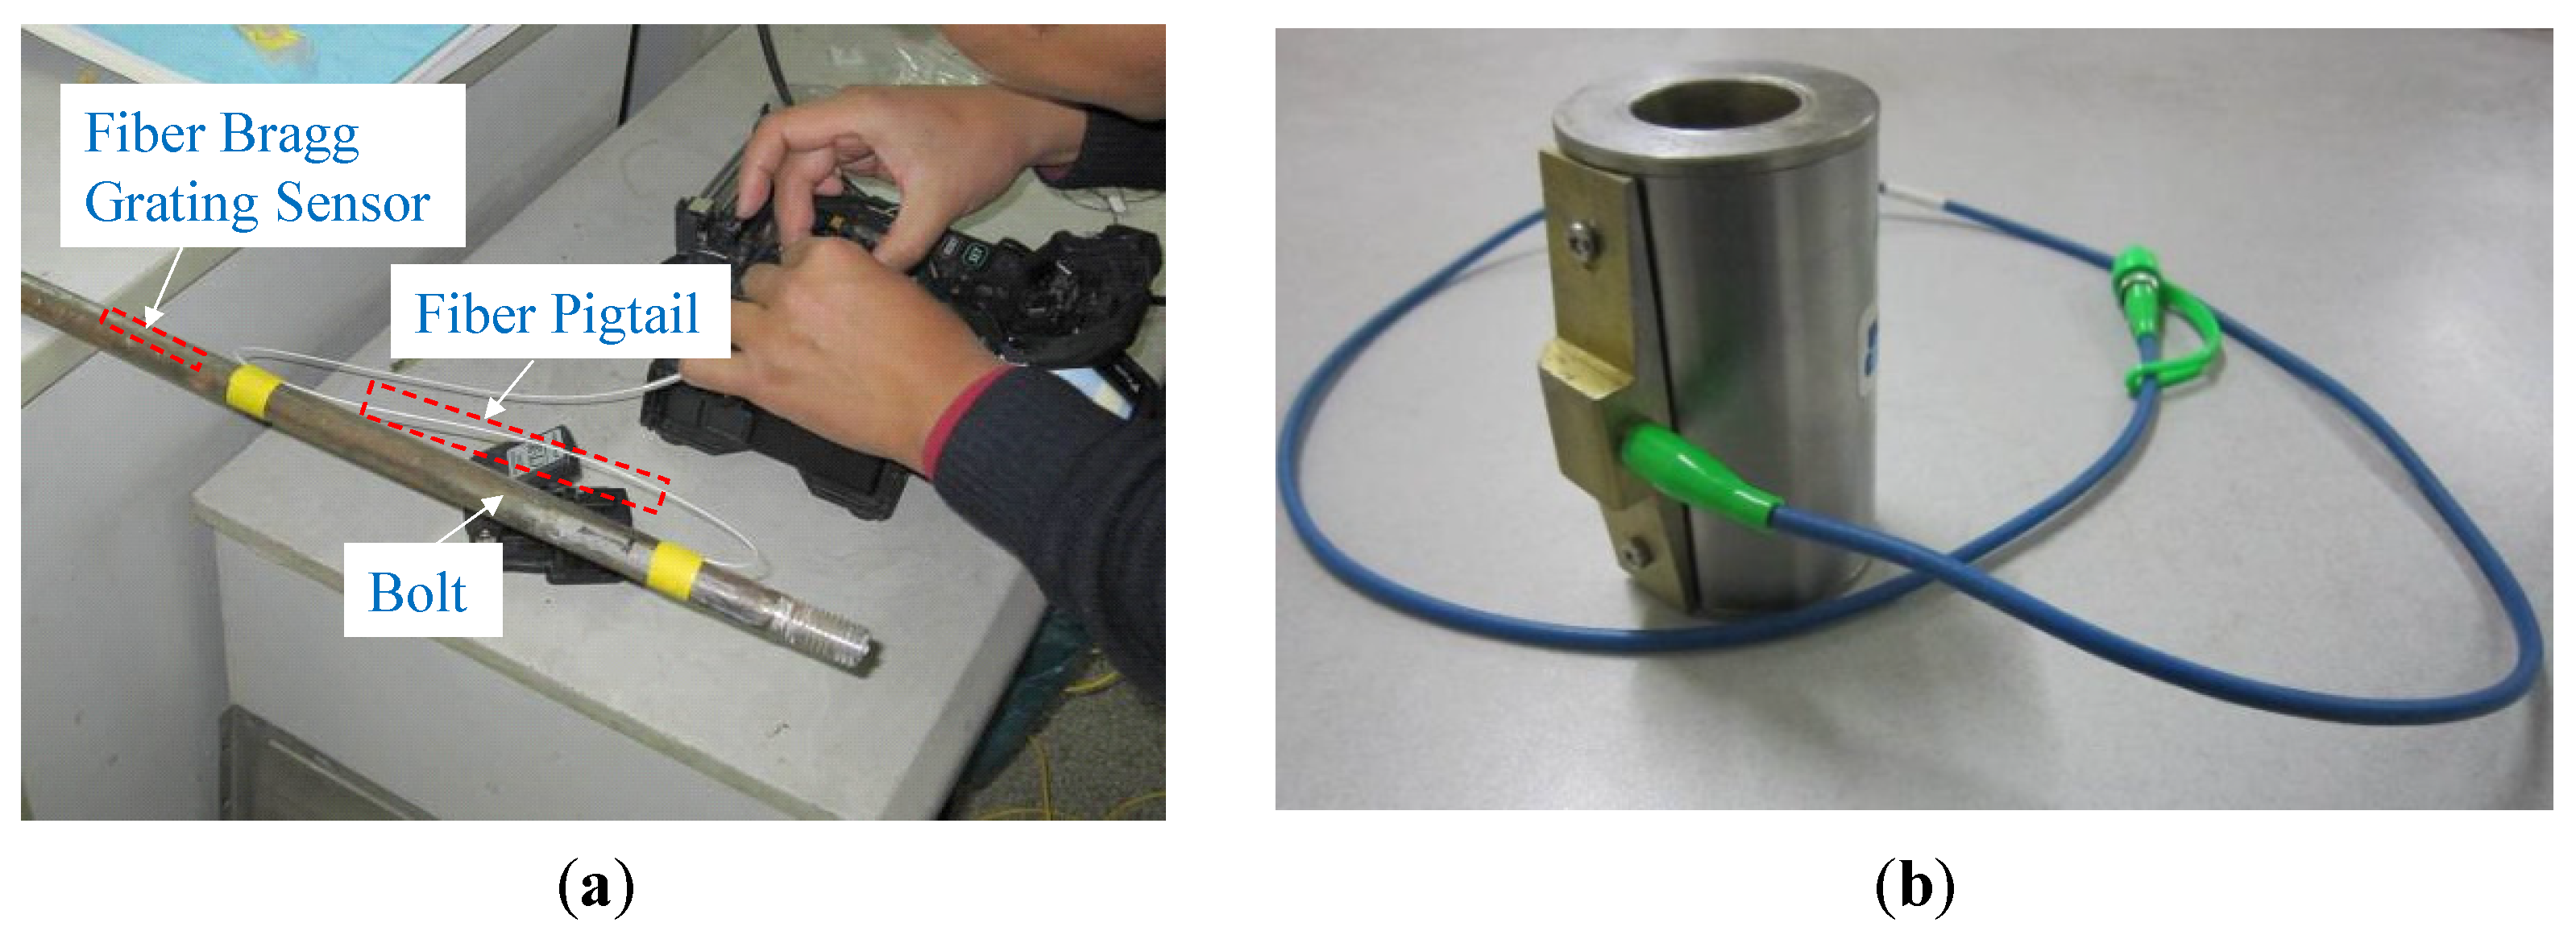
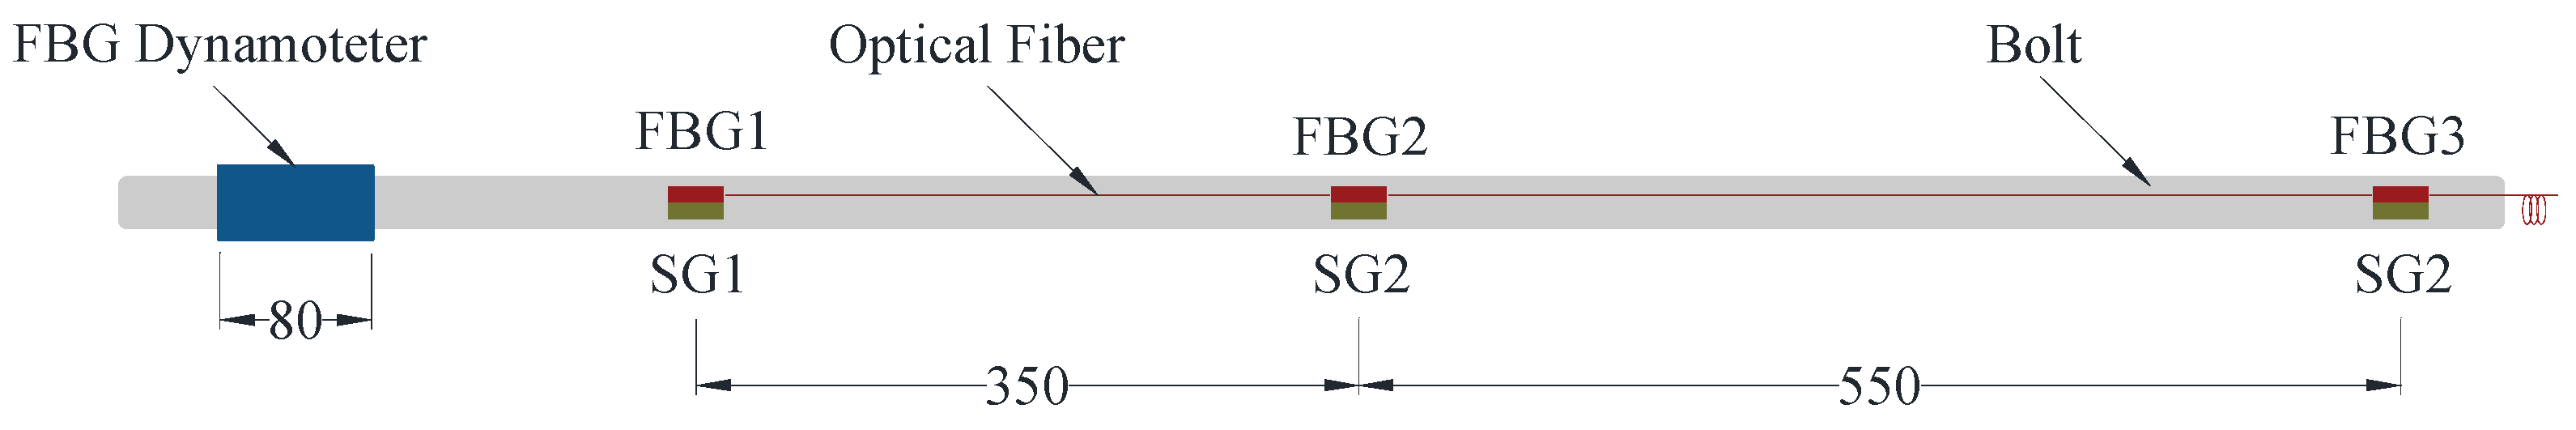
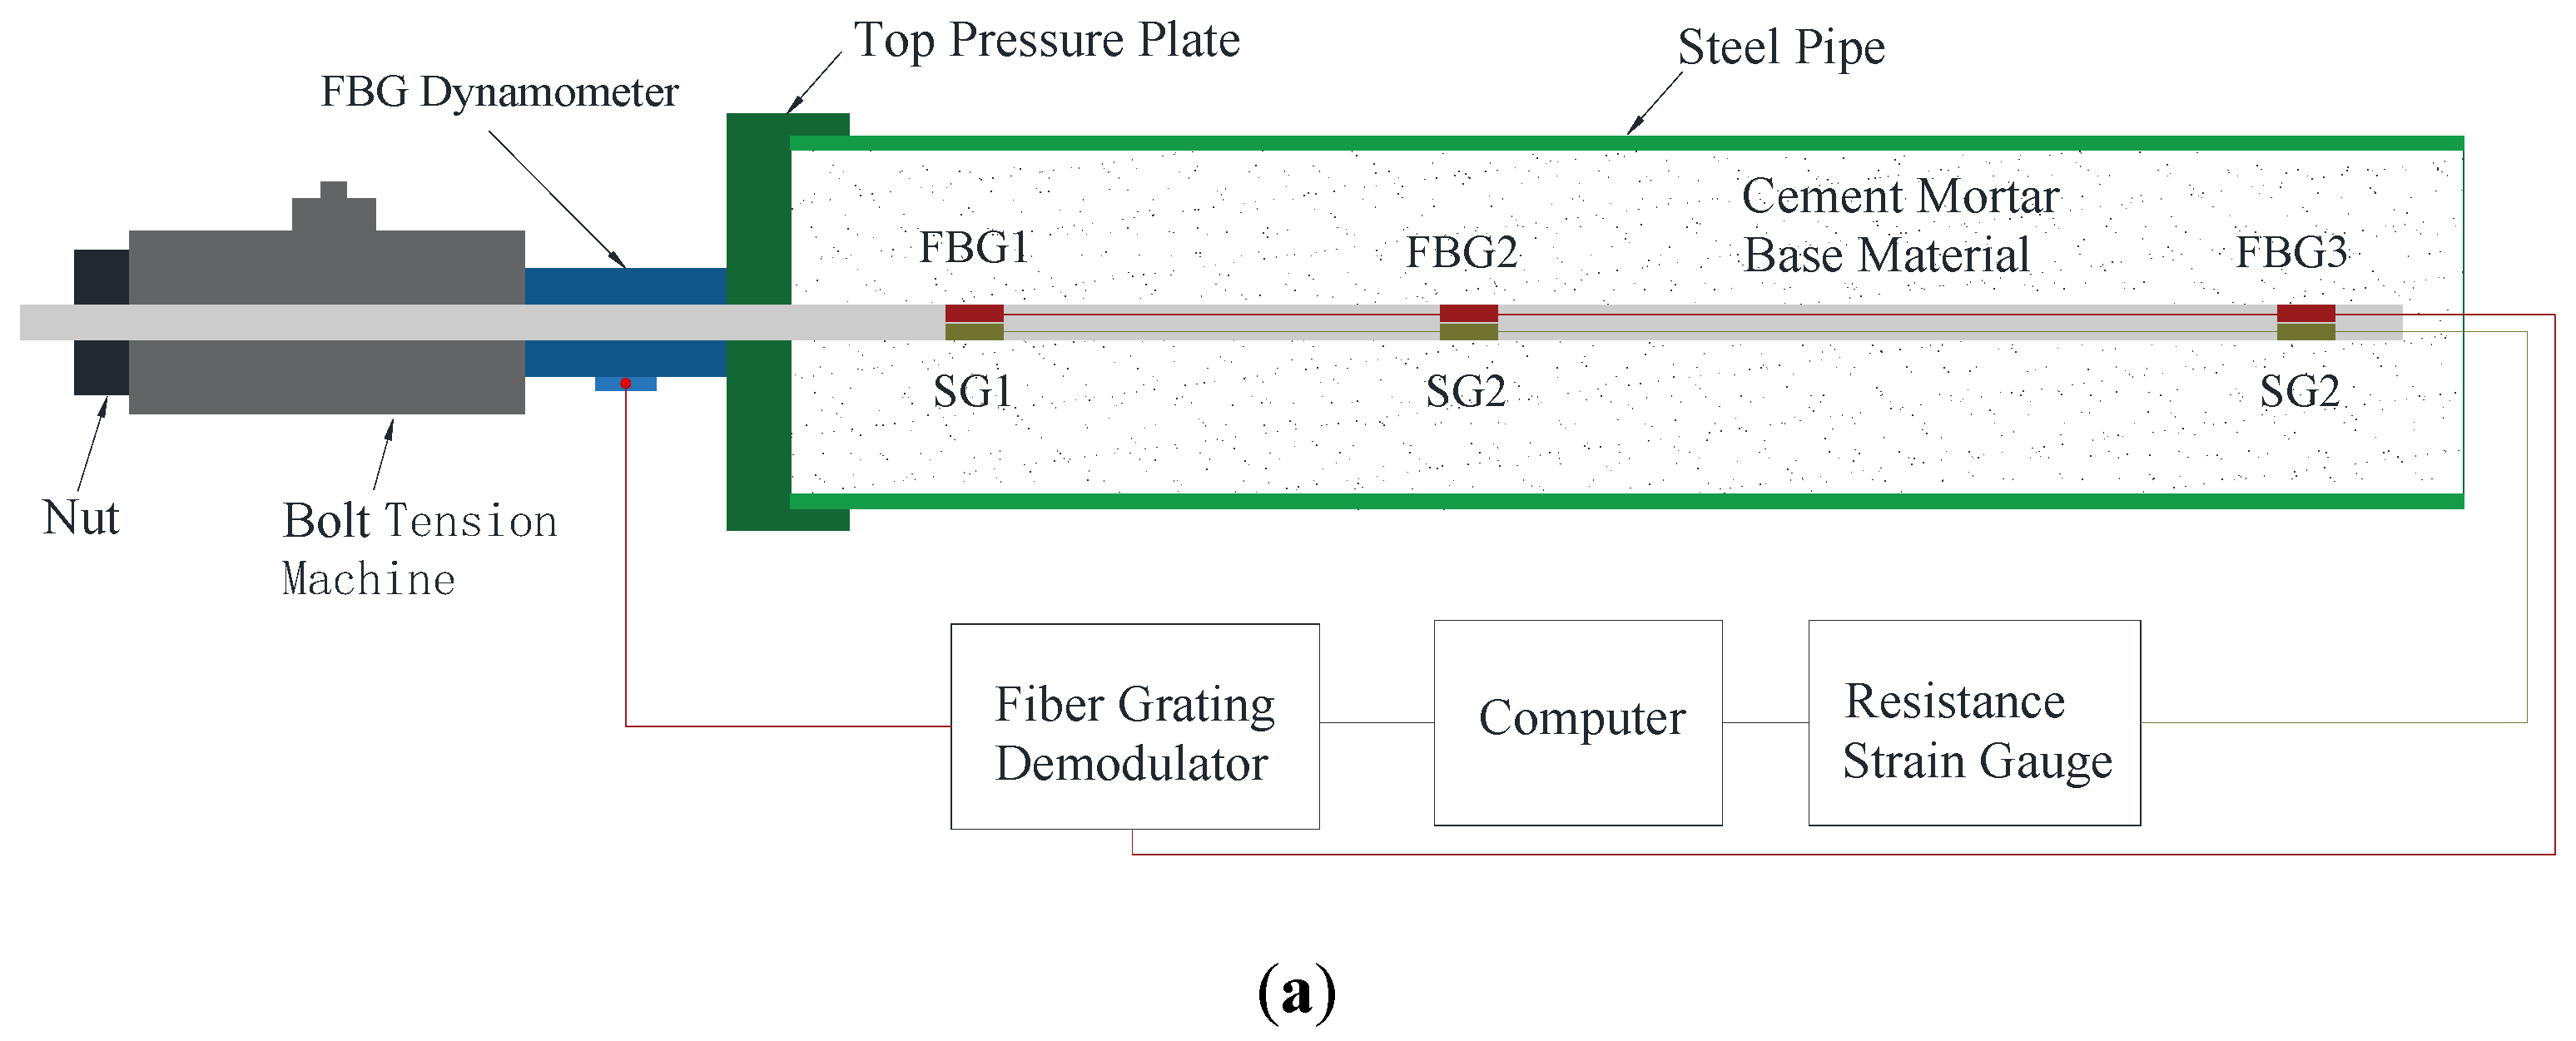
3.1. Design of Surface-Bonded FBG Force-Measuring Bolt
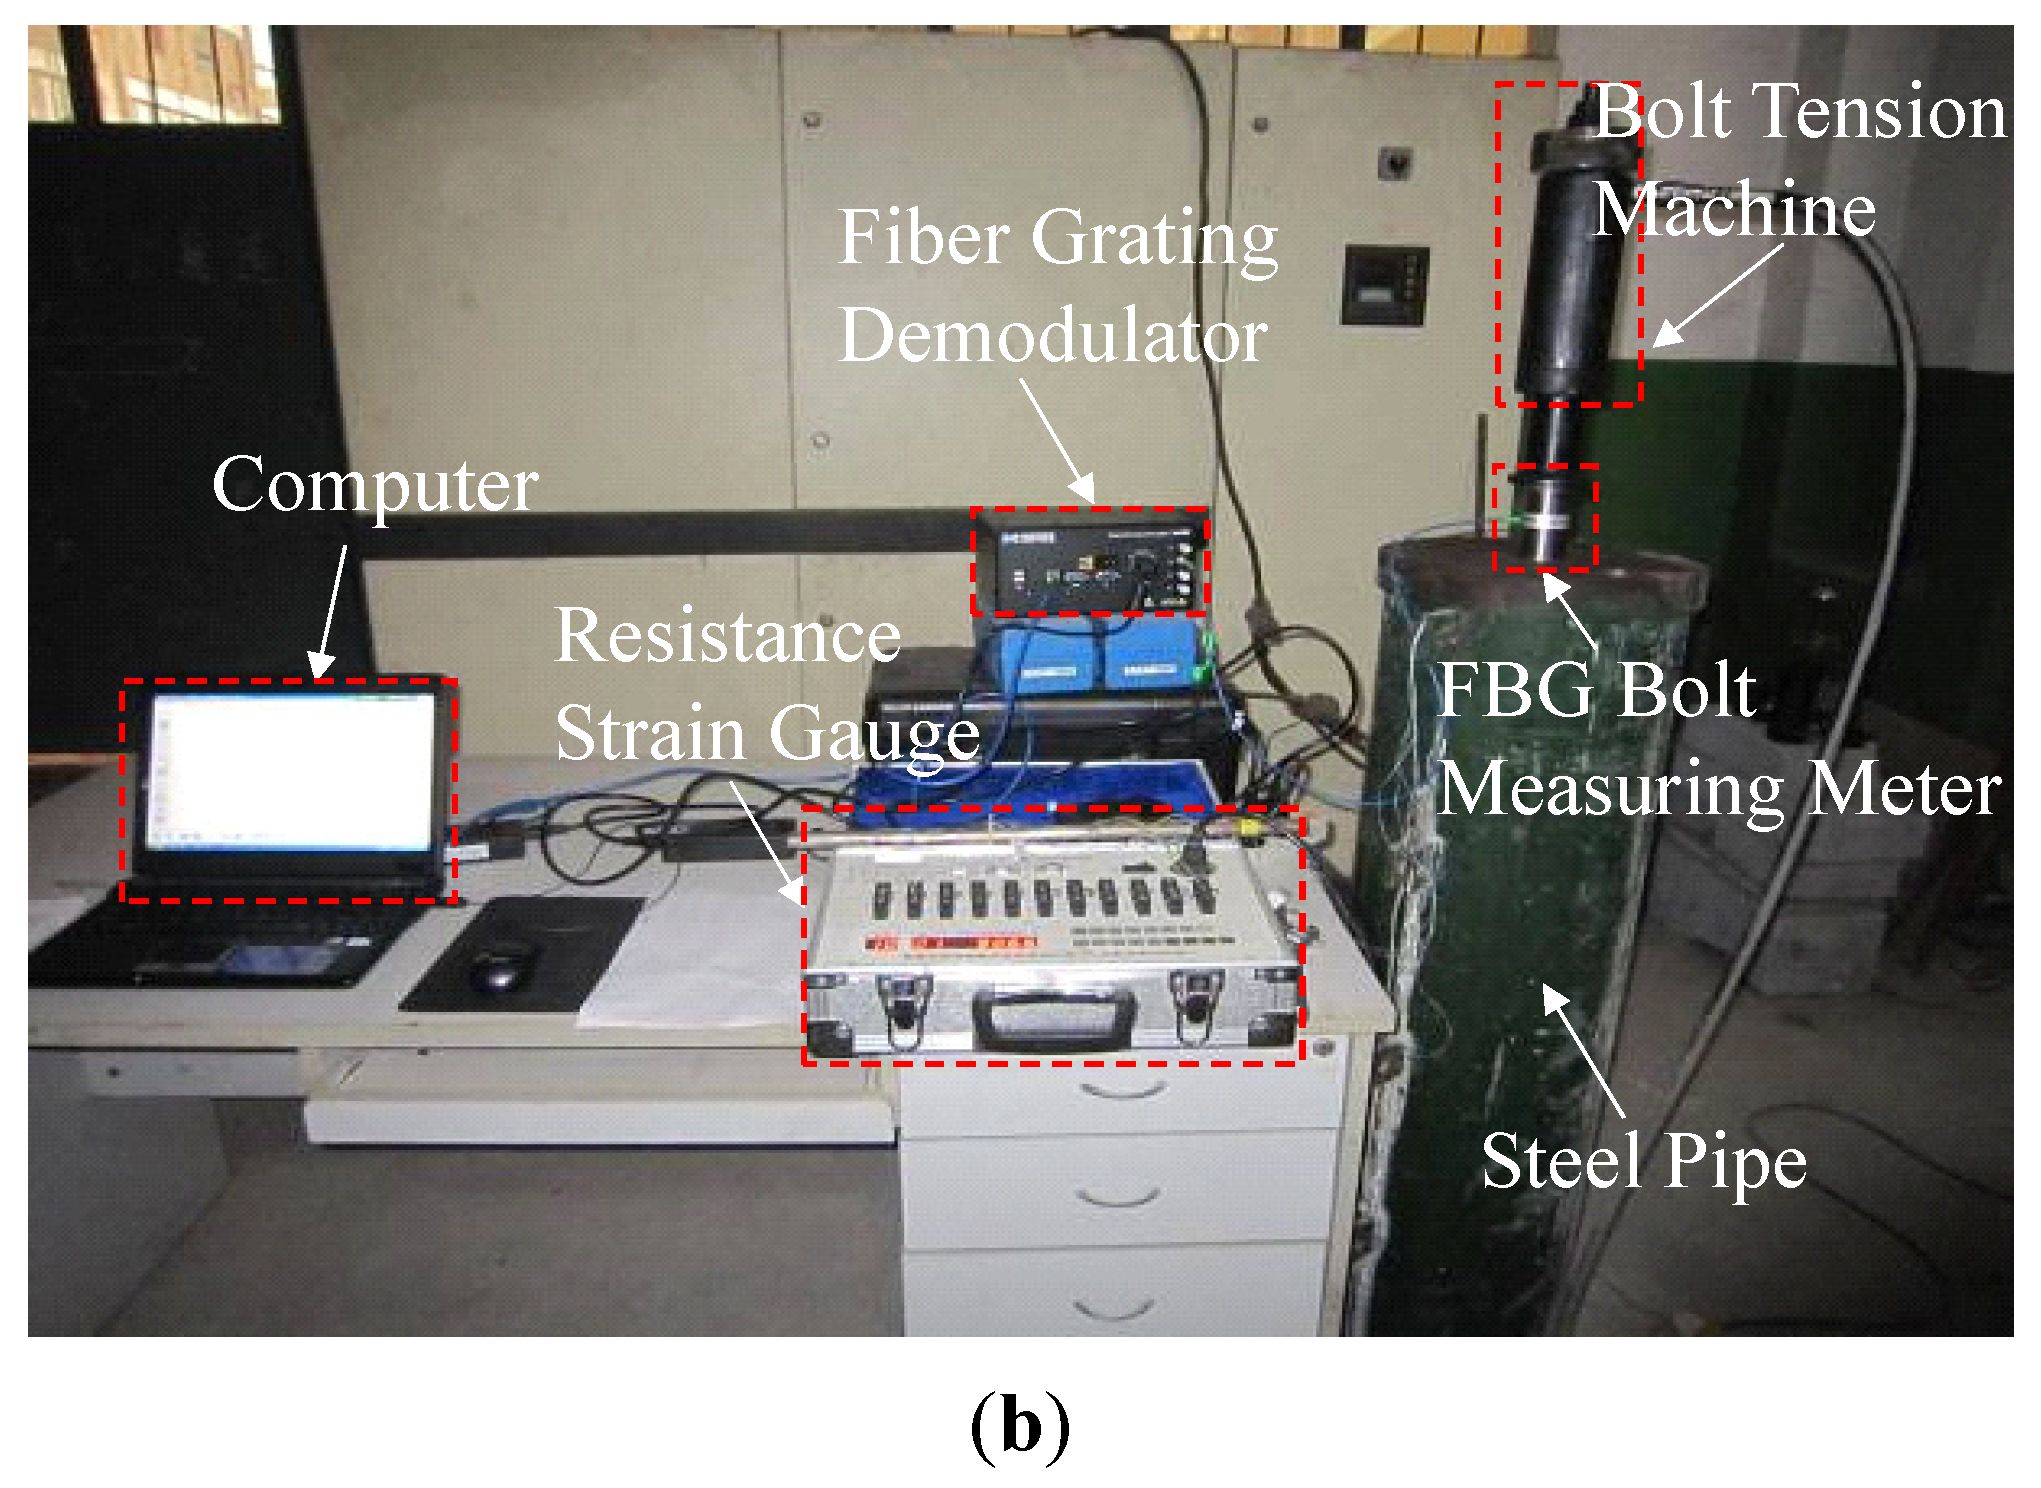
In practice, the pull-out test was usually carried out on the bolt for the distribution of the axial force in order to assess the anchorage performance [30]. The FBG sensor was installed on a threaded steel bolt with an 18 mm diameter by surface bonding. Moreover, three FBG sensors with a grid spacing of 10 mm were connected in series using the FBG wavelength division multiplexing characteristics. The bolt surface was first polished and cleaned, and then the bare FBG was attached to it using an epoxy resin adhesive. The fiber bonding length was 40 mm. After 24 h, the epoxy resin adhesive layer was recoated to improve the overall protection. Figure 4a shows the encapsulated FBG force-measuring bolt. Furthermore, Figure 4b illustrates the FBG dynamometer installed at the bolt’s end to test the anchoring force. Finally, a strain gauge was pasted at the FBG sensor position to compare and analyze the strain changes during the bolt pull-out test, as shown in Figure 5. The FBG sensors were numbered FBG1, FBG2, and FBG3, and their spacings were 350 mm and 550 mm, respectively, with initial wavelengths of 1544.900 nm, 1549.842 nm, and 1554.998 nm, respectively.

3.2. Testing Setup

The FBG bolt pull-out test setup consists of a force-measuring bolt, bolt tension machine, top pressure plate, steel pipe, FBG demodulator, resistance strain gauge, and computer. The cement mortar base material was placed into the steel pipe with an inner diameter of 300 mm and a length of 1100 mm to simulate the surrounding rock. The encapsulated force-measuring bolt is installed at the axis of the cement mortar base material. FBG1, FBG2, and FBG 3 were located 50 mm, 400 mm, and 950 mm away from the anchor end of the bolt, respectively. A Moi FBG demodulator and resistance strain gauge were used to measure the bolt’s body strain and end strain during the load application process. The bolt pull-out test setup is shown in Figure 6.

3.3. Loading Protocol

The bolt pull-out test was carried out by equal gradient loading. Throughout the entire process, the load was divided into 12 stages. The load in the first nine started from 0 kN up to 58.8 kN with an average step of 6.53 kN. Thereafter, the average step size was 5.88 kN for the load range of 58.8 kN to 76.44 kN. Once each loading stage had been completed, the test was stopped to reach a stable deformation and then the central wavelength of the FBG was read. Finally, the test was terminated by unloading when the load reached 74.66 kN.

4. Analysis of Test Results

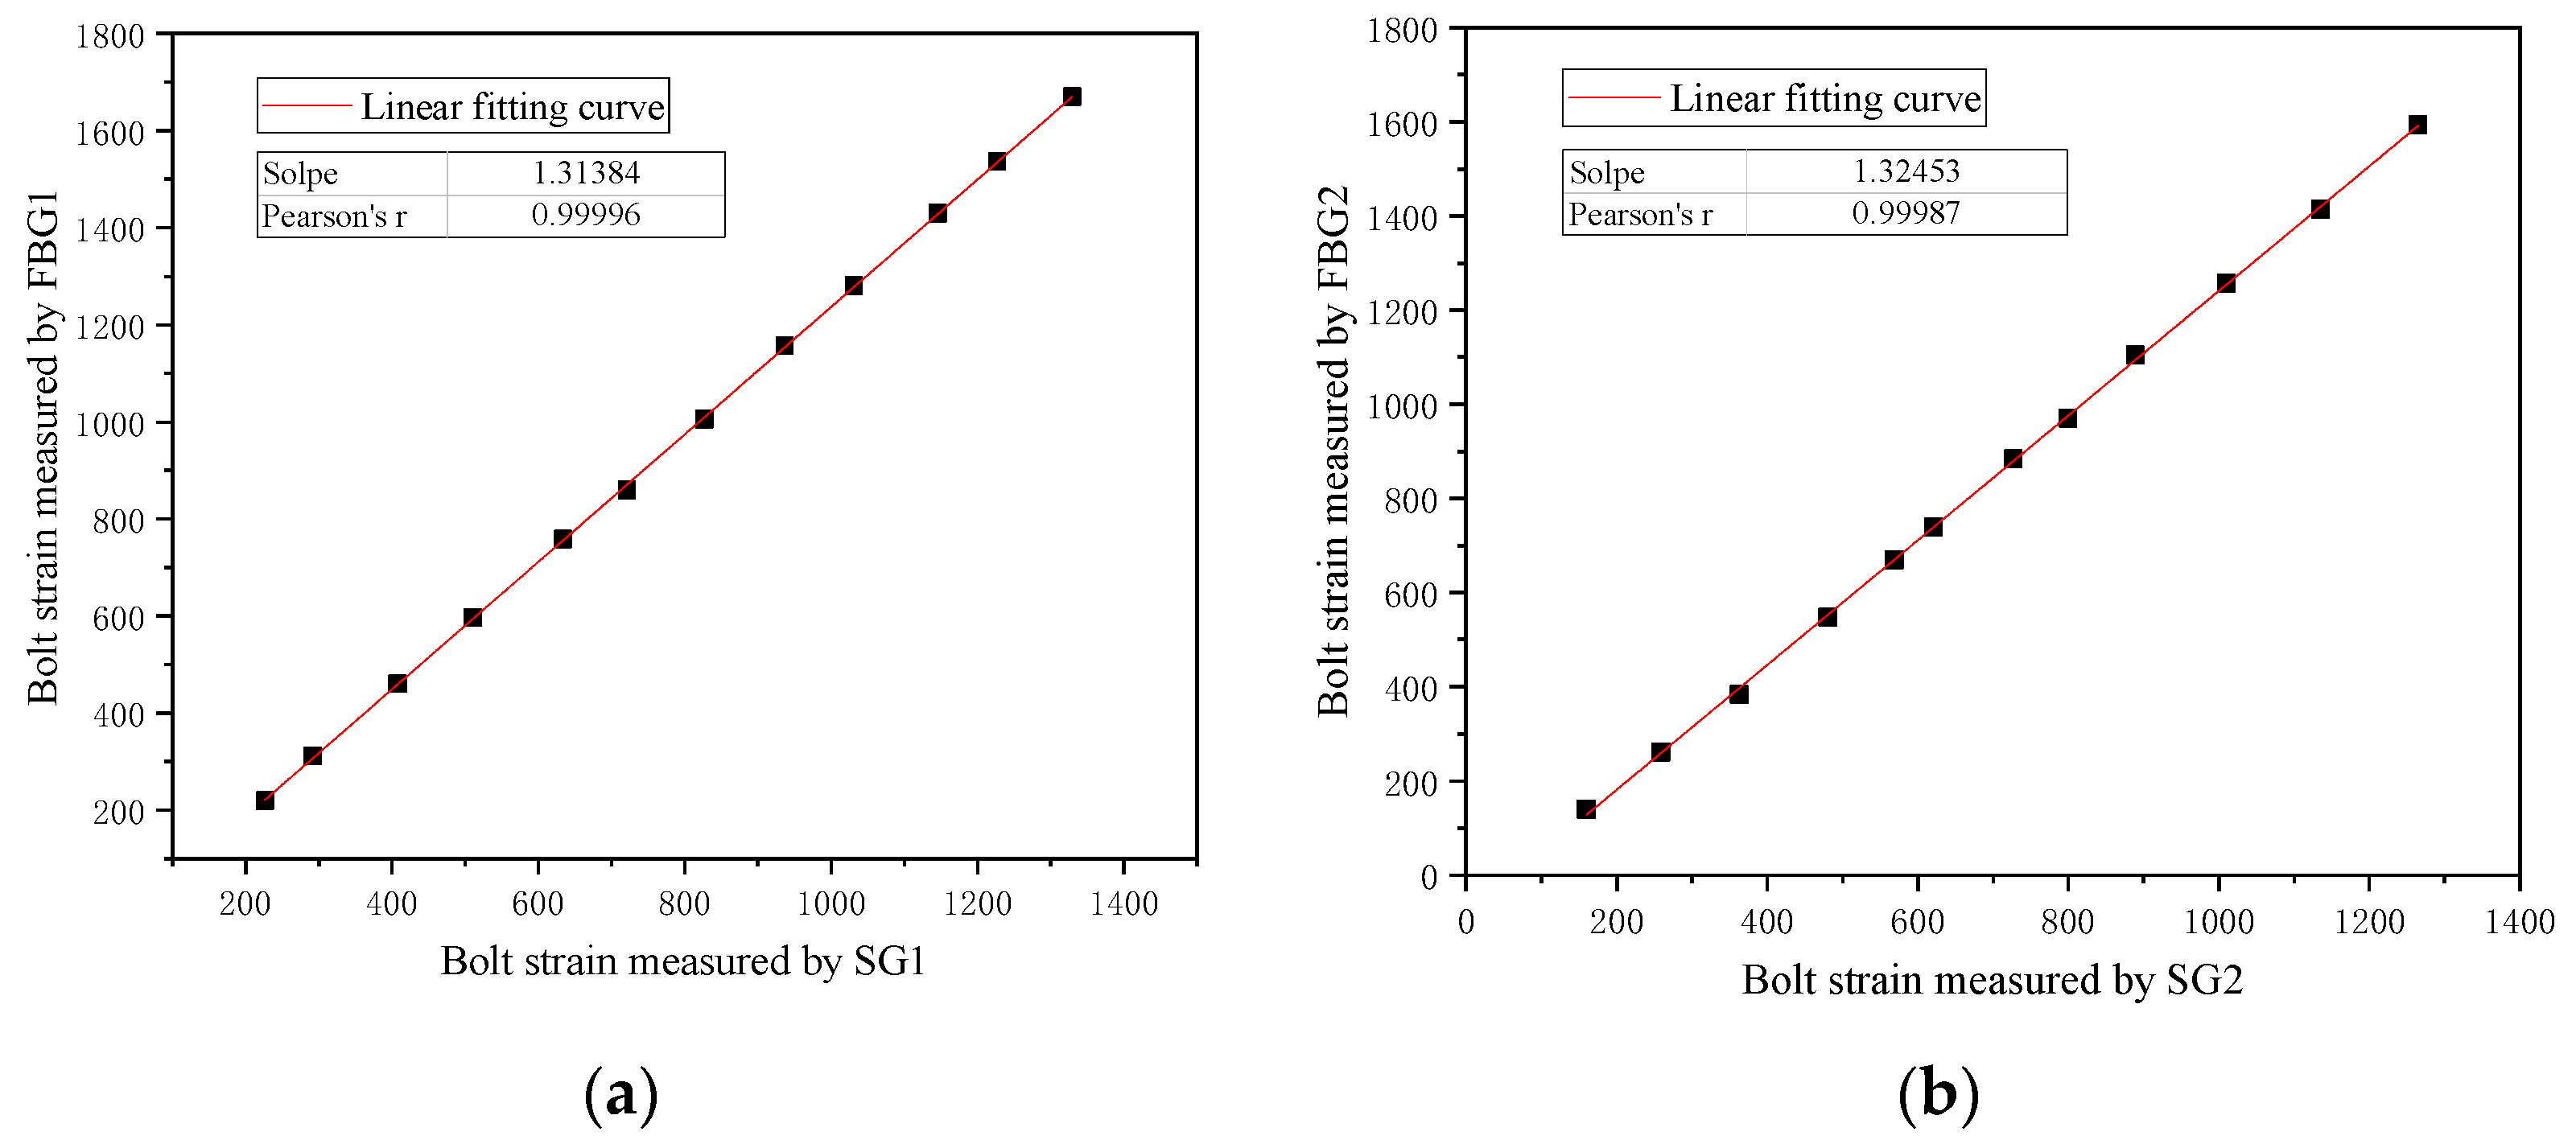
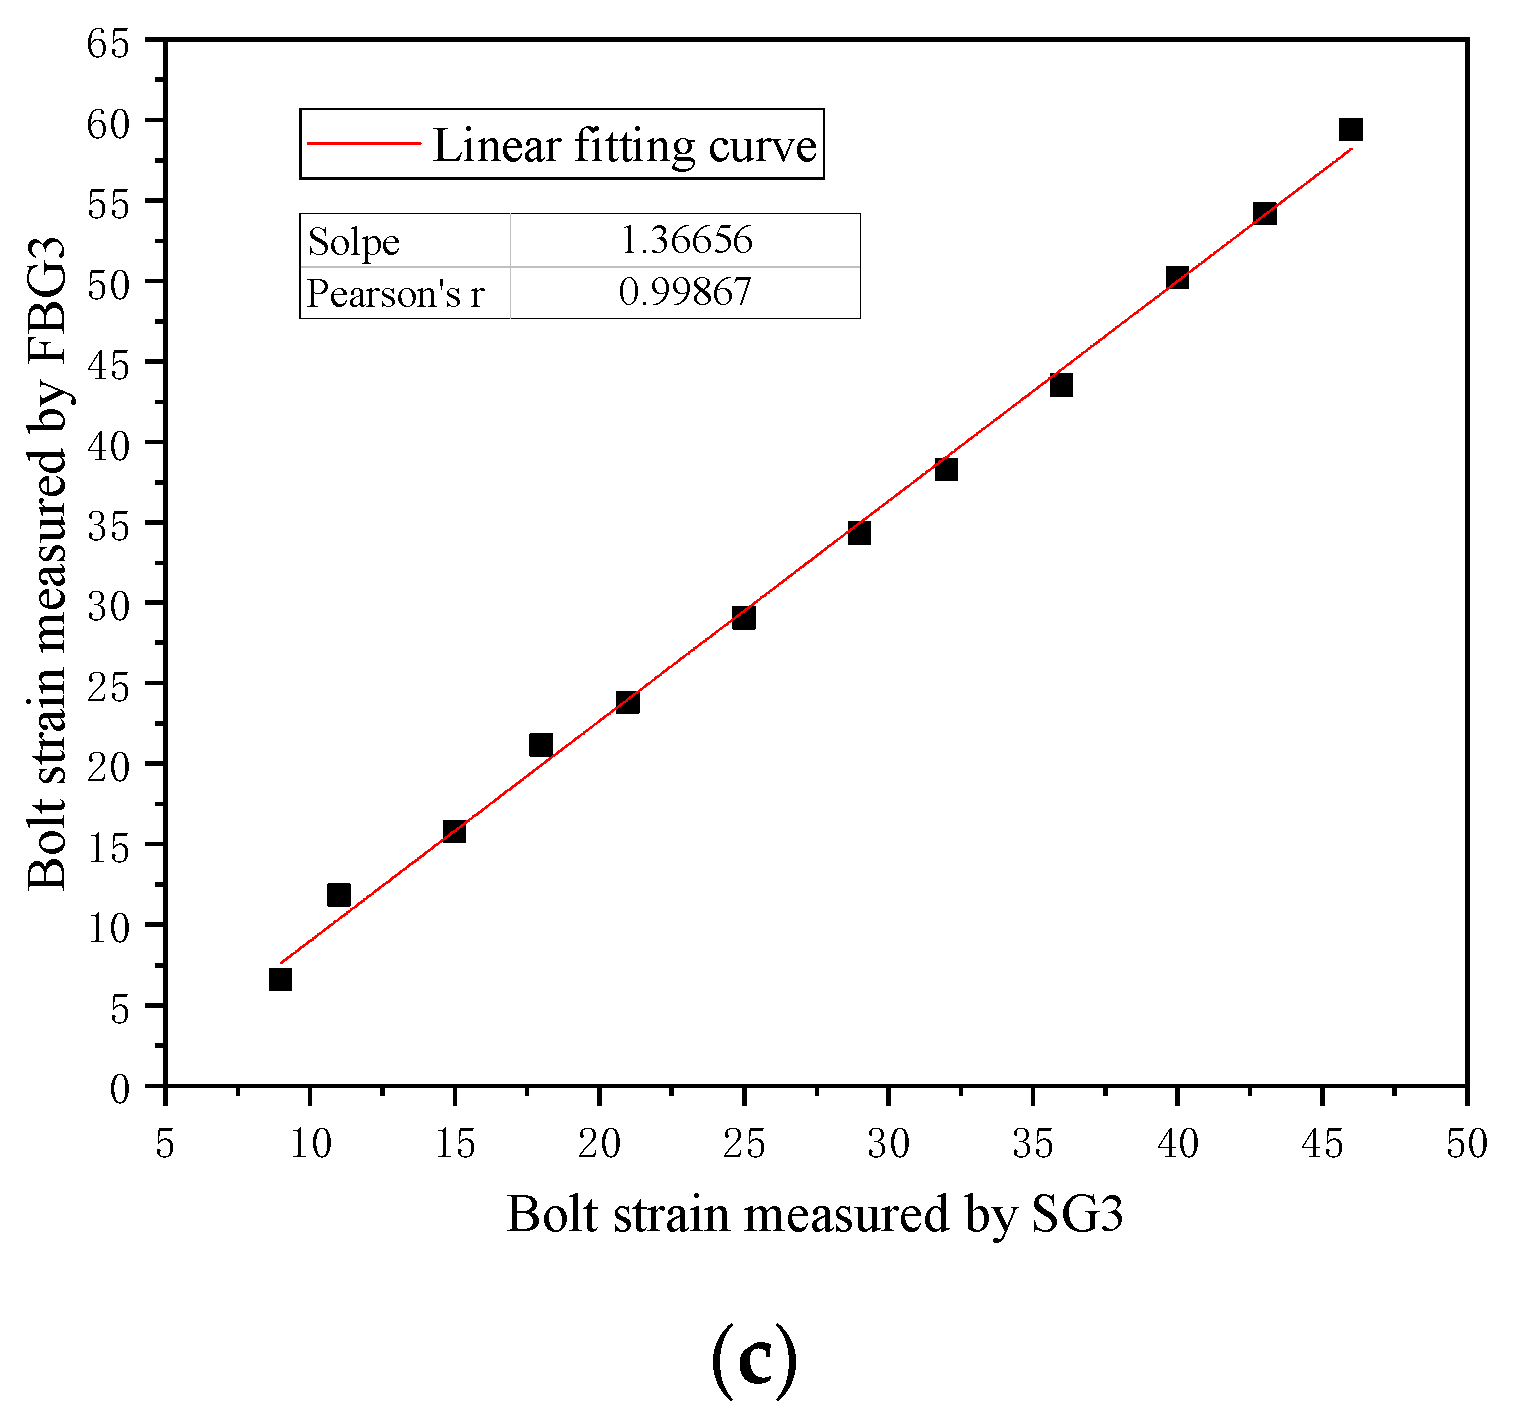
4.1. Calculation of Strain Transfer Coefficient between Bolt and FBG

The strain transfer coefficient (α) of the bare FBG attached to the bolt when the bare FBG was attached to the surface of the deformed steel bolt was calculated using Equation (25).
Epoxy resin adhesive was selected as the cemented layer for pasting the optical fiber, and the shear modulus of the adhesive provided by the supplier was 25 MPa. Table 1 shows the geometric/mechanical characteristics of the optical fiber and bolt used in the test. Substituting these constants into Equation (20) yielded a k value of about 202. Thereafter, by substituting this value into Equation (25), the strain transfer coefficient between the optical fiber and the bolt was found to be 1.32.

4.2. Analysis of FBG Monitoring Results of Bolt Interface Strain

Under different loads, the wavelength drift of each FBG measuring point of the bolt could be obtained by the FBG demodulator, and the strain measurement value of the FBG were calculated according to the strain sensitivity coefficient of the FBG sensor factory calibration. Combined with Equation (27), the strain value of the bolt was obtained. Taking the distance between the FBG and the end of the bolt as the abscissa and the strain change measured at each measuring point of the FBG as the ordinate, the strain curves at different positions of the bolt under different loads were obtained, as shown in Figure 7. It can be seen in the figure that the strain values on the bolt body at different positions were different, and the strain value from the anchor end of the bolt was the largest. The strain value gradually decreased as the distance from the anchor end increased.
The fitting curve of the bolt strain with the pull-out load was obtained with the axial load as the abscissa and the FBG strain monitoring value of the bolt as the ordinate, as shown in Figure 8. The fitting curve intuitively reflects the strain changes at the positions of FBG1, FBG2, and FBG3 of the bolt body under different loads. It can be seen that the bolt strain at different positions increased linearly with the increase in the load. However, the bolt strain at different positions increased with the load increase in different ranges, with a significant increase in the shallow part and a slight one in the deep part. On the other hand, when increasing the pull-out load by 1 kN, the average increases in the anchor rod strain at positions 50 mm, 400 mm, and 950 mm away from the anchor end were measured as 21.85 με, 20.84 με, and 0.78 με, respectively.
In order to verify the correctness of the bolt’s strain monitoring results by the FBG, its results were compared to the strain gauge at different positions, as shown in Figure 9. It can be seen that the strain values measured by the FBG sensor and strain gauge were consistent with the changing trends in the loading, which verifies that FBG can be applied to the strain value test of the anchor rod. The FBG sensor and strain gauge test values were the same at the initial loading stage. The test difference between the FBG sensor and strain gauge gradually increased with the continuous loading at the bolt end.
The corresponding relationships between the strain measurement values by FBG and SG are shown in Figure 10. It can be seen in Figure 10 that FBG and SG had a linear correlation with the measured values of the bolt strain. The average correlation coefficient was 0.9995, and the fitting slopes at the three measuring points were 1.31384, 1.32453, and 1.36656, respectively. The slope values were close and the average slope as 1.33497. If the SG strain value is taken as the benchmark, the relative error of the strain value of the bolt measured by FBG at any measuring point was 33.497%. This can be attributed to attaching the strain gauge with epoxy resin adhesive and not considering the cemented layer’s strain transfer effect in the middle of the strain gauge in the strain test process, resulting in the lower strain increments of the three strain gauges with loads compared to the strain increments of the FBG sensor, but the strain values are positively correlated.

4.3. Analysis of Axial Force Distribution of Bolt

The bolt used is made of ordinary carbon steel and its elastic modulus typically ranges between 180 GPa and 220 GPa. In this paper, the elastic modulus of the bolt is 180 GPa, and its diameter is 18 mm. By substituting the above mechanical parameters into Equation (27), the axial force distribution of the anchor rod under various loads was calculated, as shown in Figure 11. It can be seen that when the pull-out load was small, the axial force of the bolt was mainly concentrated near the bolt head with very minor-to-zero force at its end. This phenomenon can be attributed to the small pull-out force and the large adhesion and friction between the bolt and the slurry, causing a considerable decay in the axial force. On the other hand, increasing the pull-out load raised the distribution range of the anchor rod’s axial force. In addition, when the pull-out load was 70.56 kN, the axial force increased rapidly to reach the pull-out load value. At this time, the bolt gradually broke away and slipped due to the friction-binding force of the rock mass.
Fitting the FBG monitoring value of the bolt’s axial force, as in Figure 12, shows an exponential pattern. The axial force distribution function of the bolt obtained by fitting is
N x = A exp ( R x ) + P
where N′x is the axial force of the anchor bolt at the distance x from the anchor end, A and R are the fitting parameters related to the material’s mechanic parameters such as the elastic modulus and Poisson’s ratio of the bolt and rock mass, and P is a parameter related to the bolt reaction.
The parameters of the fitting function under different load conditions are shown in Table 2.

5. Conclusions

This paper proposes a bolt anchoring quality sensing method based on the FBG principle. Within the study context, the strain transmission mechanism between the surface-bonded FBG and the bolt was investigated, a surface-bonded FBG force-measuring bolt was designed, a full-length anchored bolt pull-out test was carried out, and the strain evolution law of the bolt and its axial force distribution characteristics were highlighted. The main conclusions are as follows:
(1)
The strain transmission mechanism of surface-bonded FBG was analyzed, the strain transmission relationship of FBG considering the transmission effect of the cemented layer was established, the strain transmission coefficient between the bolt and surface-bonded FBG was calculated, and the characterization model of the bolt axial force of FBG was derived. Indeed, the bolt pull-out test results verified that the characterization equation can be applied to understanding the bolt axial force evolution.
(2)
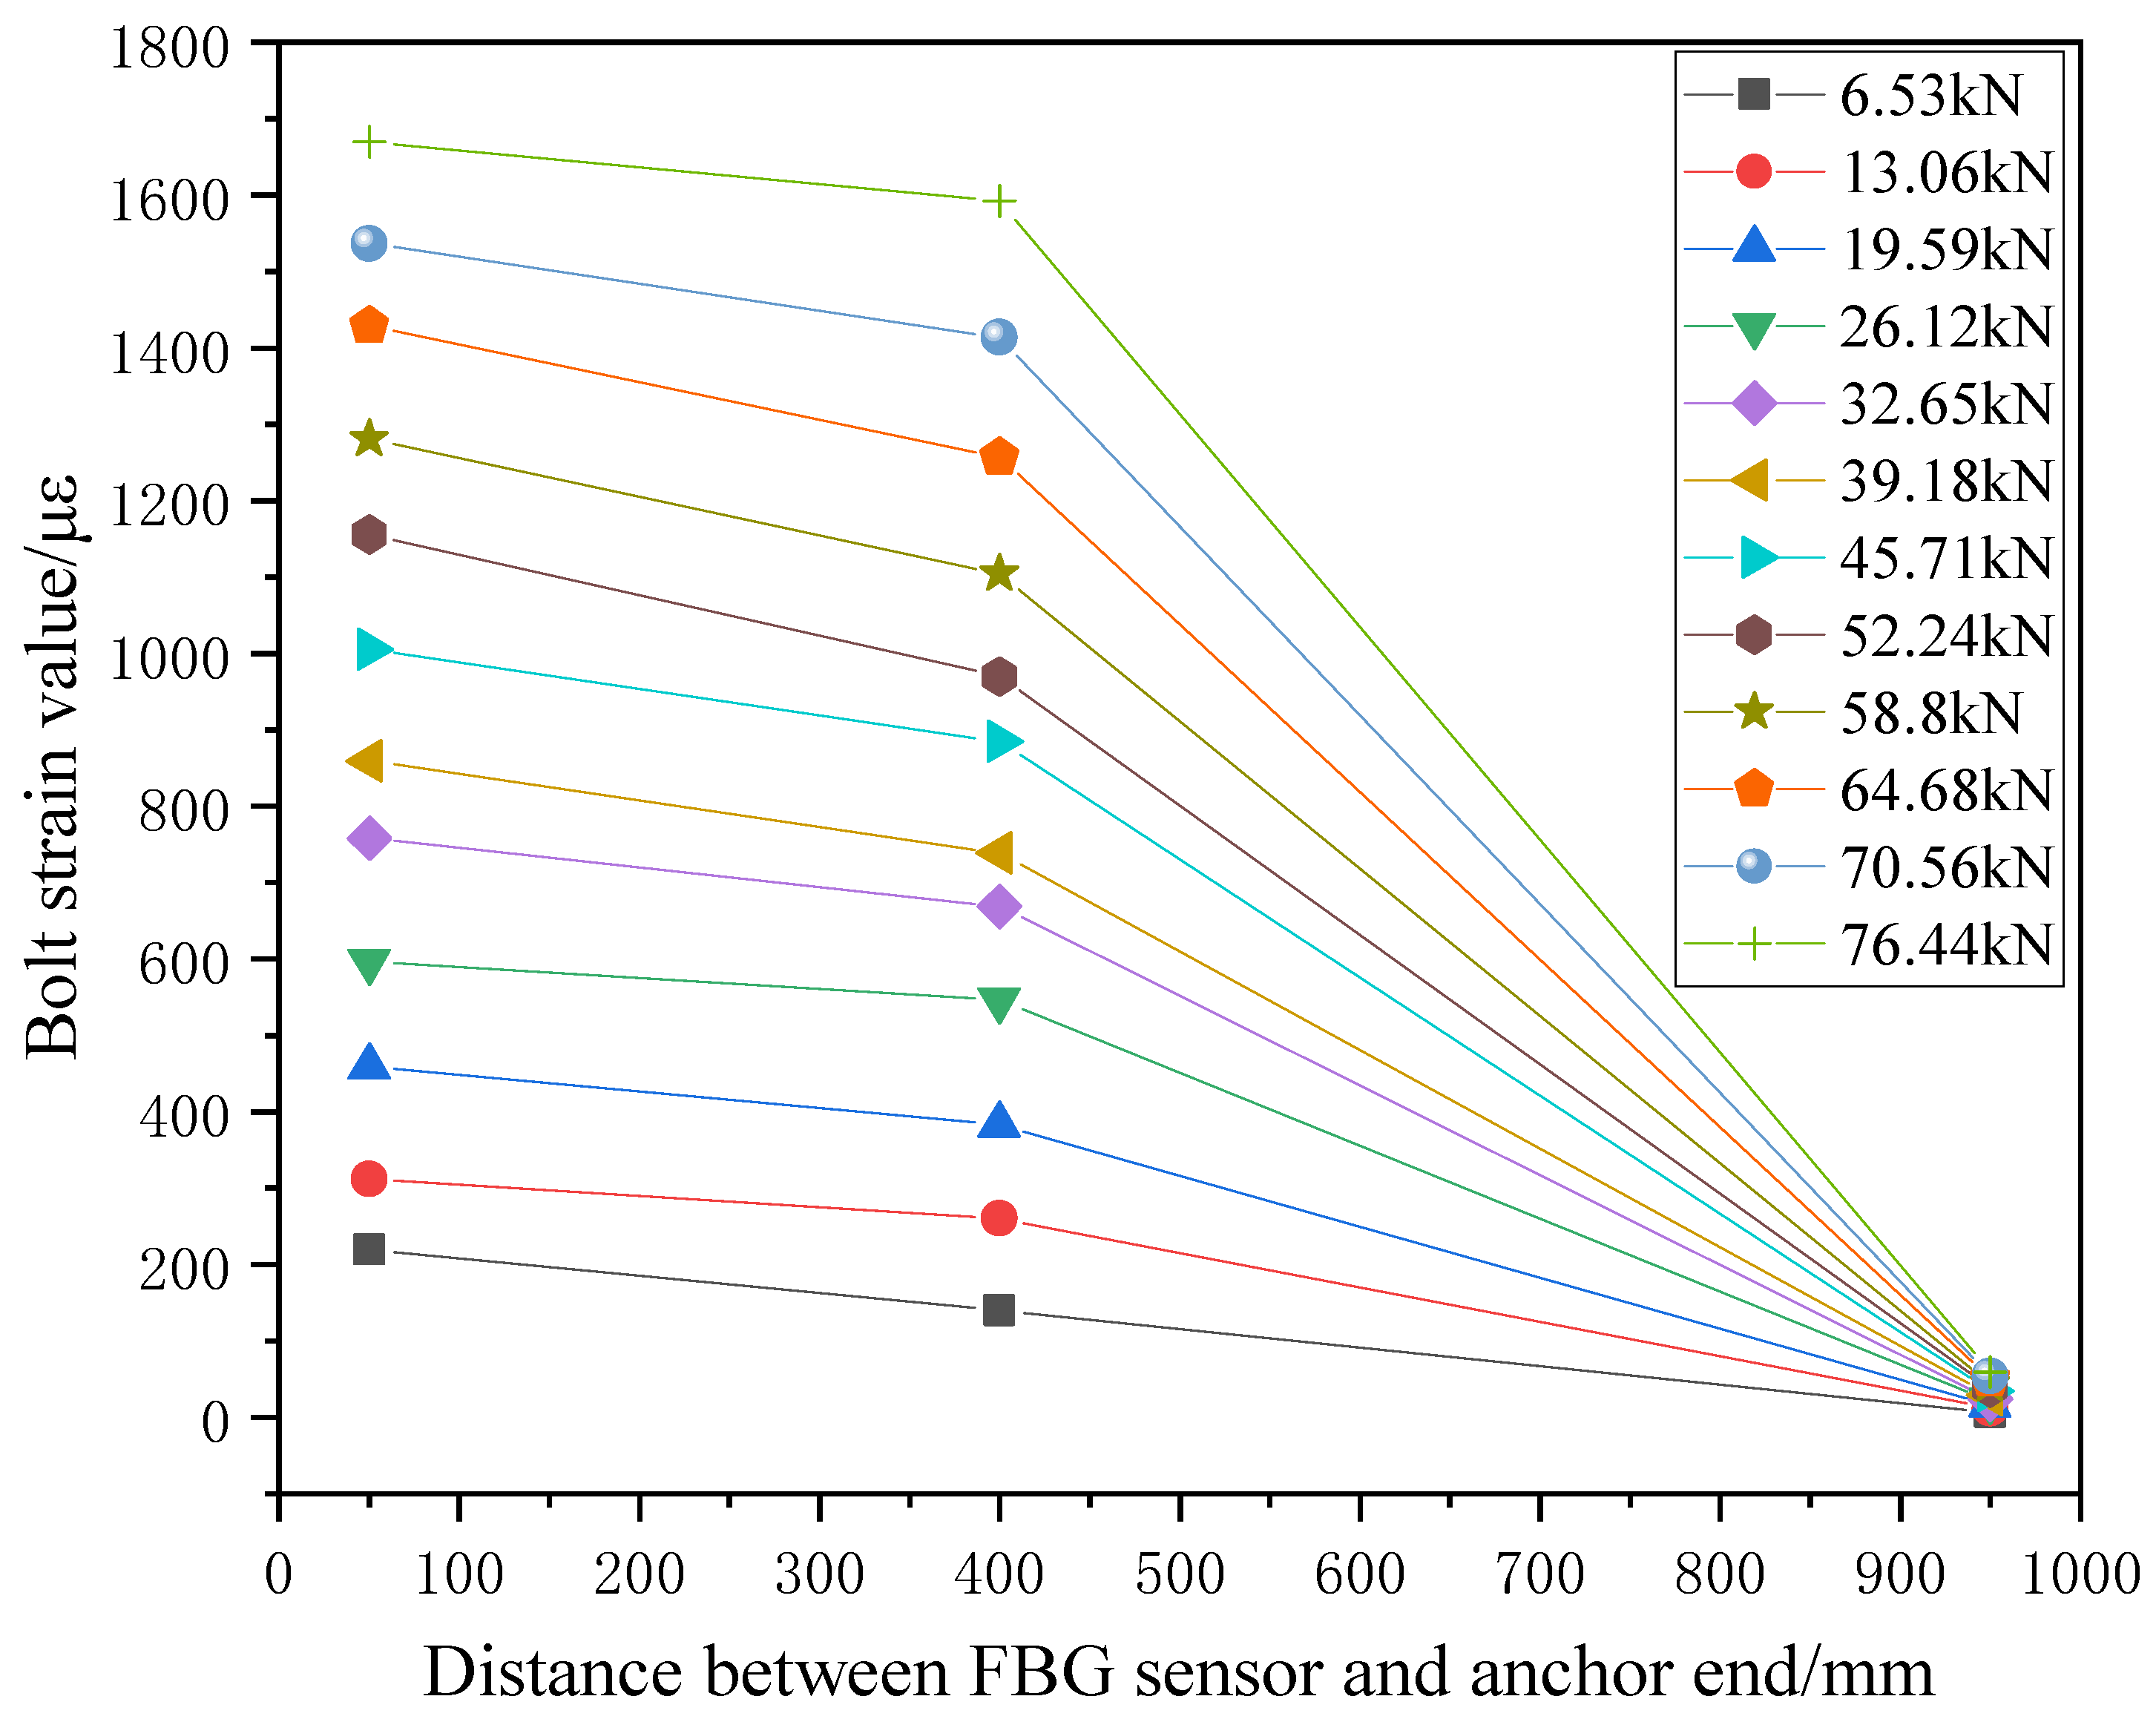
The strain values on the bolt body at different positions varied. The strain value at the bolt’s anchor end was the largest, and the strain value gradually decreased along the length. The strain at any position of the bolt increased linearly with the increase in the load.
(3)
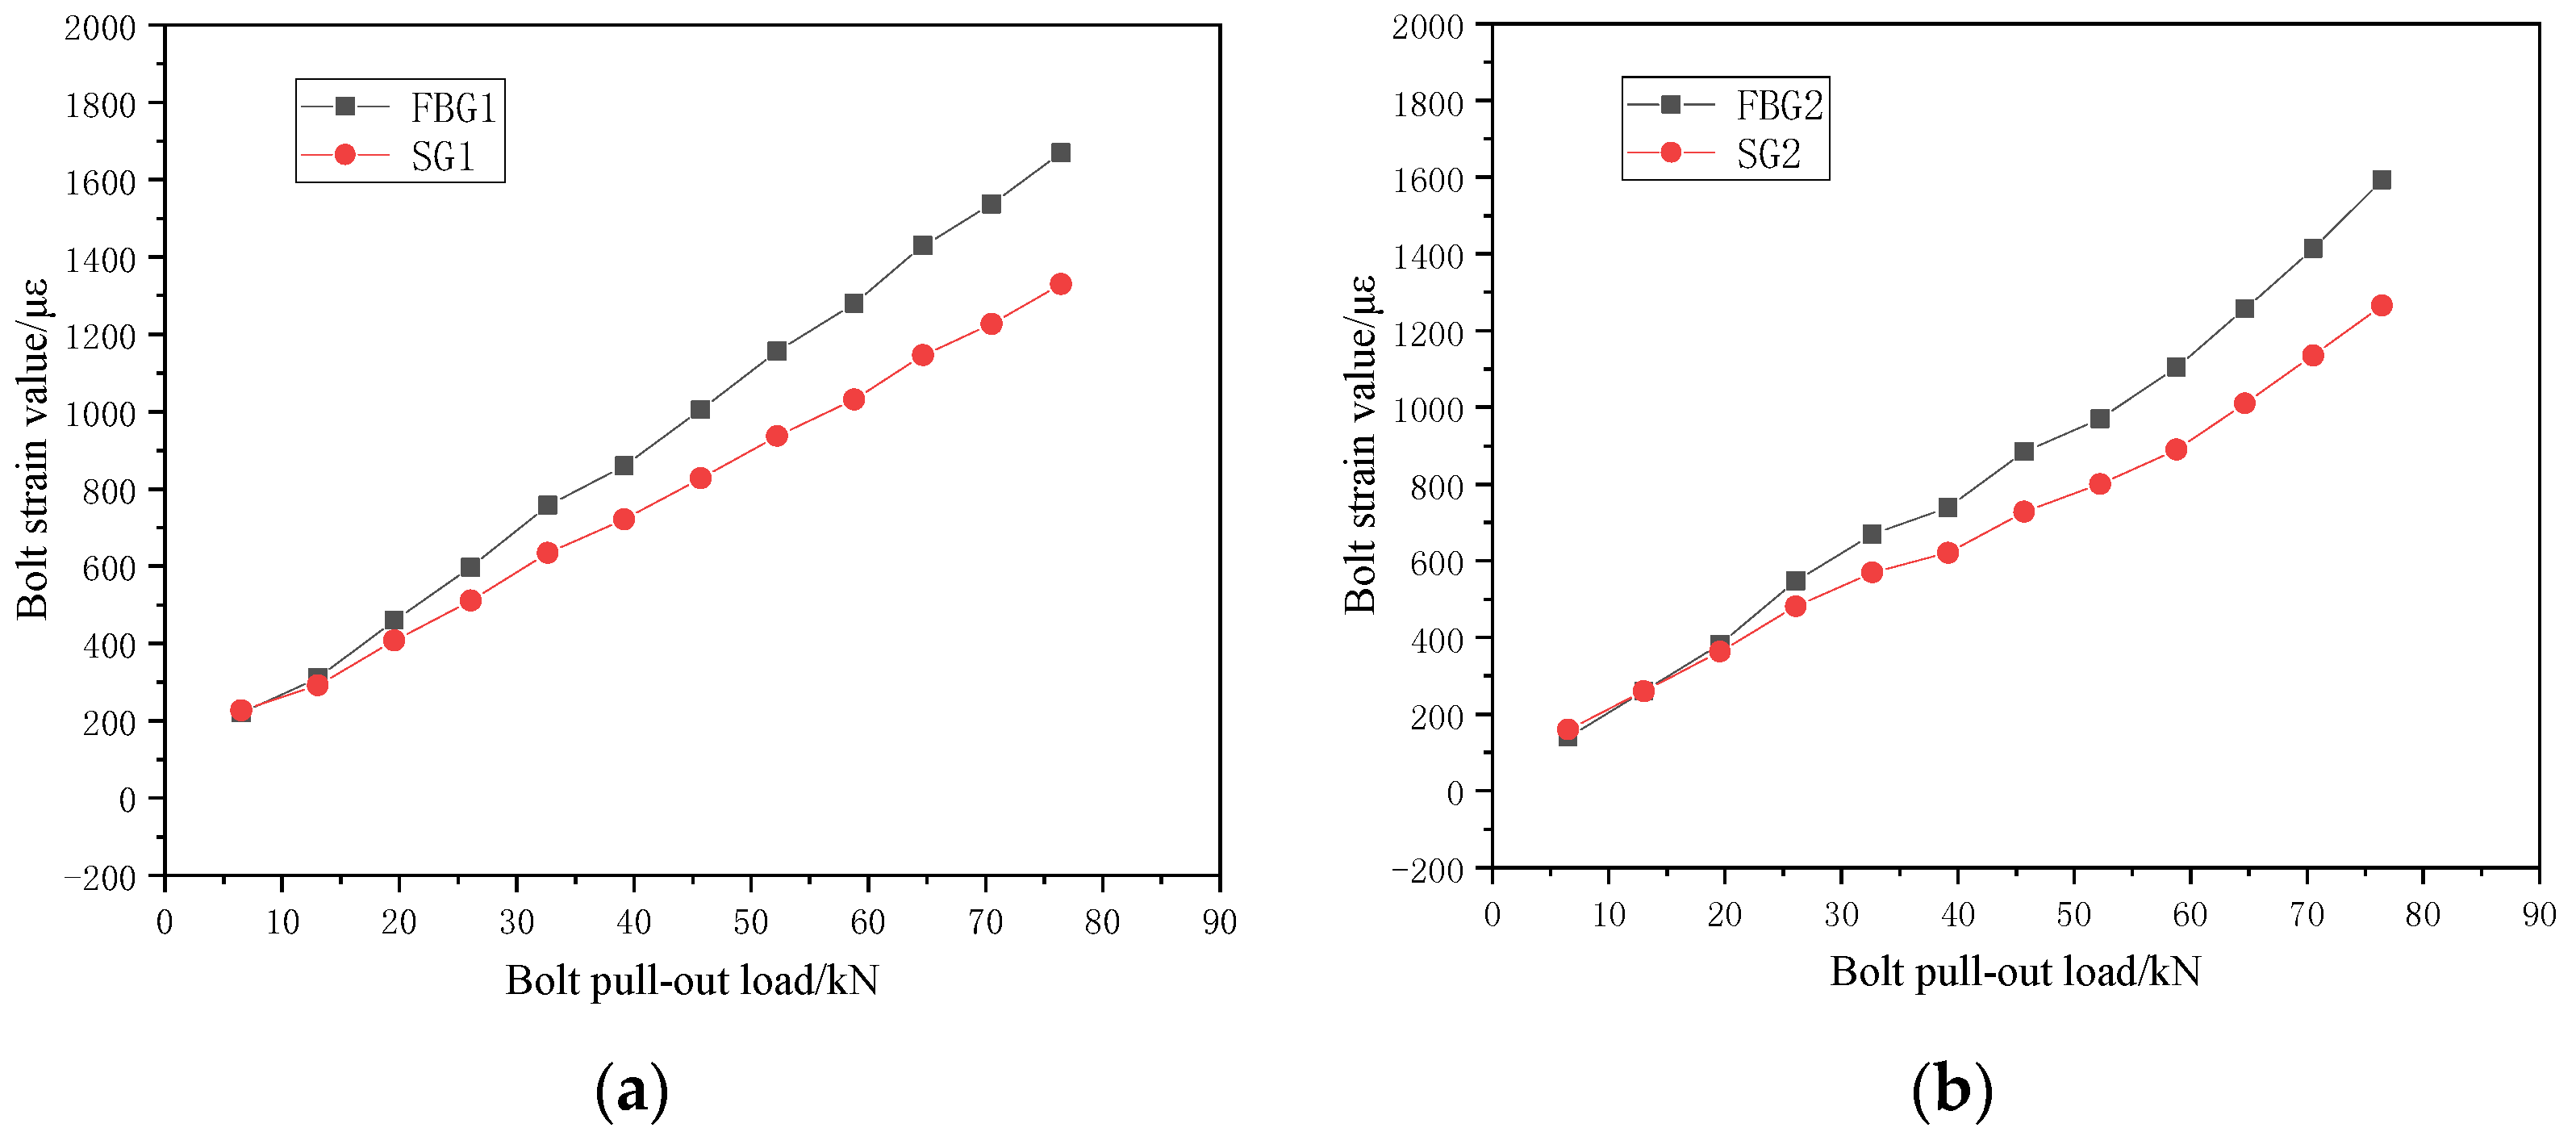
The strain values measured by the FBG sensor and strain gauge were consistent with the changing trend of the loading, which verified that the FBG can be applied to the bolt’s strain value measurement. The test value of FBG and strain gauge increased linearly in a non-positive proportion with the continuous loading at the end of the bolt, and the test difference gradually increased. It is necessary to consider the influence of the thickness and width of the cemented layer on the test results.
(4)
The bolt’s axial force gradually increased with the increase in the pull-out load. In addition, the axial force of the end bolt was the same as the pull-out force, the bolt gradually broke away from the friction-binding force of the rock mass, and the bolt tended to a slip failure when the load increased to a certain value. Based on the fitting of the FBG monitoring value of the bolt axial force, the bolt axial force under any load conditions follows an exponential pattern.
(5)
Optical fiber sensing technology provides high-precision strain sensing ability, which can realize the sensing of the microstrain and axial force of the bolt. Furthermore, considering that light as a fiber transmission signal is safer than electrical signal transmissions in coal mining, it has become a technology with great application potential in mining engineering. The test results of this paper have a significant engineering application value for the evaluation of the surrounding rock stability.

Author Contributions

Conceptualization, G.G. and D.Z.; methodology, D.Z. and J.C.; software, Y.D.; validation, G.Z. and Y.D.; formal analysis, G.G.; investigation, D.Z. and Y.D.; resources, G.G.; data curation, Y.D.; writing—original draft preparation, D.Z.; writing—review and editing, G.G.; visualization, Y.D.; supervision, J.C.; project administration, D.Z.; funding acquisition, D.Z. All authors have read and agreed to the published version of the manuscript.

Funding

This research was funded by the Key Program of the National Natural Science Foundation of China (No. 51804244, 41027002 and 52004203) and the Scientific Research Project of Shaanxi Provincial Department of Education (16JK1488).

Institutional Review Board Statement

Not applicable.

Informed Consent Statement

Not applicable.

Data Availability Statement

Not applicable.

Acknowledgments

Many thanks go to J. Chai for the guidance in this paper. We would also like to thank Yang and Du for their valuable comments and suggestions for improving the manuscript.

Conflicts of Interest

The authors declare no conflict of interest.

References

  1. Wang, P.; Zhang, N.; Kan, J.; Xie, Z.; Wei, Q.; Yao, W. Fiber Bragg Grating Monitoring of Full-bolt Axial Force of the Bolt in the Deep Strong Mining Roadway. Sensors 2020, 20, 4242. [Google Scholar] [CrossRef] [PubMed]
  2. Smith, J.A.; Ramandi, H.L.; Zhang, C.; Timms, W. Analysis of the influence of groundwater and the stress regime on bolt behaviour in underground coal mines. Int. J. Coal Sci. Technol. 2019, 6, 286–300. [Google Scholar] [CrossRef]
  3. Cruz, D.; Vlachopoulos, N. The geo-mechanical response of axially loaded rock bolts using fiber optic technology. In Proceedings of the XV Colombian Geotechnical Congress & the 2nd International Specialized Conference of Soft Rocks, Cartagena, Colombia, 6–7 October 2016; International Society of Rock Mechanics: Lisbon, Portugal, 2016. [Google Scholar]
  4. Zuo, J.; Wang, J.; Jiang, Y. Macro/meso failure behavior of surrounding rock in deep roadway and its control technology. Int. J. Coal Sci. Technol. 2019, 6, 301–319. [Google Scholar] [CrossRef]
  5. Kang, H.P. Support technologies for deep and complex roadways in underground coal mines: A review. Int. J. Coal Sci. Technol. 2014, 1, 261–277. [Google Scholar] [CrossRef]
  6. Guo, X.; Wang, B.; Ma, Z.; Wang, Z. Testing Mechanical Properties of Rock Bolt under Different Supports Using Fiber Bragg Grating Technology. Sensors 2019, 19, 4098. [Google Scholar] [CrossRef]
  7. Dongping, D.; Liang, L.; Liansheng, G. Experimental study on stress wave method for detecting anchorage quality of anchor cable. J. Cent. South Univ. 2016, 47, 2768–2775. [Google Scholar]
  8. Zhang, Y.; An, L.; Yu, G. Numerical Simulation and infrared radiation detection experiment for acting area of bolt supporting. Jouranl China Univ. Min. Technol. 2006, 35, 545–548. [Google Scholar]
  9. Nicholson, L. Analysis and Interpretation of in Situ Rock Bolt Pull Tests in Hard Rock Mines. Master’s Thesis, University of Toronto, Toronto, ON, Canada, 2016. [Google Scholar]
  10. Deng, L.; Zhang, C.; Zhou, L.; Cui, G.; Lyu, H.; Tang, Y.; Zhou, H. Experimental study on shear mechanical properties of bolt-resin interfaces under constant normal stiffness. Chin. J. Rock Mech. Eng. 2020, 39, 2254–2263. [Google Scholar]
  11. Hill, K.O.; Fujii, Y.; Johnson, D.C.; Kawasaki, B.S. Photosensitivity in optical fiber wave guide: Application to reflection fiber fabrication. Appl. Phys. Lett. 1978, 32, 647–649. [Google Scholar] [CrossRef]
  12. Prohaska, J.D.; Snitze, E.; Chen, B.; Maher, M.; Nawy, E.G.; Morey, W.W. Fiber optic Bragg grating strain sensor in large scale concrete structures. In Proceedings of the Fiber Optic Smart Structures and Skins V, Boston, MA, USA, 8–11 September 1992; SPIE: Bellingham, DC, USA, 1992; Volume 1798, pp. 286–294. [Google Scholar]
  13. Zhang, D.D.; Ma, C.Y.; Duan, Y.Y.; Du, W.G.; Liu, J.X. Wavelength Characteristic Analysis of a FBG Array Embedded in Quaternary Unconsolidated Strata during a Deep Borehole Installation. J. Sens. 2021, 2021, 1207374. [Google Scholar] [CrossRef]
  14. Zhang, D.D.; Chen, Q.; Wang, Z.S.; Yang, J.F.; Chai, J. Optical fiber frequency shift characterization of overburden deformation in short-distance coal seam mining. Geofluids 2021, 2021, 1751256. [Google Scholar] [CrossRef]
  15. Forbes, B.; Vlachopoulos, N.; Mark, S. Diederichs and Jonathan Aubertin. Augmenting the in-situ rock bolt pull test with distributed optical fiber strain sensing. Int. J. Rock Mech. Min. Sci. 2020, 126, 1–12. [Google Scholar] [CrossRef]
  16. Cox, H.L. The elasticity and strength of paper and other fiber materials. Br. J. Appl. Phys. 1952, 3, 72–79. [Google Scholar] [CrossRef]
  17. Nanni, A.; Yang, C.C.; Pan, K.; Wang, J.S.; Michael, R.R. Fiber-optic Sensor for Concrete strain/stress measurement. ACI Mater. J. 1991, 88, 257–264. [Google Scholar]
  18. Farhad, A.; Yuan, L. Mechanics of bond and interface shear transfer in optical fiber sensors. J. Eng. Mech. 1998, 124, 385–394. [Google Scholar]
  19. Lau, K.-T.; Yuan, L.; Zhou, L.-M.; Wu, J.; Woo, C.-H. Strain monitoring in FRP laminates and concreste beams using FBG sensors. Compos. Struct. 2001, 51, 9–20. [Google Scholar] [CrossRef]
  20. Li, D.; Li, H. Strain transferring analysis of embedded fiber bragg grating sensors. Chin. J. Theor. Appl. Mech. 2005, 37, 436–441. [Google Scholar]
  21. Zhang, D.D.; Chai, J.; Li, Y.; Sun, Y.Y. Strain Transfer Function of Embedded Fiber Bragg Grating Sensors for Unconsolidated Layer Settlement Deformation Detector and its Application. Chin. J. Rock Mech. Eng. 2015, 34, 3289–3297. [Google Scholar]
  22. Li, W.; Zhang, M.; Bai, X.; Kou, H. Experimental Research on Anchorage Performance of GFRP and Steel Anti-floating Anchors. Chin. J. Undergr. Space Eng. 2015, 11, 108–114. [Google Scholar]
  23. Liang, M.; Fang, X.; Chen, N.; Ma, M.; Li, X. Strain sensing mechanism of surface bonded fiber Bragg grating bolt and its application. J. China Univ. Min. Technol. 2018, 47, 1243–1251. [Google Scholar]
  24. Li, G.; Dai, J.; Jian, N.; Ni, C.; Yin, J.; Yu, L. Bond behavior between concrete frame beam and large-diameter glass fiber reinforced polymer anchor rod with built-in fiber Bragg grating sensor. Chin. J. Rock Mech. Eng. 2013, 7, 1449–1457. [Google Scholar]
  25. Vlachopoulos, N.; Cruz, D.; Forbes, B. Utilizing a novel fiber optic technology to capture the axial responses of fully grouted rock bolts. J. Rock Mech. Geotech. Eng. 2018, 10, 222–235. [Google Scholar] [CrossRef]
  26. Thenevin, I.; Blanco-Martín, L.; Hadj-Hassen, F.; Schleifer, J.; Lubosik, Z.; Wrana, A. Laboratory pull-out tests on fully grouted rock bolts and cable bolts: Results and lessons learned. J. Rock Mech. Geotech. Eng. 2017, 9, 843–855. [Google Scholar] [CrossRef]
  27. Hyett, A.J.; Bawden, W.F.; Reichert, R.D. The effect of rock mass confinement on the bond strength of fully grouted cable bolts. Int. J. Rock Mech. Min. Sci. Geomech. Abstr. 1992, 29, 503–524. [Google Scholar] [CrossRef]
  28. Chapeleau, X.; Bassil, A. A General Solution to Determine Strain Profile in the Core of Distributed Fiber Optic Sensors under Any Arbitrary Strain Fields. Sensors 2021, 21, 5423. [Google Scholar] [CrossRef] [PubMed]
  29. Forbes, B.; Vlachopoulos, N.; Hyett, A.J.; Diederichs, M.S. A new optical sensing technique for monitoring shear of rock bolts. Tunn. Undergr. Space Technol. 2017, 66, 34–46. [Google Scholar] [CrossRef]
  30. Oktavianus, Y.; Chang, H.; Goldsworthy, H.M.; Gad, E.F. Component model for pull-out behavior of headed anchored blind bolt within concrete filled circular hollow section. Eng. Struct. 2017, 148, 210–224. [Google Scholar] [CrossRef]
Figure 1. Schematic diagram of bare fiber grating sticking on the substrate surface.
Energies 15 06384 g001
Figure 2. Side view of bare fiber grating adhered to the substrate surface.
Energies 15 06384 g002
Figure 3. Strain transfer relationship between different media.
Energies 15 06384 g003
Figure 4. Encapsulated FBG force-measuring bolt picture (a); FBG dynamometer picture (b).
Energies 15 06384 g004
Figure 5. FBGforce-measuring bolt.
Energies 15 06384 g005
Figure 6. Bolt pull-out test setup. (a) Schematic diagram of the test setup; (b) Physical drawing of the test setup.
Energies 15 06384 g006aEnergies 15 06384 g006b
Figure 7. Strain values at different positions of bolt body under different loads.
Energies 15 06384 g007
Figure 8. Variation curve of bolt strain with pull-out load.
Energies 15 06384 g008
Figure 9. Comparison of test results between FBG sensor and SG for (a) FBG1, (b) FBG2, and (c) FBG3.
Energies 15 06384 g009aEnergies 15 06384 g009b
Figure 10. Corresponding relationship between strain measurement values by FBG and SG for (a) FBG1, (b) FBG2, and (c) FBG3.
Energies 15 06384 g010aEnergies 15 06384 g010b
Figure 11. Axial force distribution of bolt under different pull-out loads.
Energies 15 06384 g011
Figure 12. Axial force-fitting curve of bolt at loading force of (a) 19.59 kN, (b) 45.71 kN, (c) 58.8 kN, and (d) 76.44 kN.
Energies 15 06384 g012
Table 1. Strain transfer constants of optical fiber layer, cemented layer, and bolt matrix.
ParameterNumerical ValueParameterNumerical Value
Elastic modulus of optical fiber Eg7.2 × 104 MPaFiber shear modulus Gn25 MPa
Fiber core radius rg62.5 μmCoating length of cemented layer 2L40 mm
Coating width of cemented layer b5 mmShear modulus of bolt matrix Gm6.8 × 104 MPa
Coating thickness of cemented layer1 mmStrain transfer coefficient α1.32
Table 2. Fitting parameters of bolt axial force under different load conditions.
Load/kNParameter AParameter RParameter P
6.53−1.384030.0025315.8301
13.06−2.157010.0024823.4722
19.59−0.49020.0042227.91978
26.12−1.378550.0034136.32265
32.65−2.496280.0029442.23259
39.18−1.996450.0033248.40325
45.71−4.919510.0025758.53292
52.24−3.560050.0029962.75264
58.8−2.831220.0033268.78824
64.68−1.122990.0043471.73917
70.56−0.349110.0056476.91032
76.44−1.384030.0025315.8301
Publisher’s Note: MDPI stays neutral with regard to jurisdictional claims in published maps and institutional affiliations.

