Article

A Novel Hardware-in-the-Loop Approach to Investigate the Impact of Low System Inertia on RoCoF Relay Settings

1
Department of Electronic and Electrical Engineering, Brunel University London, Uxbridge UB8 3PH, UK
2
National Grid Electricity System Operator, St. Catherine’s Lodge, Wokingham RG41 5BN, UK
*
Author to whom correspondence should be addressed.
Energies 2022, 15(17), 6386; https://doi.org/10.3390/en15176386
Submission received: 1 July 2022 / Revised: 9 August 2022 / Accepted: 16 August 2022 / Published: 1 September 2022
(This article belongs to the Section F1: Electrical Power System)

Abstract

:
This paper presents a novel hardware-in-the-loop (HIL) approach as used to investigate the impact of the reduction in inertia on the Great Britain (GB) electrical power system with regard to rate of change of frequency (RoCoF) settings for Loss-of-Mains (LoM) protection. Furthermore, the research as presented in this paper updates, enhances, and validates a reduced model of the Great Britain transmission system, as originally developed in DIgSILENT PowerFactory by the National Grid Electricity System Operator. The enhanced model has been developed for integrated use with the OPAL-RT real-time HIL simulation toolkit and is validated against phasor measurement unit (PMU) data from actual disturbance events using novel automated interfacing between both integrated simulation platforms, PowerFactory from DIgSILENT and ePHASORSIM from OPAL-RT. The corresponding simulations show that the updated reduced model is capable of capturing the dynamic behaviour of the GB transmission system, including both local and inter-area oscillations, with satisfactory accuracy. Finally, the paper presents HIL study results with the reduced model to investigate the influence of decreasing system inertia on the response of LoM protection relays. The studies show that decreasing system inertia may have a significant impact on LoM relays using RoCoF detection, particularly relays using the legacy G59 setting of 0.125 Hz/s. Initial studies have also demonstrated the potential for a previously unrecognised interaction between system oscillations and the 500 ms operating delay, as specified in G59 and G99 Engineering Recommendations. Consequently, faster local oscillations (>1 Hz) reset the relay and decrease the sensitivity, whereas slower inter-area oscillations (<1 Hz) appear to cause the relay to overestimate the average RoCoF.

1. Introduction

1.1. Decreasing Inertia in the Great Britain Electrical Power System

The large-scale integration of renewable energy technologies and related high-voltage direct current (HVDC) interconnectors has led to a significant decrease in dynamic inertia in electrical power systems [1]. Such technologies have been displacing traditional generation such as coal, oil, and gas for the power system in Great Britain (GB), and this trend is expected to continue in the coming years in order to meet environmental targets and legislation. The use of electronic power converters for renewable generation means that these sources, unlike traditional synchronous generators, do not offer any inertia to the power system. Most major power systems around the world, such as those in continental Europe or the USA, are interconnected across large synchronous areas, which can cause greater system inertia and stability [2]. However, smaller synchronised areas such as the electrical power system in Great Britain are now facing operational challenges due to decreasing system inertia [3]. As a consequence, the inertia and fault levels on the GB system have decreased, and this is further compounded by changes in the inertia of demand. Overall, the total inertia of the GB transmission system has fallen significantly over the past 20 years [3,4] and this fall is predicted to continue, as shown in Figure 1 and Figure 2. Such different operating conditions will have a significant influence on system stability, and especially on related Loss-of-Mains (LoM) relay tripping configuration [4,5].
It is important to highlight that the inertia of the power system plays a key role in stabilising the grid during power imbalances, because conventional sources of primary frequency response cannot instantly respond to large disturbances, but instead react with a delay of several seconds. The decrease in system inertia therefore results in a faster initial system reaction to a disturbance than before, such that the same disturbance in future systems with lower inertia will have a greater impact. As a result, disturbances in power systems such as HVDC interconnectors or generator tripping can lead to larger and faster frequency fluctuations across wider geographical areas with higher rate of change of frequency (RoCoF) values. If unmitigated, these fluctuations can exhibit similar behaviour to that which is present during system islanding, and therefore may lead to the mal-operation of LoM protection relays [4], possibly causing a cascading disconnection of renewables in the system. Notably, mal-operation in this context refers to operation when islanding has not occurred. As an example, during the incident on 9 August 2019 involving the near-simultaneous trip of two generators on the GB power system, approximately 350 MW of embedded generation tripped due to RoCoF LoM protection and 150 MW due to vector shift (VS) LoM protection [6]. Two transmission-level generation trips exceeded the secured level of infeed loss; however, this unwanted additional power loss of 500 MW caused by the LoM mal-operation increased the severity of the original incident. Approximately one million customers were disconnected from the grid by low-frequency demand disconnection (LFDD) relays [6].

1.2. Approaches to Minimize the Risk of Loss of Mains Relay Mal-Operation

In order to manage this risk for secured system events, the GB system operator National Grid Electricity System Operator (NGESO) takes a range of measures including managing the size of the largest import/export loss and the minimum system inertia. These measures cost GBP 174 million in the year to March 2022 [7]. In addition to these operational measures, there are industry-wide initiatives to make LoM protection relays less sensitive. During 2018, the Energy Networks Association (ENA) in the United Kingdom proposed updates to Engineering Recommendation G59 for LoM settings [8]. A new standard G99 was introduced for LoM relay settings for new generator installations above 50 MW [9]. G99 amended the RoCoF threshold from 0.125 Hz/s to 1 Hz/s and prohibited the use of vector shift (VS) protection. In addition to this, an ENA programme to update existing LoM relays to the new standard is under way and is due to be completed by August 2022 [10], but it does not cover legacy small-scale installations which may continue to present a risk of tripping. A range of novel techniques has been proposed in order to improve LoM protection algorithms [5] and related inertia estimations [11,12,13]. In addition, further novel approaches have been developed to compensate for system inertia reduction, such as synthetic inertia [14,15,16], virtual synchronous machines (VSMs) [17], and grid-forming convertors (GFCs) [18], but these new concepts have not as yet been widely deployed with regard to power system operational procedures. To promote development in this area, in January 2020, NGESO agreed contracts with five parties, worth GBP 328 million over a six-year period, to provide 12.5 GVA seconds of inertia [19].

1.3. Observations and Investigation of Frequency Phenomena in the GB Transmission System

Frequency phenomena on the GB transmission system can be studied by analysing phasor measurement unit (PMU) data from recorded disturbance events [3,20]. PMUs are installed across the GB system in key locations [11], and future plans are in place to install PMUs at every grid supply point (GSP) [21]. However, the limited number of relevant disturbance events that occur at present gives rise to the need to investigate a wider range of potential events including future energy scenarios [22], especially with regard to decreasing system inertia and related fault levels. This leads to the need for further research into frequency phenomena within an integrated real-time simulation environment. In this regard, the available models of the GB transmission system first need to be validated against recorded disturbance events. NGESO has developed two models of the GB transmission system as implemented in DIgSILENT PowerFactory: (1) a full system model and (2) a reduced model [20,23]. These models were originally built for offline transmission analysis studies, such as load flows, stability assessment, etc., rather than the analysis of frequency phenomena. Therefore, comparisons and validations against recorded phasor measurement unit (PMU) data from known events have also been performed [24]. Furthermore, through the development and implementation of a novel integrated modelling approach, it is possible to perform real-time simulations; therefore, the GB transmission system models can be used to test the reaction of widely deployed LoM relays via hardware-in-the-loop (HIL) studies. However, because PowerFactory does not support real-time simulation, an OPAL-RT real-time simulator has been automatically interfaced with PowerFactory in order to enable integrated HIL studies. Further developments and enhancements in the PowerFactory models were also required for automatic interfacing with the real-time OPAL-RT simulation software ePHASORSIM. The updated reduced model was further validated in this paper and used for HIL testing with actual LoM relays. This paper also presents the updates to the reduced model, the automated procedure for transferring it into the OPAL-RT simulation environment, validation of the reduced model with PMU data, and finally, HIL study results.

2. The Reduced Model of the GB Transmission System

2.1. Origins of the Reduced Model

NGESO uses a full model of the GB transmission system as developed using the DIgSILENT PowerFactory for off-line transmission analysis (OLTA) [23]. This is a fully detailed model of the actual GB transmission system including complete topology, generation, transmission capacity, HVDC links and distribution network representation. Consequently, the static and dynamic behaviour of the fully detailed model is expected to be in close agreement with the behaviour of the actual GB system. It is important to note that OLTA is the main tool used by the National Grid to perform transmission analysis for the electricity system from design and planning studies up to 10 years ahead, through all network planning processes down to days ahead, and also for re-optimising in control room timescales. In particular, OLTA is used to help design and set up the network as securely and economically as possible prior to real time. The model includes all transmission-level switches and representative distribution-level switches to ensure operational realism in running arrangements and fault scenarios [22]. However, this complex and accurate model is not publicly available because it contains confidential data from third parties. Therefore, the National Grid developed a reduced model of the GB system in 2012 based on non-confidential data, in order to support the rapid model creation of various future scenarios that make it particularly useful for collaborative academic research [23]. Consequently, the reduced model of the GB system has been further developed and enhanced as required for the HIL simulations as presented in this paper.

2.2. Original Design of Reduced Model—Version 2012

In the full model of the GB transmission system published as part of the National Grid’s Electricity Ten-Year Statement (ETYS) [25], 96 system zones have been identified. The reduced model of the GB transmission system was derived from the full system model by aggregation of the ETYS zones into a reduced number of wider zones [23]. For instance, Zone 01 of the reduced model consists of ETYS zones F6, E1, and E6 of the full model [23]. The relationship between the reduced model and the full system model is illustrated in Figure 3.
A further simplification is that each zone is represented using a single substation, where each substation has an equivalent structure with a relevant zonal mixture of various types of generation and load, as shown in Figure 4. A zone of the original reduced model from 2012 contains the following types of generation as typically used in GB: gas, coal, nuclear, pumped storage, oil, hydro, marine, biomass, wind, etc. The individual generators in each model zone represent the aggregated generation of that fuel type within the zone. If a particular fuel type does not exist within a zone, the corresponding generator output is set to zero and considered to be out of service for the simulation. The total load of a zone is also aggregated and represented by a single demand bus. The power lines in the reduced model can be considered as virtual connections that can represent aggregated circuits of the full system using realistic equivalent electrical impedances between zones.
The generators of the reduced model are equipped with non-standard user-defined controllers for the dynamic simulations in PowerFactory, namely, automatic voltage regulators (AVRs), governors (GOVs) and, depending on generation type, power system stabilizers (PSSs). The user-defined controller models were developed by NGESO based on data provided by the generators in order to match the behaviour of each type of generation in the zone, as shown in Figure 5a. A detailed HVDC model has also been included in the reduced network to represent interconnectors to the GB system, which is based on line commutated converter (LCC) technology, as presented in Figure 5b.

2.3. PowerFactory Compatibility with ePHASORSIM

The real-time digital simulator OPAL-RT uses a phasor-based transient stability simulator called ePHASORSIM for its dynamic simulations [26]. The basic data entry mechanism in ePHASORSIM is based on an Excel Workbook [26]. However, it is important to note that ePHASORSIM also supports automated interfacing in order to import models and associated data from other simulation packages such as PSS/e, CYME and PowerFactory [26].
A model with the following components can be automatically imported from PowerFactory: bus; load; synchronous machine and controllers; line; two-winding transformer; three-winding transformer; switch. OPAL-RT supports the most common types of synchronous machine controllers (GOVs, AVRs, and PSSs) [26,27]. However, the controllers of the reduced model were originally customised as user-defined modelling components by NGESO and implemented using DIgSILENT Simulation Language (DSL); thus, the automatic interfacing of the reduced model from PowerFactory to ePHASORSIM was not initially possible [23]. Consequently, updating and enhancing the reduced model of the GB systems was required in order to implement the novel HIL approach, as developed and implemented in the research, as presented in this paper.

2.4. Updates to the Reduced Model for Real Time Simulation—Version 2020

The reduced model originally developed in DIgSILENT PowerFactory (2012) was further developed during this project for use with ePHASORSIM. The updates as presented in Figure 6 and Table 1 were applied to the model as follows:
(1)
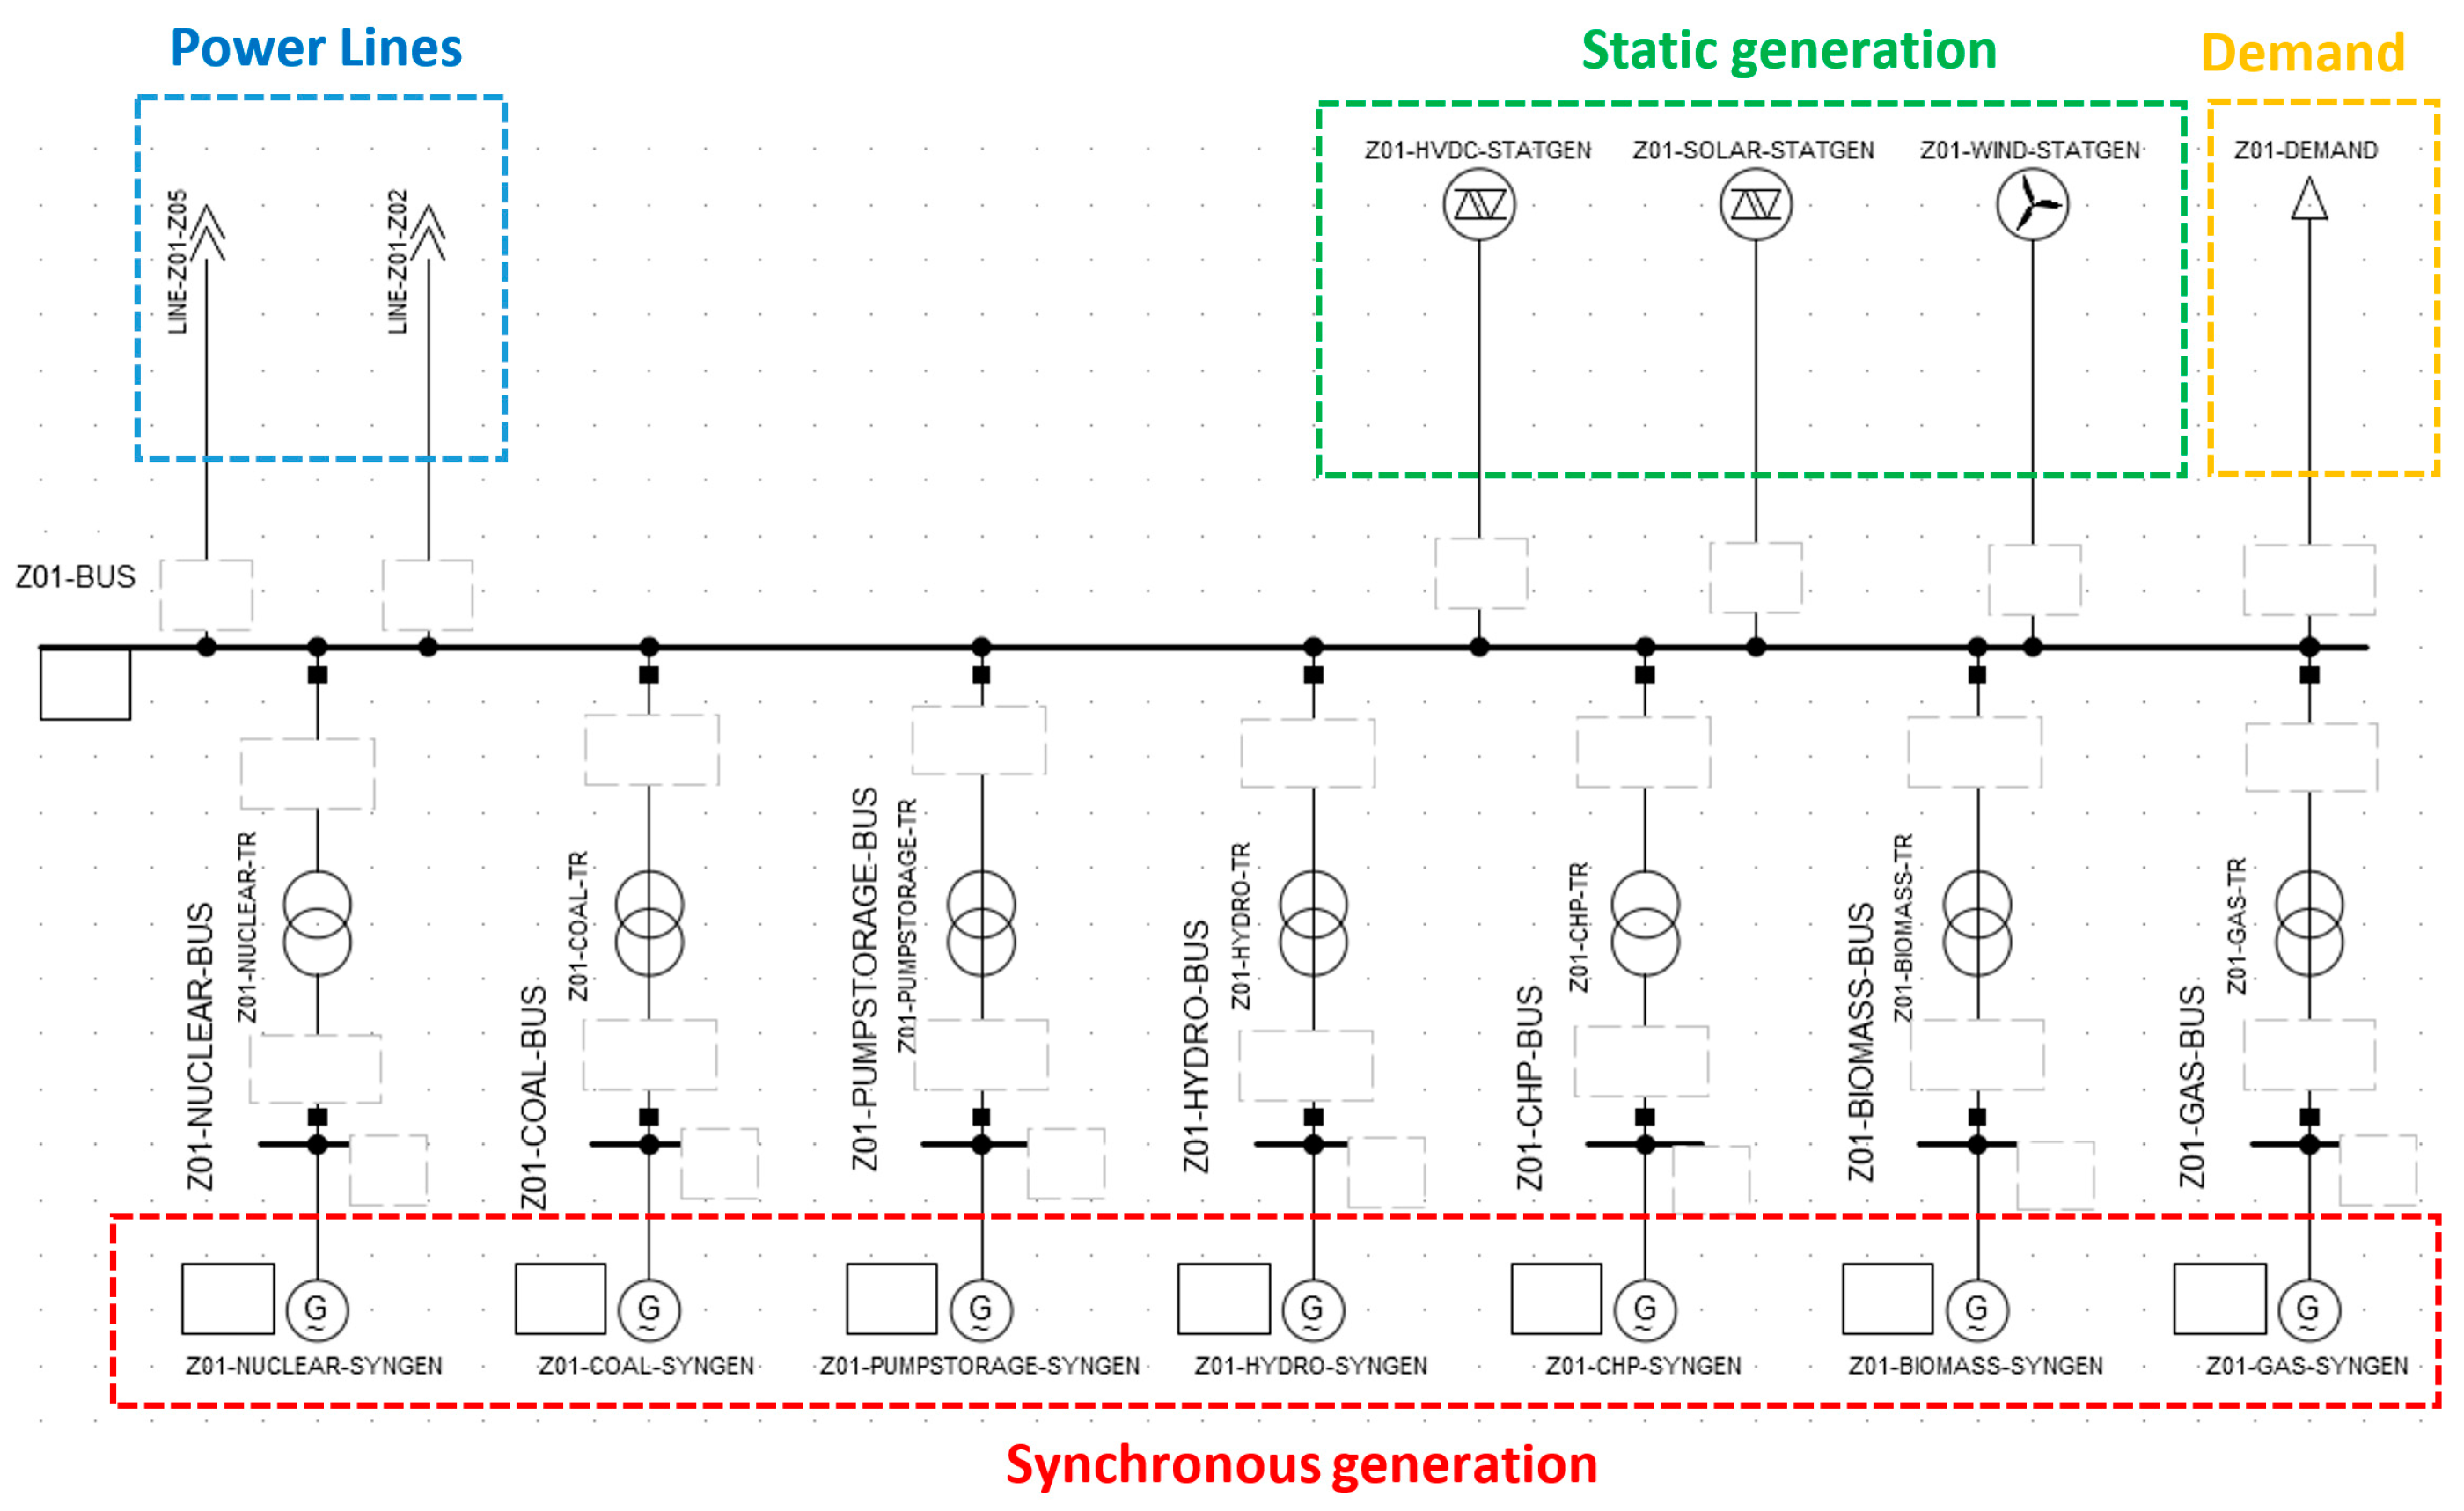
Nodes and switches: The zone models were reduced to single busses and only essential switches were left in the model, in order to reduce the number of nodes and increase the speed of computation.
(2)
Controllers: The original non-standard controllers for the synchronous generators in the reduced model were substituted with standard IEEE controllers (IEEE—Institute of Electrical and Electronics Engineers) in order to achieve compatibility with ePHASORSIM: AVRs were replaced with the standard IEEE EXST1 model, governors with TGOV1 and stabilisers with STAB1. The standard IEEE controllers had their settings modified in a two-stage process:
(a)
The step response of each IEEE model type (EXST1, TGOV1, and STAB1) was separately tuned to match the step response of the corresponding user-defined controller in the reduced model;
(b)
Using PMU measurement data from an actual system event, the TGOV1 parameters were then further adjusted so that the frequency response in the model matched the observed event response.
The resulting parameters are given in Table 1. The same changes were implemented with regard to all generator controllers for all fuel types in each zone.
(3)
Synchronous generation: Synchronous generators were updated to represent the following types of generation: nuclear, coal, pumped storage, hydro, combined heat and power (CHP), biomass and gas. Oil generation was removed from the model because this generation type is no longer in service in GB. “Other” generation was also removed because all the significant generation types were included.
(4)
Static generation: The complex HVDC LCC model was replaced by a simple static generator/load. Solar generation was added to the model in static form, so that static load/generation is used to represent HVDC links, solar and wind generation.
(5)
Substation module vs. grouped symbol: The original PowerFactory model contains zones represented as a substation type. For compatibility with OPAL-RT, the zones were not used as a substation module, but as grouped graphical objects.

3. Reduced Model Implementation for HIL Simulations

Subject to the modifications and enhancements as described in Section 2.4, models created in DIgSILENT PowerFactory can be automatically interfaced for HIL studies with the OPAL-RT simulator. This section describes the detailed implementation of the reduced model in Matlab/Simulink with OPAL’s ePHASORSIM solver. This section also presents the HIL study inputs/outputs with the necessary configuration settings to run the simulation off-line or in real time.

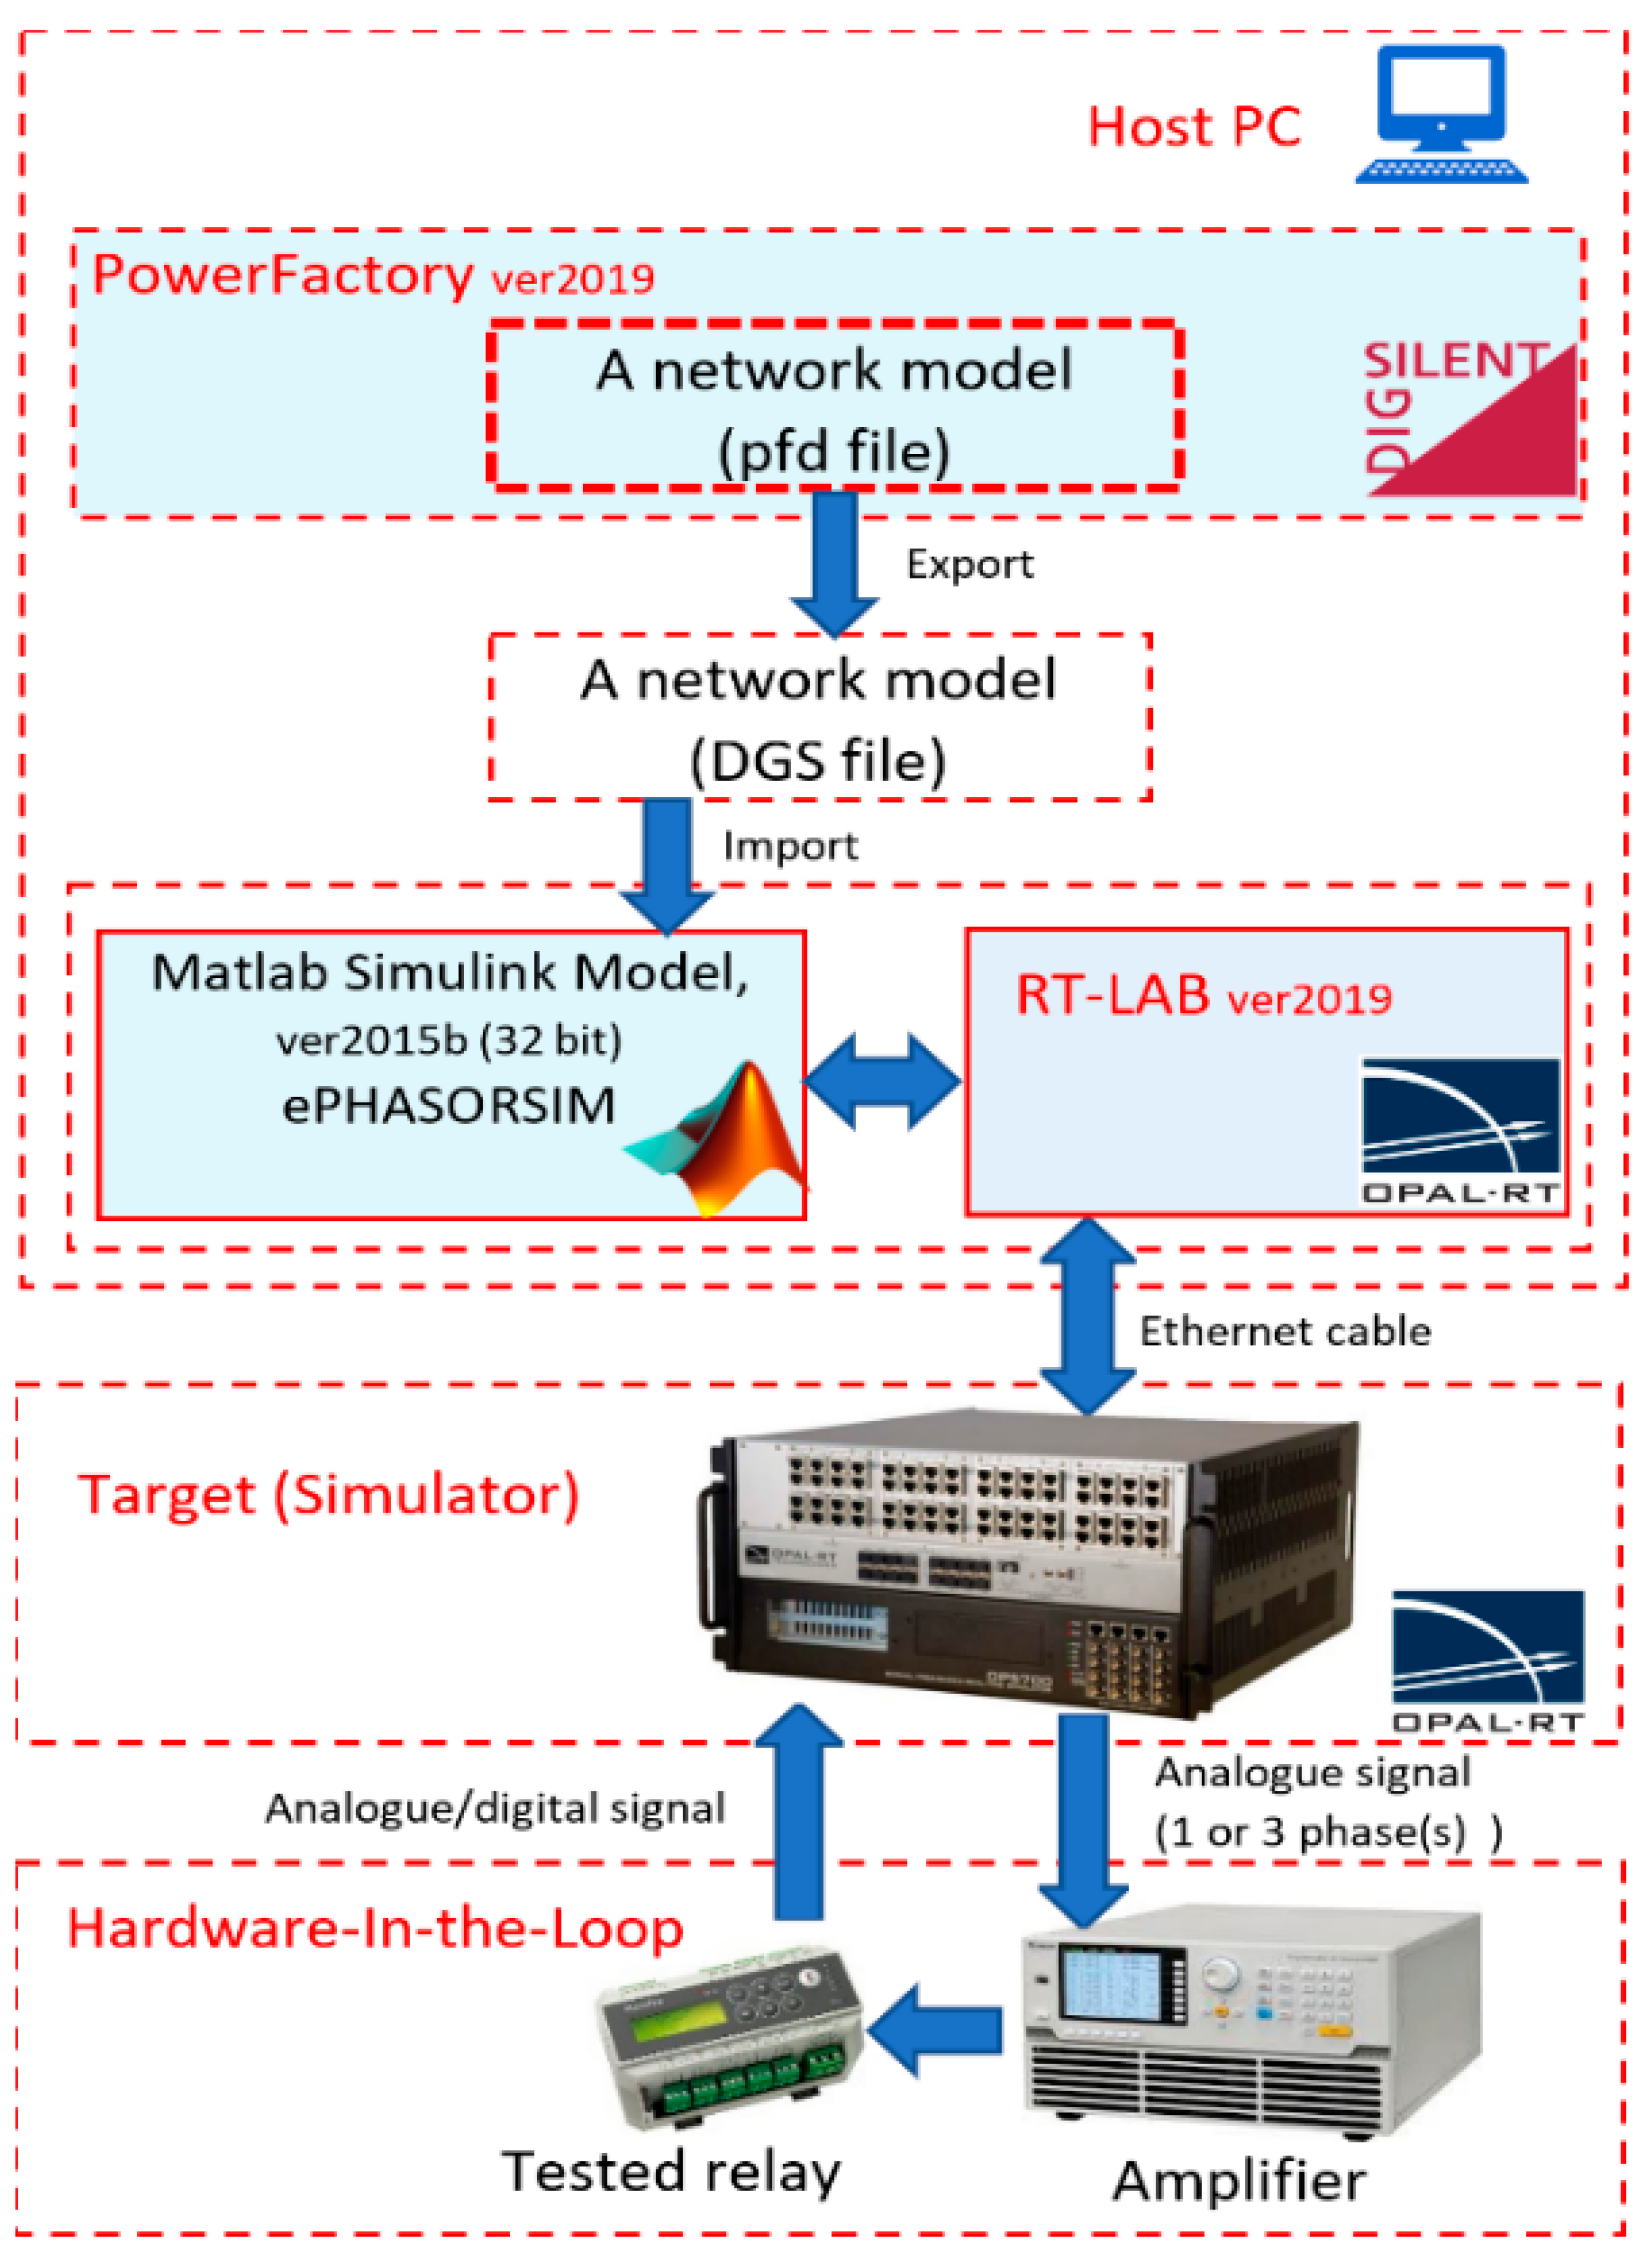
3.1. An Overview of the Model Conversion and Implementation

The process for conversion and implementation of a PowerFactory model for HIL testing involves a number of steps and software components, as illustrated in Figure 7. Initially, the network model is created using the graphical user interface in DIgSILENT PowerFactory. The model is then exported using the DIgSILENT Interface for GIS (geographic information system) and SCADA (Supervisory control and data acquisition) DGS-format and then imported into a Matlab/Simulink model containing the ePHASORSIM solver. The non-real-time simulation can then be executed directly using Matlab/Simulink. However, for real-time simulation, ePHASORSIM is required together with a supervisory package called RT-LAB. RT-LAB controls the interactions of Matlab/Simulink with the OPAL-RT simulator hardware, which is referred to as the Target. The user can then define waveforms to be exported to the analogue outputs of the real-time simulator. ePHASORSIM can use either a balanced positive-sequence network model or an unbalanced phase-by-phase network model. After amplification, the selected signals are used for testing the LoM protection relays. The configuration of the novel HIL approach is completed by importing the relay’s trip signal back into the simulator, as either analogue or digital signals, depending on the relay type. The following section will provide more details of the conversion procedure.

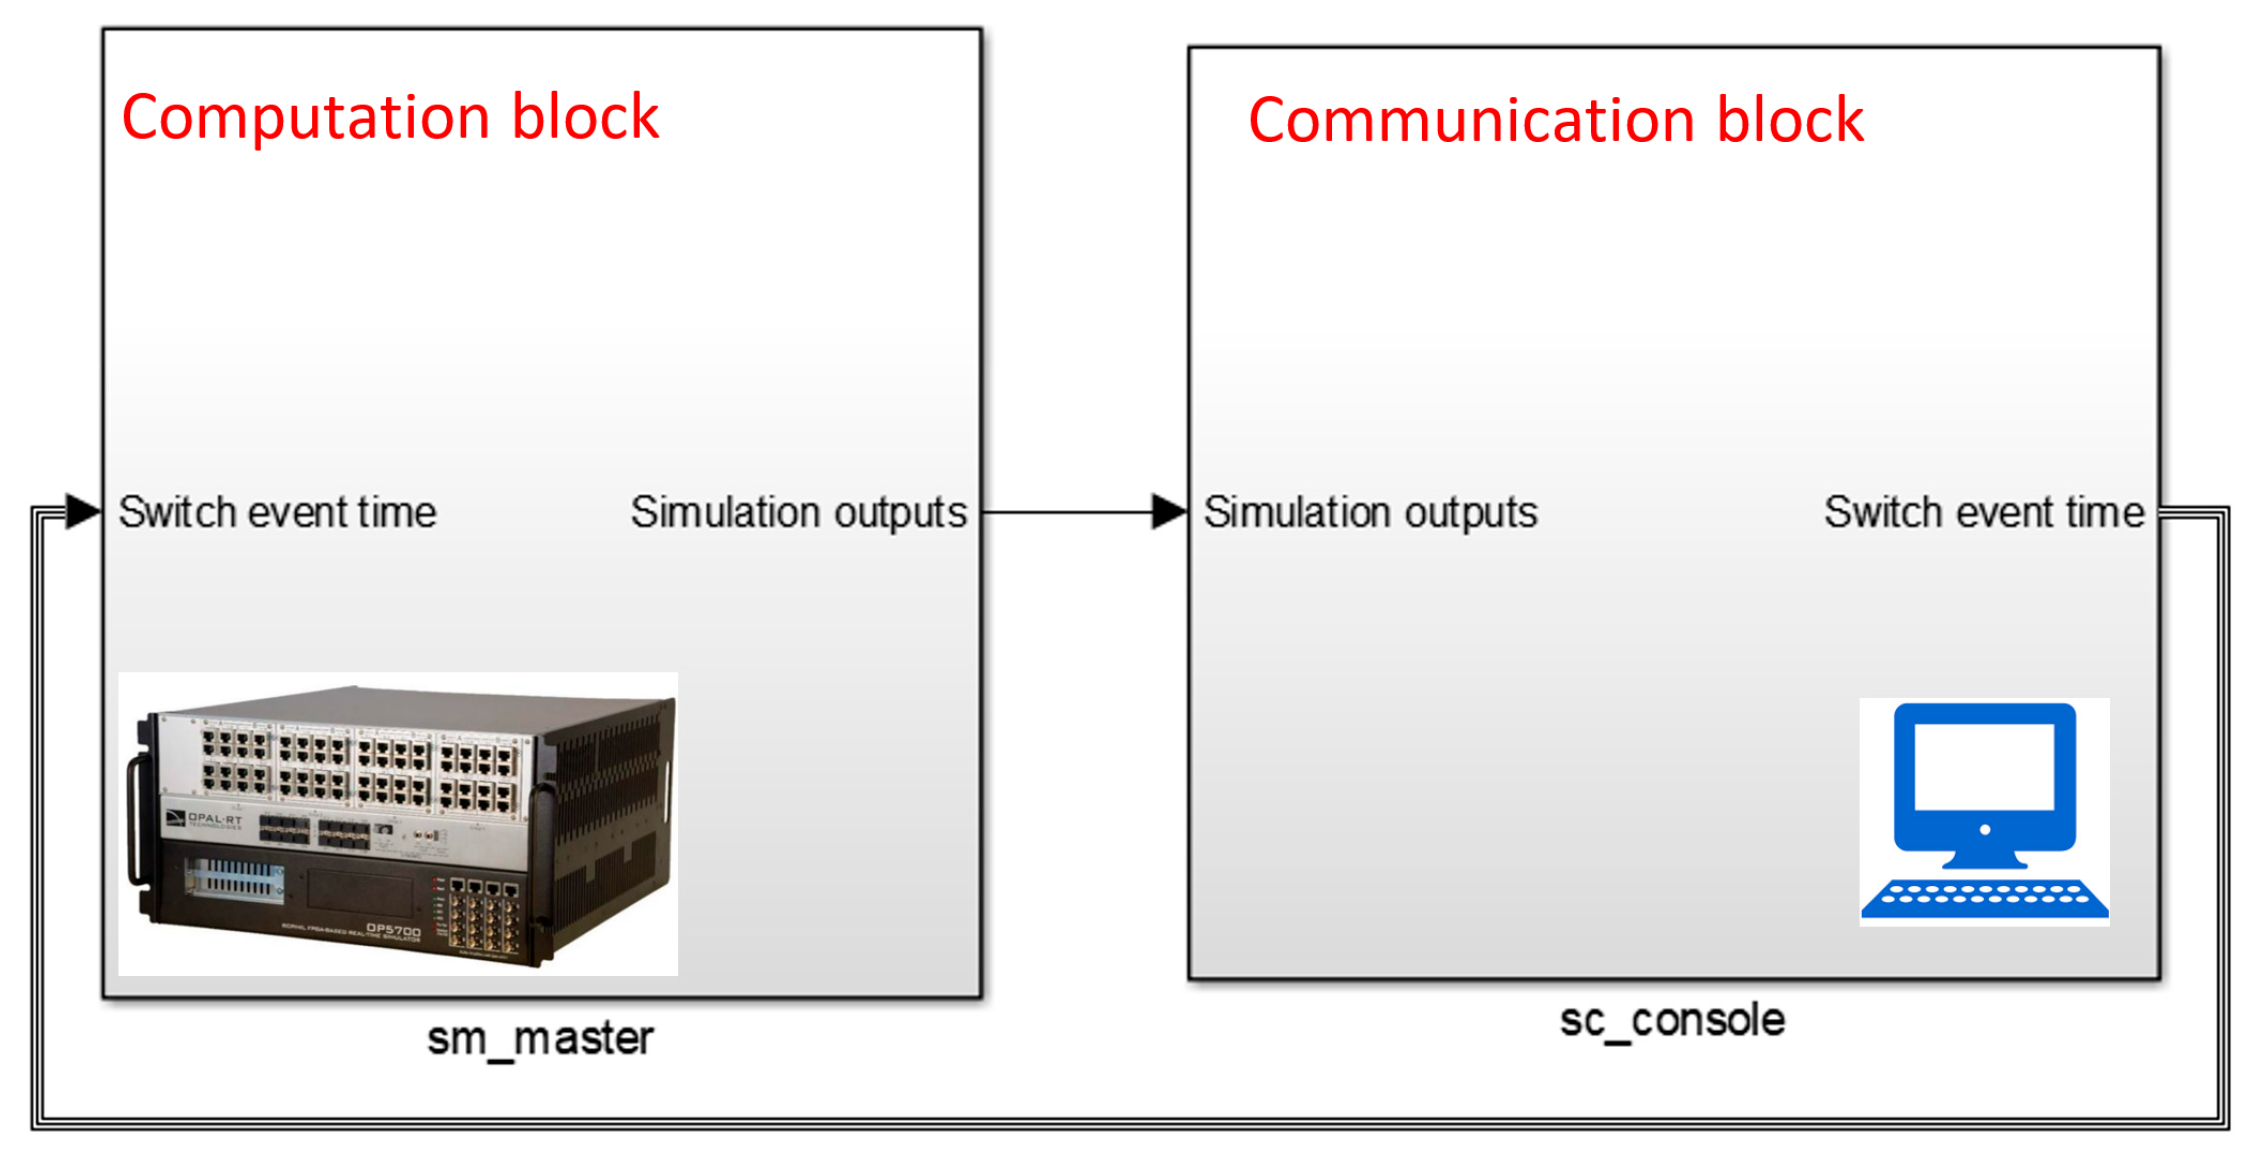
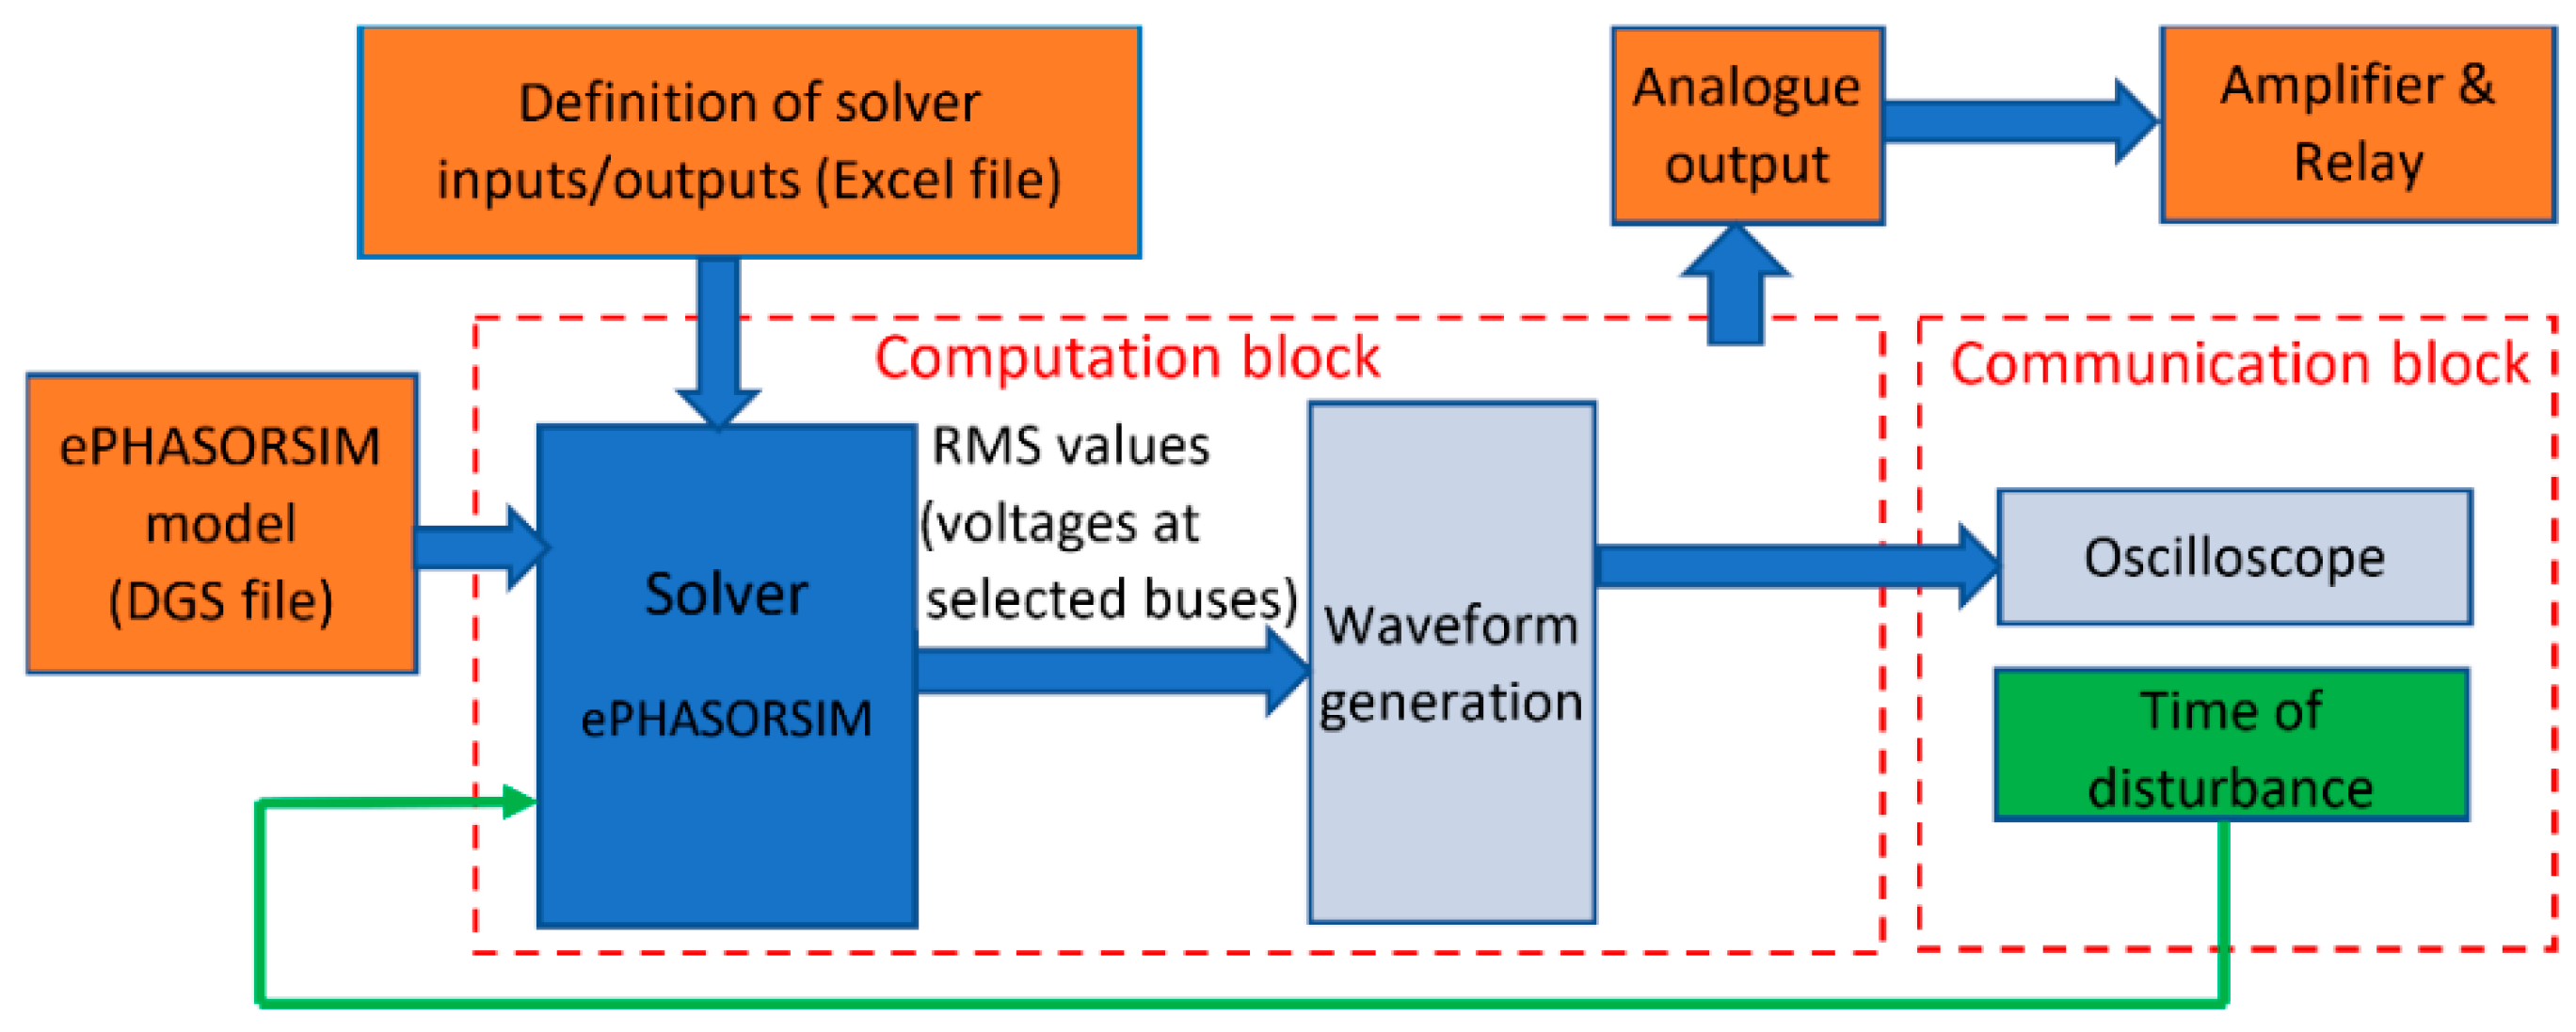
3.2. Simulink Model Definition

The ePHASORSIM solver is implemented using a Matlab/Simulink model. The model can consist of many layers, but at the top level it must consist of two blocks, a computation block and a communication block, as shown in Figure 8. The computation block implements the power system simulation itself, whereas the communication block specifies the variables to be displayed in the Matlab graphical environment and contains the events and other simulation control parameters.
The model can be simulated using a standard PC as a host computer in non-real-time mode, or it can be run in real-time mode on the OPAL-RT dedicated Target simulator. In the first case, both computation and communication block components run on the host PC. In the second case, the computation block runs on the OPAL-RT hardware and the communication block on the host PC. The model names need to begin with ‘sm’ for target and ‘sc’ for the communication block.
The Simulink model shown in Figure 8 is illustrated with more detail in Figure 9. The computation block consists of “Solver”, “Waveform generation”, and “Export definition” sub-blocks. There are two main input files for the Simulink model: the first is an Excel file specifying the input/output pins of the Solver, and the second file is a network model in DGS format as automatically exported from PowerFactory using the export definitions specified by OPAL-RT. These inputs are symbolically shown in the block diagram of the model in Figure 9. The Excel file specifies the solver’s inputs, such as the status of the selected switch that can be opened or closed to create a disturbance event, and the solver’s outputs, such as the bus voltages which, in this case, are rms values and phase angles.
The disturbance event is applied directly to the Solver from the Simulink model by controlling the status of a selected switch or by applying a fault, for example, a single-phase or three-phase to ground fault. In this paper, all the disturbances are applied using a switch state change. This state change is implemented by a signal specified in the communication block as shown by the green line in Figure 9. At the time specified by the user, a disturbance event will be applied directly to the solver from Simulink. The switch event can be controlled either automatically at a pre-set time or by a manual switch within a Matlab/Simulink block.
The solver’s outputs can include the voltages of selected buses. The solver calculates rms values for network voltages and currents, both phase and positive sequence. However, rms values are not directly suitable for HIL studies; therefore, the rms phase values are converted to real-time waveforms using Simulink blocks to implement Equations (1)–(3). This is indicated by the “Waveform generation” block in Figure 9. The real-time values are exported to the communication block for display on a Matlab oscilloscope and to the analogue output of the simulator for connection to the real LoM relay via a programmable amplifier as shown in Figure 9. The equations for calculating the frequency f, RoCoF and the voltage waveform v from the voltage magnitude V m a g and angle φ 0 are shown below:
f = f 0 + 1 ω 0 φ v t
R o C o F = f t
v = V m a g sin ( 2 π f t + φ 0 )
where f 0 represents the system nominal frequency (50 Hz in this case), f is the calculated frequency (Hz) and RoCoF is the rate of change of frequency (Hz/s). Vmag and φ v are the magnitude and phase angle of the voltage, whereas φ 0 is the starting phase angle of the generated waveform (deg).

3.3. Physical Output of the Simulator

The OPAL-RT simulator generates selected signals from the reduced model of the GB system. These signals can then be sent to a specific output of the simulator. OPAL-RT version 5700 uses the analogue output card 7 VIRTEX-7 FPGA (FPGA—field-programmable gate array). In order to send a simulated signal to the correct output, the VIRTEX card needs to be configured. The output signals from the simulator are then sent to a Chroma 61,607 amplifier to provide a suitable input for the protection relays. The HIL laboratory setup is shown in Figure 10.

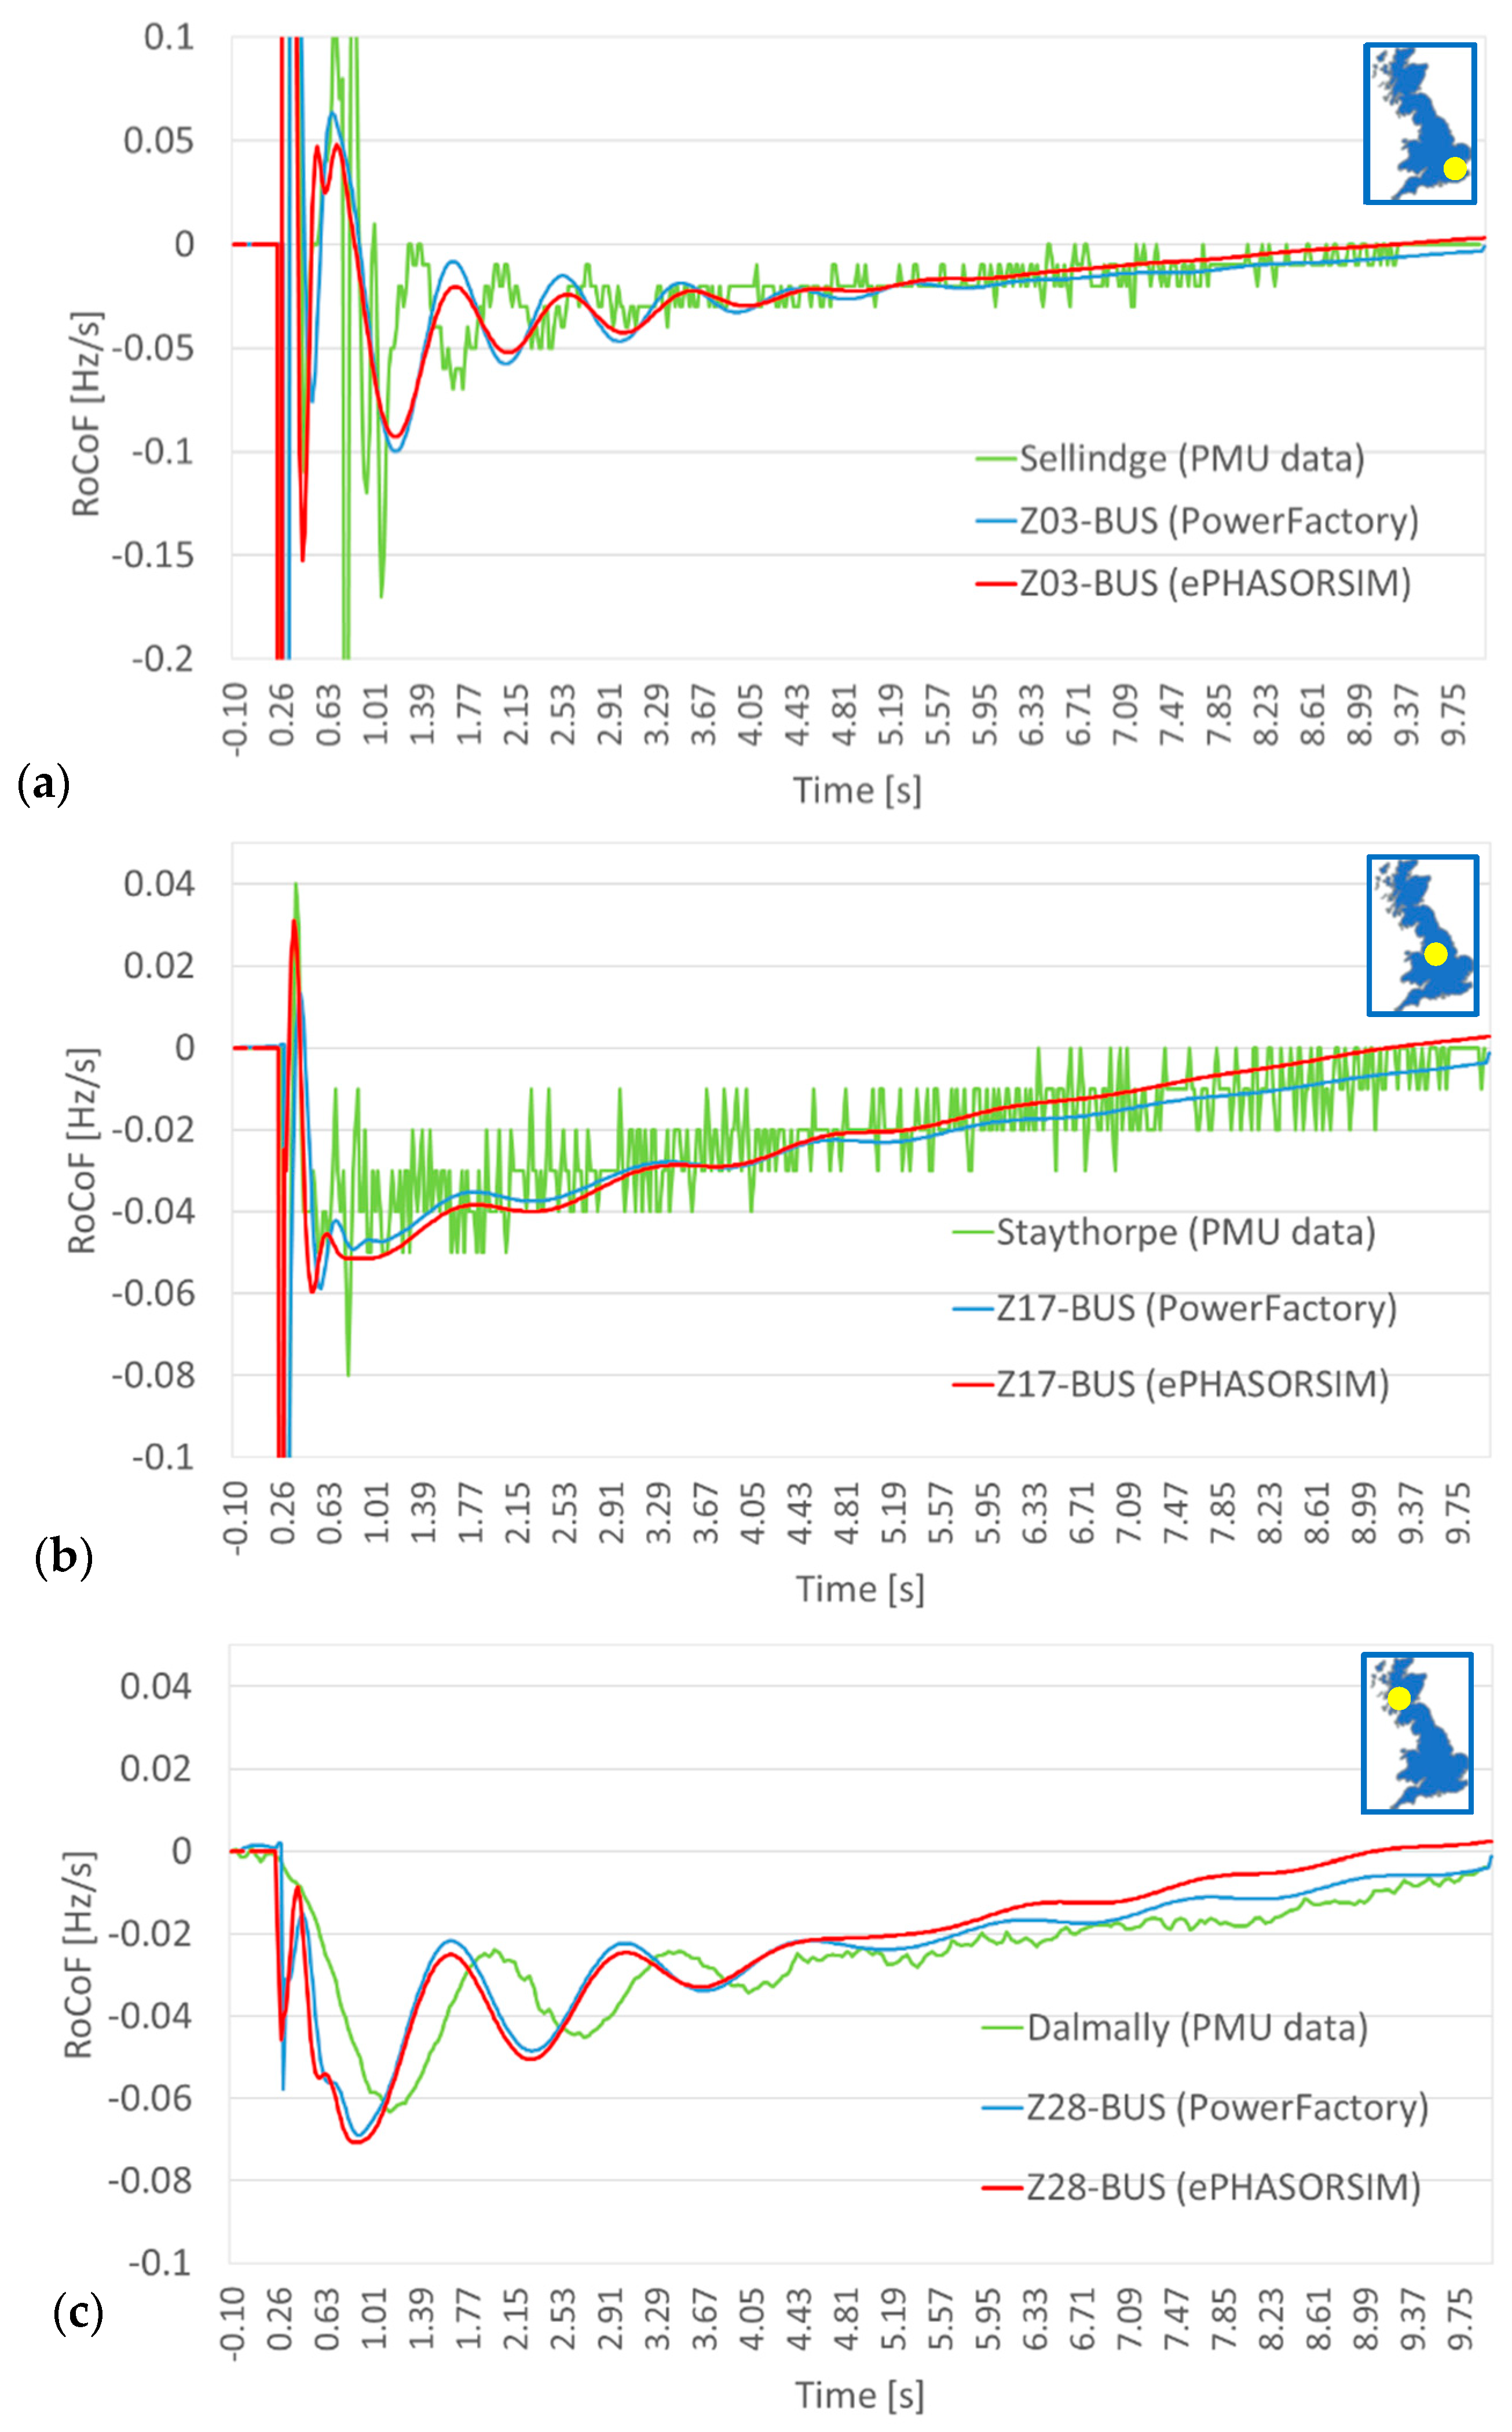
4. Reduced Model Validation against PMU Data

4.1. The GB System Case Study

The case study used for validation was the loss of the 500 MW import from an HVDC link in the Southeast of the GB system on 20 April 2018. Total system demand was 33.4 GW, inertia was 248.7 GVAs, and the frequency fell from 49.99 to 49.70 Hz.
The case study was simulated with DIgSILENT PowerFactory and OPAL-RT ePHASORSIM. For modelling purposes, the generation, demand, and inertia were aggregated for each zone based on data from the NGESO OLTA full system model at the moment of the disturbance event. The fault was then applied to the reduced model and the results compared at selected points with the PMU data recorded from the actual event.

4.2. The PMU Recordings at Selected Locations

Figure 11 presents the PMU data for the HVDC trip at three selected substation locations: Sellindge, Staythorpe, and Dalmally. As shown in Figure 11, these are located in the Southeast, Midlands, and North of the system (note that Staythorpe is close to the electrical rather than geographical centre of the system). Following the trip, the frequency falls across the entire system, and the initial RoCoF for this system-wide “mechanical” mode of response is 0.046 Hz/s, as estimated by polynomial curve fitting to the Staythorpe PMU data. This is close to the theoretical value R o C o F t h derived from the reported level of system inertia and power infeed loss:
R o C o F t h = Δ P f 0 2 I = 500   MW   × 50   Hz 2   × 249   GVAs = 0.05   Hz / s
Electro-mechanical oscillation modes are also visible in the PMU data in the North and South of the transmission system. The mode in the South has a frequency of 1.40 Hz, which would typically be associated with a local oscillation mode, whereas the mode in the North has a frequency of 0.067 Hz, which suggests that it is a North–South inter-area oscillation mode. Within the resolution of the data, almost no oscillations are visible near the centre of the system at Staythorpe [3].

4.3. Reduced Model Update with Event Conditions

The reduced model presented earlier in this report was updated with the event conditions extracted from the relevant OLTA model.
The reduced model does not contain individual synchronous machines, but rather equivalent machines which represent the behaviour of one or more machines of each type in each zone. In order to achieve realistic rating and inertia parameters for these equivalent generators in the reduced model, they need to be based on the real generators running in the system during the event. The rating Sgn and output power Pact for the equivalent generators are derived by aggregating the individual real generator parameters, and the equivalent inertia Hgn is then computed according to Equations (5)–(7).
S g n = i = 1 N S g n   i
H g n = i = 1 n H i S g n   i i = 1 n S g n   i
P a c t = i = 1 N P a c t   i
where N is the number of generators in zone for the same type, Sgn is the rating of the generator (MVA), Hgn is the inertia constant of the generator (s), Pact is the actual power of the generator (MW), and i is the suffix for the computation.
Finally, the calculated values for apparent power and inertia were modified to obscure the actual synchronous machine data, whilst maintaining the correct inertia across the system as a whole. The total active power demand is 33.4 GW, and the total inertia is 249 GVAs, consisting of 208 GVAs of generator inertia and 41 GVAs of demand inertia, based on data from NGESO. The demand models in PowerFactory and ePHASORSIM do not include inertia; therefore, demand inertia was included in the model by distributing it equally onto generators which were at zero power output in the reduced model (because there was no generation from their respective fuel type in that zone). These generators were assigned a nominal 50 MW rating for this purpose, with inertia calculated to provide the correct total for demand.

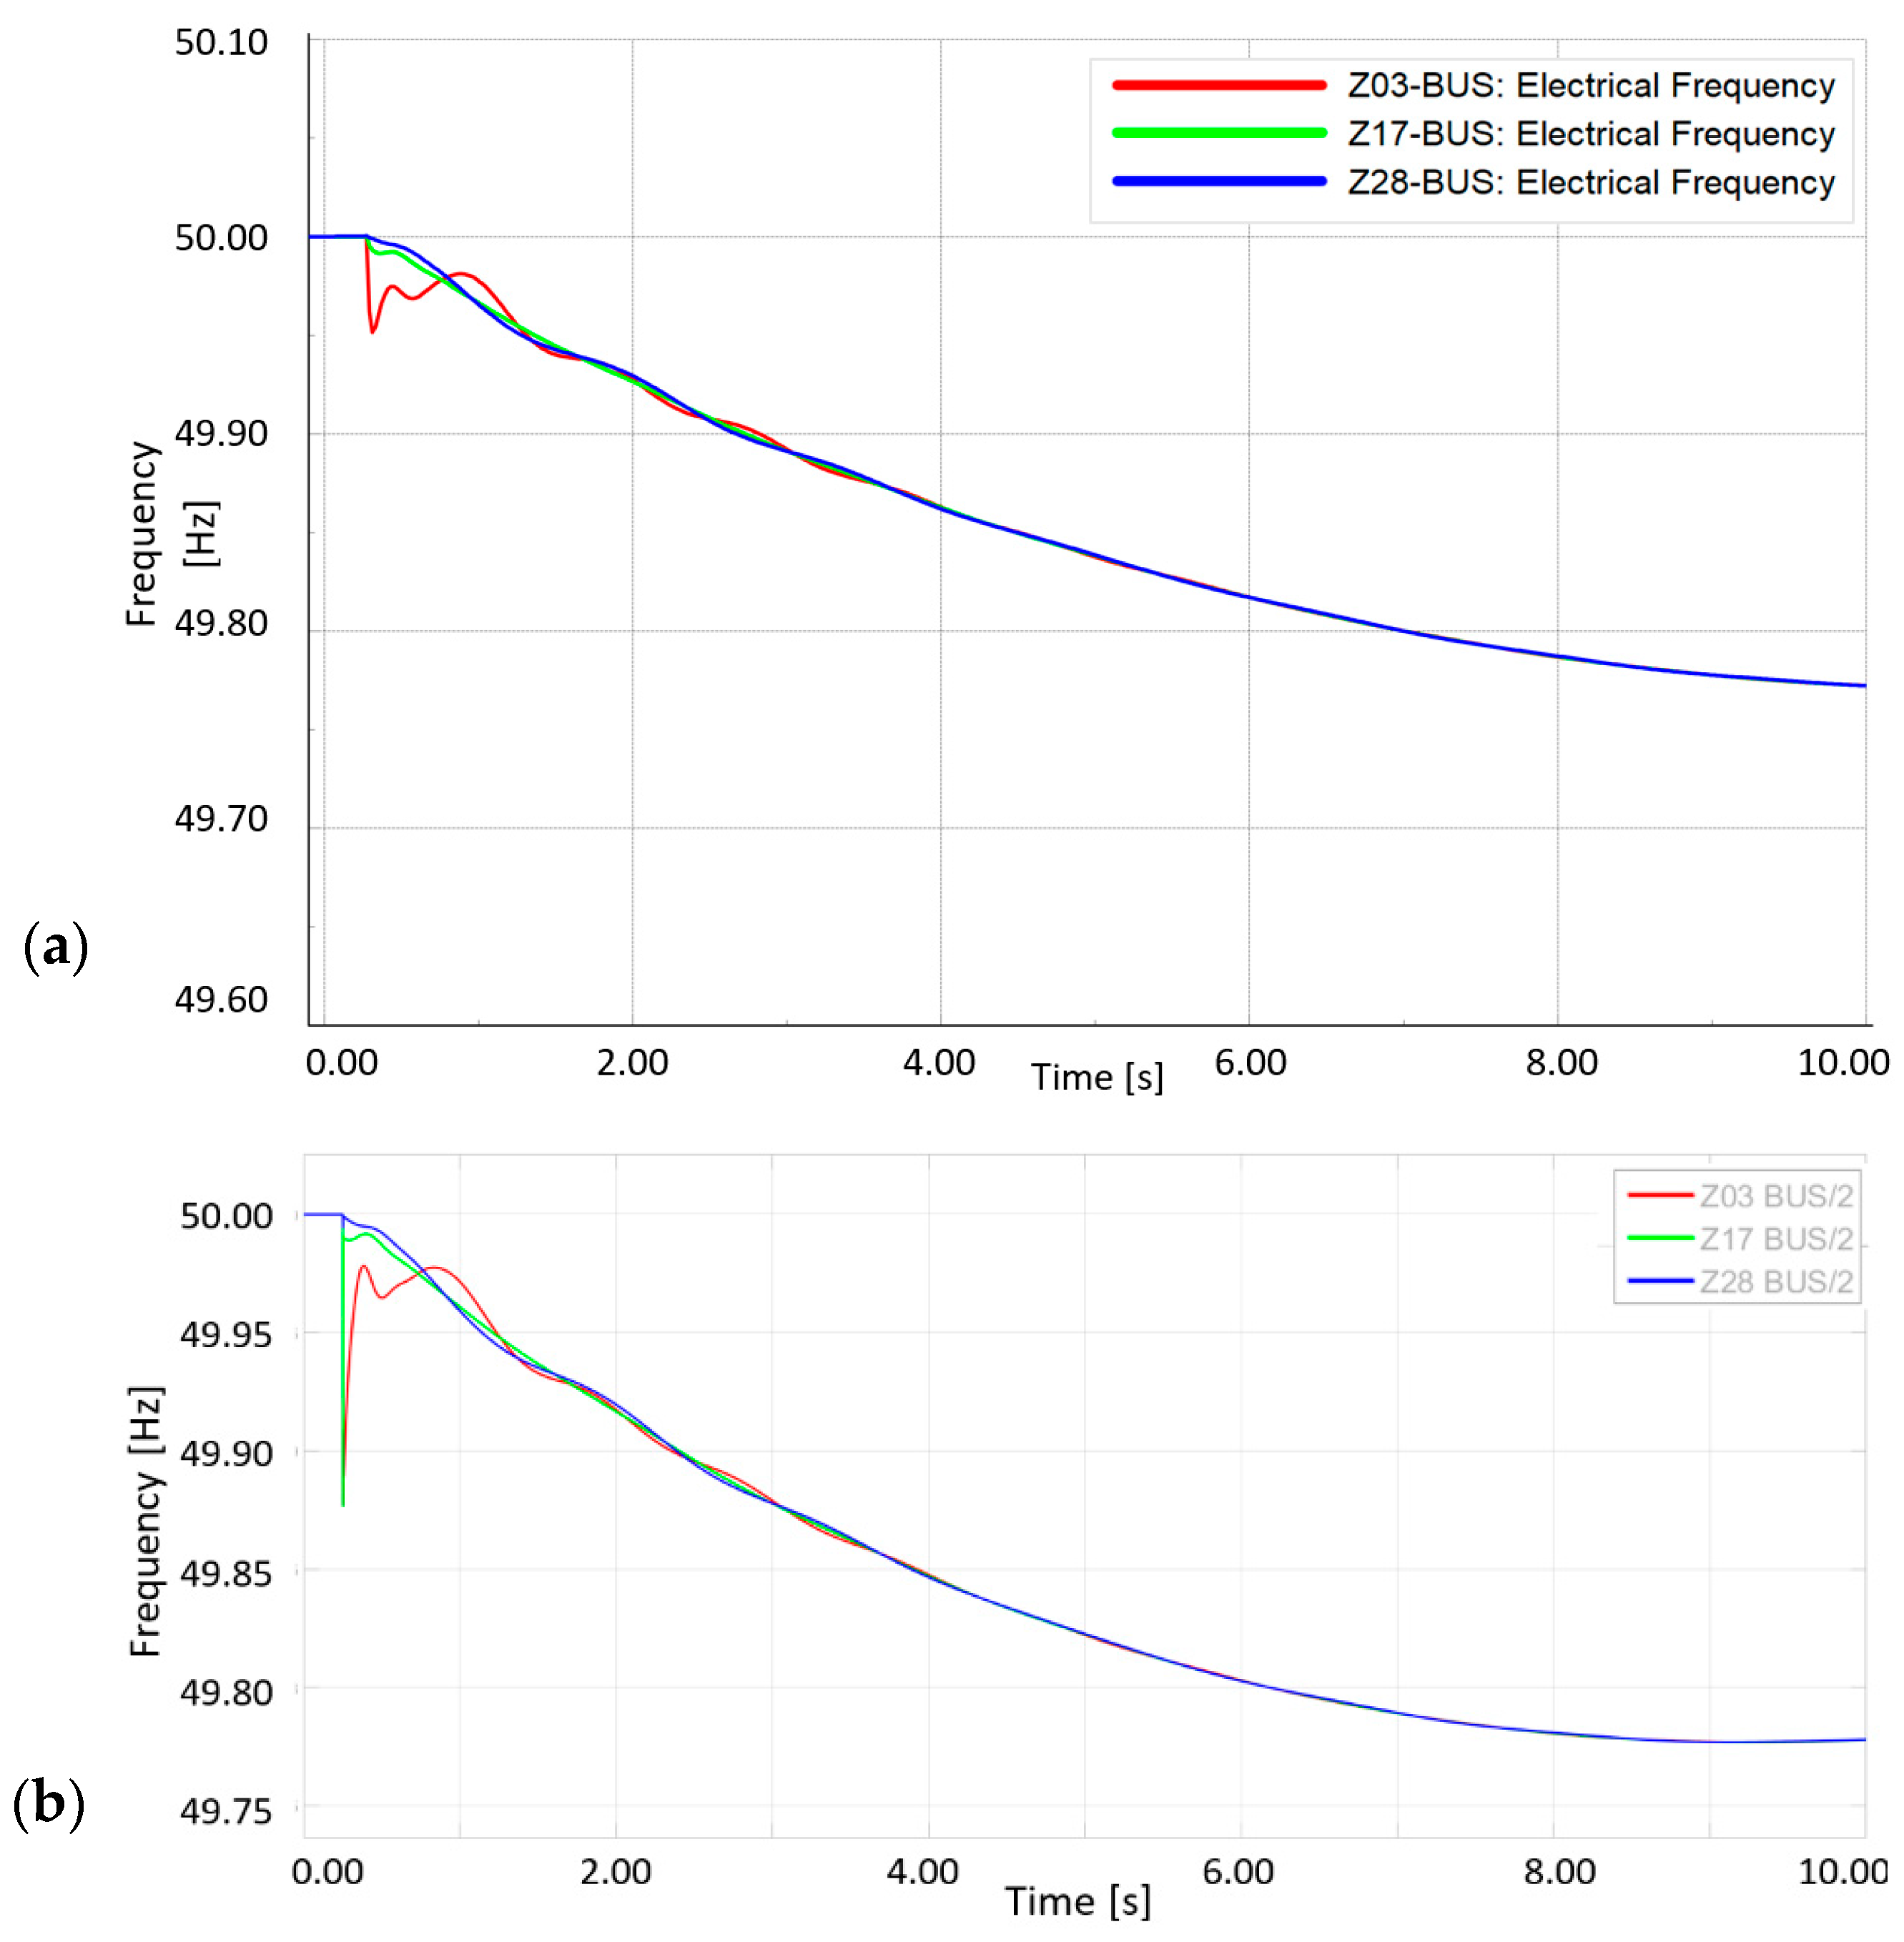
4.4. PowerFactory and ePHASORSIM Simulations

For these simulations, the reduced model was updated with the modified zonal generation and inertia parameters described above based on the real network conditions for the HVDC trip incident. The validation below is focused on the first 5 s after the disturbance, because this time is critical for LoM relay operation. The response of the reduced model is compared with the PMU data for the selected substations as shown in Table 2; these are the same locations as used earlier for presenting the PMU data in Figure 11. Each zone of the reduced model represents a group of ETYS zones, and within these ETYS zones the actual substations of the GB transmission system can be identified, as presented in Figure 3.
The simulation results from PowerFactory and ePHASORSIM are presented in Figure 12 for the 500 MW infeed loss in Zone 03 of the reduced model. Apart from a more pronounced “immediate” transient in the ePHASORSIM study (a computational effect due to a shorter sampling time), the results are very close between the two packages, as would be expected. Note that the 500 ms delay specified for RoCoF operation in both G59 and G99 means that this transient should not affect LoM relay operation.
Comparing Figure 12 with Figure 11, it can be seen that the frequency response of both models is similar to the actual system for at least 5 s after the event, and they settle to nearly the same value as the actual system at around 49.75 Hz. It is important to note that the synchronous machine governor parameters were adjusted in the reduced model to produce matching responses, as described in Section 2.4.
The comparison of PMU RoCoF data for the actual disturbance event with the simulated results at the three locations is presented in Figure 13. For Zone 03, RoCoF in the reduced model shows an oscillation of 1.14 Hz compared with the Sellindge PMU data of 1.40 Hz. For Zone 28, the model exhibits an RoCoF oscillation at 0.71 Hz compared with the Dalmally PMU value of 0.67 Hz. Near the electrical centre of the system, oscillations in both the model (Zone 17) and the PMU data (Staythorpe) have very low amplitudes. In general, therefore, the model reproduces the distinct behaviour of local and inter-area oscillations which are associated with the distribution of inertia. Possible reasons for the differences in detail between the results are discussed below.
For both modes of the electromechanical oscillations, local and inter-area, the modal frequency will be strongly influenced by the impedances of the equivalent transmission lines and generator transformers, as well as the values of generator transient reactance. Unless the equivalencing calculations for the reduced model were carried out with the specific purpose of modelling electromechanical oscillations, it is possible that differences in modal frequencies may result. This is believed to be the cause of the differences in the inter-area oscillation frequencies of 0.67 Hz in the PMU data compared with 0.71 Hz in the model. For local oscillation modes, however, the impact of aggregating generators within a zone is likely to be more significant than for inter-area modes. For any given local mode, only a handful of generators may be involved; if these generators are absorbed into larger zonal equivalents, the quantizing effect of the equivalencing may be much more pronounced. It might therefore be expected that the performance of a reduced model would be less accurate for local modes than for inter-area modes, and this is believed to be the cause of the more significant discrepancy in results for the local oscillation mode at Sellindge in Zone 03, which is 1.40 Hz in the PMU data compared with 1.14 Hz in the model.
From examination of the RoCoF results, it can be seen that there is a difference in phase shift between the oscillation modes in the model and in the PMU data. The phase shift appeared to be influenced by the level of reactive demand in the model, but this is an area requiring further investigation.
Subject to the above discussion, the accuracy of the reduced model was considered to be sufficient to produce meaningful HIL study results.

5. HIL Case Studies

The reduced model representing the HVDC trip case was used for HIL studies with the IPU/ComAp MainsPro relay. The relay was tested with the former G59 settings of 0.125 Hz/s and a 500 ms delay, because many LoM relays are still present on the system with these legacy settings. The relay was selected to the three locations investigated previously, i.e., Zone 03, 17, and 28. The testing arrangement is presented in Section 3.

5.1. ComAp MainsPro Relay Specification

The ComAp MainsPro as shown in Figure 14 is a protection relay for parallel-to-mains applications [28], including generator sets, cogeneration units, micro turbines, and renewable energy sources, such as photovoltaic plants and wind turbines. It provides adjustable voltage, frequency, and LoM protection to safeguard both the distribution network and the generators. The relay supports flexible configuration including options for single- or three-phase connection with a selection of voltage levels (120 V, 220 V, and 400 V) and frequencies for the EU (50 Hz) or USA (60 Hz). The LoM function of the relay offers both vector shift and RoCoF protection [28].

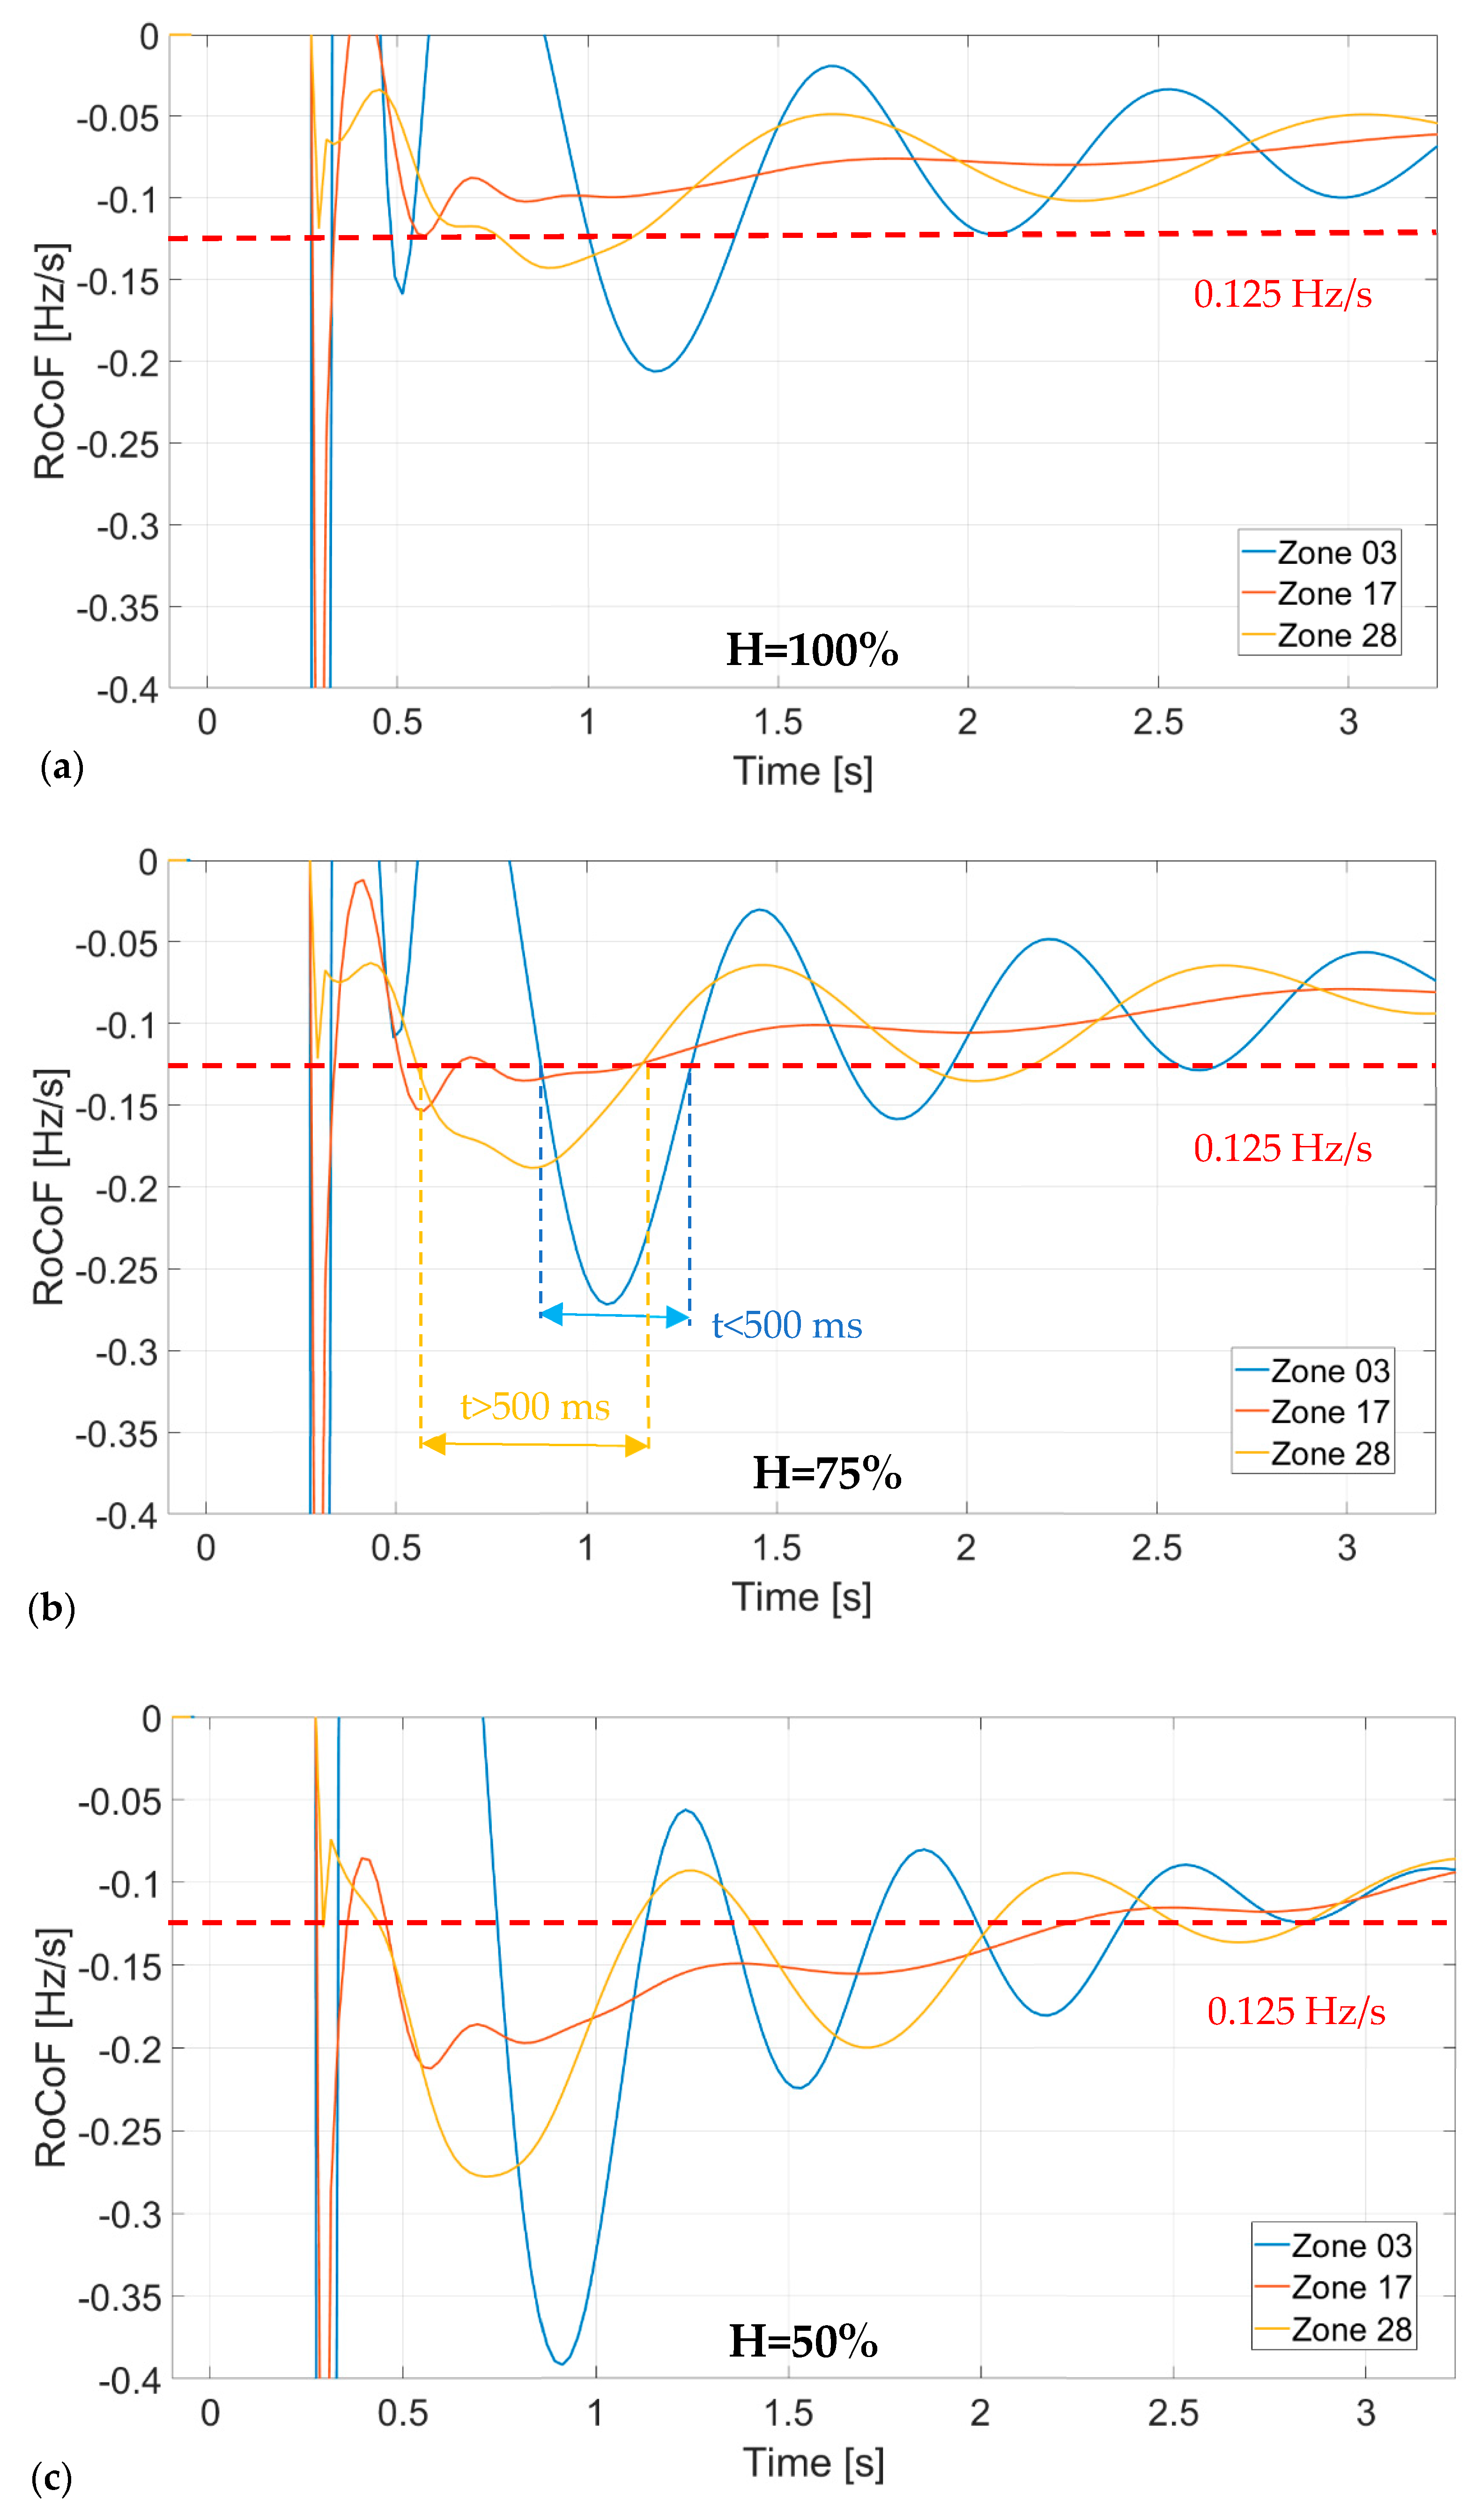
5.2. Mechanical Frequency Response Behaviour (The “System-Wide” Component of RoCoF)

As presented in Section 4.4, Zone 17 of the reduced model has the lowest amplitude of RoCoF oscillation. RoCoF and LoM tripping results from this zone were therefore used to study the behaviour of the system mechanical response, i.e., the response without significant oscillation modes. The RoCoF levels simulated using PowerFactory are shown below; these are the initial instantaneous values of RoCoF.
It can be seen that the initial RoCoF has an almost linear dependence on the infeed loss and is inversely proportional to the inertia, as expected.
Figure 15 further demonstrates that an infeed of loss of 500 MW as based on an actual GB transmission system disturbance event does not trip the relay. However, an increase in the infeed loss above 1000 MW or a reduction in inertia to 50% of the original incident value could cause tripping of the relays with the legacy G59 setting of 0.125 Hz/s. From the right-hand side of the graph as presented in Figure 15, it can be seen that increasing the tripping threshold of the relay to the current standard G99 value of 1 Hz/s prevents unwanted relay operation for infeed losses up to 4000 MW if the inertia does not fall below 50% of the study case value.

5.3. Impact of Electro-Mechanical Frequency Modes on Locational RoCoF

The potential influence of the oscillatory modes on tripping is presented in this section. It has been observed from the PMU recordings that during disturbances in the GB system, oscillation modes exist in different parts of the network; for example, in the HVDC trip case above, there was a 0.67 Hz inter-area (North–South) mode and a 1.40 Hz local mode at the source of the disturbance. These modes are superimposed on the main frequency response of the system and could influence the tripping of RoCoF relays in marginal situations, making them more or less sensitive.
For illustration, Figure 16 shows the RoCoF response of the three zones of interest in the reduced model for a 1000 MW infeed loss for three different levels of inertia: 100%, 75%, and 50% relative to the HVDC trip event of 20 April 2018. For 100% inertia, none of the zones exceed the tripping level for more than the delay time of 500 ms, whereas at 50% inertia, all the zones do so. However, at the intermediate value of 75%, the system oscillations significantly affect the results. Zone 03, where the infeed loss occurs, is the blue line with the high amplitude in Figure 16; in Figure 16b, the relatively fast local oscillation (half period 360 ms) means that RoCoF does not exceed the tripping threshold for more than 500 ms, and therefore will not cause LoM tripping. In effect, the rapid local oscillation causes the LoM relay time delay counter to reset. In contrast, RoCoF in the remote zones, which are more influenced by the slower inter-area mode (half period 700 ms), does exceed the threshold for more than 500 ms, and therefore will cause LoM tripping. Even though the average RoCoF may be just below the threshold, the slow inter-area oscillation pushes it above the threshold for long enough to trip the relay.
This counter-intuitive finding is explored further in a set of PowerFactory studies whose results are given in Figure 17. For an infeed loss of 1000 MW in the Southeast corner of the network (Zone 03), the inertia of the system is gradually reduced, and the simulated LoM relay response is monitored in each zone by testing for the presence of RoCoF above the 0.125 Hz/s tripping threshold for more than 500 ms. A “smoothed” value of RoCoF was used for this simulation by averaging the instantaneous value over five cycles. A zone is shown in red if the simulated relay tripped in that zone, and green otherwise.
It can be seen that the first relays to trip are in the far North of the system, at an inertia level of 90%. As the inertia is steadily reduced, the red tripping area spreads towards the Southeast where the disturbance originates. However, the powerful resetting effect of the fast local oscillation mode is such that the inertia has to be reduced to 50% before the last zone trips, at the location of the infeed loss.

5.4. Verification of Results with HIL Studies

The PowerFactory study results shown in Figure 17 were then confirmed at key points using ePHASORSIM and HIL studies. HIL studies are more time-consuming than the off-line equivalents because the relay has to be connected to each zone in turn; hence, the PowerFactory studies were used to identify the overall phenomena, and the HIL studies were used to validate these at key points. Table 3 shows the results for Zones 03, 17, and 28 at system inertia levels of 50%, 70%, 80%, and 100% of the original case.
The results from the HIL tests match the behaviour of the simulated LoM relay in the PowerFactory studies in Figure 17. At 80% inertia in the PowerFactory results, the tripping region did not quite reach Zone 17, whereas for 70% inertia, Zone 17 and one other zone tripped, so the HIL tests validated the marginal cases around Zone 17 tripping. The 100% and 50% results also matched the PowerFactory tests.
These tests were performed with a relay filter length of nine cycles applied to the RoCoF measurement; less consistent results were obtained at shorter filter lengths, e.g., five cycles, and these are not recommended by the vendor.

6. Conclusions and Future Research

This paper presents a novel HIL approach as used to investigate the impact of the reduction in inertia on the GB electrical power system with regard to RoCoF settings for LoM protection. Modelling of the GB transmission system to a sufficient level of accuracy is essential for this purpose. Therefore, this paper updates, enhances, and validates a reduced model of the GB transmission system, as originally developed in DIgSILENT PowerFactory by the National Grid Electricity System Operator, for integrated use with the real-time simulation hardware OPAL-RT. The updated model was validated against PMU data from a real disturbance event on both platforms: PowerFactory and ePHASORSIM.
The corresponding simulations show that the updated reduced model is capable of capturing the dynamic behaviour of the GB transmission system, including both local and inter-area oscillations, with satisfactory accuracy. The paper presents the HIL study results with the reduced model to investigate the influence of decreasing system inertia on the response of LoM protection relays. The studies show that decreasing system inertia may have a significant impact on LoM relays using RoCoF detection, particularly relays using the old G59 setting of 0.125 Hz/s. The initial RoCoF level is shown to depend linearly on the infeed loss and to be inversely proportional to the system inertia. Initial studies have also uncovered the potential for a previously unrecognised interaction between the frequency of system oscillations and the 500 ms operating delay specified in G59 and G99 Engineering Recommendations, with faster local oscillations (>1 Hz) resetting the relay and decreasing the sensitivity, whereas slower inter-area oscillations (<1 Hz) exaggerate the RoCoF as observed by the relay. In some cases, this leads to the counter-intuitive result that, as event severity increases (with reduced inertia), the first locations to trip are at the remote end of the system from the event location. This phenomenon has been demonstrated for a simulated disturbance in the Southeast corner of the power system where the first relay trip occurs in the north of Scotland. At this stage, these tentative simulation results are presented and discussed, but further investigation is needed.
Future research will involve further testing of the reduced model using HIL studies for both vector shift as well as RoCoF response. It should be noted that LoM relays will normally be connected at the distribution network level and future research will be performed in order to ensure accurate representation of such situations with regard the relevant zones of the reduced model. It is also important to note that increases in LoM relay filter length will also be investigated as the current G99 standard does not specifically regulate this parameter. In addition, the testing of a wider range relays will be performed in order to further investigate the impact of low inertia.

Author Contributions

Writing—original draft, P.I.; Writing—review & editing, G.A.T., M.E.B. and Y.L. All authors have read and agreed to the published version of the manuscript.

Funding

This research was sponsored by the National Grid Electricity System Operator with Network Innovation Allowance funding from OFGEM (Office of Gas and Electricity Markets).

Acknowledgments

The authors also express their thanks to ComAp Control Ltd. for the MainsPro relay used in the HIL studies presented in this paper.

Conflicts of Interest

The authors declare no conflict of interest.

References

  1. National Grid Electricity System Operator. Operating a Low Inertia System. 2020. Available online: www.nationalgrideso.com/document/164586/download (accessed on 1 May 2020).
  2. Hewes, D.; Boiarchuk, I.; Witzmann, R.; Altschaeffl, S. Impacts of Reduced Rotational Inertia on Frequency Stability in the European Transmission System. In Proceedings of the CIGRE Symposium 2017, Dubllin, Ireland, 29 May–2 June 2017. [Google Scholar]
  3. Imris, P.; Taylor, G.A.; Pisica, I. Investigation & Modelling of Fast Frequency Phenomena—WP1; Brunel University London: London, UK, 2019. [Google Scholar]
  4. Energy Networks Association. Loss of Mains Protection Settings for All Small Generators, Stakeholder Workshop; Energy Networks Association: London, UK, 2018. [Google Scholar]
  5. Laverty, D.M.; Best, R.J.; Morrow, D.J. Loss-of-mains protection system by application of phasor measurement unit technology with experimentally assessed threshold settings. IET Gener. Transm. Distrib. 2015, 9, 146–153. [Google Scholar] [CrossRef]
  6. National Grid Electricity System Operator. Technical Report on the Events of 9 August 2019; NGESO: Warwick, UK, 2019. [Google Scholar]
  7. National Grid Electricity System Operator. Monthly Balancing Services Summary (MBSS). 2022. Available online: https://data.nationalgrideso.com/balancing/mbss (accessed on 1 July 2022).
  8. Energy Networks Association. Engineering Recommendation G59, Issue 3 Amendment 7, Recommendations for the Connection of Generating Plant to the Distribution Systems of Licensed Distribution Network Operators; Energy Networks Association: London, UK, 2019. [Google Scholar]
  9. Energy Networks Association. Engineering Recommendation G99, Issue 1—Amendment 1. 2018. Available online: www.dcode.org.uk/assets/uploads/ENA_EREC_G99_Issue_1_Ammendment_1_2018_1.pdf (accessed on 1 November 2020).
  10. Energy Networks Association. Accelerated Loss of Mains Change Programme. Available online: www.energynetworks.org/electricity/engineering/accelerated-loss-of-mains-change-programme.html (accessed on 1 November 2020).
  11. Ashton, P.M.; Saunders, C.S.; Taylor, G.A.; Carter, A.M.; Bradley, M.E. Inertia Estimation of the GB Power System Using Synchrophasor Measurements. IEEE Trans. Power Syst. 2015, 30, 701–709. [Google Scholar] [CrossRef]
  12. Adrees, A.; Milanović, J.V.; Mancarella, P. Effect of inertia heterogeneity on frequency dynamics of low-inertia power systems. IET Gener. Transm. Distrib. 2019, 13, 2951–2958. [Google Scholar] [CrossRef]
  13. Osbouei, B.A.; Taylor, G.A.; Bronckart, O.; Maricq, J.; Bradley, M. Impact of Inertia Distribution on Power System Stability and Operation. In Proceedings of the IEEE Milan PowerTech, Milan, Italy, 23–27 June 2019. [Google Scholar]
  14. Gonzalez-Longatt, F.; Chikuni, E.; Rashayi, E. Effects of the Synthetic Inertia from wind power on the total system inertia after a frequency disturbance. In Proceedings of the IEEE International Conference on Industrial Technology (ICIT), Cape Town, South Africa, 25–28 February 2013. [Google Scholar]
  15. Junyent-Ferr, A.; Pipelzadeh, Y.; Green, T.C. Blending HVDC-Link Energy Storage and Offshore Wind Turbine Inertia for Fast Frequency Response. IEEE Trans. Sustain. Energy 2015, 6, 1059–1066. [Google Scholar] [CrossRef]
  16. Nguyen, H.T.; Yang, G.; Nielsen, A.H.; Jensen, P.H. Combination of Synchronous Condenser and Synthetic Inertia for Frequency Stability Enhancement in Low-Inertia Systems. IEEE Trans. Sustain. Energy 2019, 10, 997–1005. [Google Scholar] [CrossRef] [Green Version]
  17. Beck, H.P.; Hesse, R. Virtual synchronous machine. In Proceedings of the 9th International Conference on Electrical Power Quality and Utilisation, Barcelona, Spain, 9–11 October 2007. [Google Scholar]
  18. Qoria, T.; Gruson, F.; Colas, F.; Guillaud, X.; Debry, M.S.; Prevost, T. Tuning of Cascaded Controllers for Robust Grid-Forming Voltage Source Converter. In Proceedings of the Power Systems Computation Conference (PSCC), Dublin, Ireland, 11–15 June 2018. [Google Scholar]
  19. National Grid Electricity System Operator. National Grid ESO Outline New Approach to Stability Services in Significant Step Forwards towards a Zero-Carbon Electricity System. Available online: www.nationalgrideso.com/media/national-grid-eso-outline-new-approach-stability-services-significant-step-forwards-towards (accessed on 1 April 2020).
  20. Imris, P.; Bradley, M.; Taylor, G.; Gordon, M.; Li, Y. Enhanced visualisation of Fast Frequency Phenomena as exhibited in the GB transmission system. In Proceedings of the 54th International Universities Power Engineering Conference, Bucharest, Romania, 3–6 September 2019. [Google Scholar]
  21. SP Energy Networks. Visualisation of Real Time System Dynamics using Enhanced Monitoring (VISOR)—Close Down Report. 2018. Available online: www.spenergynetworks.co.uk/pages/visor.aspx (accessed on 1 May 2020).
  22. National Grid. Electricity Ten Year Statement 2018; National Grid Plc.: Warwick, UK, 2018. [Google Scholar]
  23. Rostom, D. Creation of a Reduced Model for the GB Network; National Grid: Warwick, UK, 2013. [Google Scholar]
  24. Imris, P.; Bradley, M.; Taylor, G.; Li, Y. Validation of dynamic GB transmission system models with PMU data for hardware-in-the-loop studies. In Proceedings of the 15th International Conference on Developments in Power System Protection, Liverpool, UK, 9–12 March 2020. [Google Scholar]
  25. NGESO Electricity Ten Year Statement 2020, Appendix A, Figure A5. Available online: https://www.nationalgrideso.com/document/181716/download (accessed on 1 July 2022).
  26. Jalili-Marandi, V.; Ayres, F.J.; Ghahremani, E.; Bélanger, J.; Lapointe, V. A real-time dynamic simulation tool for transmission and distribution power systems. In Proceedings of the IEEE Power & Energy Society General Meeting, Vancouver, BC, Canada, 21–25 July 2013. [Google Scholar]
  27. OPAL-RT. ePHASORSIM User Guide. Available online: www.opal-rt.com/systems-ephasorsim/ (accessed on 1 October 2019).
  28. ComAp. ComAp-MainsPRO. ComAp. Available online: www.comap-control.com/products/detail/mainspro (accessed on 1 April 2020).
Figure 1. United Kingdom electricity production by source: 1980–2018 [2].
Energies 15 06386 g001
Figure 2. GB inertia trend based on FES 2018 data [1].
Energies 15 06386 g002
Figure 3. Zones in the full GB transmission system model: ETYS zones are black and reduced model zones are green. Geographical location of the reduced model zones: the red arrow indicates Zone 01 as based on the ETYS zones.
Energies 15 06386 g003
Figure 4. Substation layout in the Reduced Model (2012), representing a single zone [23].
Energies 15 06386 g004
Figure 5. (a) PowerFactory control block for synchronous generators and (b) HVDC LCC model, as included in the original reduced model [23].
Energies 15 06386 g005
Figure 6. Updated substation layout representing a single zone of the reduced model.
Energies 15 06386 g006
Figure 7. Interconnections between PowerFactory, ePHASORSIM, RT-lab, Target, amplifier, and relay.
Energies 15 06386 g007
Figure 8. The top level of the Simulink model as used in the ePHASORSIM simulation for HIL.
Energies 15 06386 g008
Figure 9. Simplified block diagram of the Simulink model including basic inputs/outputs.
Energies 15 06386 g009
Figure 10. (a) HIL laboratory set up at Brunel University London. (b) The connection of the components: host PC, OPAL-RT target, amplifier Chroma 61,607, and LoM relay.
Energies 15 06386 g010
Figure 11. HVDC trip PMU data (frequency and RoCoF) for the selected locations: Sellindge, Staythorpe, and Dalmally.
Energies 15 06386 g011
Figure 12. Frequency response of the reduced model for the HVDC trip for zones 03, 17, and 28: (a) PowerFactory and (b) ePHASORSIM simulations.
Energies 15 06386 g012
Figure 13. Comparison of PMU data with reduced system simulations in PowerFactory and ePHASORSIM for the HVDC trip: (a) Zone 03 with Sellindge PMU data, (b) Zone 17 with Staythorpe PMU data, and (c) for Zone 28 with Dalmally PMU data.
Energies 15 06386 g013
Figure 14. The MainsPro relay used in the HIL test.
Energies 15 06386 g014
Figure 15. Zone 17 RoCoF variation with infeed loss and system inertia. The value of 100% inertia refers to the HVDC trip on 20 April 2018.
Energies 15 06386 g015
Figure 16. RoCoF for the three zones of interest in the reduced model, for a 1000 MW infeed loss with three levels of inertia (100%, 75%, and 50%).
Energies 15 06386 g016
Figure 17. The geographical evolution of the RoCoF relay tripping as system inertia is reduced. Results are based on a PowerFactory simulation of a 1000 MW infeed loss in the Southeast corner and inertia from 100% to 50%. Red = relay trip, green = no trip.
Energies 15 06386 g017
Table 1. Modified IEEE controller settings for the reduced model AVR, GOV, and PSS.
AVR PARAMETERS-EXST1
Parameter NameValue
Tr Measurement Delay [s]0.02
Tb Filter Delay Time [s]100
Tc Filter Derivative Time Constant [s]5
Ka Controller Gain [p.u.]50
Ta Controller Time Constant [s]0.02
Kc Exciter Current Compensation Factor [p.u.]0.04
Kf Stabilisation Path Gain [p.u.]0.02
Tf Stabilisation Path Delay time [s]0.7
Vimin Controller Minimum Input [p.u.]−0.1
Vrmin Controller Minimum Output [p.u.]−7
Vimax Controller Maximum Input [p.u.]0.1
Vrmax Controller Maximum Output [p.u.]7
GOVERNOR PARAMETERS-TGOV1
Parameter nameValue
T3 Turbine Delay Time Constant [s]300
T2 Turbine Derivative Time Constant [s]0.1
At Turbine Power Coefficient [p.u.]0.1
Dt Frictional Losses Factor [p.u.]−0.1
R Controller Droop [p.u.]0.1
T1 Governor Time Constant [s]150
PN Turbine Rated Power (=0->PN = Pgnn) [MW]0
Vmin Minimum Gate Limit [p.u.]0
Vmax Maximum Gate Limit [p.u.]10
PSS PARAMETERS-STAB1
Parameter nameValue
K Stabilizer Gain [p.u.]150
T Washout integrate time constant [s]20
T2 Second Lead/Lag derivative time constant [s]0.5
T4 Second Lead/Lag delay time constant [s]0.1
T1 First Lead/Lag derivative time constant [s]0.5
T3 First Lead/Lag delay time constant [s]10
HLIM Signal pss maximum [p.u.]0.03
Table 2. Selected locations for validation.
Location of PMU Recorder in the
GB Transmission System
Reduced Model Equivalent Location
Sellindge substationZone 03
Staythorpe substationZone 17
Dalmally substationZone 28
Table 3. Hardware-in-the-loop relay trip results, 1000 MW infeed loss at Zone 03. Yes (red) = tripped; No (green) = not tripped.
H [%]Zone 03Zone 17Zone 28
100NONONO
80NONOYES
70NOYESYES
50YESYESYES
Publisher’s Note: MDPI stays neutral with regard to jurisdictional claims in published maps and institutional affiliations.

