
Dispersion of the Thermodynamically Immiscible Polypropylene and Ethylene—Propylene Triple Synthetic Rubber Polymer Blends Using Supercritical SEDS Process: Effect of Operating Parameters

 ,
, 
Abstract
:1. Introduction
2. Materials and Methods
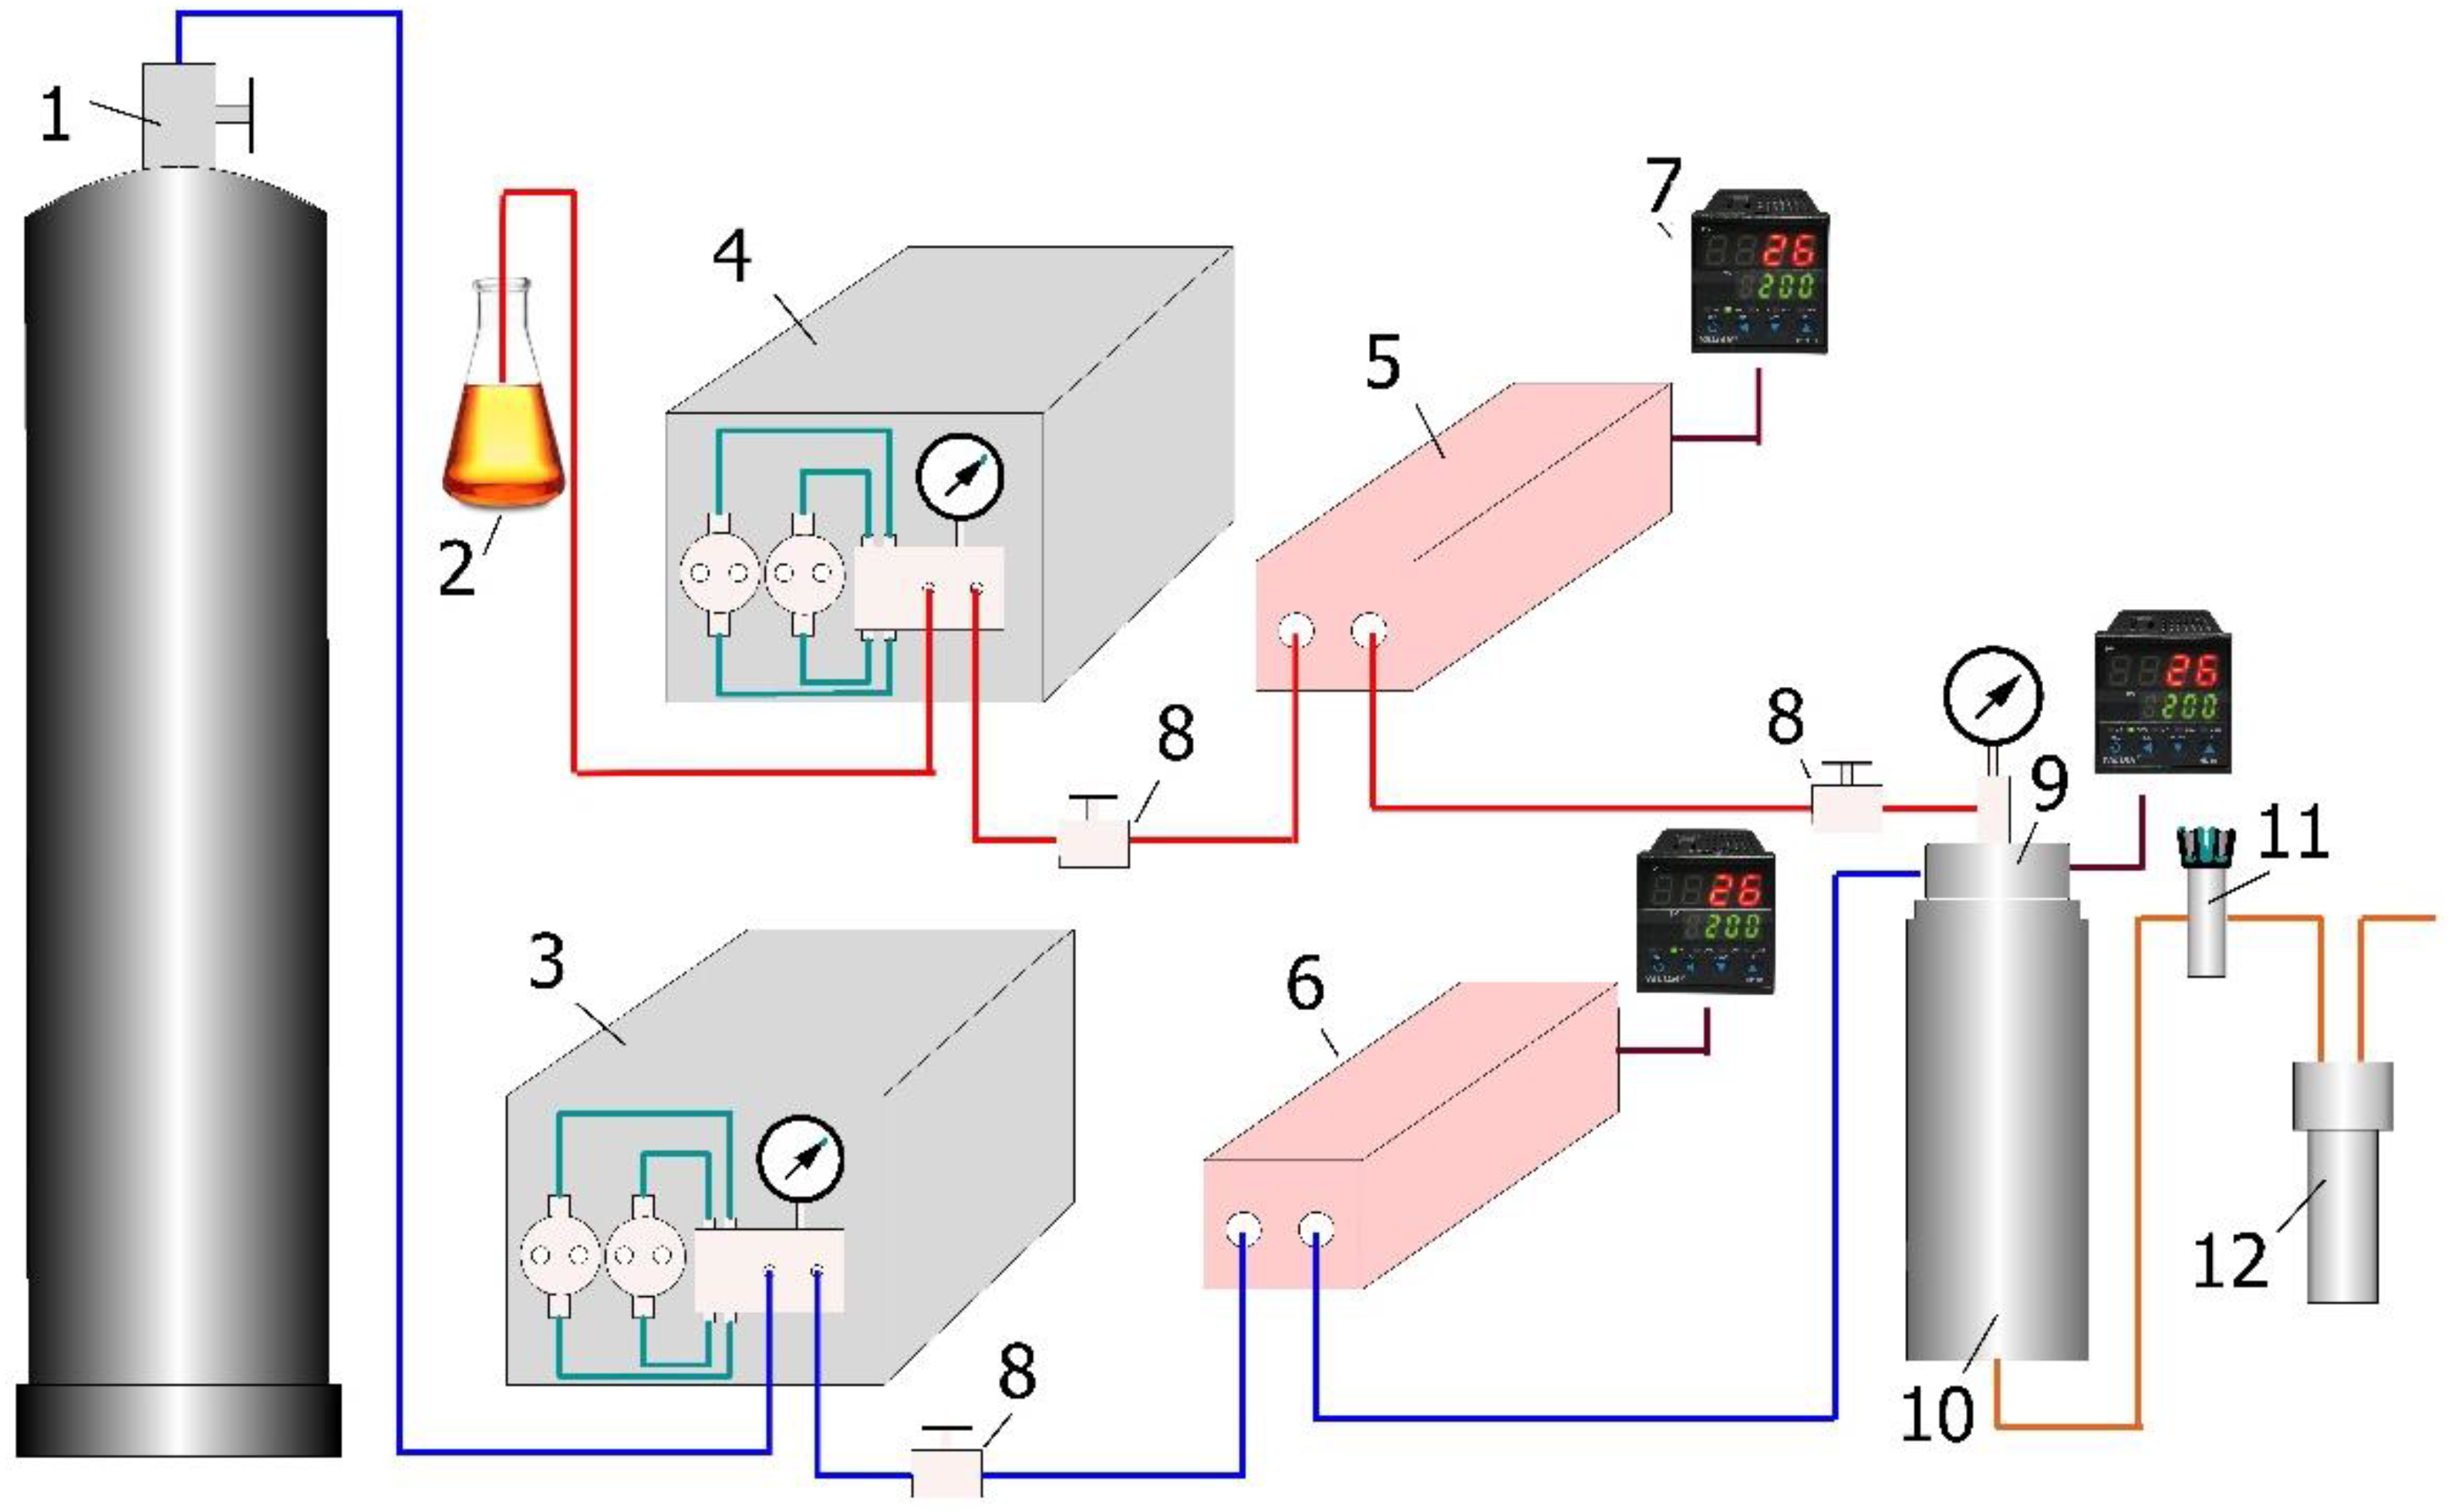
Experimental Method
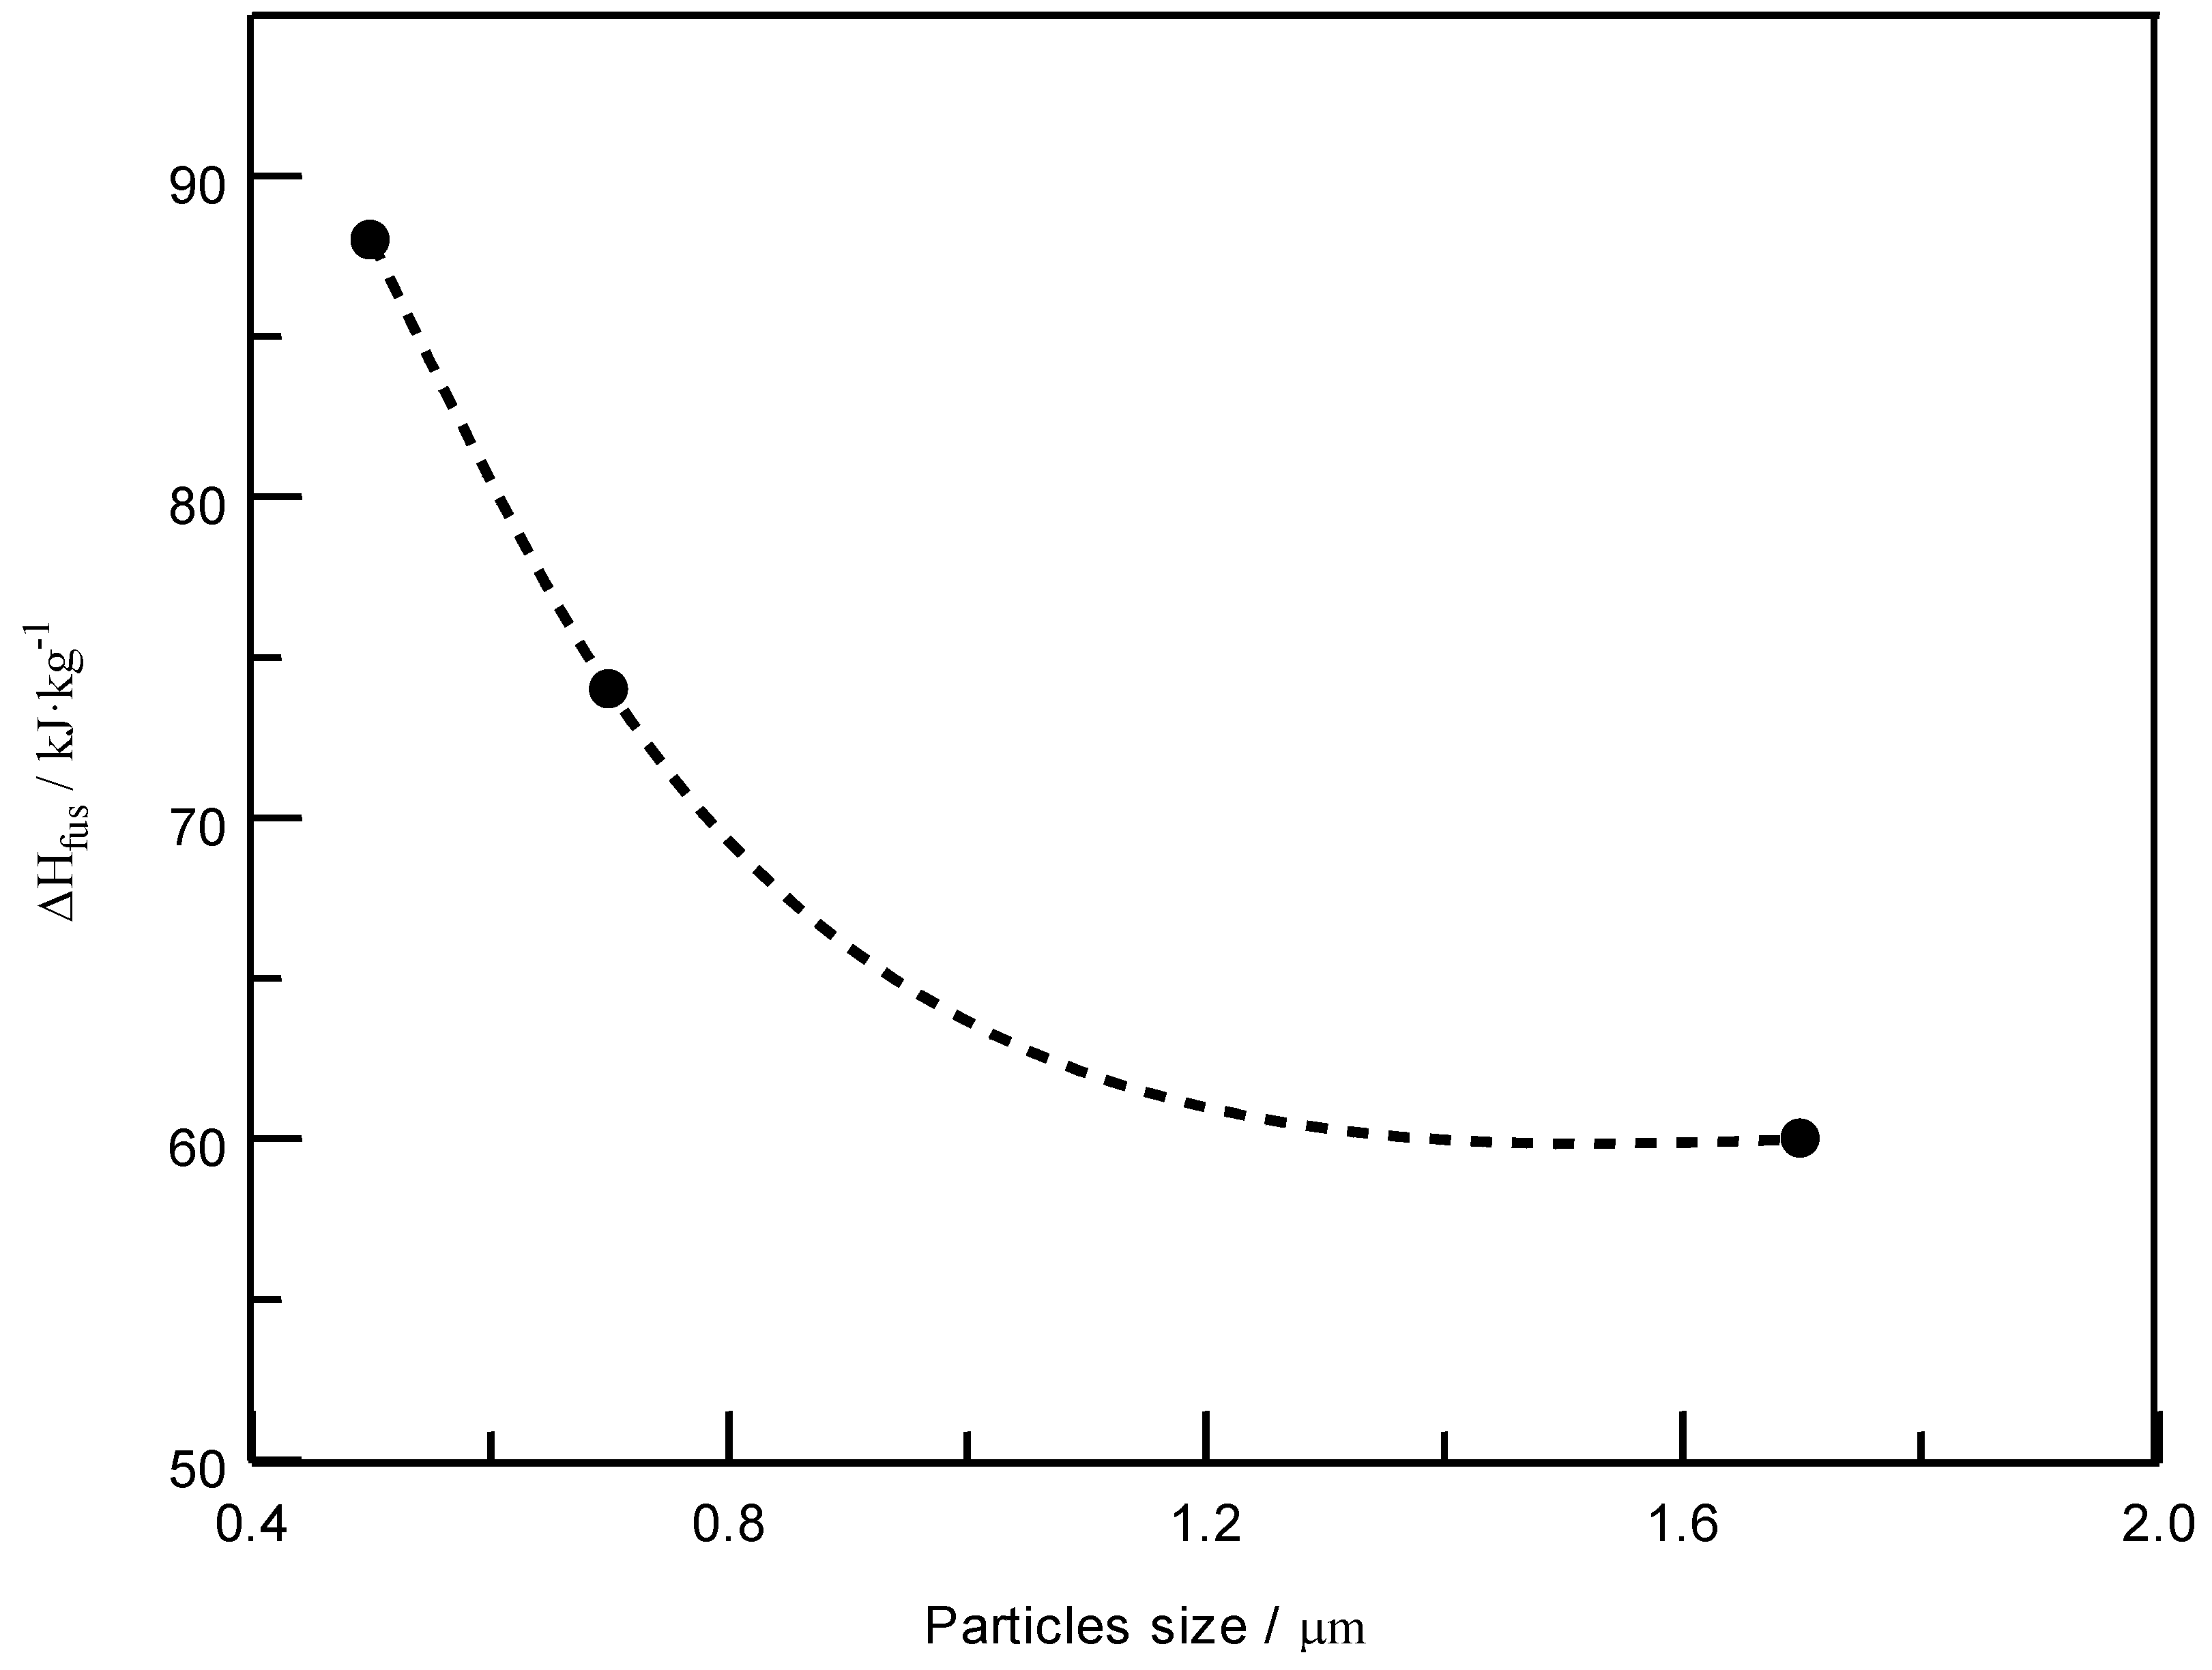
3. Results and Discussion

4. Conclusions
Author Contributions
Funding
Data Availability Statement
Acknowledgments
Conflicts of Interest
References
- Oprișan, G.; Taranu, N.; Munteanu, V.; Enţuc, I. Application of modern polymeric composite materials in industrial construction. Bull. Polytech. Inst. Jassy Constr. Archit. Sect. 2010, 56, 121. [Google Scholar]
- Kolosova, A.S.; Sokolskaya, M.K.; Vitkalova, I.A.; Torlova, A.S.; Pikalov, E.S. Modern polymer composite materials and their application. J. Fund. Res. 2018, 5, 245–256. [Google Scholar]
- Graziano, A.; Jaffer, S.; Sain, M. Review on modification strategies of polyethylene/ polypropylene immiscible thermoplastic polymer blends for enhancing their mechanical behavior. J. Elastomers Plast. 2018, 51, 291–336. [Google Scholar] [CrossRef]
- ACC. Plastics and polymer composites technology roadmap for automotive markets. Am. Chem. Counc. 2014, 1, 1–58. [Google Scholar]
- Kahramanli, Y.N. Incompatible Polymer Blends and Composite Materials Based on Them; ELM: Baku, Azerbaijan, 2013; p. 152. [Google Scholar]
- Manias, E.; Utracki, L.A. Thermodynamics of Polymer Blends. In Polymer Blends Handbook; Utracki, L.A., Wilkie, C.A., Eds.; Springer: Berlin/Heidelberg, Germany, 2014; Chapter 2; pp. 171–280. [Google Scholar] [CrossRef]
- Kuleznev, V.N. Polymer Blends; Chemistry: Moscow, Russia, 1980; p. 304. [Google Scholar]
- Kirsh, I.A. Establishment of Regularities of the Influence of an Ultrasonic Field on the Physicochemical Properties and Structure of Polymer Melts during Their Secondary Processing. Ph.D. Thesis, Ivanova State Chemical-Technological University, Ivanova, Russia, 2016. [Google Scholar]
- Twe, T.M.; Moreeva, D.V.; Mamonova, I.Y. Study of the properties of polypropylene modified with ethylene-propylene rubbers. Plast. Mass 2007, 2, 36–39. [Google Scholar]
- Novokshonov, V.V.; Musin, I.N.; Kimelblat, V.I. Synergism in Mixtures of PP and EPA. In Proceedings of the International Conference Structure and Dynamics of Molecular Systems, Yoshkar-Ola, Russia, 29 June 2009; Publishing House of the Mari State Technical University: Yoshkar-Ola, Russia, 2009; p. 158. [Google Scholar]
- Trofimova, D.D.; Novikov, L.V.; Kompaniets, E.V. Influence of conditions for obtaining rubber-based plastics based on rubber crumb and LDPE on their mechanical properties. Plast. Mass 2002, 1, 38–39. [Google Scholar]
- Kemmere, M.F.; Meyer, T. Supercritical Carbon Dioxide in Polymer Reaction Engineering; WILEY-VCH VerlagGmbH: Hoboken, NJ, USA, 2005; p. 1131. [Google Scholar] [CrossRef]
- Gumerov, F.M.; Sabirzyanov, A.N.; Gumerova, G.I. Sub- and Supercritical Fluids in Polymer Processing Processes; FEN Publ.: Kazan, Russia, 2000. [Google Scholar]
- Kazarian, S.G. Polymer processing with supercritical fluids. Polym. Sci. Ser. C. 2000, 42, 78–101. [Google Scholar]
- Cardea, S.; Reverchon, E. Supercritical fluid processing of polymers. Polymers 2019, 11, 1551. [Google Scholar] [CrossRef]
- Gil’mutdinov, I.M.; Khairutdinov, V.F.; Kuznetsova, I.V.; Mukhamadiev, A.A.; Gabitov, F.R.; Gumerov, F.M.; Sabirzyanov, A.N. The dispersion of polymeric materials using supercritical fluids. Russ. J. Phys. Chem. B. 2009, 3, 1145–1153. [Google Scholar] [CrossRef]
- Kiran, E. Supercritical fluids and polymers. J. Supercrit. Fluids 2016, 110, 126–153. [Google Scholar] [CrossRef]
- Yeo, S.D.; Kiran, E. Formation of polymer particles with supercritical fluids: A Review. J. Supercrit. Fluids 2005, 34, 287–308. [Google Scholar] [CrossRef]
- Jung, J.; Perrut, M. Particle design using supercritical fluids: Literature and Patent Survey. J. Supercrit. Fluids 2001, 20, 179–219. [Google Scholar] [CrossRef]
- Knez, M.; Škerget, M.; Knez, H.; Čuček, D. Particle formation using sub- and supercritical fluids. In Supercritical Technology for Energy and Environmental Applications; Elsevier: Amsterdam, The Netherlands, 2014; Chapter 2; pp. 31–67. [Google Scholar] [CrossRef]
- Weber, M.; Thesis, M.S. Supercritical Fluid Technology in Materials Science and Engineering: Synthesis, Properties, and Applications; Sun, Y.P., Ed.; Marcel, Dekker: New York, NY, USA, 2002; p. 387. [Google Scholar]
- Yang, L.; Huang, J.-M.; Zu, Y.-G.; Ma, C.-H.; Wang, H.; Sun, X.-W.; Sun, Z. Preparation and radical scavenging activities of polymeric procyanidins nanoparticles by a supercritical antisolvent (SAS) process. Food Chem. 2011, 128, 1152–1159. [Google Scholar] [CrossRef]
- Guaman-Balcazar, M.C.; Montes, A.; Pereyra, C.; Martinez de la Ossa, E. Production of submicron particles of the antioxidants of mango leaves/PVP by supercritical antisolvent extraction process. J. Supercrit. Fluids 2019, 143, 294–304. [Google Scholar] [CrossRef]
- Khairutdinov, V.F.; Gabitov, F.R.; Gumerov, F.M.; Le Neindre, B.; Vorob’ev, E.S. Thermodynamic principles of the dispersion of polycarbonate by the SAS method. Russ. J. Phys. Chem. B 2011, 5, 1228–1239. [Google Scholar] [CrossRef]
- Ghaderi, R.; Artursson, P.; Carlfors, J. Preparation of biodegradable microparticles using solution-enhanced dispersion by supercritical fluids (SEDS). Pharm. Res. 1999, 16, 676–681. [Google Scholar] [CrossRef]
- Russell, T.; Dehghani, F.; Foster, N.R. Current issues relating to antisolvent micronisaton techniques and their extension to industrial scales. J. Supercrit. Fluids 2001, 21, 159–177. [Google Scholar] [CrossRef]
- Vemavarapu, C.; Mollan, M.J.; Lodaya, M.; Needham, T.E. Design and process aspects of laboratory scale SCF particle formation systems. Int. J. Pharm. 2005, 292, 1–16. [Google Scholar] [CrossRef]
- Reverchon, E.; Adami, R. Nanomaterials and supercritical fluids. J. Supercrit. Fluids 2006, 37, 1–22. [Google Scholar] [CrossRef]
- Tabernero, A.; del Valle, E.M.; Galán, M.A. Supercritical fluids for pharmaceutical particle engineering: Methods, basic fundamentals and modeling. Chem. Eng. Proc. 2012, 60, 9–25. [Google Scholar] [CrossRef]
- Reverchon, E. Supercritical anti-solvent precipitator of micro- and nanoparticles. J. Supercrit. Fluids 1999, 15, 1–21. [Google Scholar] [CrossRef]
- Khabriev, I.S.; Patrusheva, M.N.; Khairutdinov, V.F.; Khuzakhanov, R.M.; Gumerov, F.M.; Garipov, R.M. Crystallization of polymer mixtures in the course of their solution-enhanced dispersion by supercritical fluids. Russ. J. Phys. Chem. B 2018, 12, 1229–1239. [Google Scholar] [CrossRef]
- Khairutdinov, V.F.; Gumerov, F.M.; Khabriev, I.S. Supercritical fluid media in challenges of substance and material dispersion. J. Therm. Sci. 2019, 28, 519–546. [Google Scholar] [CrossRef]
- Khabriev, I.S.; Khairutdinov, V.F.; Gumerov, F.M.; Khuzakhanov, R.M.; Garipov, R.M.; Abdulagatov, I.M. VLE properties and the critical parameters of ternary mixture of CO2 + toluene/dichloromethane involved in the SEDS precipitation process. J. Mol. Liquids. 2021, 337, 116371. [Google Scholar] [CrossRef]
- Ivanova, A.V.; Danilov, V.A.; Kolyamshin, O.A.; Ushmarin, N.F.; Kol’tsov, N.I.; Khasanov, A.I. The effect of maleinimides on the properties of a rubber compound based on nitrile butadiene rubber. Int. Polym. Sci. Technol. 2015, 42, 19–22. [Google Scholar] [CrossRef]
- Tsvetkov, V.N.; Eskin, V.E.; Frenkel, S.Y. The Structure of Macromolecules in Solutions; Nauka: Moscow, Russia, 1964; p. 719. [Google Scholar]
- Lipatov, Y.S.; Nesterov, A.E.; Gritsenko, T.M.; Veselovskii, R.A. Handbook of Polymer Chemistry; Naukova Dumka: Kiev, Ukraine, 1971; p. 536. [Google Scholar]
- Morris, W.O.; Donohue, M.D.D. Vapor-liquid equilibria in mixtures containing carbon dioxide, toluene, and I-methylnaphthalene. J. Chem. Eng. Data 1985, 30, 259–263. [Google Scholar] [CrossRef]
- Wu, W.; Ke, J.; Poliakoff, M. Phase Boundaries of CO2 + Toluene, CO2 + Acetone, and CO2 + Ethanol at High Temperatures and High Pressures. J. Chem. Eng. Data 2006, 51, 1398–1403. [Google Scholar] [CrossRef]
- Lee, K.-R.; Tan, C.-S. Vapor-Liquid Equilibria for the 1,1,1,2-Tetrafluoroethane + m-Cresol and + p-Cresol and 1,1,1,2-Tetrafluoroethane + m-Cresol + p-Cresol Systems. J. Chem. Eng. Data 1998, 43, 354–357. [Google Scholar] [CrossRef]
- Fink, S.D.; Hershey, C.H. Modeling the Vapor-liquid equilibria of 1,1,1 -trichloroethane + carbon dioxide and toluene + carbon dioxide at 308, 323, and 353 K. Ind. Eng. Chem. Res. 1990, 29, 295–306. [Google Scholar] [CrossRef]
- Ng, H.J.; Robinson, D.B. Equilibrium phase properties of the toluene-carbon dioxide system. J. Chem. Eng. Data 1978, 23, 325–327. [Google Scholar] [CrossRef]
- Walther, D.; Platzer, B.; Maurer, G. High-pressure (vapour + liquid) equilibria of (carbon dioxide + methylbenzene or 1,2-dimethylbenzene or 1,3-dimethylbenzene or 1,4-dimethyl benzene) at temperatures between 313 K and 393 K and pressures up to 17.3 MPa. J. Chem. Thermodyn. 1992, 24, 387–399. [Google Scholar] [CrossRef]


| Polymers | Melting Temperature °C | Heat of Fusion |
|---|---|---|
| PP-01030 | 160–168 | 92.3 |
| EPTSR-50 1 | Tg −50 | - |
| Solvent/Polymer | Solubility Parameter/ (cal/cm3)1/2 |
|---|---|
| Polypropylene | 8.20 |
| EPTSR | 8.00 |
| Toluene | 8.97 |
| Chloroform | 9.30 |
| No. | Polymers | P, MPa |
|---|---|---|
| 1 | PP-01030 (100%) | 8 |
| 2 | EPTSR-50 (100%) | 8 |
| 3 | PP-01030 (75%)/ EPTSR-50 (25%) | 8 |
| 4 | PP-01030 (75%)/ EPTSR-50 (25%) | 15 |
| 5 | PP-01030 (75%)/ EPTSR-50 (25%) | 25 |
| 6 | PP-01030 (75%)/ EPTSR-50 (25%) | 15 |
| 7 | PP-01030 (50%)/ EPTSR-50 (50%) | 8 |
| 8 | PP-01030 (25%)/ EPTSR-50 (75%) | 8 |
| Polymer Blend Composition | Melt Blending Method | Blending in the SC CO2 (SEDS Method) | ||
|---|---|---|---|---|
| °C | Total | °C | Total | |
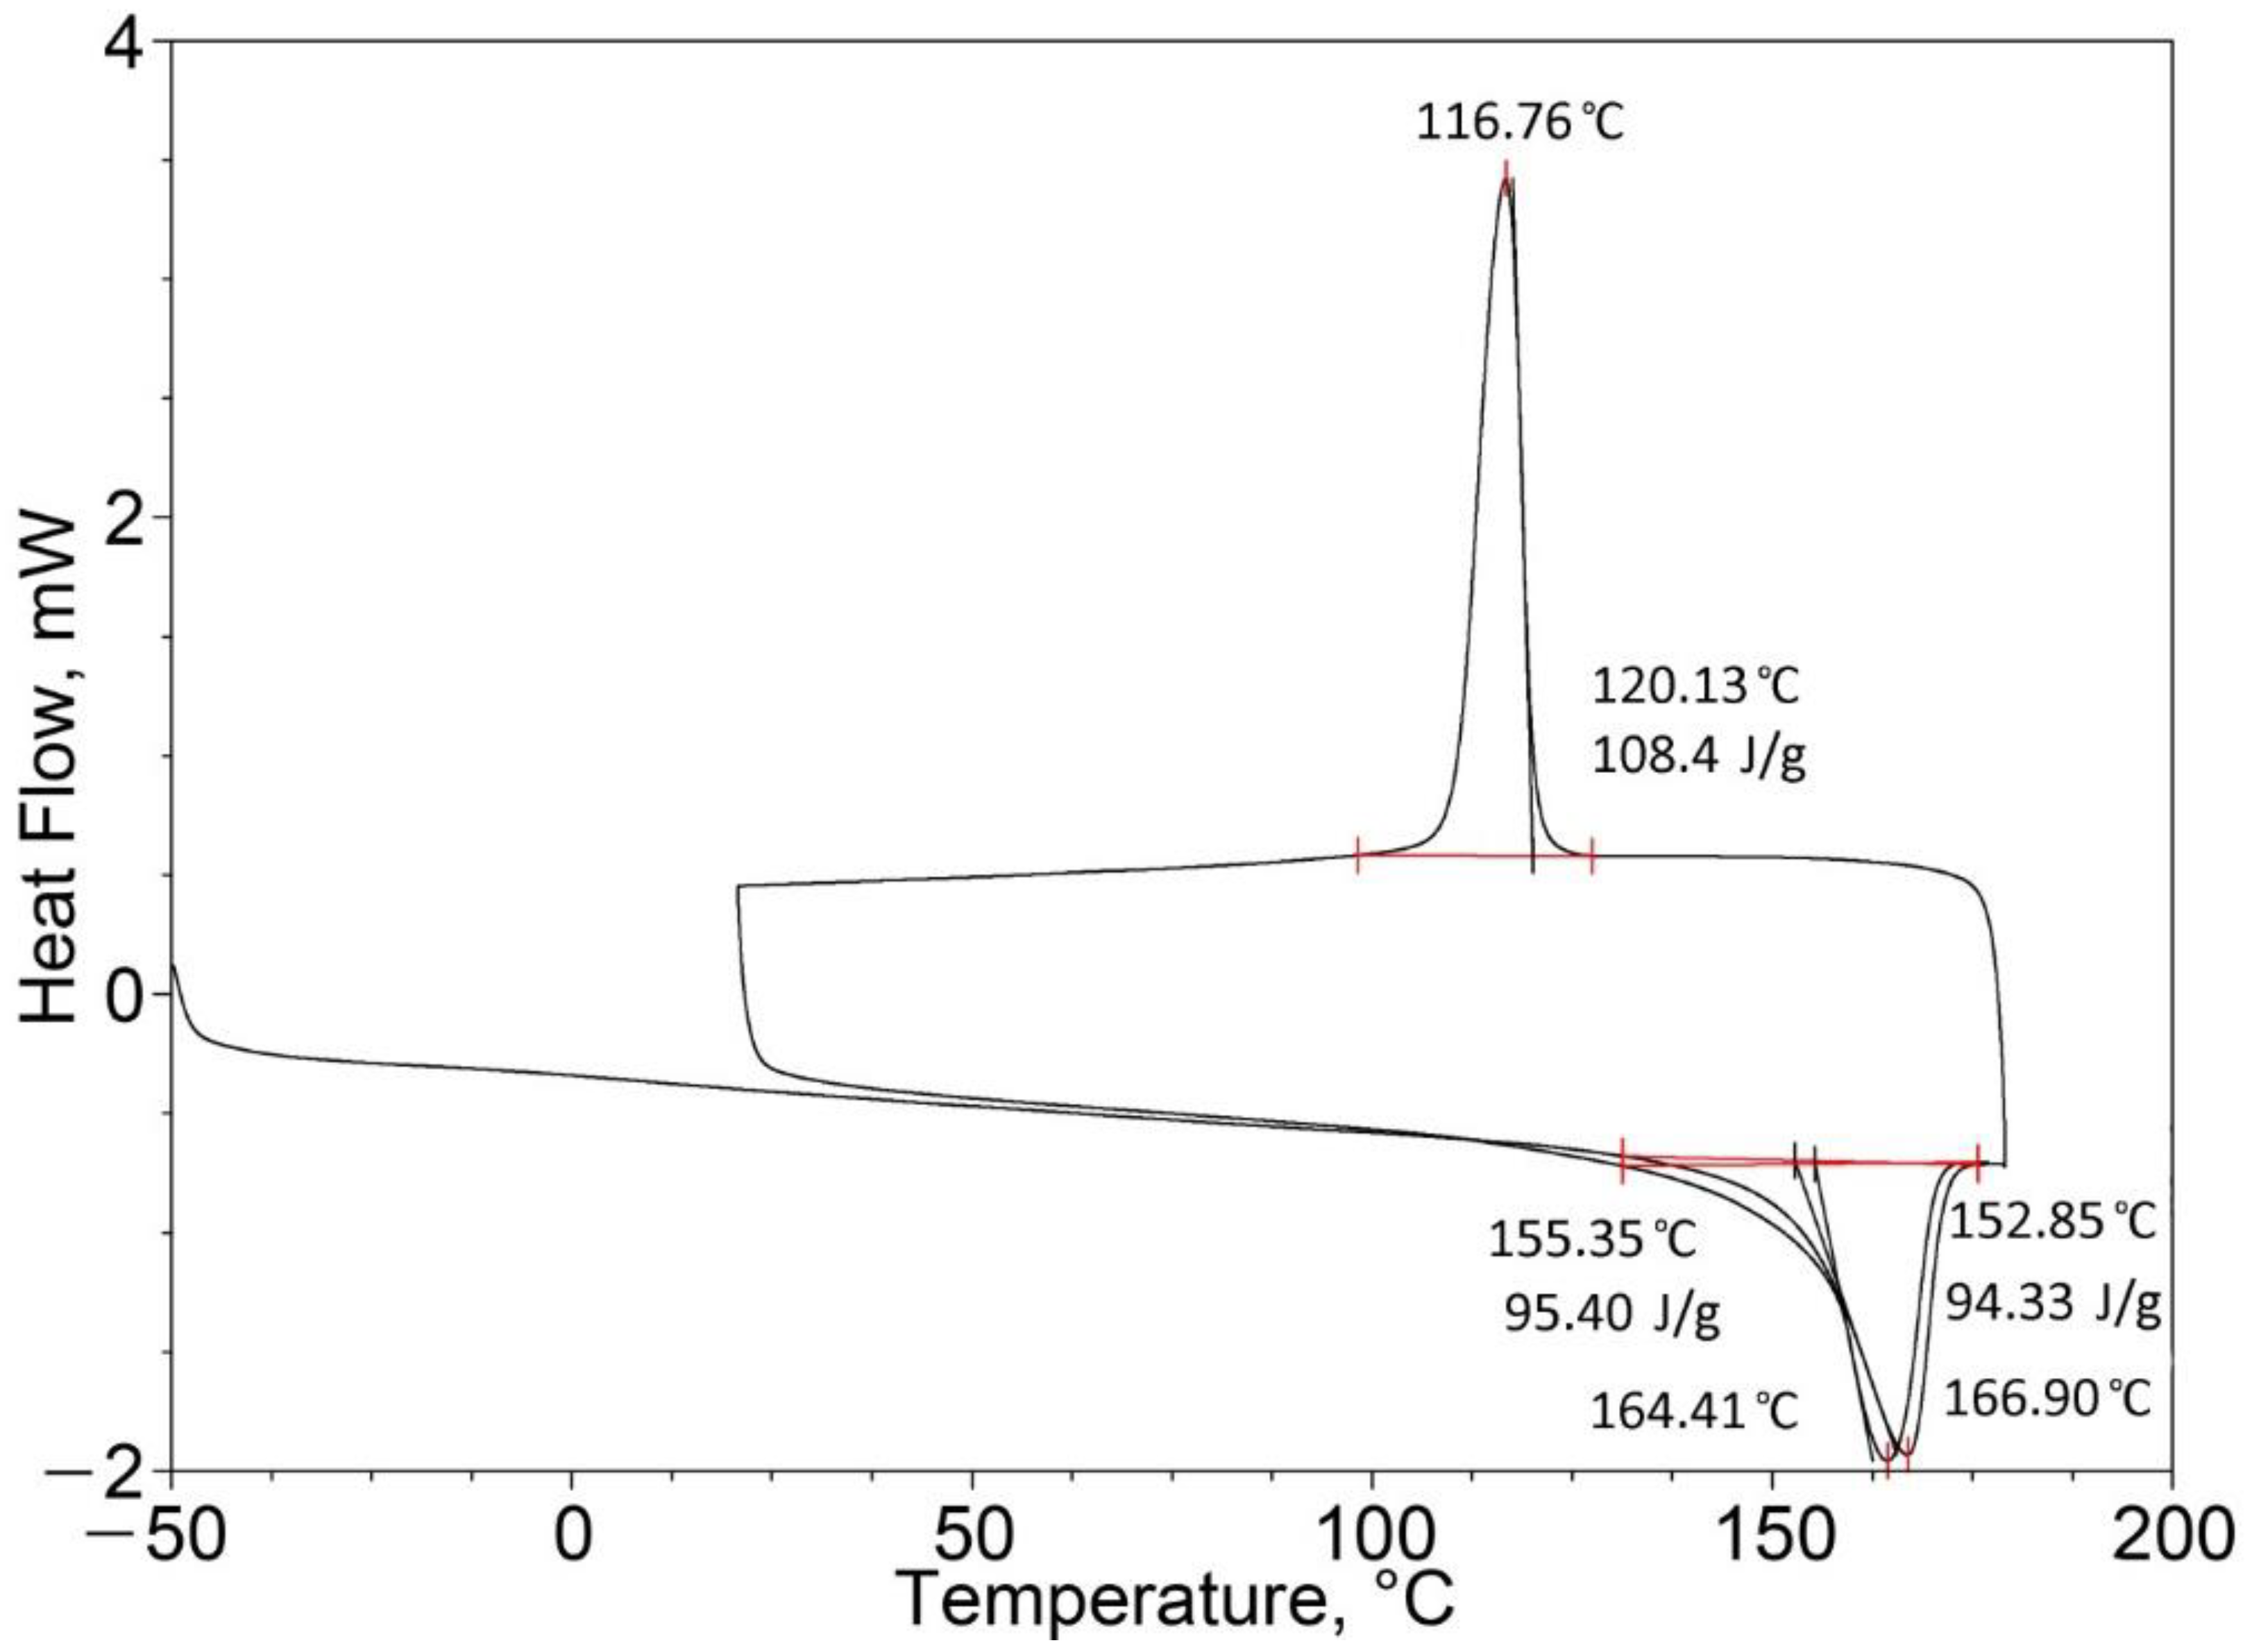
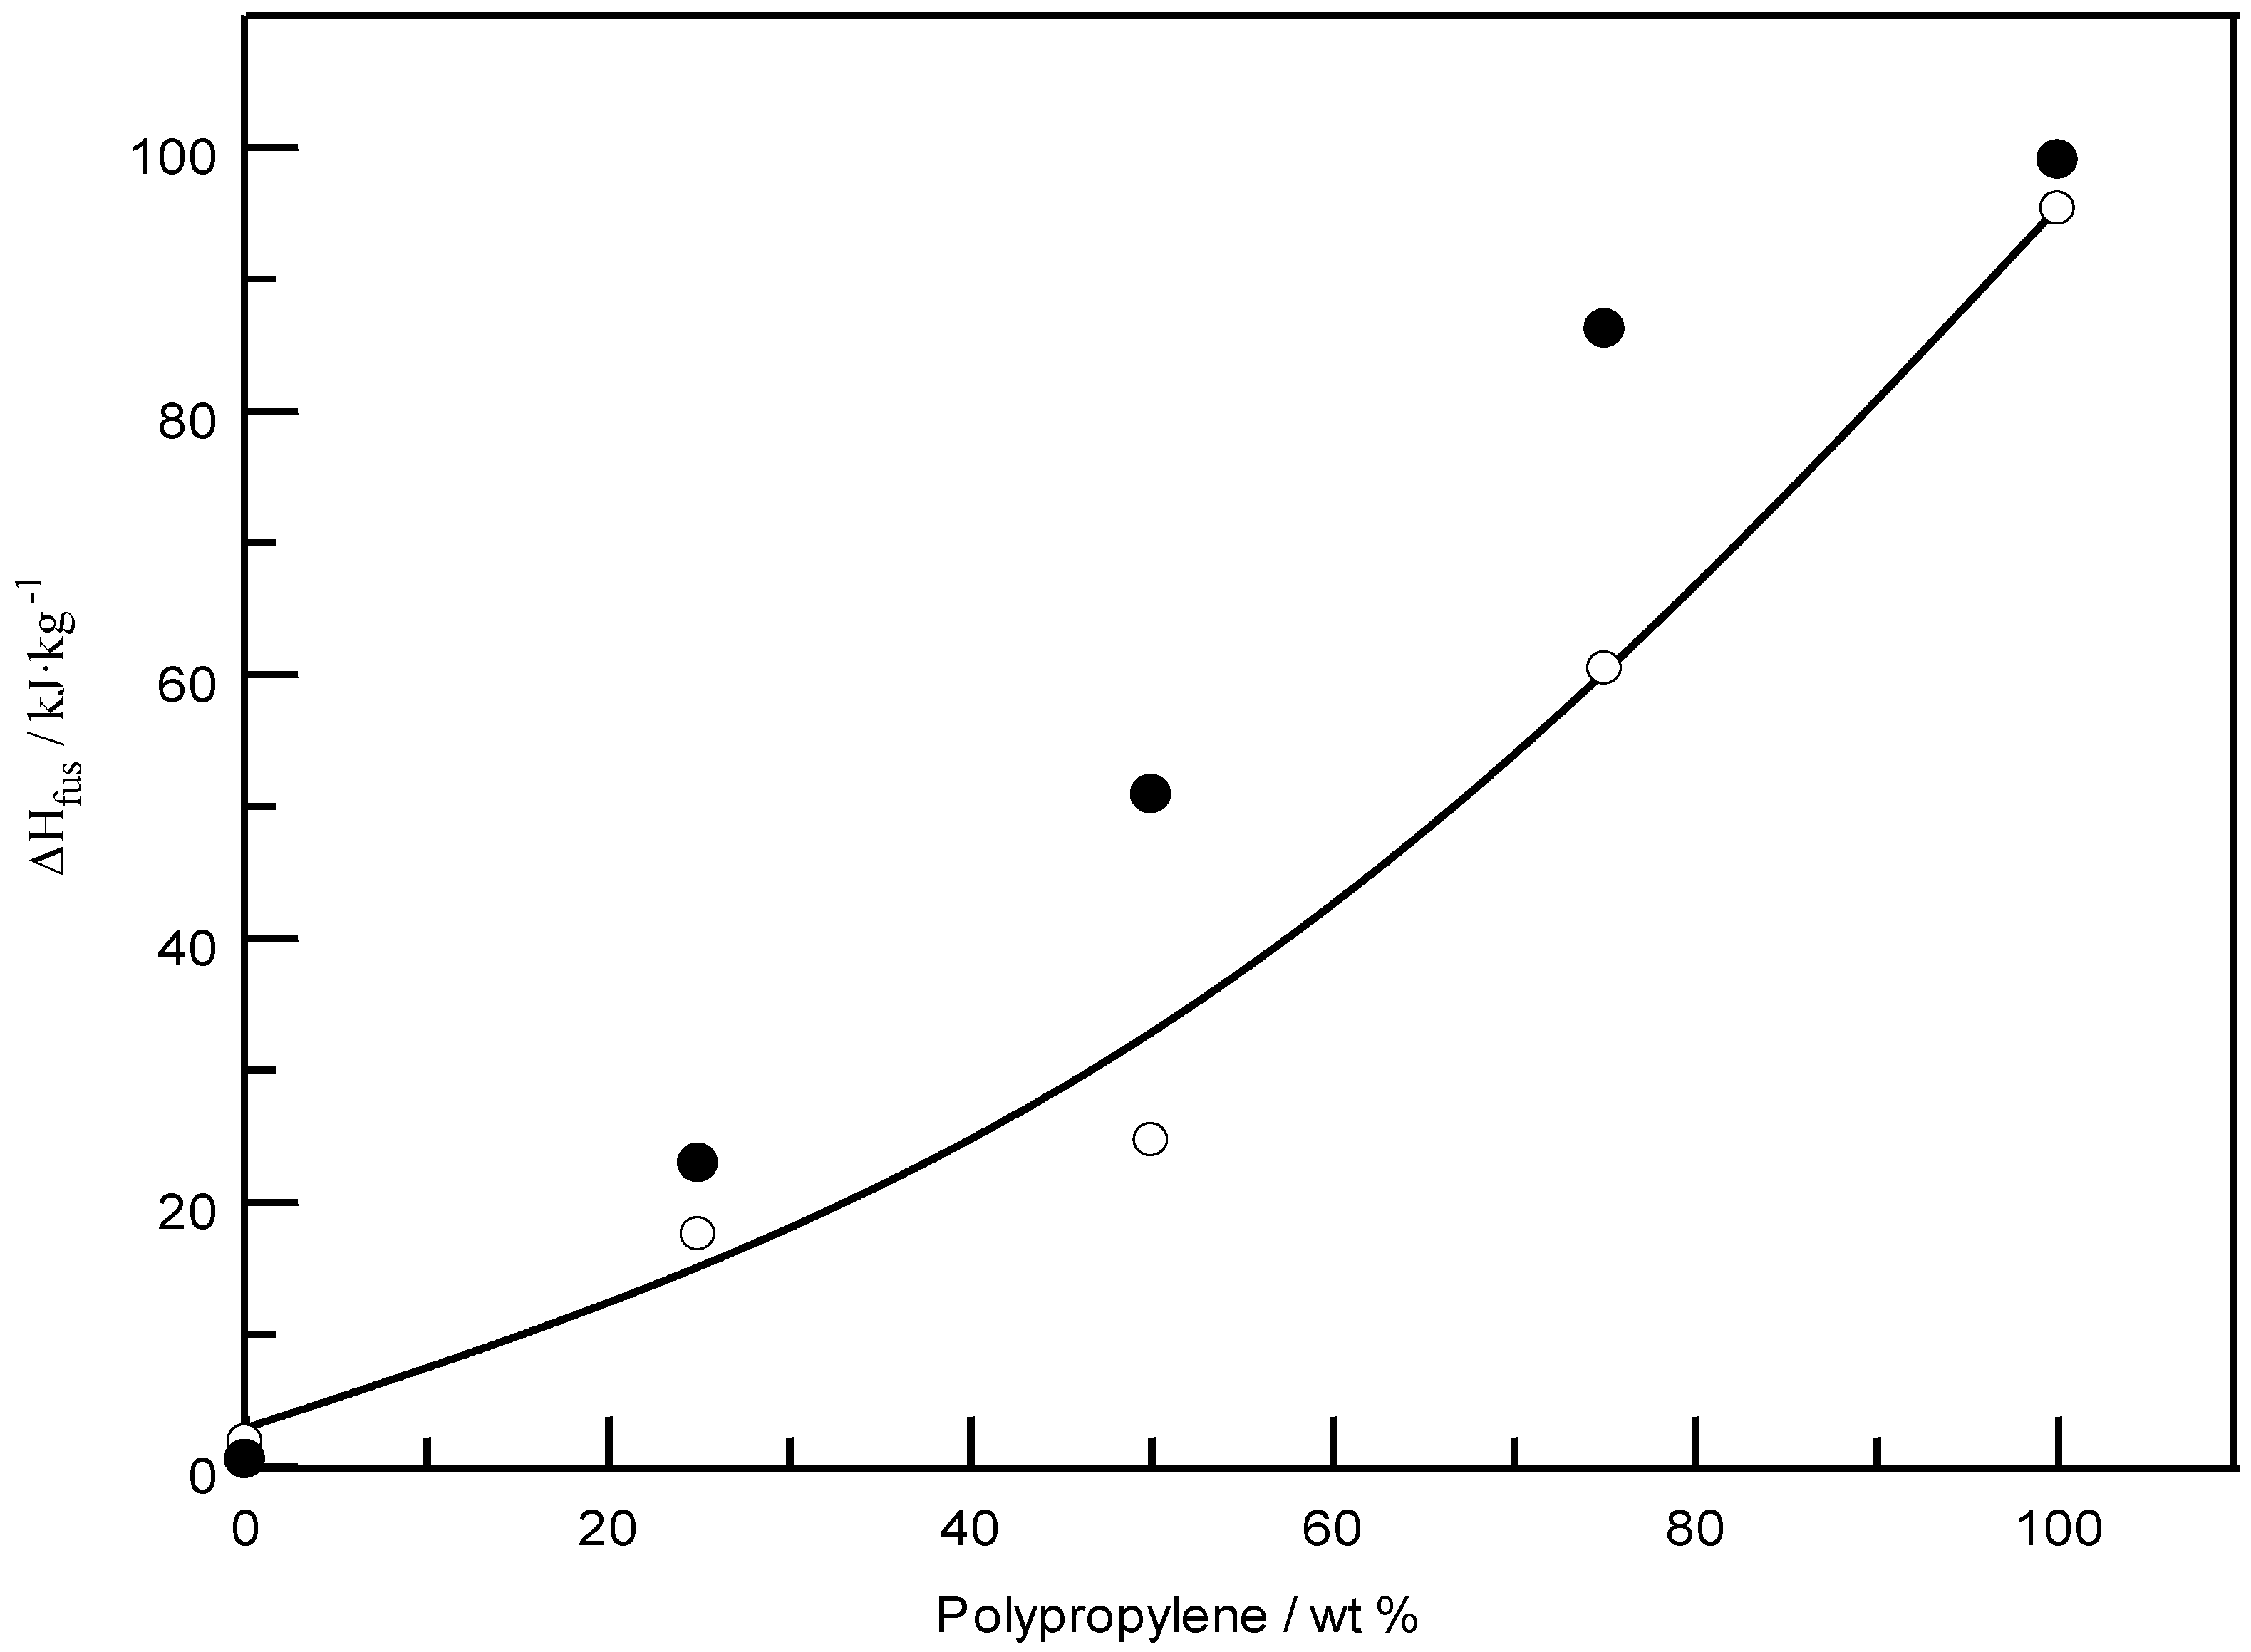
| Pure PP (100%) | 164.41 | 95.40 | 164.79 (one peak) | 99.08 |
| Pure EPTSR (100%) | 77.42 | 1.88 | 129.02 (one peak) | 0.49 |
| PP (25%)/EPTSR (75%) | 39.96 163.95 (two peaks) | 17.60 | 71.65 162.82 (two peaks) | 22.95 |
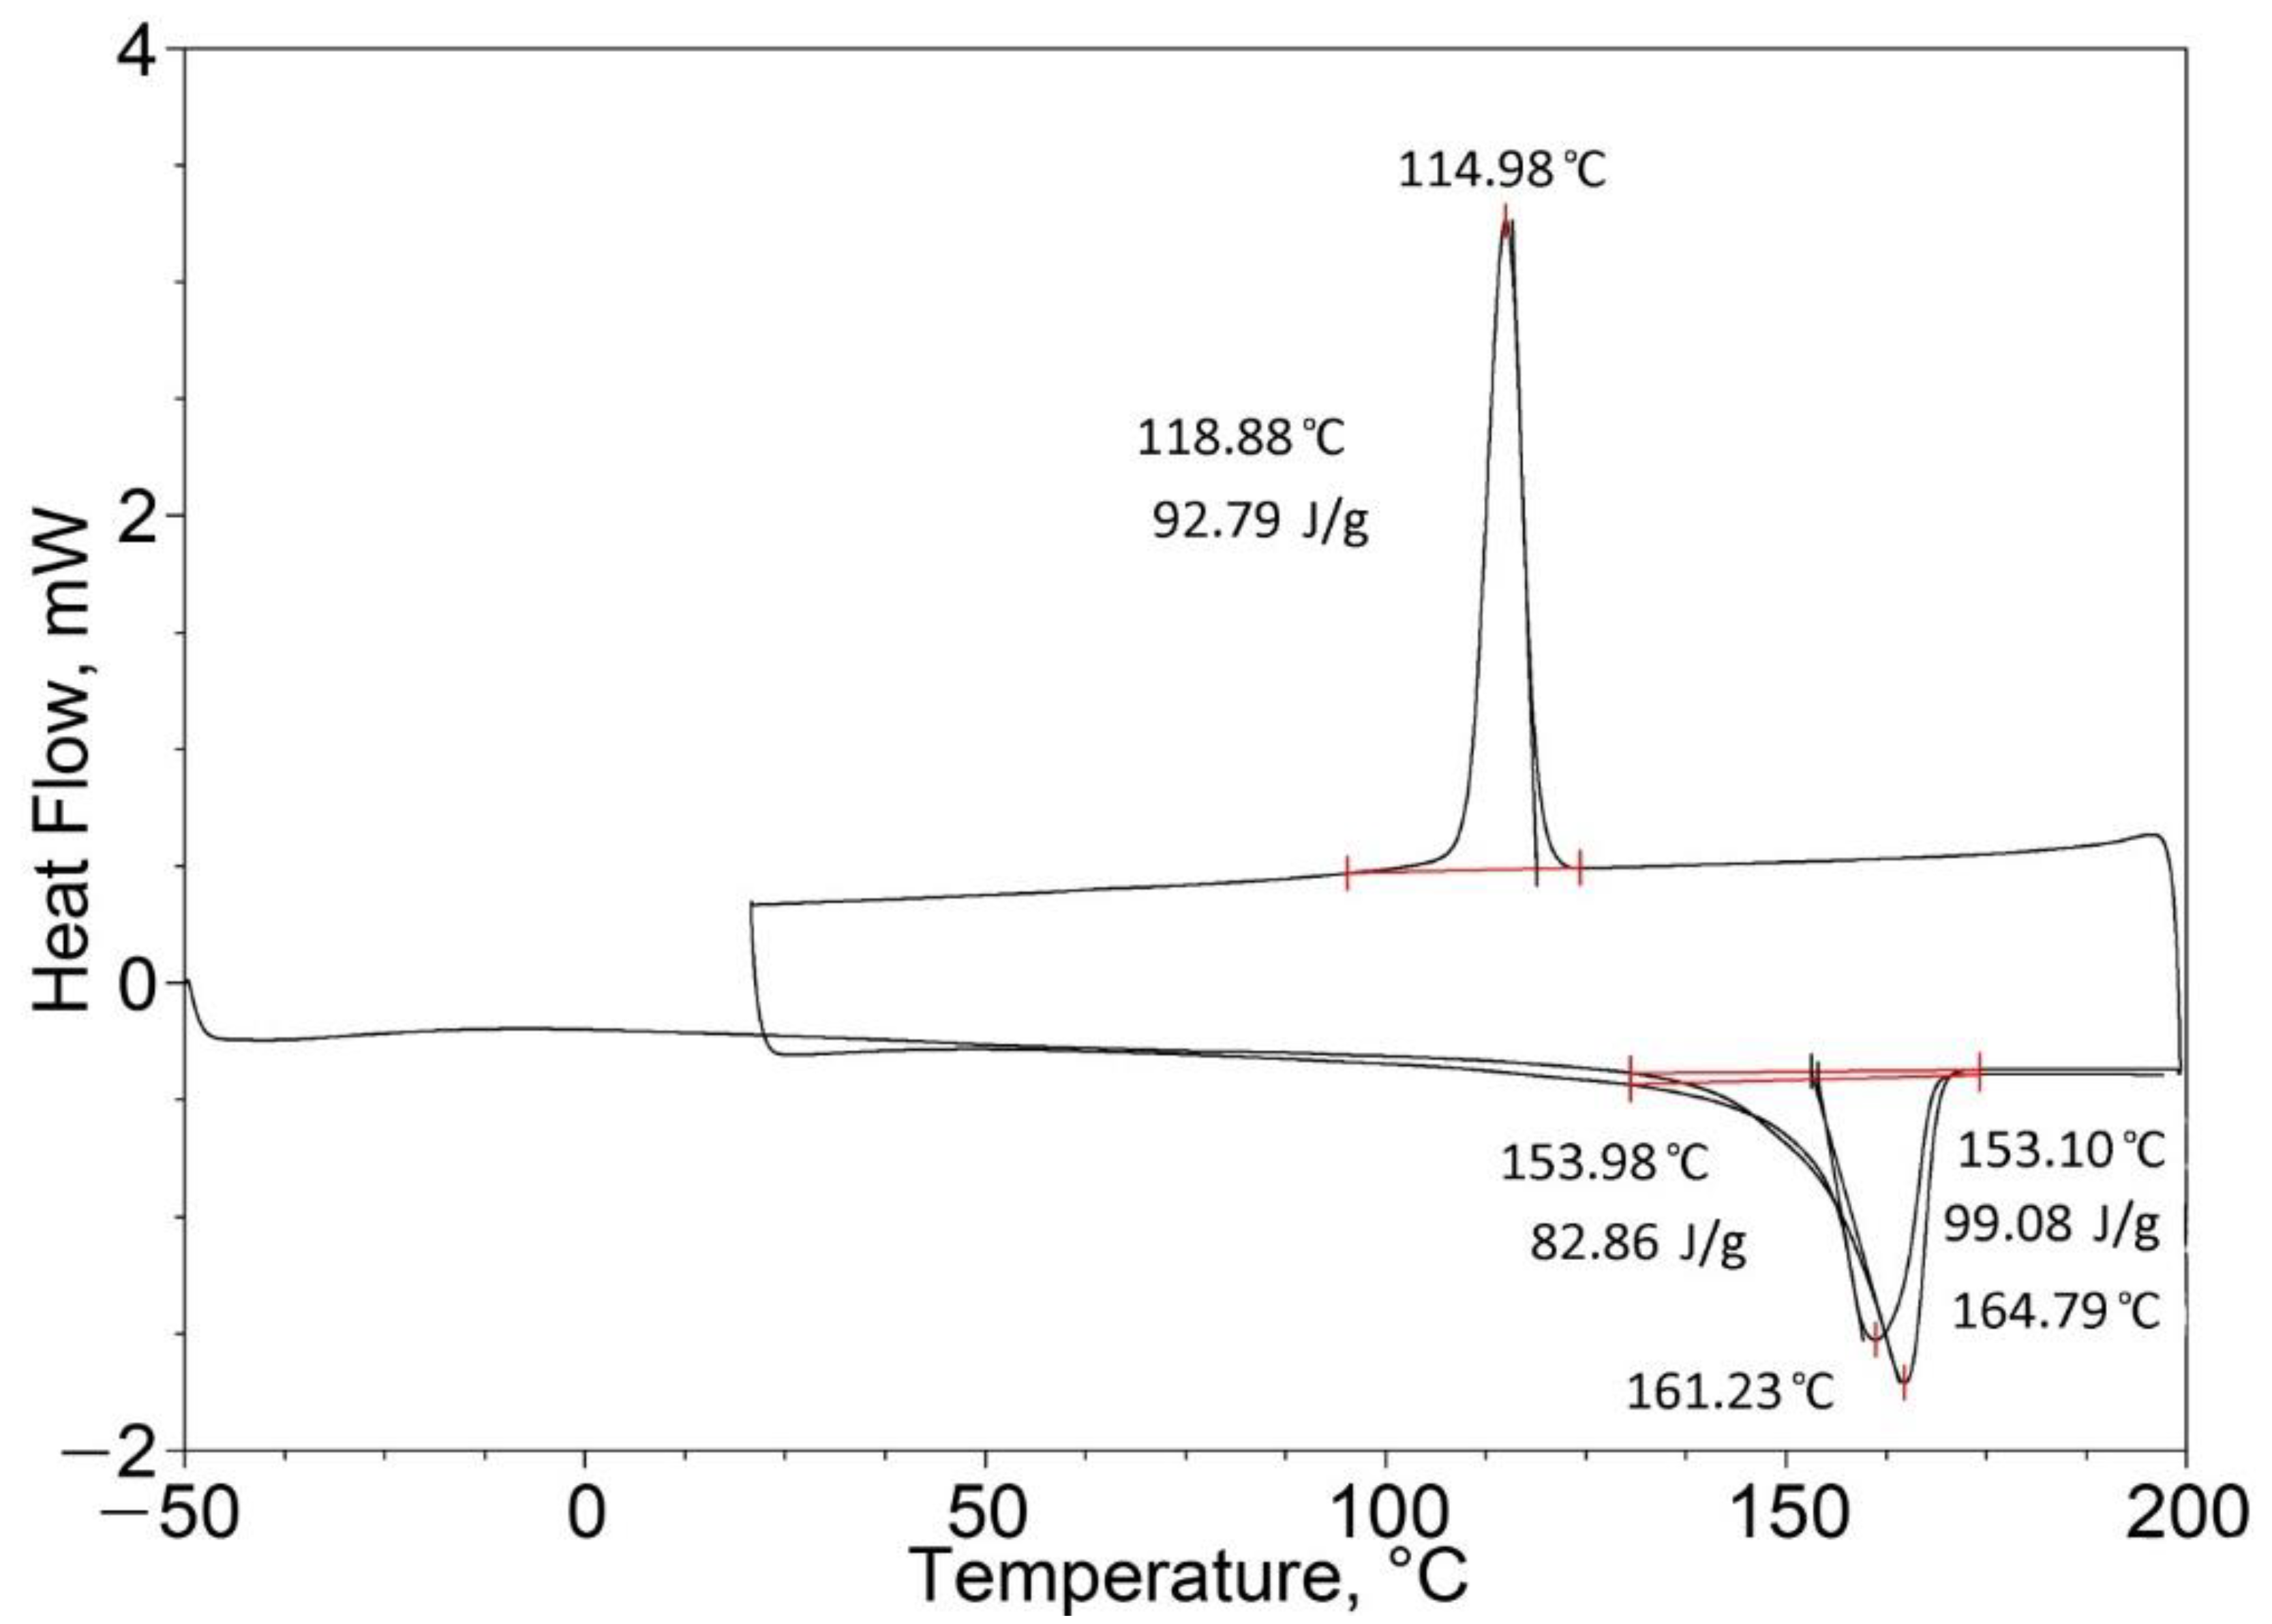
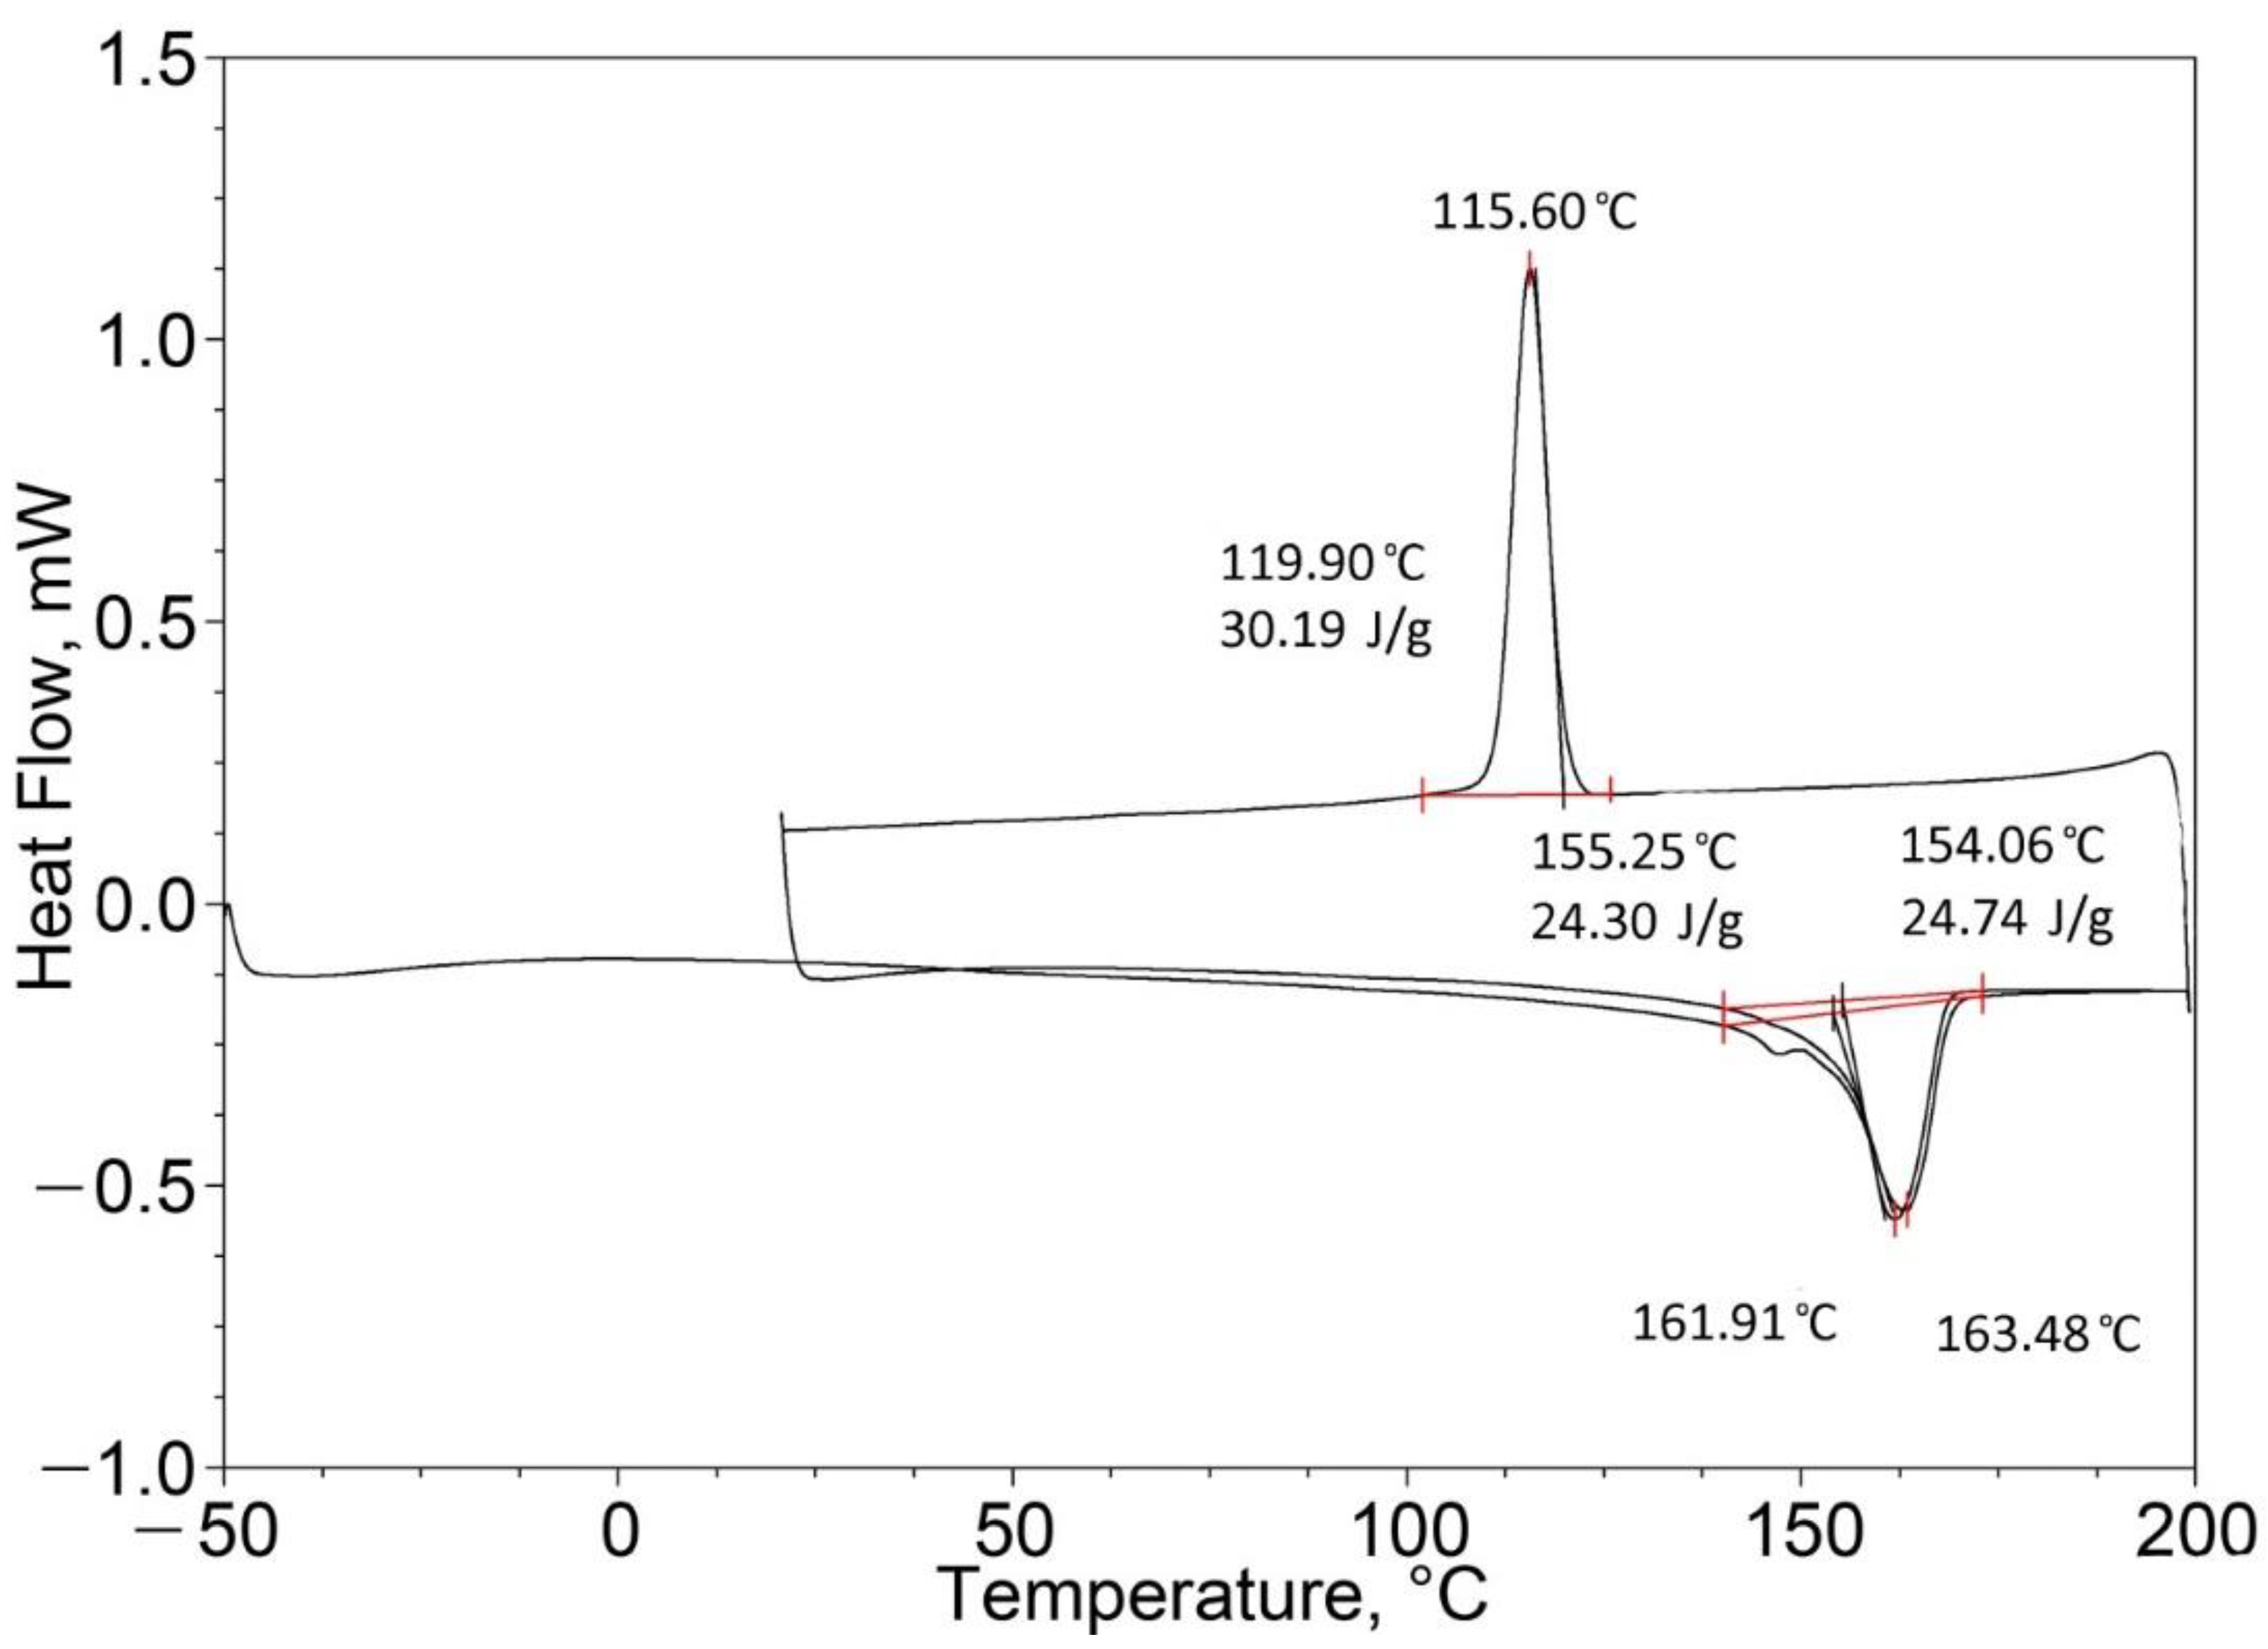
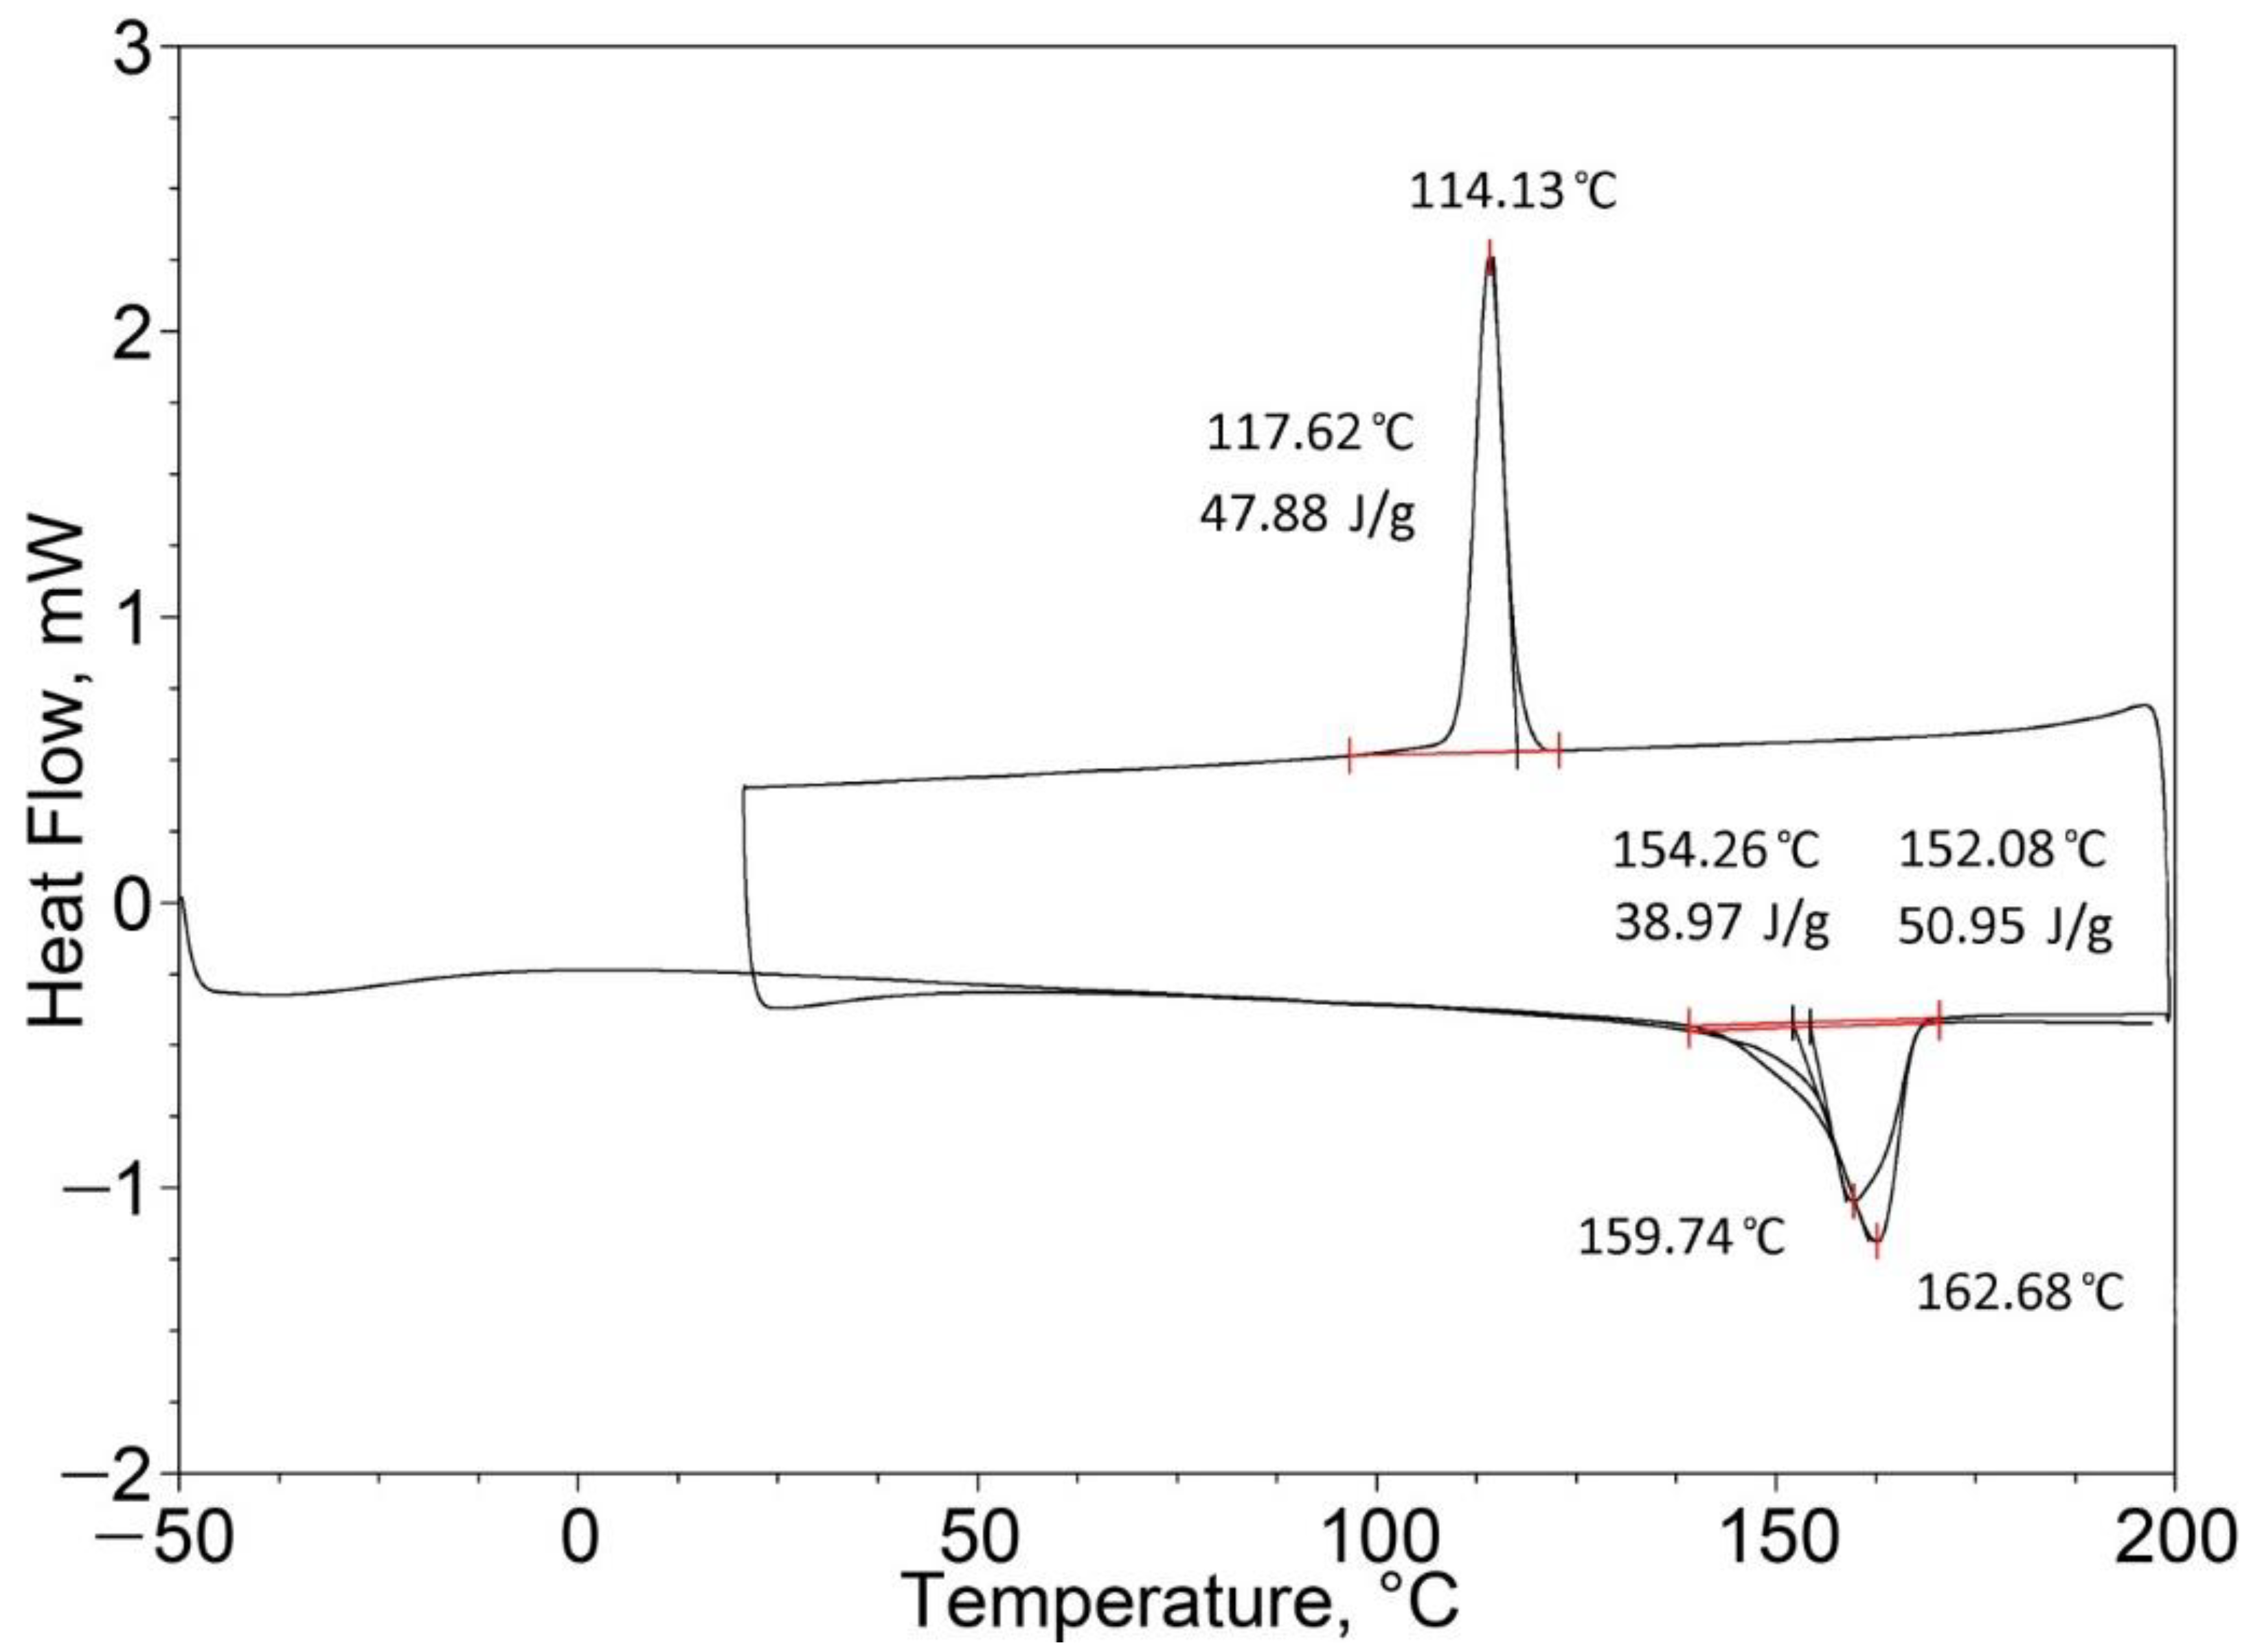
| PP (50%)/EPTSR (50%) | 163.48 (one peak) | 24.74 | 162.68 (one peak) | 50.95 |
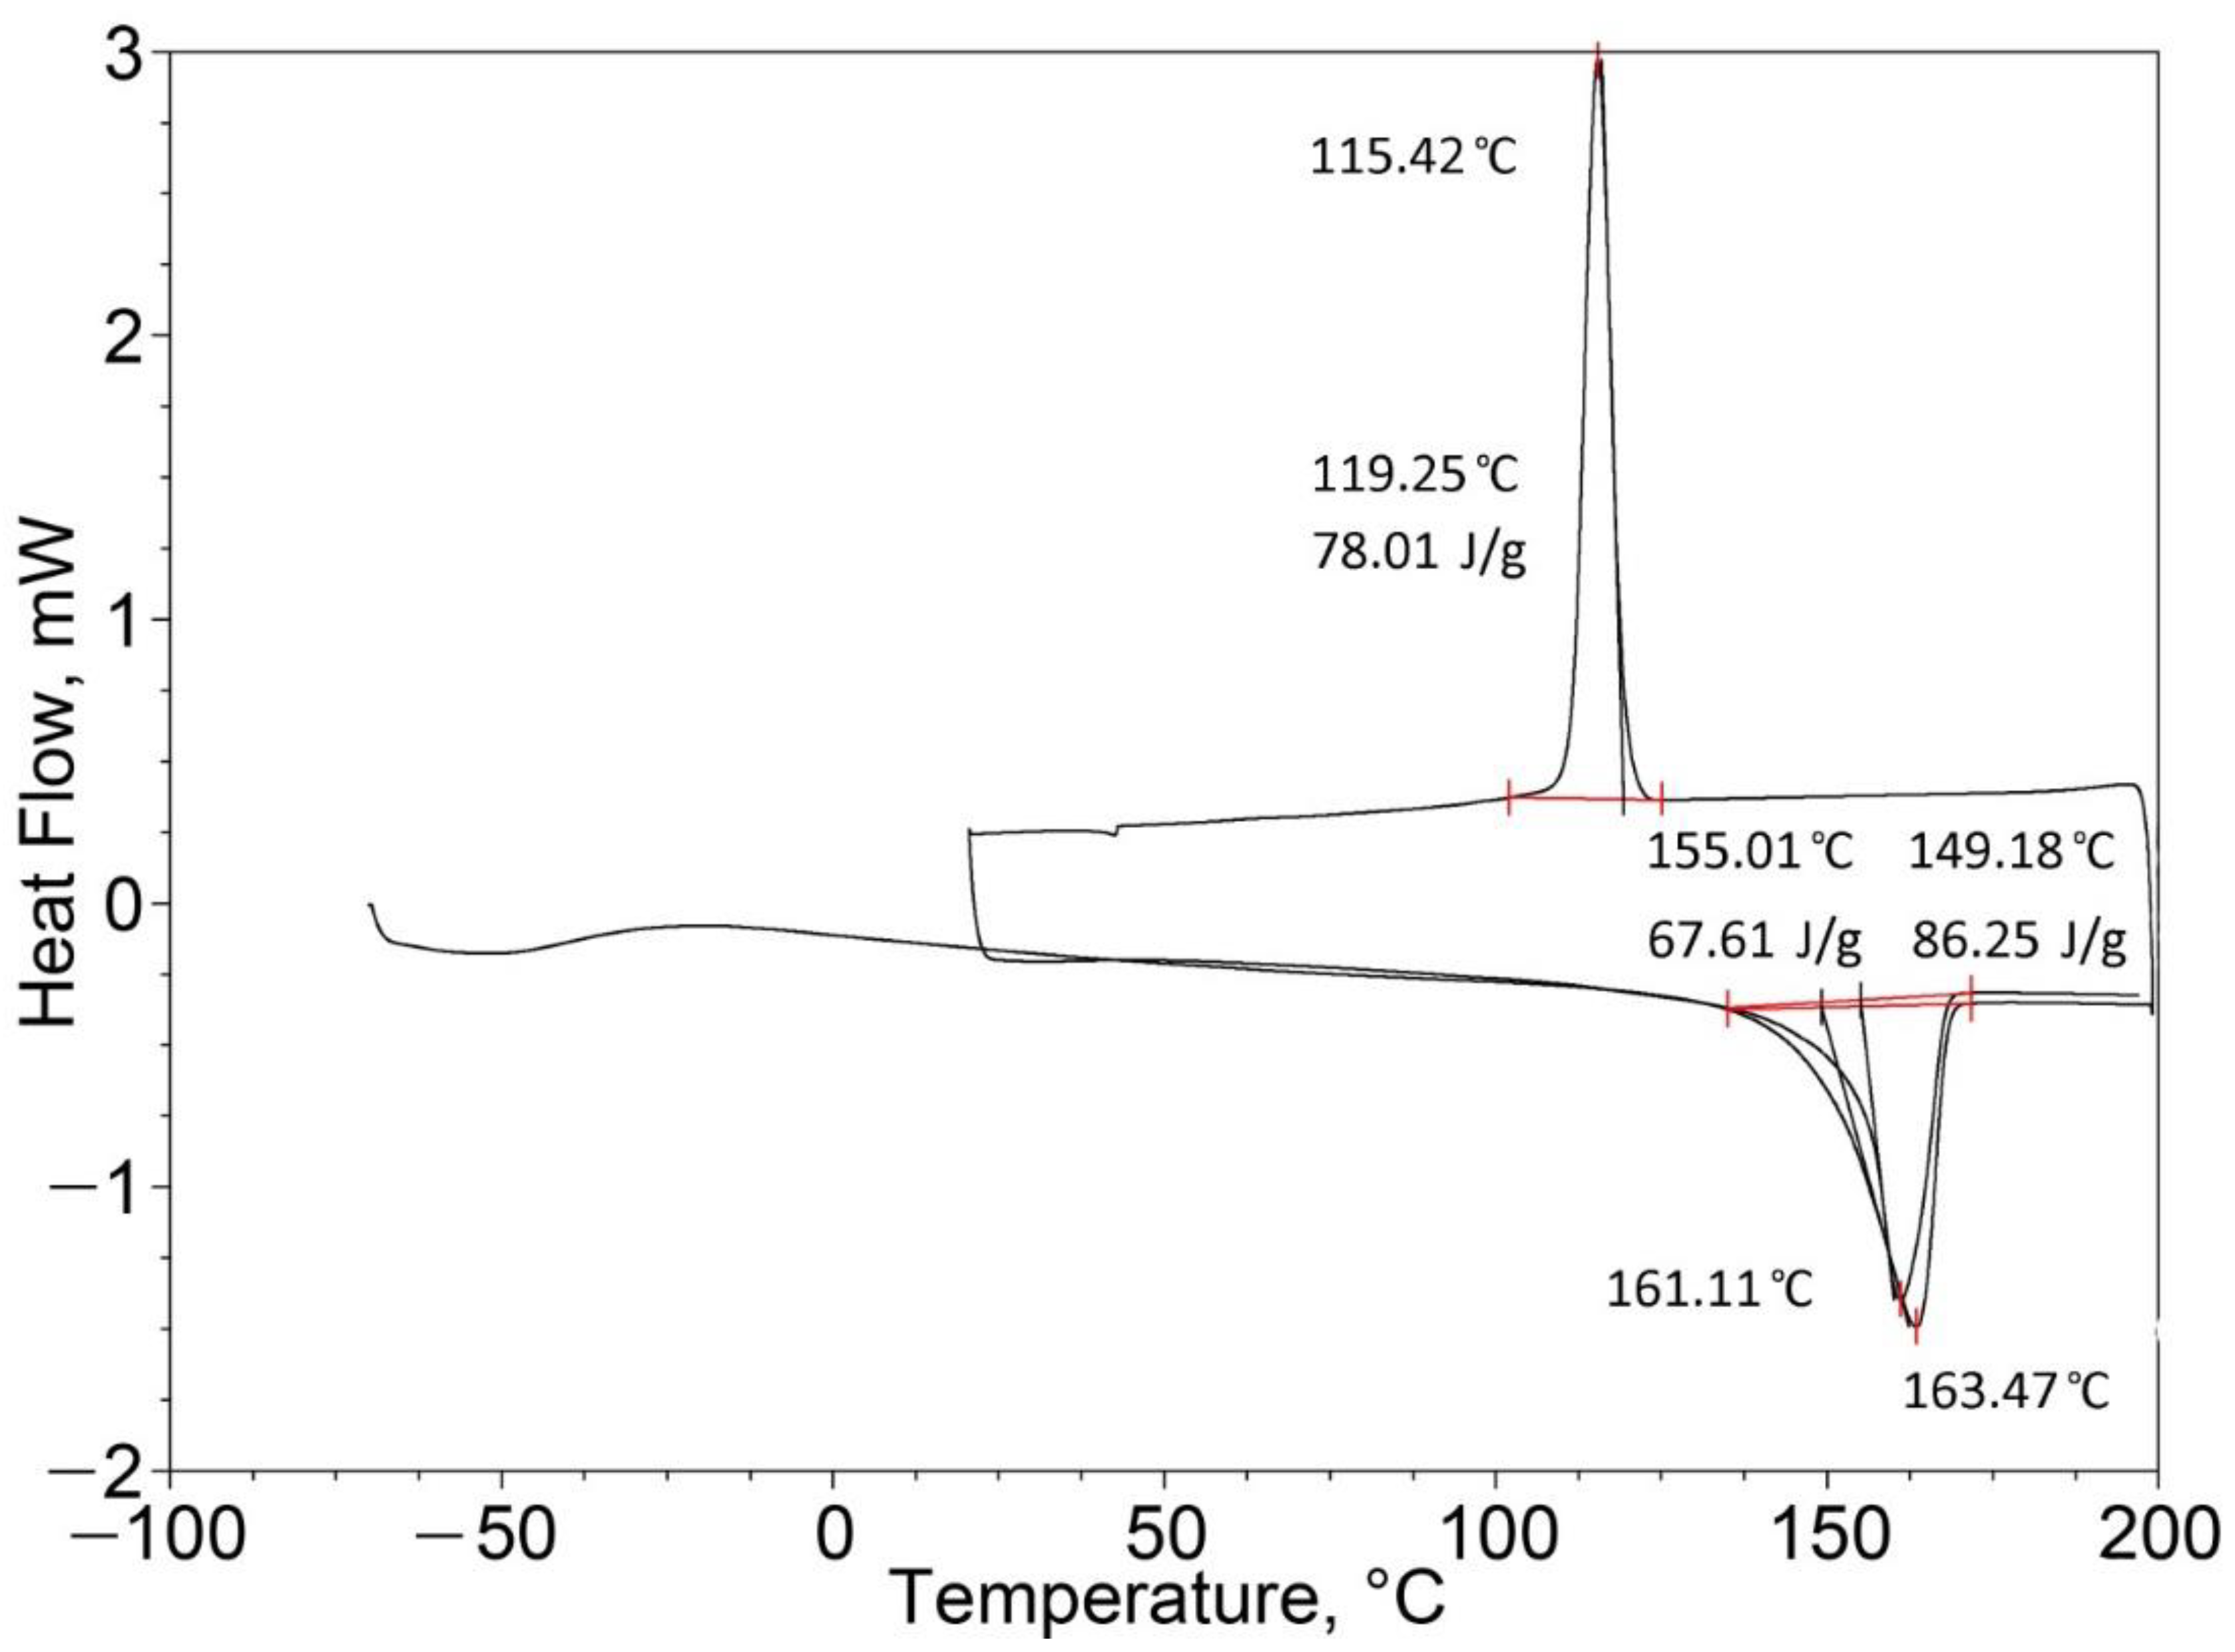
| PP (75%)/EPTSR (25%) | 163.58 (one peak) | 60.51 | 163.47 (one peak) | 86.25 |
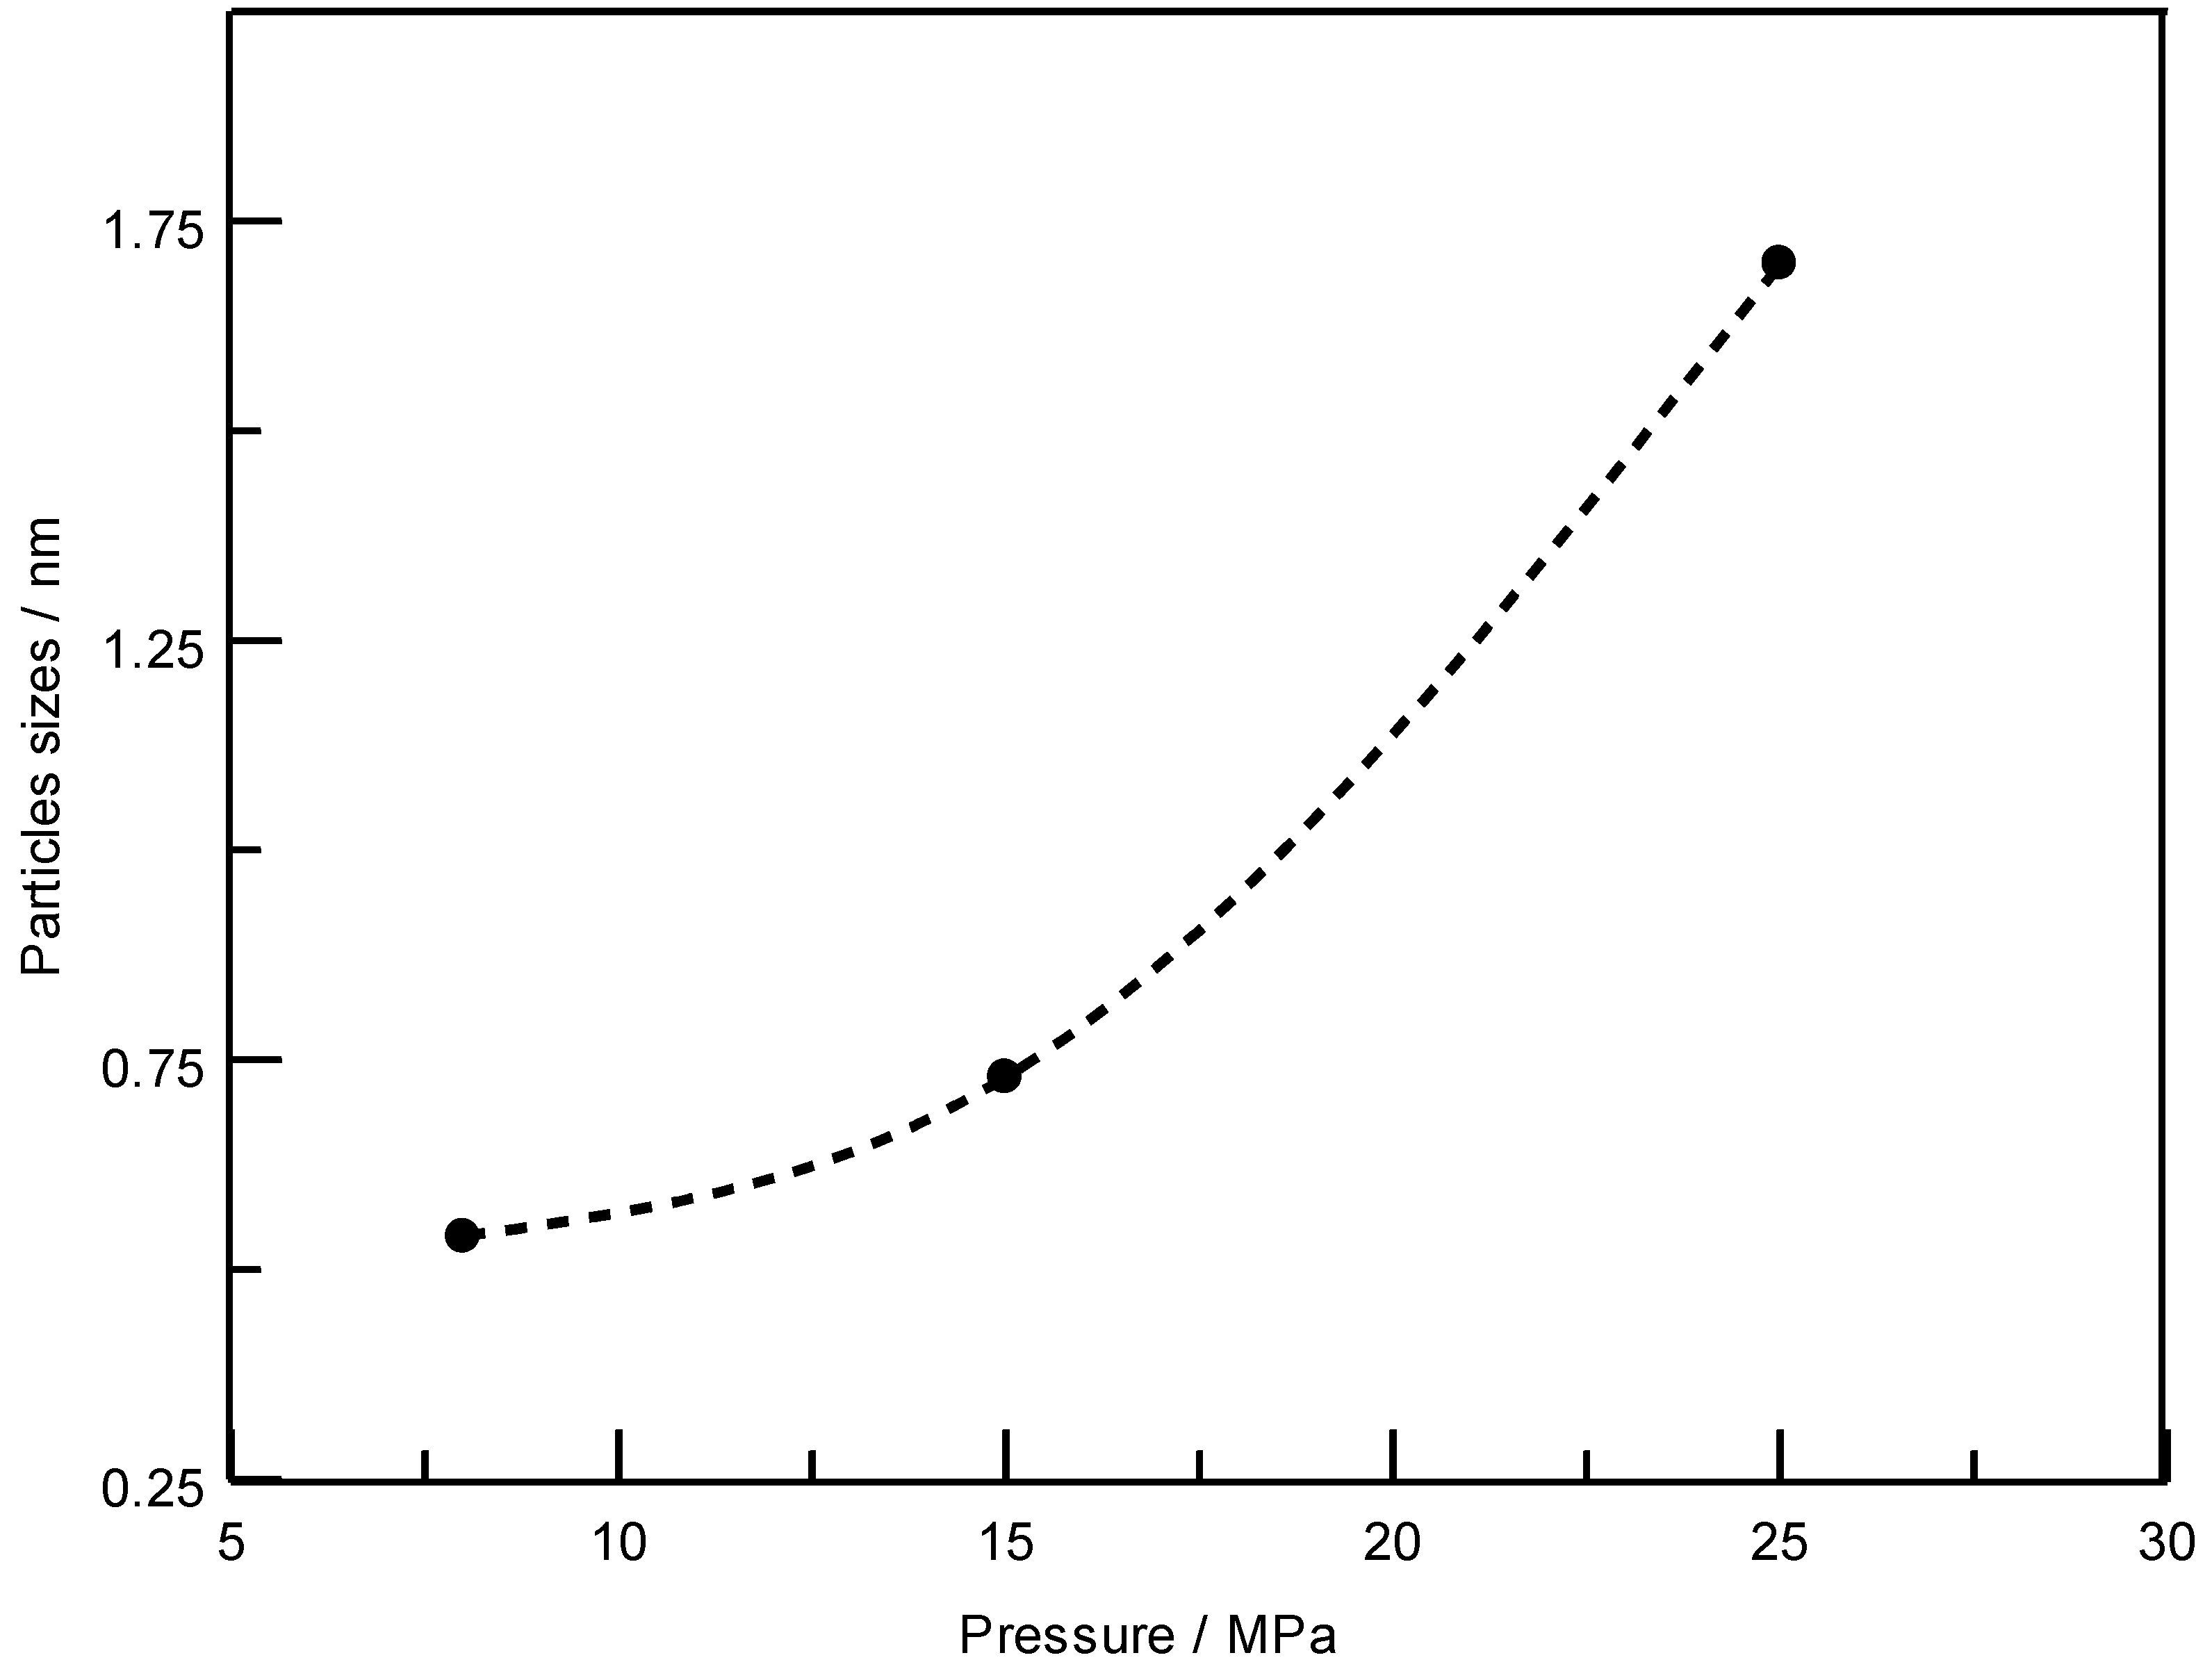
| SEDS Process Parameters | Heat of Fusion (SEDS Method), | Heat of Fusion (Melt Blending) | |
|---|---|---|---|
| t, oC | P, MPa | ||
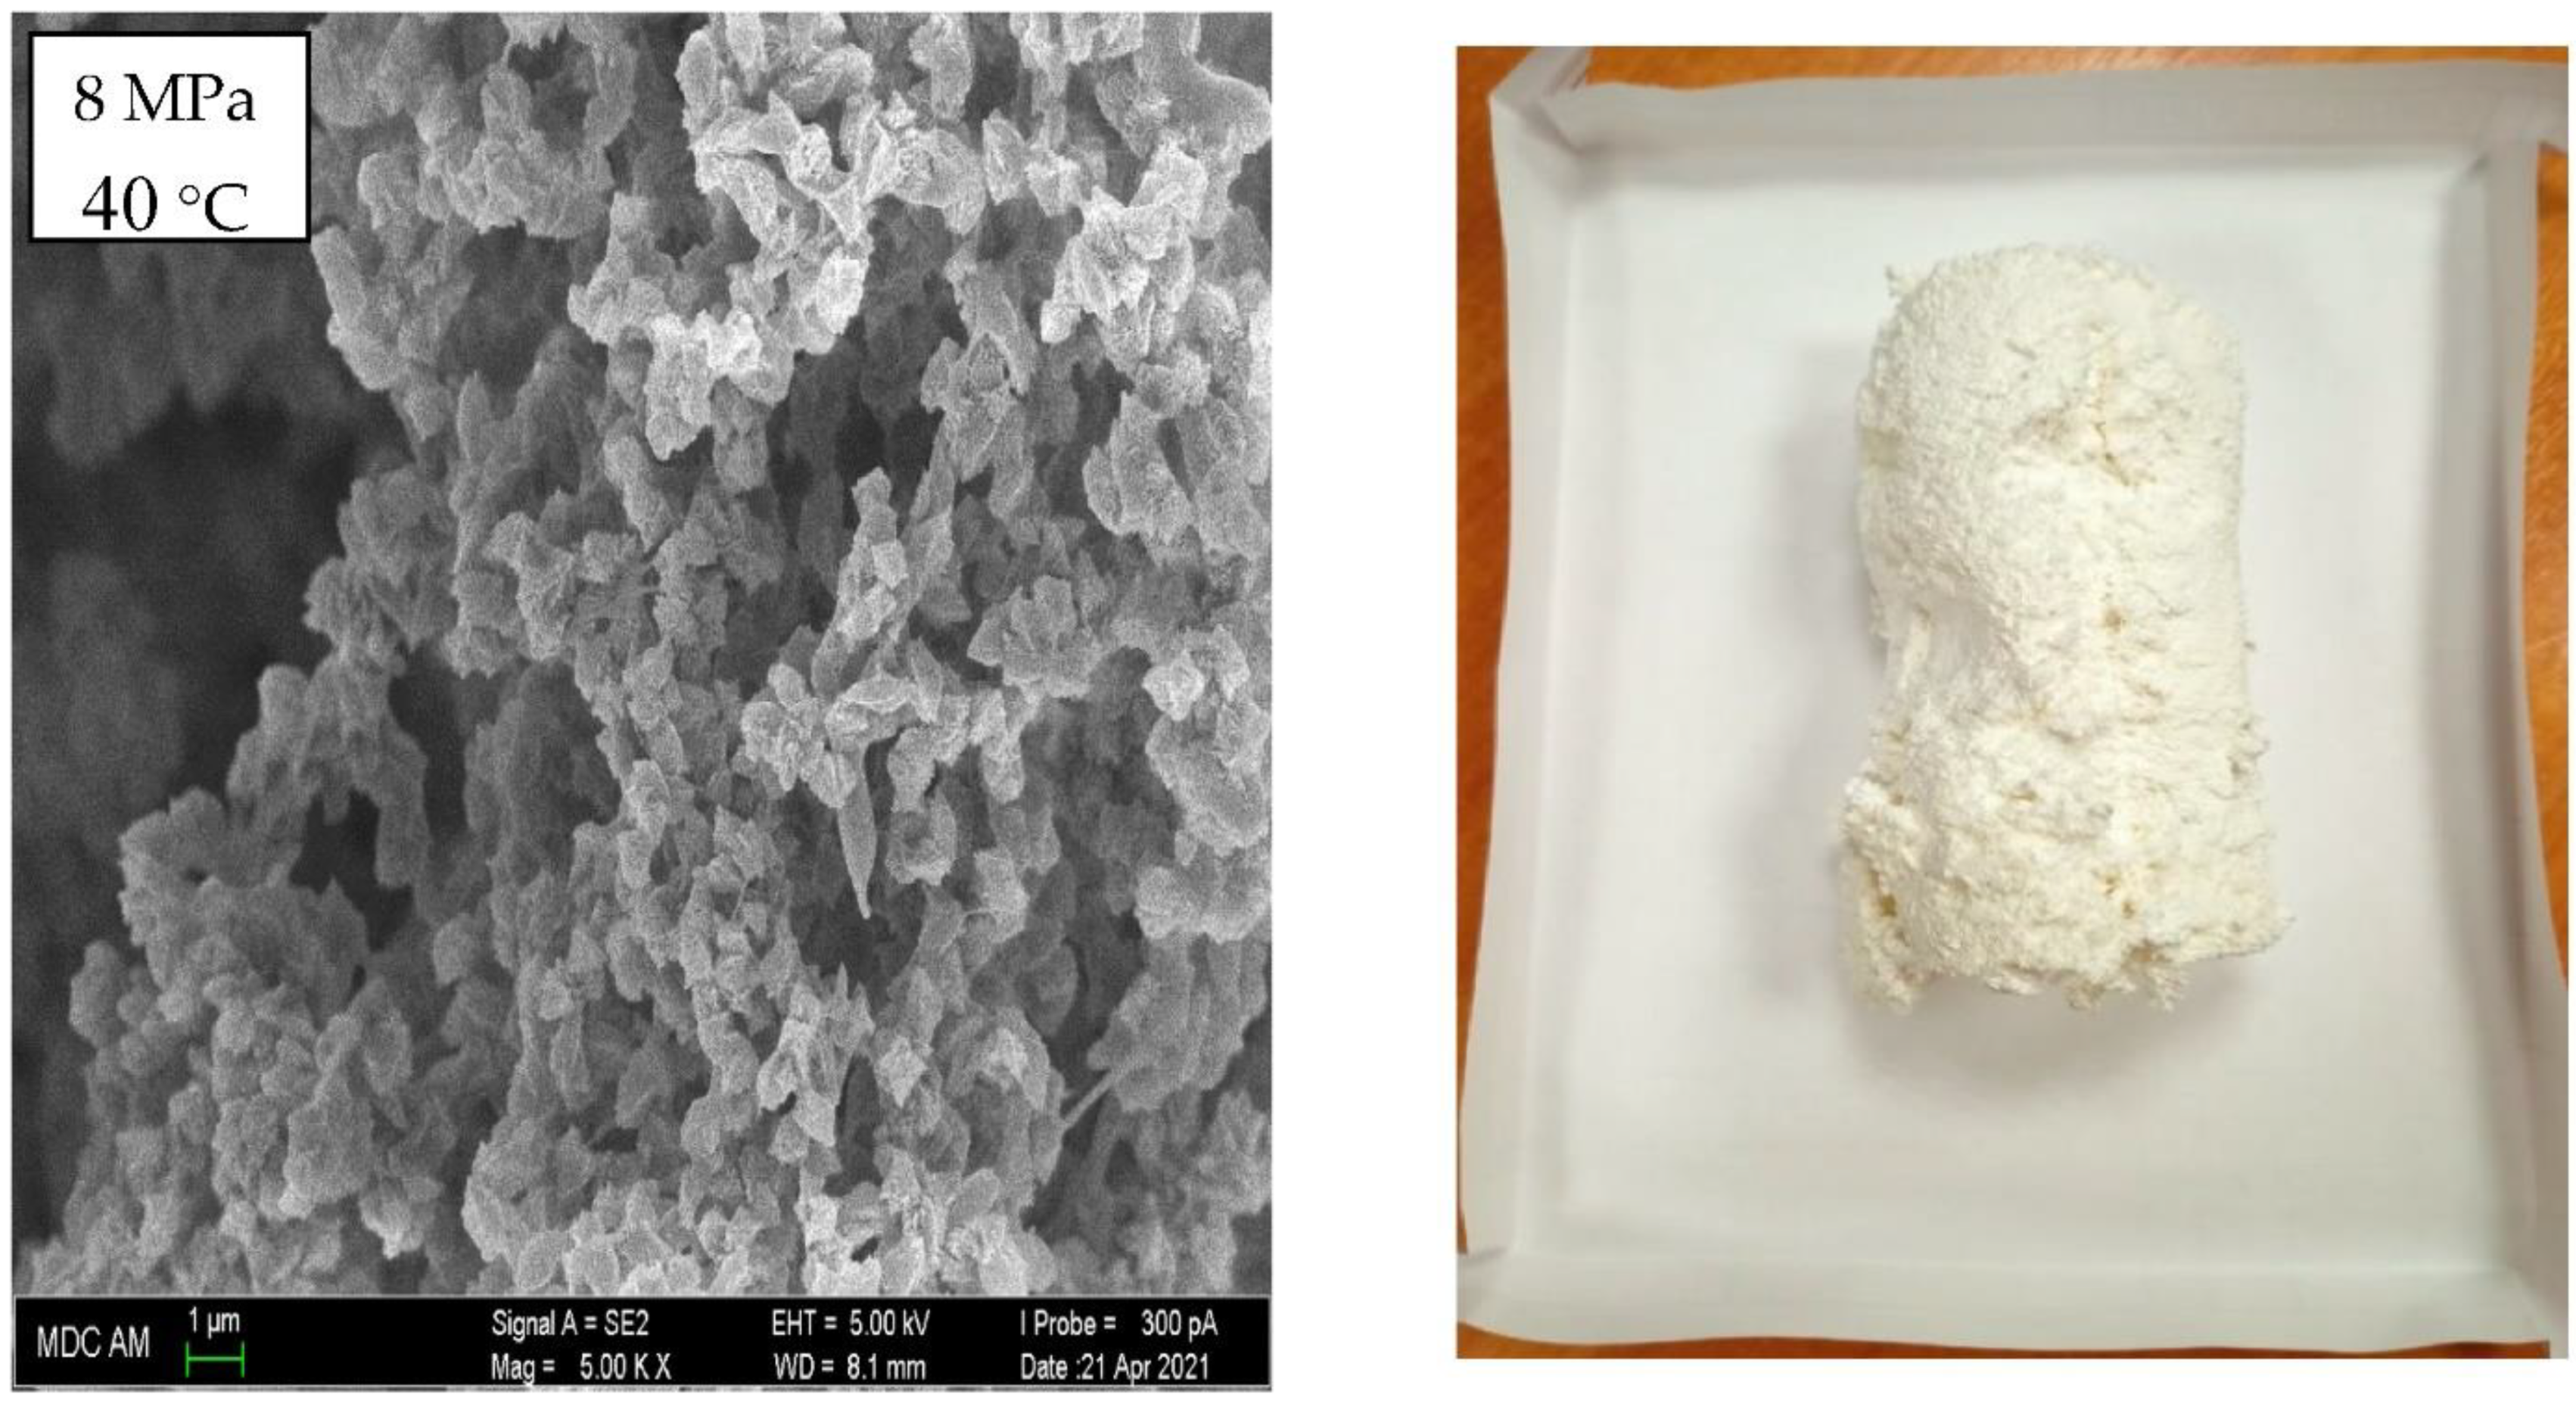
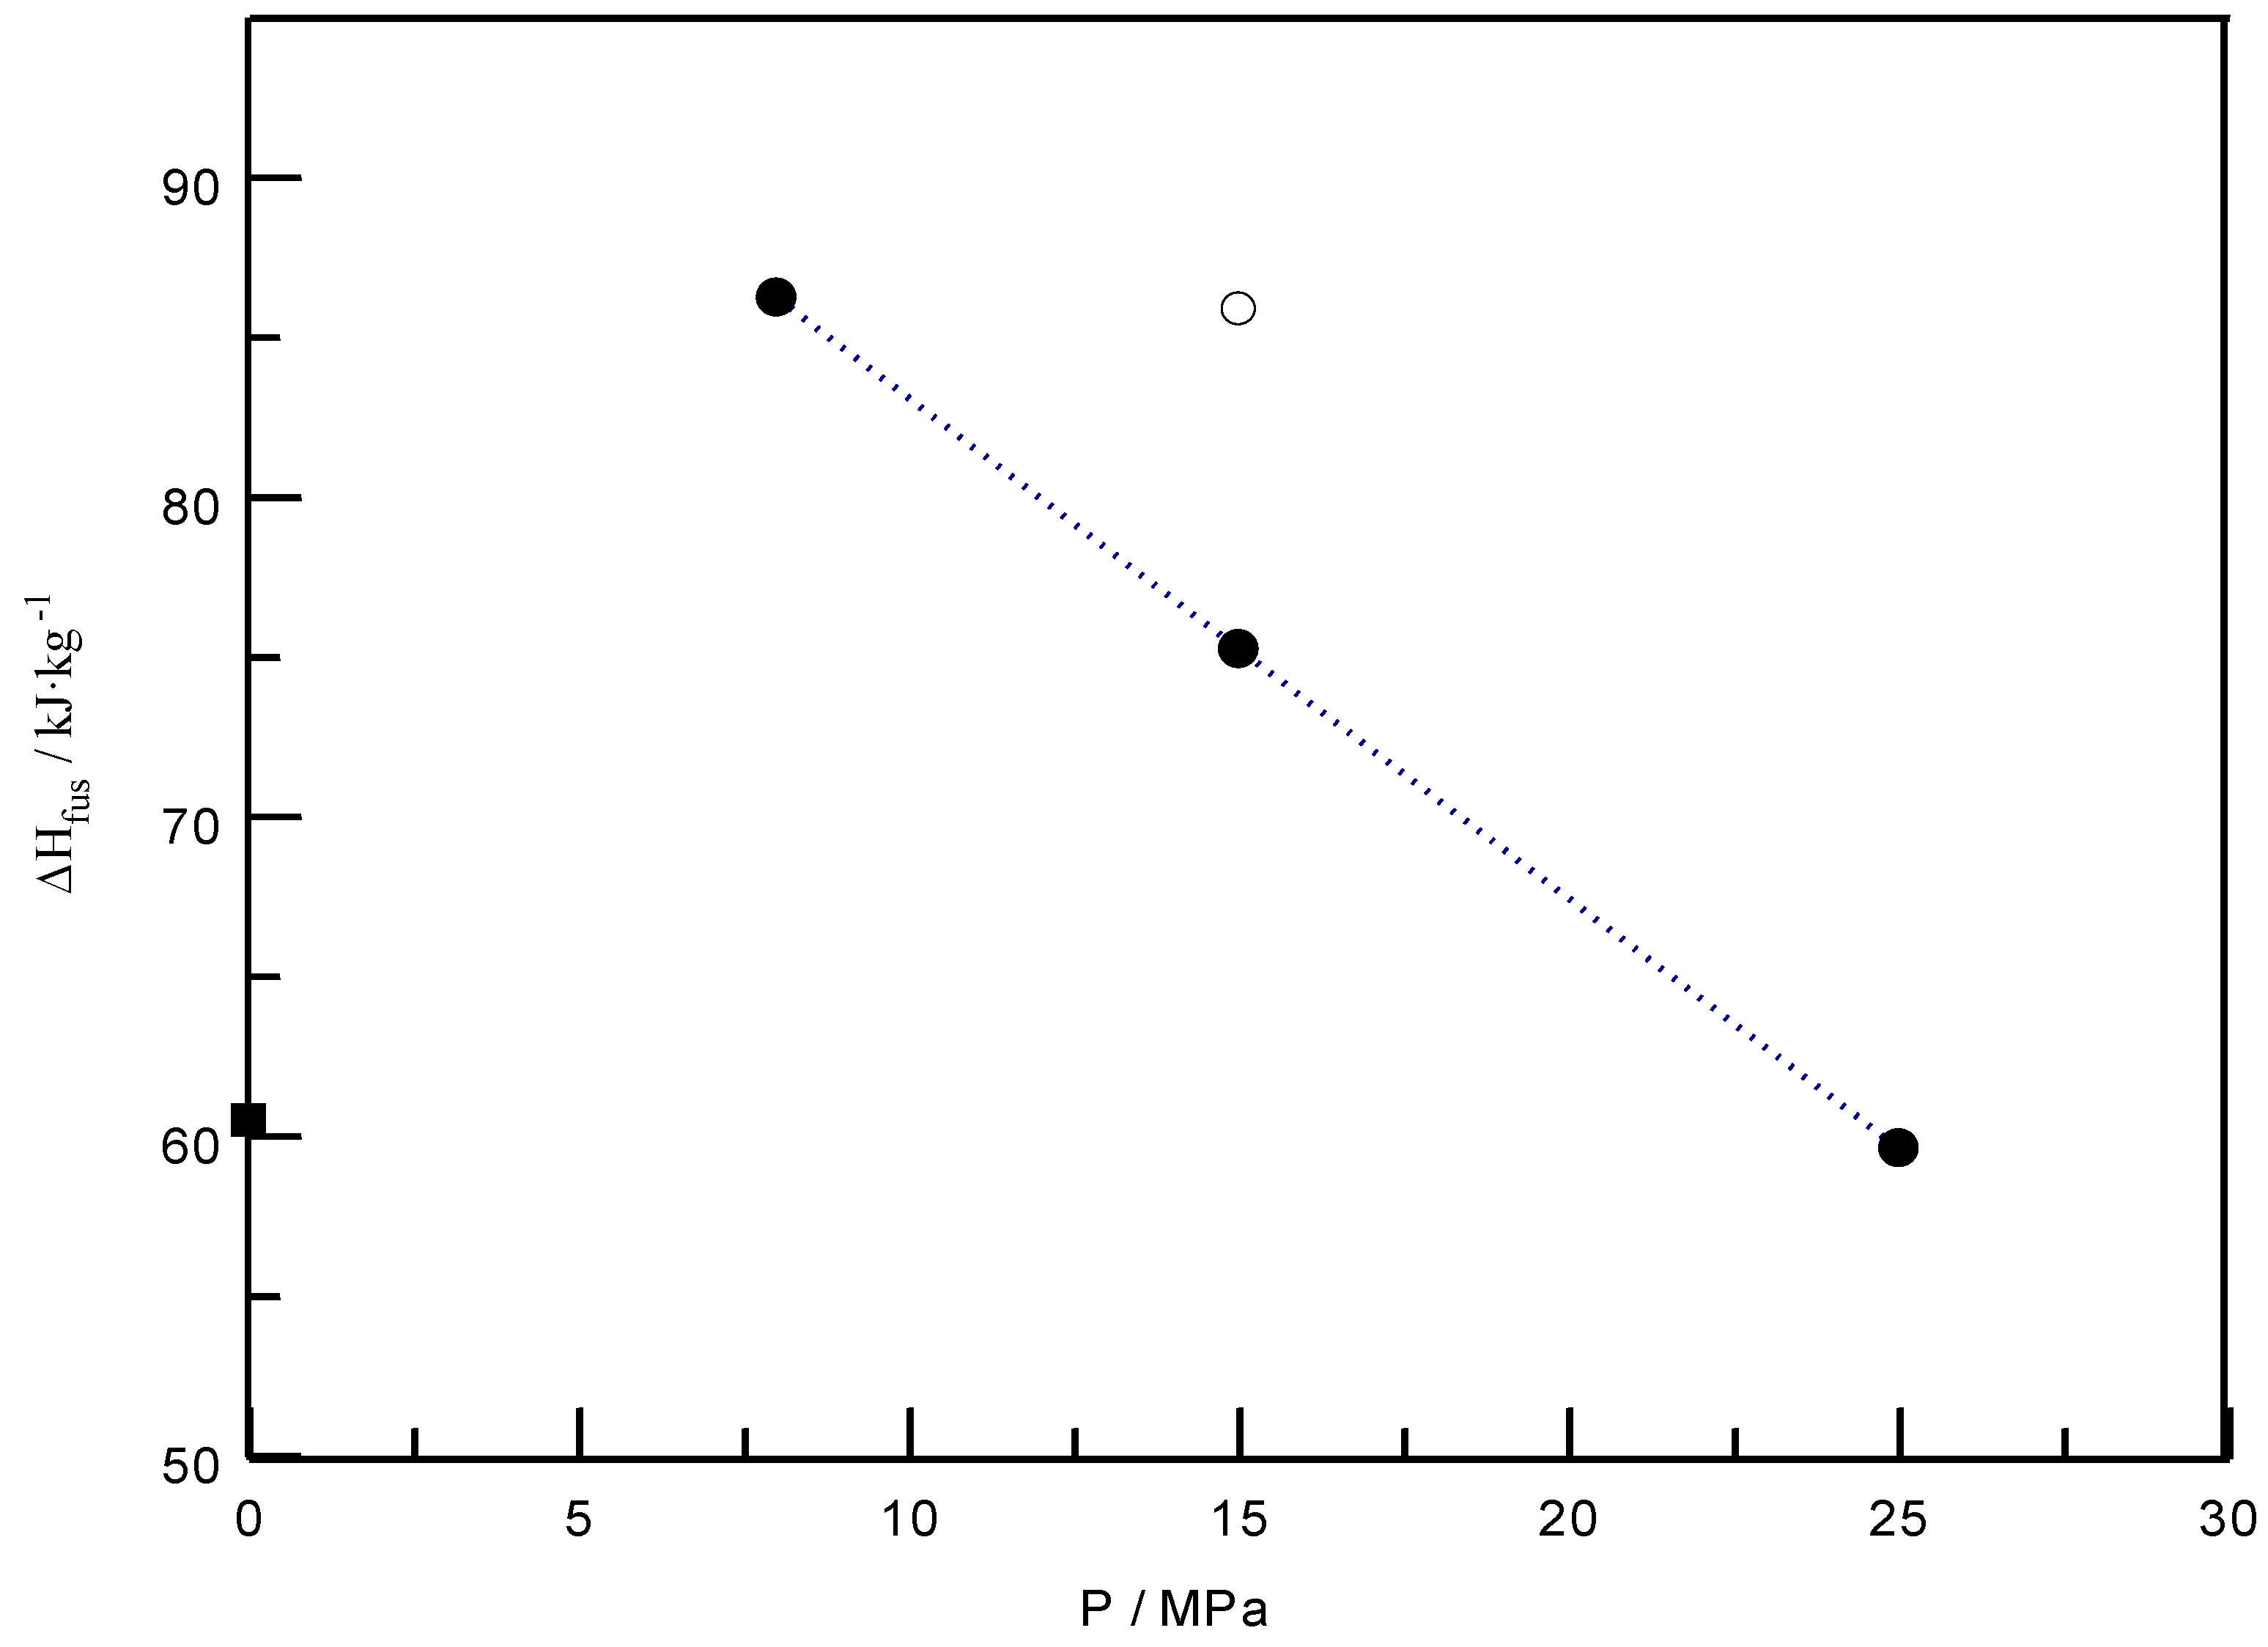
| 40 | 8 | 86.25 | 60.51 |
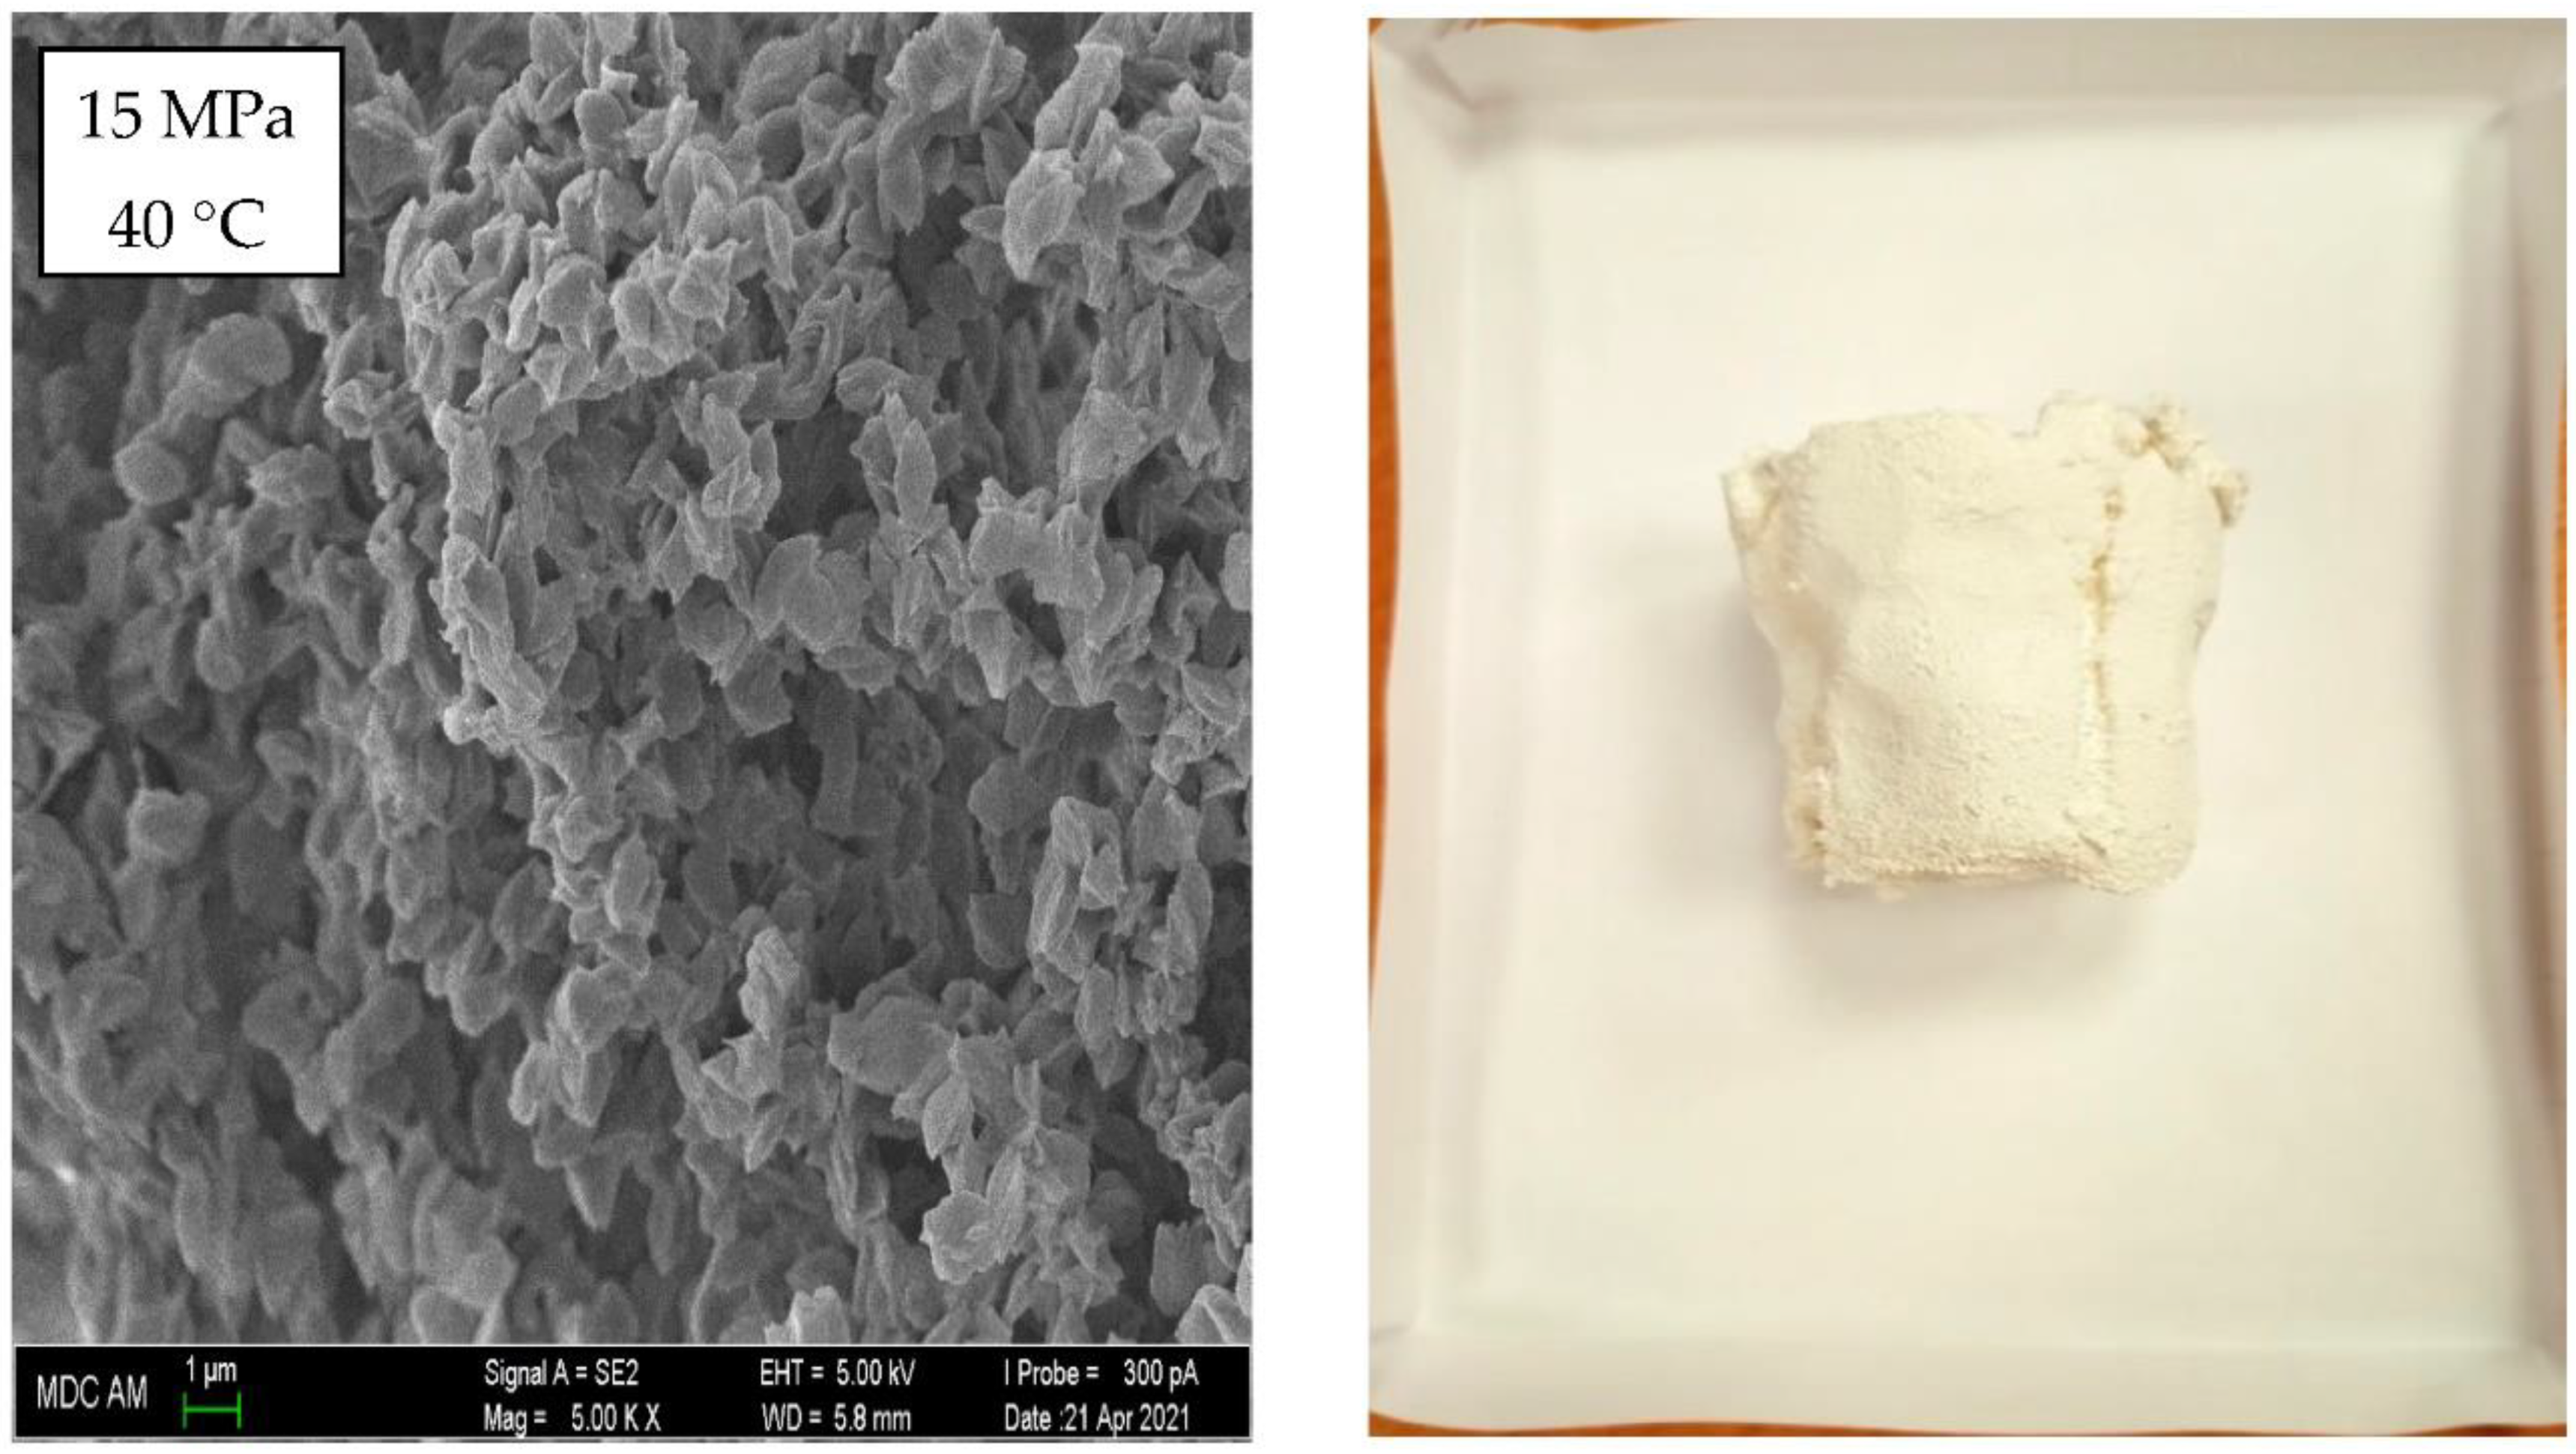
| 15 | 75.25 | 60.51 | |
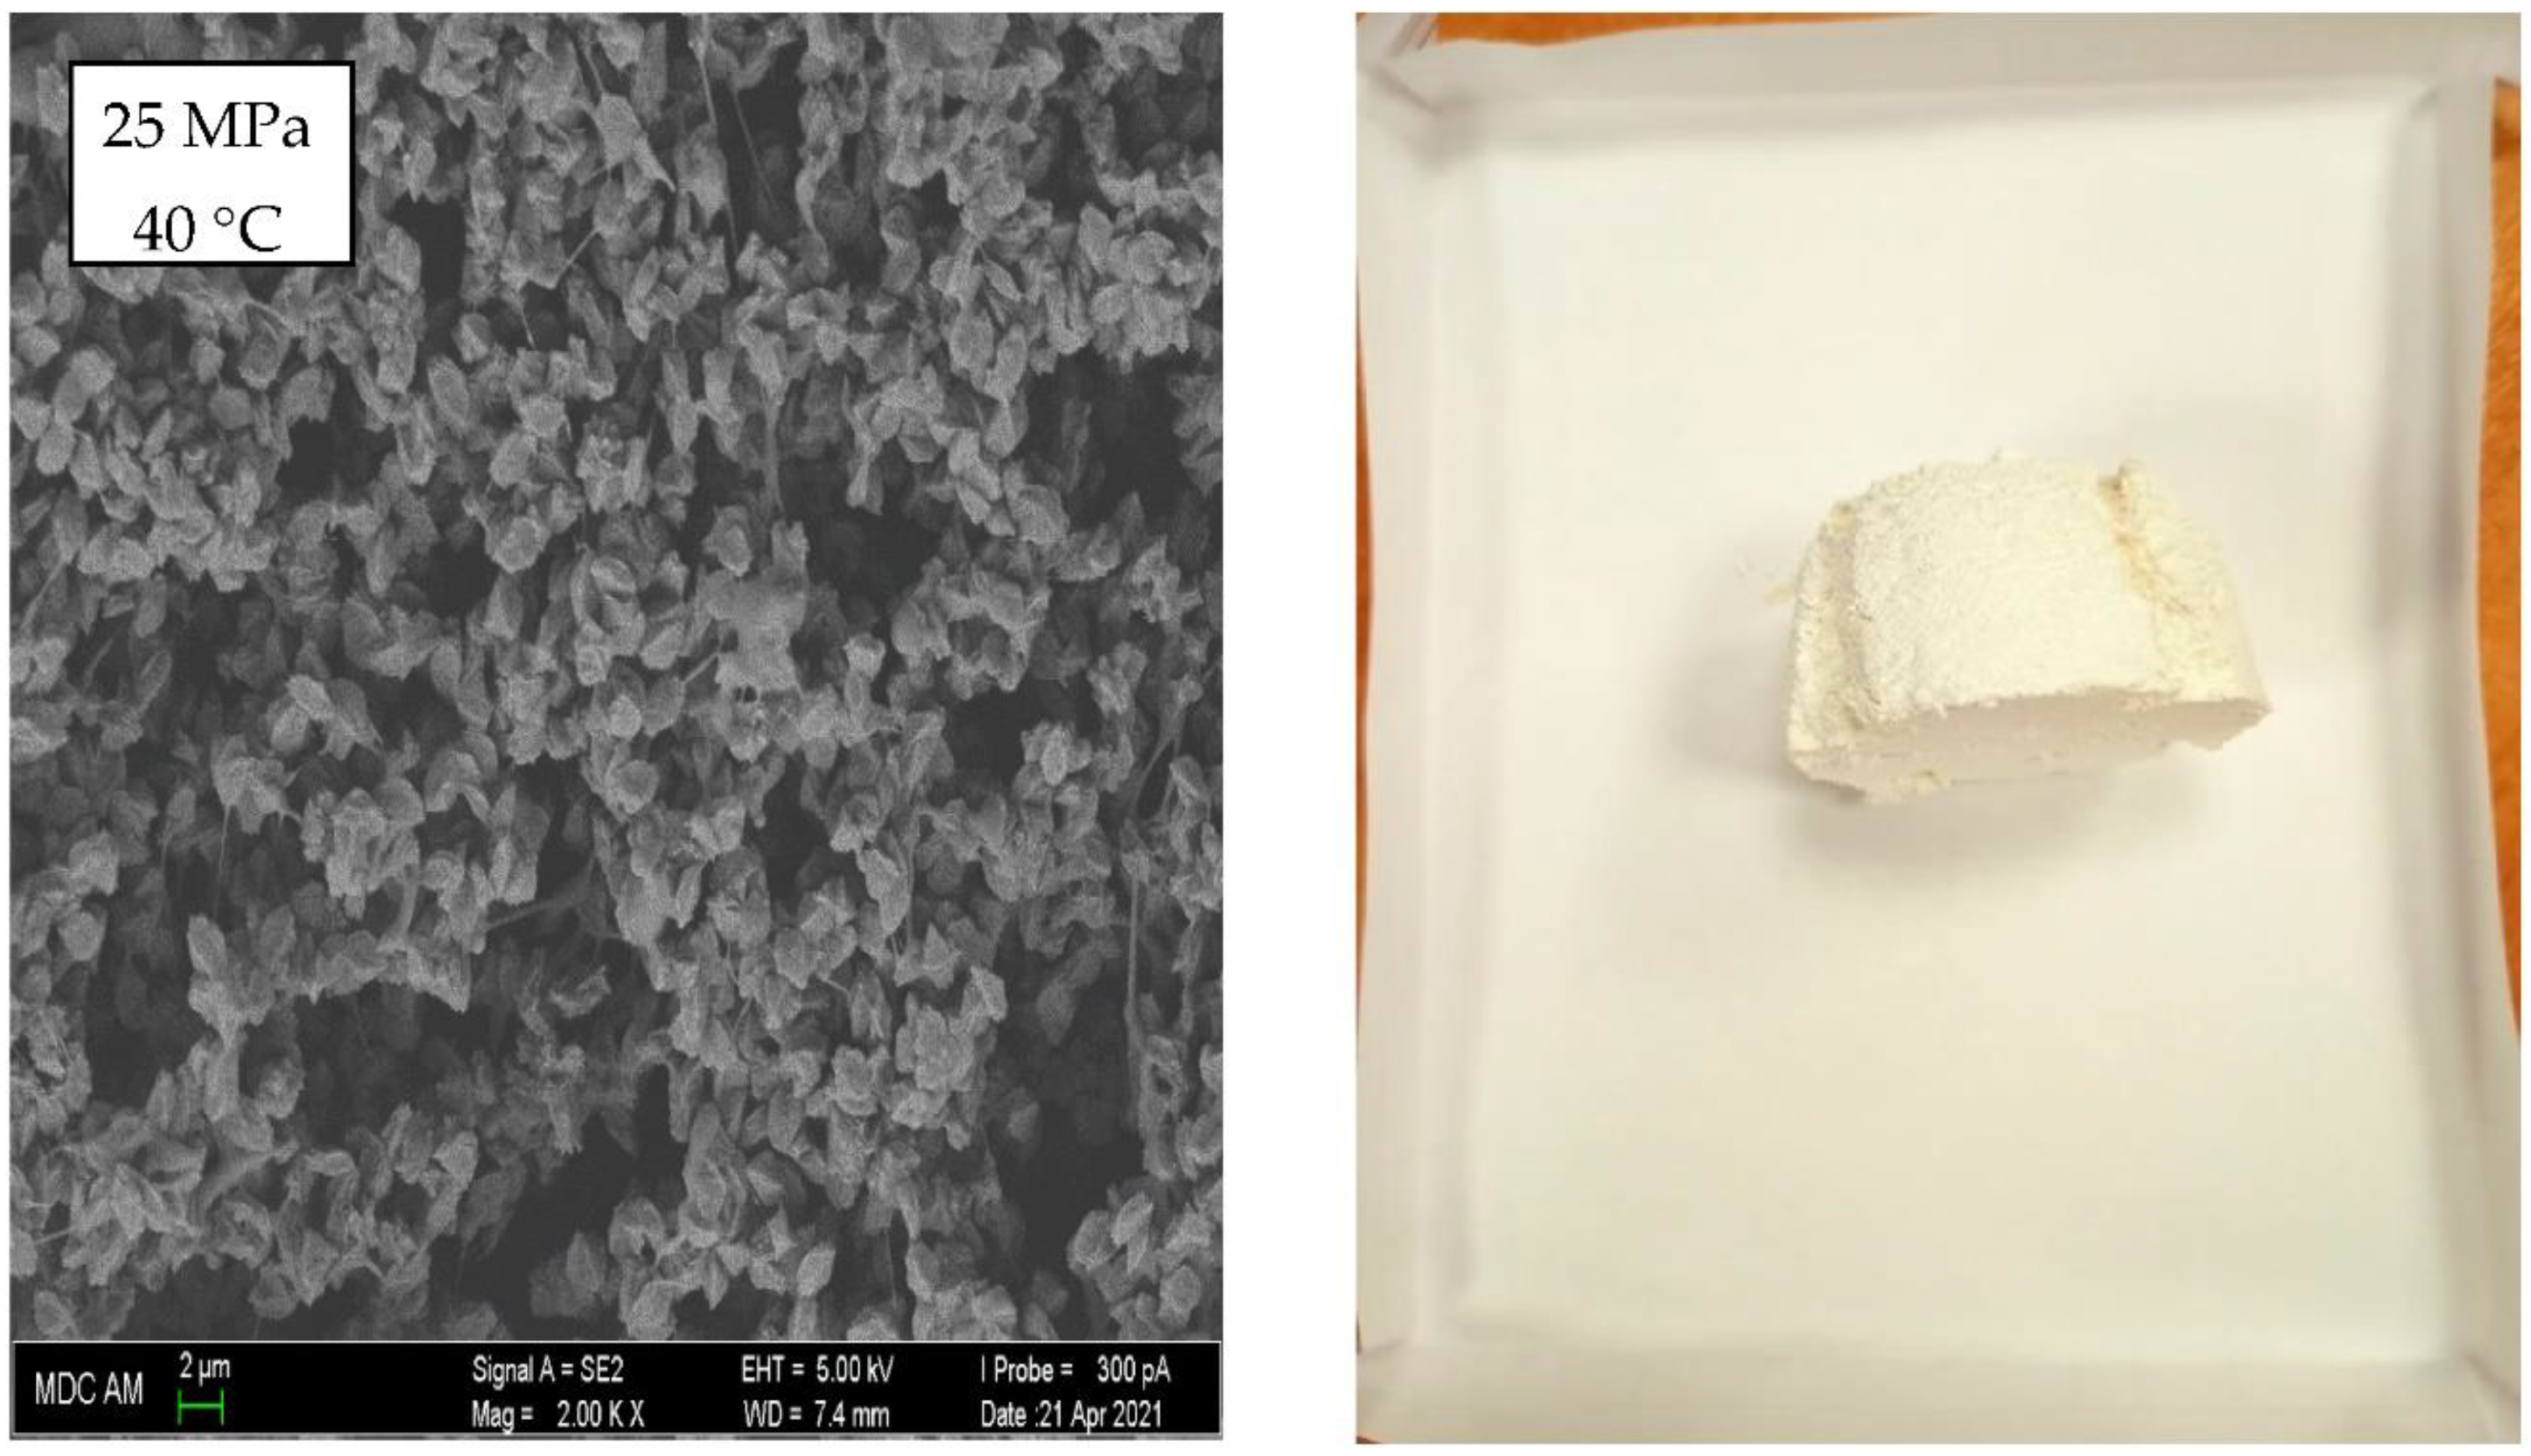
| 25 | 59.64 | 60.51 | |
| 60 | 15 | 85.99 | 60.51 |
Publisher’s Note: MDPI stays neutral with regard to jurisdictional claims in published maps and institutional affiliations. |
© 2022 by the authors. Licensee MDPI, Basel, Switzerland. This article is an open access article distributed under the terms and conditions of the Creative Commons Attribution (CC BY) license (https://creativecommons.org/licenses/by/4.0/).
Share and Cite
Khairutdinov, V.F.; Khabriev, I.S.; Gumerov, F.M.; Khuzakhanov, R.M.; Garipov, R.M.; Akhmetzyanov, T.R.; Ibatullin, A.N.; Abdulagatov, I.M. Dispersion of the Thermodynamically Immiscible Polypropylene and Ethylene—Propylene Triple Synthetic Rubber Polymer Blends Using Supercritical SEDS Process: Effect of Operating Parameters. Energies 2022, 15, 6432. https://doi.org/10.3390/en15176432
Khairutdinov VF, Khabriev IS, Gumerov FM, Khuzakhanov RM, Garipov RM, Akhmetzyanov TR, Ibatullin AN, Abdulagatov IM. Dispersion of the Thermodynamically Immiscible Polypropylene and Ethylene—Propylene Triple Synthetic Rubber Polymer Blends Using Supercritical SEDS Process: Effect of Operating Parameters. Energies. 2022; 15(17):6432. https://doi.org/10.3390/en15176432
Chicago/Turabian StyleKhairutdinov, Vener F., Ilnar S. Khabriev, Farid M. Gumerov, Rafail M. Khuzakhanov, Ruslan M. Garipov, Talgat R. Akhmetzyanov, Azat N. Ibatullin, and Ilmutdin M. Abdulagatov. 2022. "Dispersion of the Thermodynamically Immiscible Polypropylene and Ethylene—Propylene Triple Synthetic Rubber Polymer Blends Using Supercritical SEDS Process: Effect of Operating Parameters" Energies 15, no. 17: 6432. https://doi.org/10.3390/en15176432