Article

Dynamic Electric Simulation Model of a Proton Exchange Membrane Electrolyzer System for Hydrogen Production

by
Giuseppe De Lorenzo
1,*,
Raffaele Giuseppe Agostino
2 and
Petronilla Fragiacomo
1
1
Department of Mechanical, Energy and Management Engineering, University of Calabria, Cube 44C, Via P. Bucci, 87036 Rende, CS, Italy
2
Department of Physics, University of Calabria, Cube 31C, Via P. Bucci, 87036 Rende, CS, Italy
*
Author to whom correspondence should be addressed.
Energies 2022, 15(17), 6437; https://doi.org/10.3390/en15176437
Submission received: 31 July 2022 / Revised: 27 August 2022 / Accepted: 30 August 2022 / Published: 3 September 2022
(This article belongs to the Special Issue Advances in Hydrogen and Fuel Cell Systems)

Abstract

:
An energy storage system based on a Proton Exchange Membrane (PEM) electrolyzer system, which could be managed by a nanoGrid for Home Applications (nGfHA), is able to convert the surplus of electric energy produced by renewable sources into hydrogen, which can be stored in pressurized tanks. The PEM electrolyzer system must be able to operate at variable feeding power for converting all the surplus of renewable electric energy into hydrogen in reasonable time. In this article, the dynamic electric simulation model of a PEM electrolyzer system with its pressurized hydrogen tanks is developed in a proper calculation environment. Through the calculation code, the stack voltage and current peaks to a supply power variation from the minimum value (about 56 W) to the maximum value (about 440 W) are controlled and zeroed to preserve the stack, the best range of the operating stack current is evaluated, and hydrogen production is monitored.

1. Introduction

The main European Community goals towards 2030 are at least a 40% reduction in greenhouse gas emissions compared to 1990 levels, at least 32% share of renewable energy, and at least 32.5% improvement in energy efficiency [1].
The electrical power produced from Renewable Energy Sources (RES), such as the sun and wind, is not controllable and intermittent. Moreover, the availabilities of RES (sun and wind) electric energy and fossil fuels do not correspond temporally and spatially to the end-user energy demand. Due to these problems, electrical systems may not be able to guarantee the required standard of electrical system reliability, which is very high and determined by the obtainable levels of adequacy [2], safety [3] and resilience [4]. Under this point of view, the development of the technologies for the advanced and active management of the users’ plants, placed downstream the electric energy meter (“Behind the Meter”) is very relevant; in particular, advanced solutions of hybrid systems, such as nanoGrid for Home Applications (nGfHA), are capable of managing simultaneously different technologies of generation sources and/or storage systems.
The electrical system with RES plants has to be equipped with a variety of accumulation technologies, which contribute to deliver different types of service (power and voltage regulation) and contribute to satisfying the electric needs with different time horizons. Specifically, the time horizon varies in the range of a few milliseconds (ultra-capacitors), days and/or months (Power to Fuel technologies, P2F [5,6,7]), by hours (batteries). One of the possible P2F technologies involves using part of the electric energy surplus within the electrical system, which integrates RES plants, to produce hydrogen through electrolysis. The hydrogen produced can be adequately stored and converted into electric energy through fuel cells [8,9,10,11,12,13] at times when the energy demand is high or can fuel “carbon free” and sustainable mobility systems [14,15,16,17,18].
In this context, Proton Exchange Membrane (PEM) electrolyzers are able to convert water into high purity hydrogen flow and oxygen-rich flow using the electric energy produced from RES with no environmental impact and with a higher conversion efficiency than the one of the conventional alkaline electrolyzers [19]. Recently, for the PEM electrolyzers, a new membrane and catalyst [20] and a new bipolar plate material [21] have been tested, new models of porous materials have been developed [22,23], and a new operating strategy has been proposed to prevent their performance degradation in intermittent operation [24].
The authors did not find many articles in the literature about the overall dynamic simulation model of a PEM electrolytic stack and of the entire PEM electrolyzer system [25,26,27,28,29,30].
Awasthi et al. [25] developed a dynamic simulation model of a PEM water electrolytic cell element based on Matlab/Simulink software under different operating conditions (pressure and temperature) and considered the contributions of the different over-voltages.
Guilbert et al. [26] developed a dynamic emulator of a PEM electrolytic cell element through an equivalent electrical model, considered the capacitive effect of the PEM electrolyzer, when subjecting to dynamic current profiles, and modeled a PEM electrolyzer, which is composed of three cells under dynamic operating conditions.
Yigit and Selamet [27] developed a PEM electrolysis-based hydrogen generator system model using Matlab/Simulink software. The model considers PEM electrolytic stack, water pump, cooling fan, storage tank, water tank, power supply, control unit, and sensors.
Gorgun [28] developed a dynamic model of a PEM electrolytic cell element. It considers anode, cathode, membrane, and voltage ancillary and it includes water phenomena, electro-osmotic drag and diffusion through the membrane
Hernandez-Gomez et al. [29] developed an equivalent electrical circuit to replicate accurately the dynamic behavior of the PEM electrolytic stack subject to fast current change.
Brezak et al. [30] developed a Matlab/Simulink® simulation model of a low-pressure PEM electrolytic stack.
In summary:
  • Awasthi et al. [25] and Gorgun [28] analyzed only the PEM electrolytic cell element;
  • Guilbert et al. [26] and Hernandez-Gomez et al. [29] analyzed the PEM electrolytic stack, considering its capacitive effect;
  • Brezak et al. [30] analyzed the PEM electrolytic stack, not considering its capacitive effect and the power supply variations;
  • Yigit and Selamet [27] analyzed the PEM electrolyzer, but did not consider the capacitive effect of the PEM electrolytic stack and the real DC/DC converter, which feeds the PEM electrolyzer.
It is necessary to develop a fast, flexible, and precise calculation tool capable to simulate the dynamic behavior of the entire PEM electrolyzer system, when it is only a component of a highly complex energy storage system, to diagnose and prevent the PEM electrolytic stack malfunctions.
In this article, the authors set up a dynamic simulation model of the entire PEM electrolyzer system, which is composed of the real and improved buck DC/DC converter, the PEM electrolytic stack, the auxiliaries and the pressurized hydrogen storage system.
With respect to the articles examined [25,26,27,28,29,30], the dynamic simulation model of the entire PEM electrolyzer system developed by the authors considers all the main components of system (real and improved DC/DC buck converter, PEM electrolytic stack, the auxiliaries, and the pressurized hydrogen storage system) and the capacitive effect of the PEM electrolytic stack. This simulation model is flexible, i.e., it can consider different type of PEM electrolytic stacks, and accurate, i.e., it fits well with the PEM electrolyzer experimental data, and it can be used to control and prevent the voltage and current peaks during the power supply variation, which can reduce the PEM electrolytic stack’s useful life.
Furthermore, the calculation tool developed by the authors is able to simulate accurately the PEM electrolyzer system in different and more complex energy storage systems, to identify the field of efficient operation for the same PEM electrolyzer system and to diagnose and prevent the PEM electrolytic stack malfunctions.
The electric power absorbed by the entire PEM electrolyzer system is changed acting appropriately on the duty ratio of the real and improved DC/DC buck converter.
The simulation model is implemented in the Simulink® environment to obtain the calculation tool, which evaluates the time trends of the main system parameters (PEM electrolytic stack voltage and current and the State Of Charge of the H2-pressurized tanks) to a supply power variation from the minimum value (about 56 W) to the maximum value (about 440 W). Furthermore, the calculation tool is used to trace the trend of the H2 production efficiency for the system at variable stack operating current.

2. Numerical Simulation Model

The layout of the PEM electrolyzer system in the Simulink environment is shown in Figure 1. In this figure, the power supply, which is represented as an ideal continuous voltage generator, feeds the PEM electrolyzer auxiliaries (measurement and control devices) and the others components of the same PEM electrolyzer, such as the DC/DC Buck Converter and the stack. The PEM electrolyzer produces pure hydrogen, which is stored in the H2 storage system.

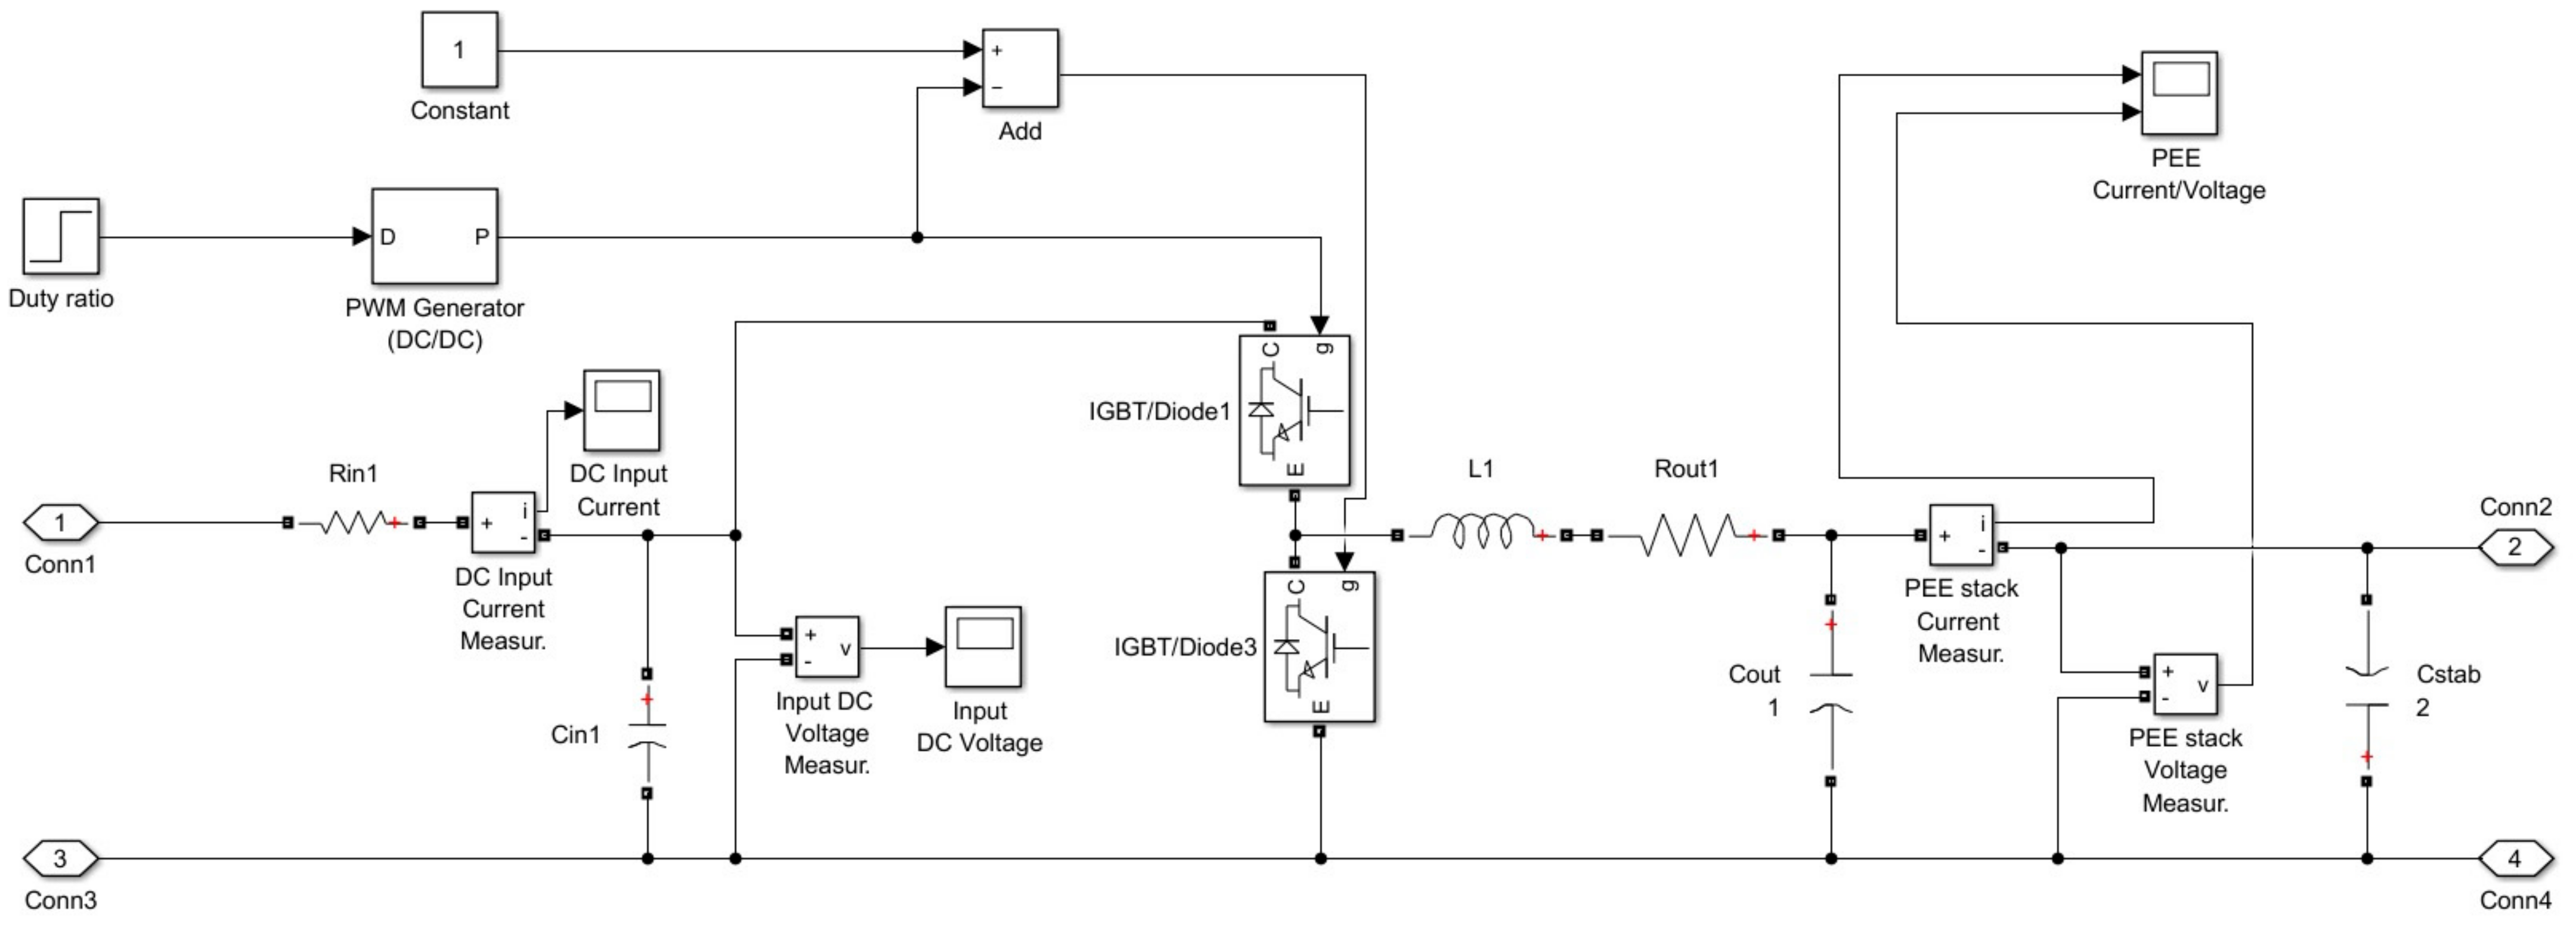
2.1. DC/DC Buck Converter

The Buck Converter produces a lower average output DC voltage than the DC input voltage to feed properly the PEM electrolytic stack. Since the electric power at the converter input is low (<1 kW), a non-isolated converter (without the galvanic isolation between input and output) is considered.
Figure 2 shows the layout of the DC/DC Buck Converter in the Simulink® environment. With respect to the standard DC/DC Buck Converter [31], the rectifier diode is substituted with a synchronous rectifier switch (e.g., IGBT 3). This change reduces the electric power losses and increases the efficiency of the DC/DC Buck converter [32]. The duty ratio D, i.e., the product of the switch on time, ton, and the fixed switch frequency, fsw, is modulated to obtain the desired output voltage, Vout. The resistances Rin1 and Rout1 are introduced to consider the ohmic losses of the input and output circuits for the converter. The usual filter inductor, represented by the inductance L1, and its peak current are determined based on the specified maximum inductor current ripple, ΔIL1, through Equation (1) [32]:
L 1 = V o u t · 1 D f s w · Δ I L 1
The function of the usual output capacitor, represented by the capacitance Cout1, is that of filtering the inductor current ripple and delivering a stable output voltage. It also has to ensure that load steps at the output can be supported before the regulator is able to react.
There are two distinct criteria, which define the value of capacitance Cout1 and the concrete design of the output capacitor solution.
According the first criterion, the minimum value of the capacitance Cout1, called Cout1,min1, is calculated through Equation (2) [32]:
C o u t 1 , m i n 1 = 1 D Δ V o u t V o u t · 8 · L 1 · n · f s w 2
where n is the number of the phases for the condenser.
According the second criterion, the minimum value of the capacitance Cout1, called Cout1,min2, is calculated through Equation (3) [32]:
C o u t 1 , m i n 2 = 1 2 · Δ V o u t · L 1 · Δ I o u t 2 n · D m a x · V i n V o u t Δ I o u t · t s t e p
Dmax is the maximum value of the duty ratio and tstep is the duration of load step.
The value of the capacitance Cout1 is chosen in such a way that C o u t 1 m a x C o u t 1 , m i n 1 , C o u t 1 , m i n 2 .
The function of the usual input capacitor, represented by the capacitance Cin1, is that of filtering the input current into the regulator. The minimum value of the capacitance Cin1, called Cin1,min, is calculated through Equation (4) [32]:
C i n 1 , m i n = I o u t η · f s w · Δ V i n · D n D 2
In Equation (4), η, ΔVin, and Iout are, respectively, the converter efficiency, the permissible input voltage ripple at the input capacitor, and the converter output average current.
The value of the capacitance Cin1 is chosen in such a way that   C i n 1 C i n 1 , m i n .
A special capacitive filter,   C s t a b 2 , is introduced to control the stack voltage peak, which could damage the stack irreversibly.

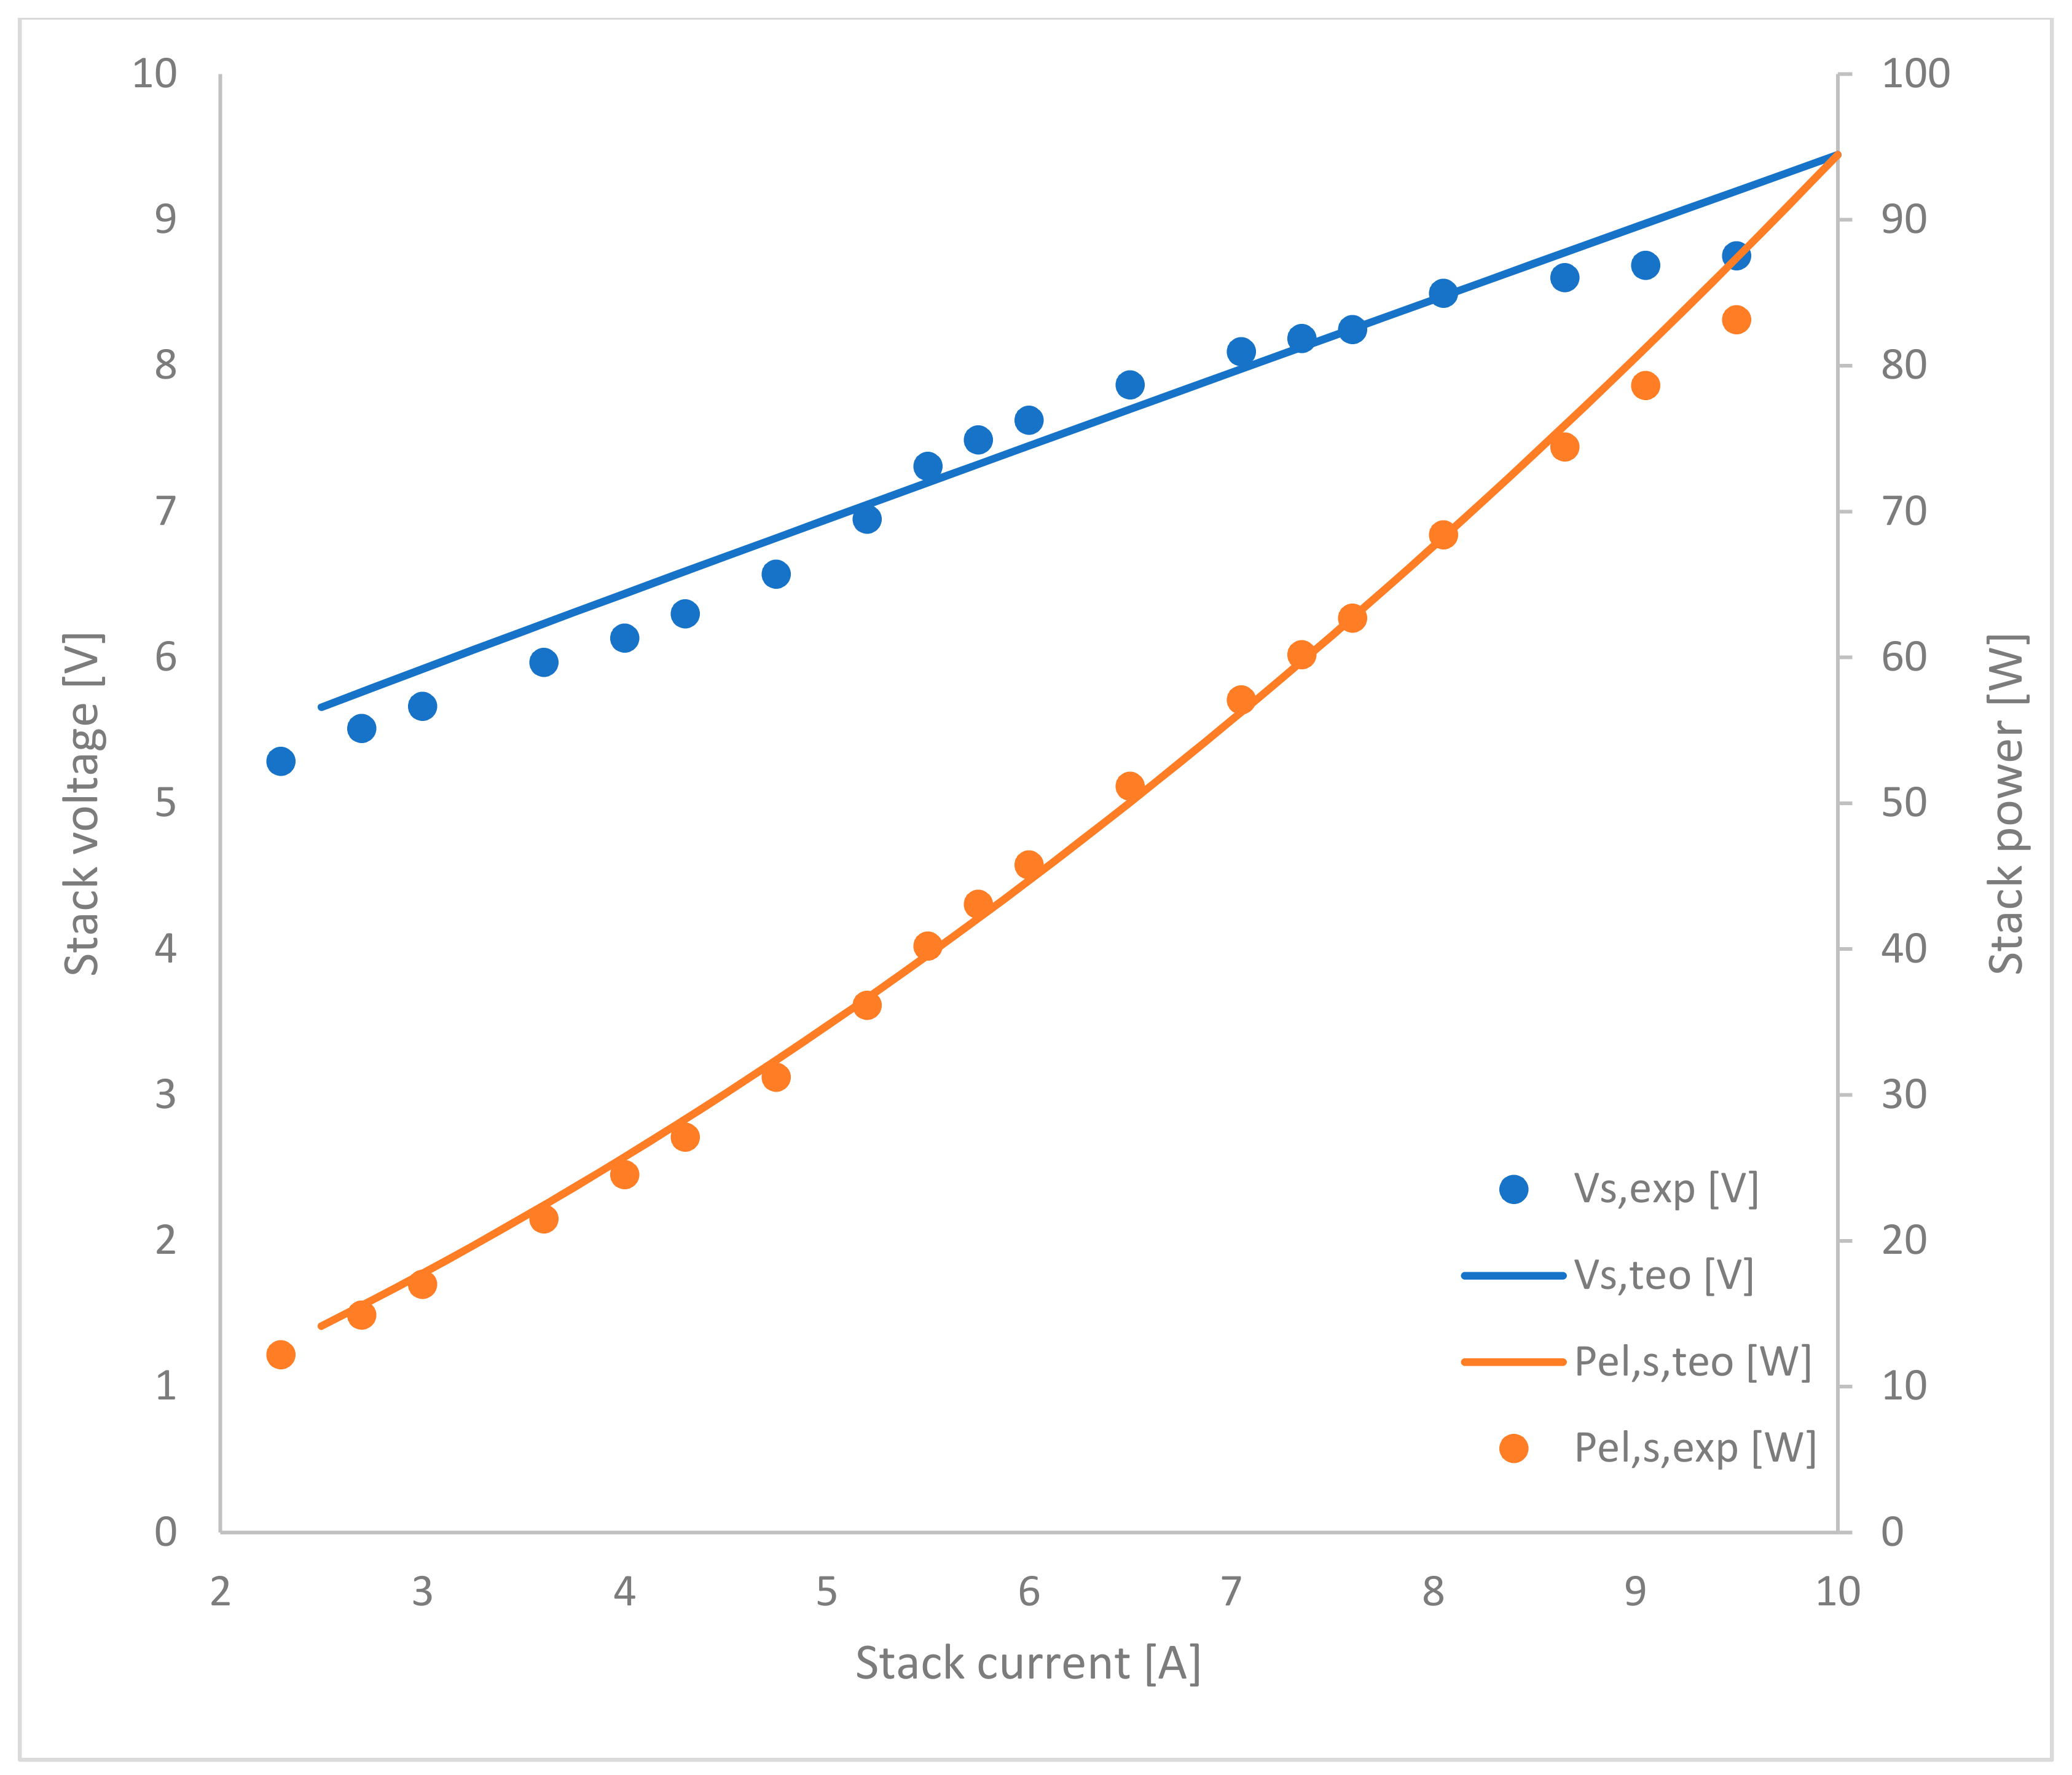
2.2. PEM Electrolytic Stack

The PEM electrolytic stack produces pure hydrogen at the cathode, through electrochemical reaction (5) [25]:
2 H + + 2 e   H 2
and oxygen at the anode, through electrochemical reaction (6):
H 2 O 2 H + + 1 2 O 2 + 2 e
Figure 3 shows the layout of the PEM electrolytic stack in the Simulink® environment.
The main equations of the PEM electrolytic stack are Equations (7)–(12):
V s t = O C V s + V a n , s t + V c a t , s t + R e l , s t · I s t
I s t = I a n , s , 1 t + I a n , s , 2 t = I c a t , s , 1 t + I c a t , s , 2 t
d V a n , s t d t · C a n , s t = I a n , s , 1 t
d V c a t , s t d t · C c a t , s t = I c a t , s , 1 t
V c a t , s t = R c a t , s t · I c a t , s , 2 t
V a n , s t = R a n , s t · i a n , s , 2 t
Equation (7) is the equation for the calculation of the real voltage of the PEM electrolytic stack, Equation (8) are the currents balance equations at the circuit main nodes, Equations (9) and (10) are the current equations for the capacitive anode and cathode branches, Equations (11) and (12) are the voltage equations for resistive anode and cathode branches.
In Equations (7)–(12), O C V s , V a n , s t , V c a t , s t , R e l , s t , I s t , I a n , s , 1 t , I a n , s , 2 t , I c a t , s , 1 t , I c a t , s , 2 t , C a n , s t , C c a t , s t , R c a t , s t , and R a n , s t are, respectively, the open circuit voltage, the voltage losses on the anodes and cathodes, the electrolytes ohmic resistance, the stack current, the currents on the resistive and capacitive anode branches, the currents on the resistive and capacitive cathode branches, the anode and cathode capacitances, the anode and cathode ohmic resistances.
The real voltage requested by the PEM electrolytic stack is also calculated through Equation (13):
V s t = O C V s + Δ V a c t , s I s t + R s I s t · I s t + Δ V c o n c , s   I s t    
In Equation (13),   Δ V a c t , s I s t , Δ V c o n c , s   I s t , and R s I s t · I s t are, respectively, the stack open circuit voltage, activation, concentration and ohmic/contact polarization over-voltages, functions of the stack current, I s t .
The stack open circuit voltage is expressed through Equation (14):
O C V s = R i d I s t · I s t
In Equation (14), R i d I s t is an ideal resistance function of the stack current,   I s t .
In the second member of Equation (13), the sum of the other terms is expressed by Equation (15):
Δ V a c t , s I s t + R s I s t · I s t + Δ V c o n c , s   I s t = = Δ V a c t , a n I s t + Δ V a c t , c a t I s t + R a n t · I s t + R c a t t · I s t + + R m e m I s t · I s t + Δ V c o n c , a n I s t + Δ V c o n c , c a t I s t = = Δ V a c t , a n I s t + R a n t · I s t + Δ V c o n c , a n I s t + R m e m I s t · I s t + Δ V a c t , c a t I s t + + R c a t t · I s t + Δ V c o n c , c a t I s t + Δ V a c t , c a t I s t + R c a t t · I s t + Δ V c o n c , c a t I s t
Δ V a c t , a n I s t , Δ V c o n c , a n I s t , and R a n t · I s t are, respectively, the activation and concentration polarization over-voltages of the anodes, both functions of the stack current,   I s t , and the ohmic over-voltage of the anodes in the stack.
The product R m e m I s t · I s t is the ohmic-contact over-voltage of the electrolytes, bipolar plates and end plates in the stack, which is a function of the stack current,   I s t .
Δ V a c t , c a t I s t , Δ V c o n c , c a t I s t , and R c a t t · I s t are, respectively, the activation and concentration polarization over-voltages of the cathodes, both functions of the stack current,   I s t , and the ohmic over-voltage of the cathodes in the stack.
In the stack current operating range,   I s , m i n I s t I s , m a x , Equations (16)–(19) are written:
R i d I s t = R i d I s , m i n + D R i d I s t
Δ V a c t , a n I s t I s t + R a n t + Δ V c o n c , a n I s t I s t = R a n I s t = R a n I s , m i n + D R a n I s t
R m e m I s t = R m e m I s , m i n + D R m e m I s t
Δ V a c t , c a t I s t I s t + R c a t t + Δ V c o n c , c a t I s t I s t = R c a t I s t = R c a t I s , m i n + D R c a t I s t .  
In Equations (16)–(19), the resistances R i d I s t ,   R a n I s t , R m e m I s t , and R c a t I s t are the sum of the minimum resistances R i d I s , m i n ,   R a n I s , m i n , R m e m I s , m i n , and R c a t I s , m i n and the resistance variations with respect to their respective minimum values calculated at the stack operating current, I s t , D R i d I s t , D R a n I s t , D R m e m I s t , and D R c a t I s t .
D R i d I s , m i n ,   D R a n I s , m i n , D R m e m I s , m i n , and D R c a t I s , m i n values are zero.
At the stack maximum current, I s , m a x , the resistances R i d I s , m a x ,   R a n I s , m a x , R m e m I s , m a x , and R c a t I s , m a x are calculated through Equations (20)–(23):
R i d I s , m a x = R i d I s , m i n + D R i d I s , m a x
R a n I s , m a x = R a n I s , m i n + D R a n I s , m a x .  
R m e m I s , m a x = R m e m I s , m i n + D R m e m I s , m a x
R c a t I s , m a x = R c a t I s , m i n + D R c a t I s , m a x
In Figure 3, the six ideal switches are used to increase the resistances R i d I s ,   R a n I s , R m e m I s , and R c a t I s from their minimum values R i d I s , m i n , R a n I s , m i n , R m e m I s , m i n , R c a t I s , m i n to their maximum values R i d I s , m a x ,   R a n I s , m a x , R m e m I s , m a x , and R c a t I s , m a x .
In addition, in the anode and in the cathode, the double layer of charge separation is represented by the two capacitors, C a n and   C c a t . In this way, when a current variation is imposed, the dynamic behavior required by charge layers to vary is reproduced.
The instantaneous molar flow of hydrogen produced by the PEM electrolytic stack, F H 2 , p t , depends on the instantaneous stack operating current, I s t , and on the number of electrolytic cells in the stack, N c , and it is calculated through Equation (24):
F H 2 , p t = N c · I s t 2 · F a  
Figure 4 shows the comparison between the PEM electrolytic stack static experimental data found in the literature [26] and the static polarization and electric power curves produced by the simulation model.
The PEM electrolyzed considered is the NMH2 1000 from HELIOCENTRIS (HELIOCENTRIS, Berlin, Germany) and the main characteristics of the PEM electrolytic stack experimentally tested by Guilbert and Vitale in [26] are shown in Table 1.
Figure 4 shows that there is a good agreement between the simulation model results and the experimental data because the mean absolute percentage errors do not reach 3%.

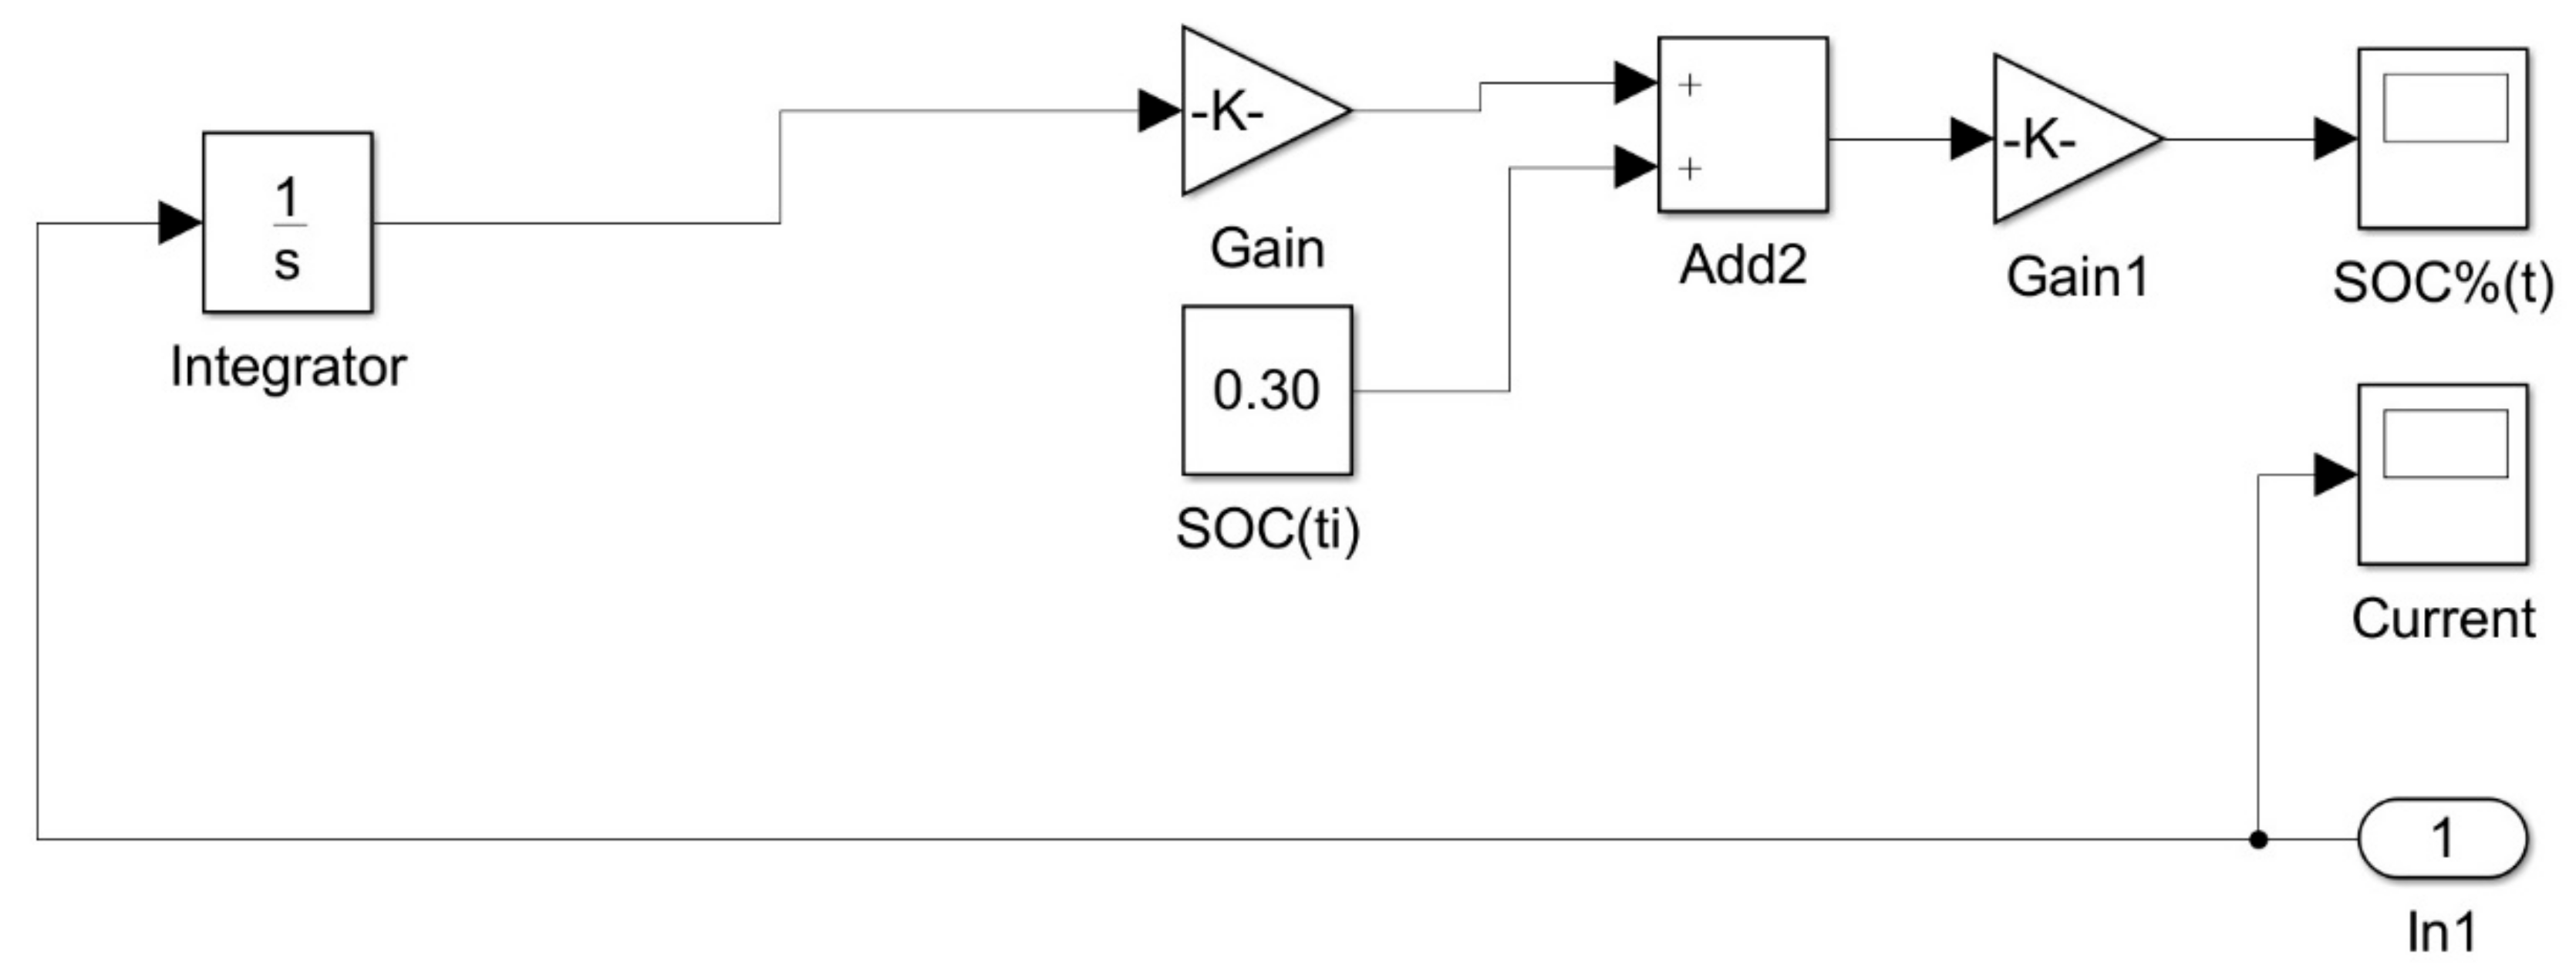
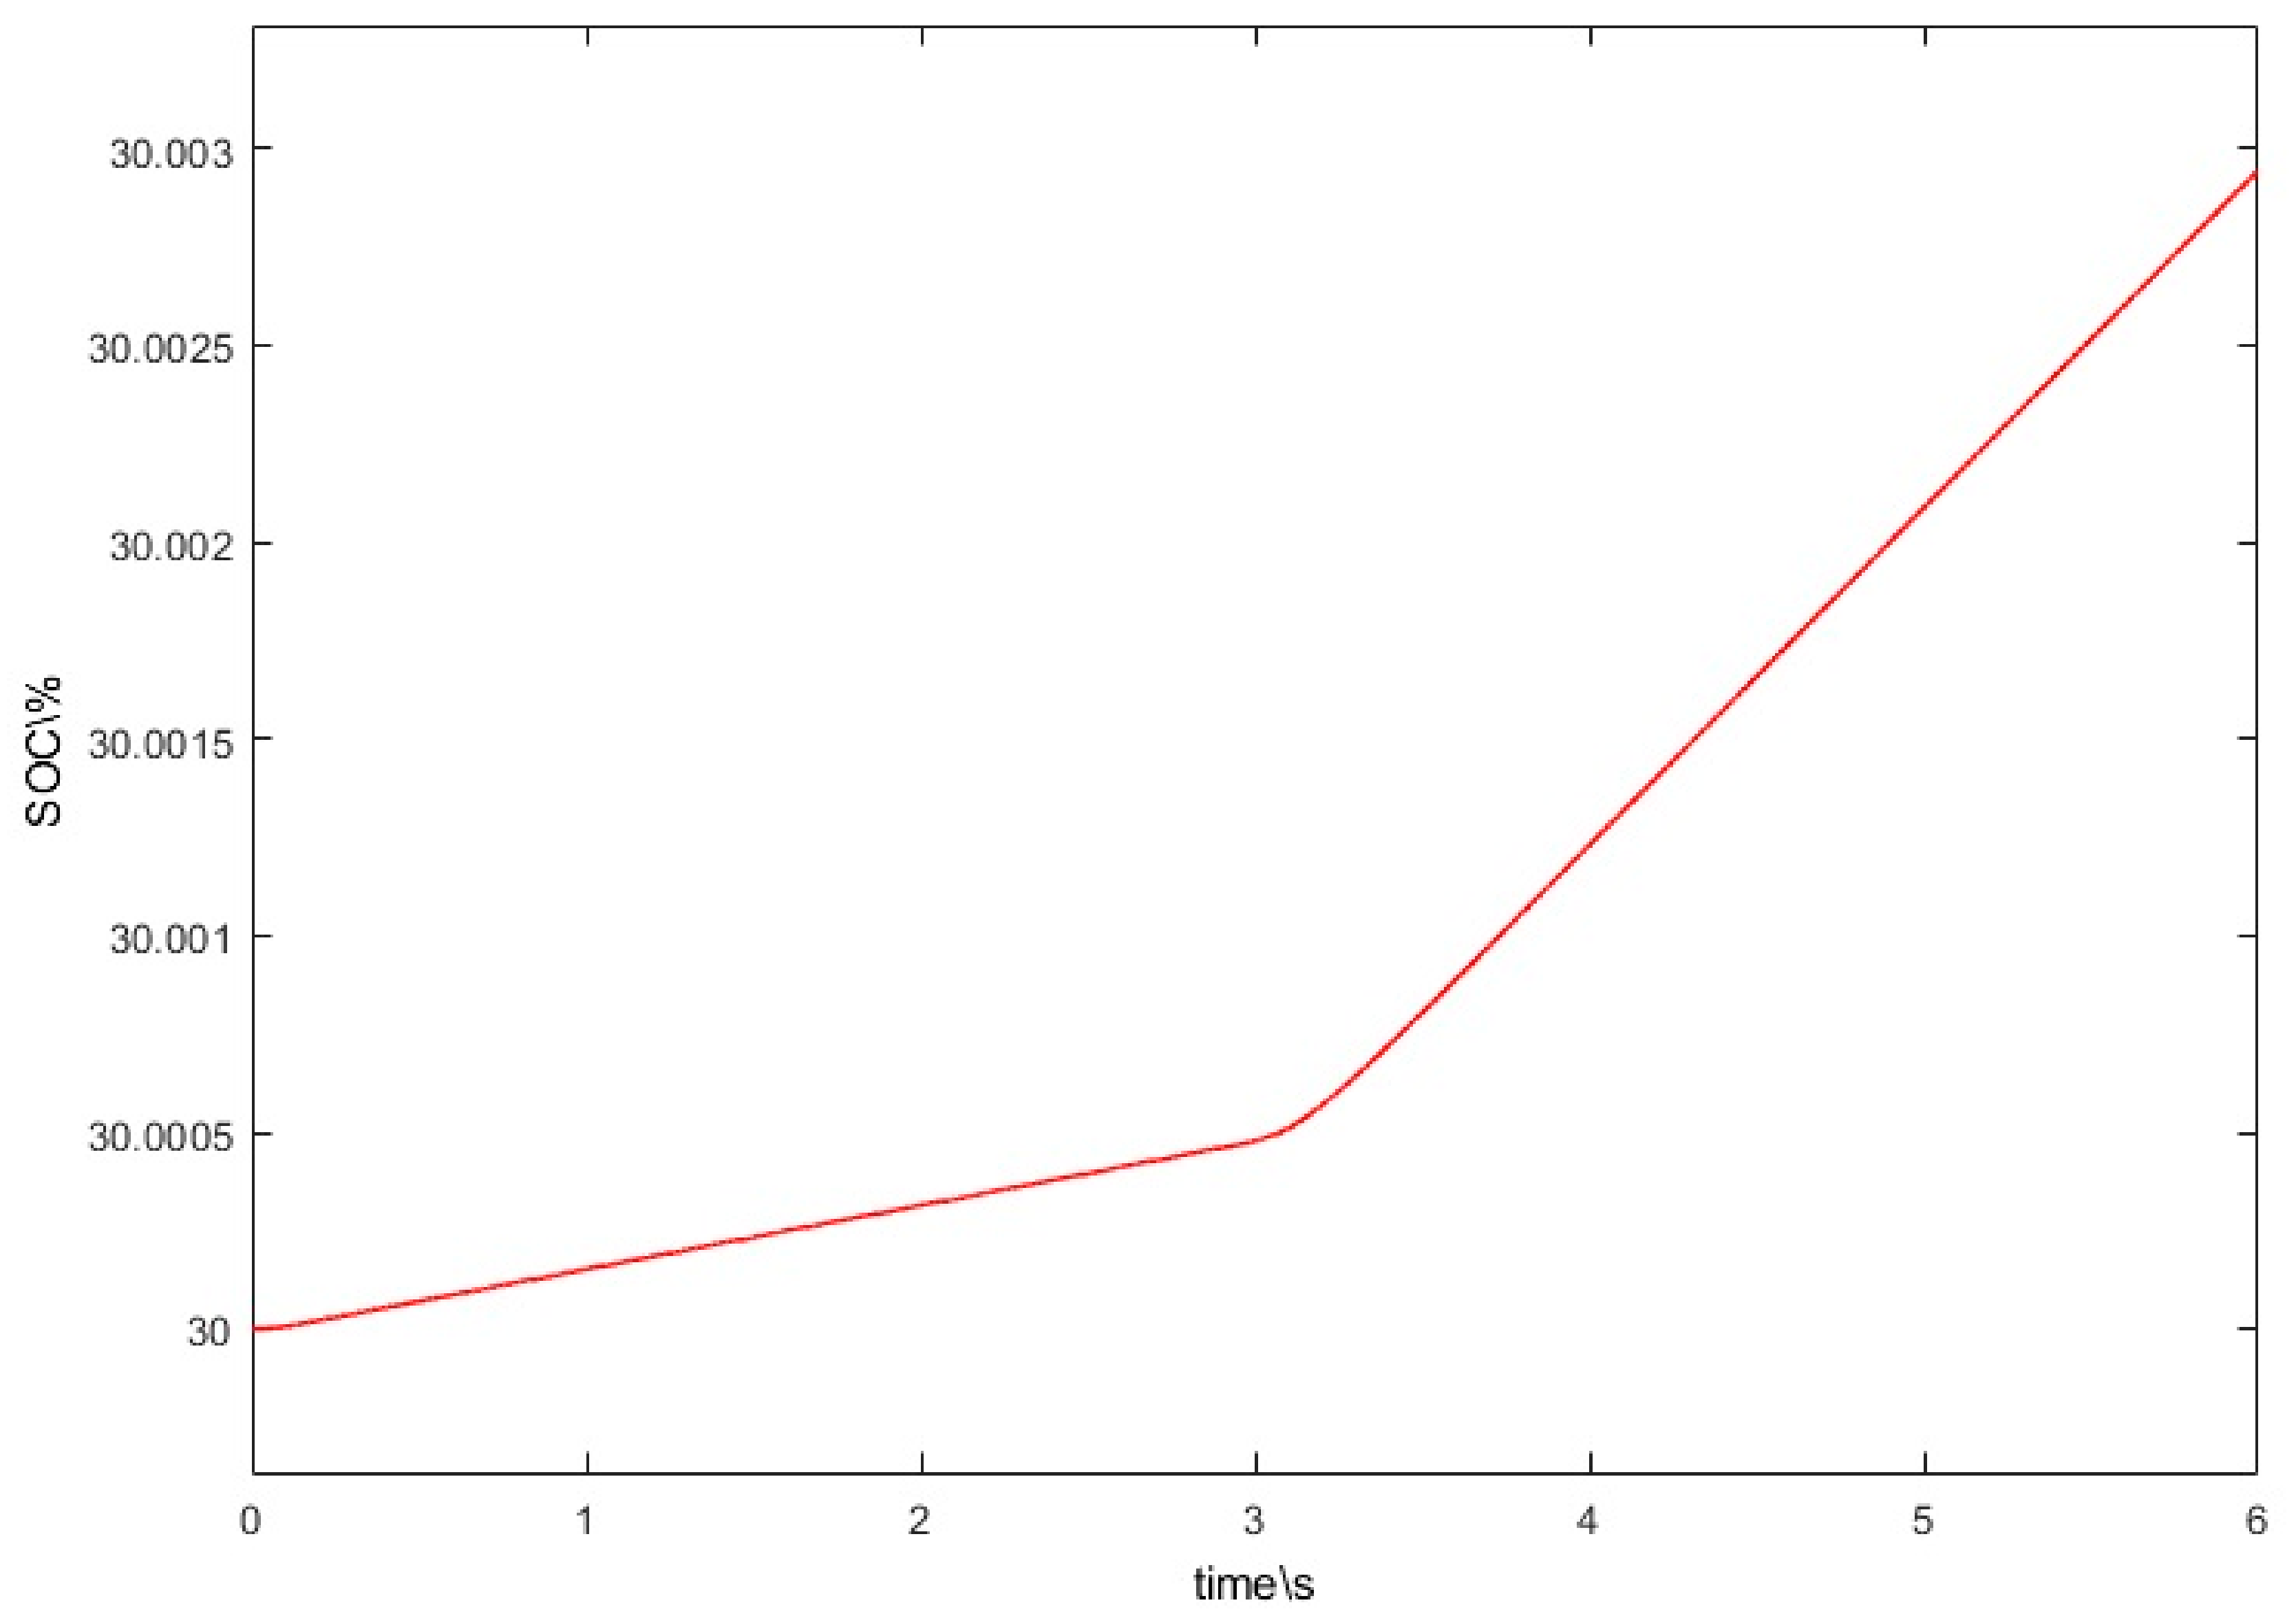
2.3. Hydrogen Storage System

The storage system is composed of cylinders with gaseous hydrogen at low pressure (<20 bar).
Figure 5 shows the layout of the hydrogen storage system in the Simulink® environment.
The instantaneous State Of Charge for the storage system,   S O C t , is calculated through Equation (25):
S O C t = p t p m a x = S O C t i + 1 N c y l · N m o l . m a x t i t F H 2 , p t · d t  
where p t ,   p m a x , S O C t i , N c y l , N m o l . m a x are, respectively, the instantaneous and maximum pressures, the state of charge at the initial instant, t i , the number of cylinders, and the maximum mole number of hydrogen in a single cylinder.

2.4. PEM Electrolyzer System

The PEM electrolytic absorbs an electric power, P e l , i n , s y s I s , for feeding its auxiliaries and to produce and store hydrogen in low pressure cylinders.
The hydrogen production efficiency of the PEM electrolyzer system, η H 2   p r o d I s , is calculated through Equation (26):
η H 2   p I s = F H 2 , p I s · M W H 2 · H H V P e l , i n , s y s I s

3. Numerical Simulations and Results Analysis

The numerical simulation model is implemented in the Simulink® environment and the calculation tool is used to simulate the electric dynamic behavior of the PEM electrolyzer system.
Table 2 shows the values of the main DC/DC buck converter’s input parameters. The values of the parameters   L 1 , C i n 1 , and C o u t 1 are calculated through Equations (1)–(4), in such a way that the buck converter operates correctly at both maximum and minimum power output.
Table 3 shows the values of the main PEM electrolytic stack’s input parameters. The operating stack current,   I s t , is assumed variable between a minimum value, I s , m i n , and a maximum value, I s , m a x .
After having defined the cell number of the PEM electrolytic stack,   N c , the parameters O C V s , Δ V a c t , a n I s ,   Δ V a c t , c a t I s and Δ V c o n c , a n   I s , Δ V c o n c , c a t   I s are calculated though the equations found in the literature [33,34].
The resistance of the electrodes (anodes and cathodes), R a n I s and R c a t I s , are very low as compared to the resistance of the electrolyte (membrane), R m e m I s for a stack with N c < 10 [35], so they can be neglected. R m e m I s is assumed linearly variable between a minimum value and a maximum value, respectively considered at the minimum and maximum operating current.
The values of R i d I s , m i n ,   R a n I s , m i n ,   R m e m I s , m i n , R c a t I s , m i n , D R i d I s , m a x ,   D R a n I s , m a x , D R m e m I s , m a x , and D R c a t I s , m a x are calculated through Equations (16)–(23).
C c a t and C a n are assumed to be equal to each other and constant as the stack operating current varies.
Table 4 shows the values of the main hydrogen storage system’s input parameters. The storage system considered is composed of three hydrogen cylinders with a volume of 50 L and a maximum gas pressure of 16 bar. The state of charge at the initial instant,   SOC t i = 0   s , is set to 0.30.
For the PEM electrolyzer system, the auxiliary resistance,   R a u x , is set up constant and equal to 23.04 Ω and the specific capacitance of the filter, C s t a b 2 , is set up equal to 0.02 Fa to control the stack voltage increase, which could damage the stack irreversibly. At 0 s, it is turned on and fed at minimum power, and at 3 s, the same system is instantaneously fed at maximum power.
Figure 6 shows the time trends of PEM electrolytic stack voltage and current to a supply power variation from its minimum value to its maximum value at 3 s. The values of the parameters L 1 , C o u t 1 , and C s t a b 2 are ad hoc set up to reduce the voltage and current increases and to safeguard the stack.
The voltage percentage increases are, respectively, of about 3% at the system start-up (0 s) and 0% at supply variation time (3 s) referred to minimum and maximum stack voltage of 6.69 V and 16.59 V.
The current percentage increases are, respectively, of about 3% at the system start-up (0 s) and 0% at supply power variation time (3 s) referred to minimum and maximum stack current of 4.5 A and 24.5 A.
In this case, the calculation tool is able to control the electric power absorbed by the PEM electrolyzer system, to diagnose and prevent the PEM electrolytic stack over-voltages and over-currents, which can occur in this variable operating condition.
Figure 7 shows the SOC percentage trend in H2 storage system for a supply power variation from its minimum value to its maximum value at 3 s. As expected, the SOC increases slower when the PEM electrolyzer system is fed at minimum power and faster when the same PEM electrolyzer system is fed at maximum power.
Therefore, the calculation tool is able to monitor also the SOC percentage in the H2 storage system.
Figure 8 shows the trend of the hydrogen production efficiency for the PEM electrolyzer system at variable stack operating current. The PEM electrolyzer system reaches the maximum production efficiency of about 0.754 at a stack current of about 7.5 A because, at high stack current, the electric power absorbed by the system increases more rapidly than the molar flow of hydrogen produced by the stack. This rapid increase of the electric power is caused by the rapid increase of the over-voltages for the stack.
Therefore, the calculation tool is able to identify the best operating stack current range which results between 4.5 A and 14.5 A because, in this range, the stack over-voltages increase, but they remain low.

4. Conclusions

In the present article, a calculation tool based on the dynamic simulation model of a PEM electrolyzer system, which is composed of the DC/DC buck converter, the PEM electrolytic stack, the auxiliaries, and the pressurized hydrogen storage system, is ad hoc set up in the Simulink® environment.
The comparison between the PEM electrolytic stack static experimental data found in the literature and the static polarization and electric power curves produced by the simulation model has shown a good agreement between the simulation model results and the experimental data.
Using the calculation tool, the usual inductance and the capacitance at the output of the DC/DC buck converter and the capacitance of the special capacitive filter are ad hoc set up to reduce the stack voltage and current peaks, which could damage the stack irreversibly.
The feeding power of the PEM electrolyzer system is changed from a minimum value (about 56 W) to a maximum value (about 440 W) acting appropriately on the duty ratio of the DC/DC buck converter.
The calculation tool is used to evaluate the time trends of PEM electrolytic stack current and voltage to the above-mentioned supply power variation. Both the voltage and current percentage increases are found to be about 3% at the system start-up (0 s) and around 0% at supply power variation time (3 s) referred to minimum and maximum voltages and currents of the stack.
Through the calculation tool, the SOC percentage trend in H2 pressure storage system for the above-mentioned supply power variation is traced and, as expected, its variation depends on the molar flow of hydrogen produced and on the operating stack current.
Furthermore, the calculation tool is used to trace the trend of the hydrogen production efficiency for the PEM electrolyzer system at variable stack operating current and to identify its optimal operating field.
The PEM electrolyzer system reaches the maximum production efficiency, referred to hydrogen HHV, of about 0.754 at a stack current of about 7.5 A. The best operating current range of the stack is found to be from 4.5 A to 14.5 A.
In the future, the calculation tool will be further developed and calibrated dynamically on the basis of experimental data directly acquired by the authors on the newly installed test bench, and it will be used to make a parametric study of the PEM electrolyzer system by changing its macroscopic and microscopic operating parameters.
The results will be useful to design a suitable converter for interfacing PEM electrolyzer systems into an nGfHA.

Author Contributions

Conceptualization, G.D.L.; methodology, G.D.L.; software, G.D.L.; formal analysis, G.D.L. and P.F.; investigation, G.D.L. and P.F.; resources, G.D.L. and P.F.; data curation, G.D.L. and P.F.; writing—original draft preparation, G.D.L. and P.F.; writing—review and editing, G.D.L. and P.F.; visualization, G.D.L. and P.F.; supervision, G.D.L. and P.F.; project administration, P.F. and R.G.A.; funding acquisition, P.F. and R.G.A. All authors have read and agreed to the published version of the manuscript.

Funding

This work was carried out with the financial support of the Italian Ministry of Universities and Research, MUR, (Project: PON 2018–2020, “Community Energy Storage: Gestione Aggregata di Sistemi di Accumulo dell’Energia in Power Cloud”, ComESto, ARS01_01259, code: H56C18000150005).

Conflicts of Interest

The authors declare no conflict of interest.

Nomenclature

SYMBOLSUnits
LinductanceH
VvoltageV
Dduty ratio-
ffrequencyHz
ΔIcurrent variationA
Ccapacitance Fa
ΔVvoltage variation or over-voltageV
nphase number-
tduration or times
IcurrentA
OCVopen circuit voltageV
RresistanceΩ
Fmolar flowmol s−1
FaFaraday constant C mol−1
ppressurebar
Nnumber-
SOCState Of Charge for hydrogen storage system-
PpowerW
MWmolecular weight kg mol−1
ηefficiency-
HHVhigh heating valueJ kg−1
VolVolumeL
SUBSCRIPTS
1,2indices
in, outat the inlet and at the outlet
swswitch
L1referred to inductance L1
min, maxminimum and maximum values
stepload step
actactivation polarization
concconcentration polarization
sstack
idideal
memmembrane electrolyte
ananode
catcathode
cylcylinders
molmoles of hydrogen
H2hydrogen
pproduced or production
elelectric
sysPEM electrolyzer system
auxauxiliary
celectrolytic cell

References

  1. European Commission: Climate Action, Key Targets for 2030. Available online: https://ec.europa.eu/clima/policies/strategies/2030_en (accessed on 19 July 2022).
  2. European Commission. «Accelerating Clean Energy Innovation» EUR-Lex, Brussels. 2016. Available online: https://eur-lex.europa.eu/legal-content/EN/TXT/?uri=CELEX%3A52016DC0763 (accessed on 19 July 2022).
  3. European Commission. «Delivering a New Deal for Energy Consumers» EUR-Lex, Brussels. 2015. Available online: https://eur-lex.europa.eu/legal-content/EN/TXT/?uri=CELEX%3A52015DC0339 (accessed on 19 July 2022).
  4. Directorate-General for Energy (European Commission); Joint Research Centre (European Commission). «Transforming the European Energy System through Innovation—Integrated Strategic Energy Technology (SET) Plan: Progress in 2016» Luxembourg: Publications Office of the European Union. Available online: https://ec.europa.eu/energy/sites/ener/files/documents/set-plan_progress_2016.pdf (accessed on 19 July 2022).
  5. Fragiacomo, P.; De Lorenzo, G.; Corigliano, O. Performance analysis of an Intermediate Temperature SOE Test bench under a CO2-H2O feeding stream. Energies 2018, 11, 2276. [Google Scholar] [CrossRef]
  6. De Lorenzo, G.; Corigliano, O.; Fragiacomo, P. Analysing thermal regime and transient by using numerical modelling for solid oxide electrolyser aided by solar radiation. Int. J. Therm. Sci. 2022, 177, 107545. [Google Scholar] [CrossRef]
  7. Fragiacomo, P.; De Lorenzo, G.; Corigliano, O. Design of an SOFC/SOE station: Experimental test campaigns. Energy Procedia 2018, 148, 543–550. [Google Scholar] [CrossRef]
  8. Fragiacomo, P.; Astorino, E.; Chippari, G.; De Lorenzo, G.; Czarnetzki, W.T.; Schneider, W. Anion Exchange Membrane Fuel Cell modeling. Int. J. Sustain. Energy 2018, 37, 340–353. [Google Scholar] [CrossRef]
  9. Fragiacomo, P.; Astorino, E.; Chippari, G.; De Lorenzo, G.; Czarnetzki, W.T.; Schneider, W. Dynamic Modeling of a Hybrid Electric System based on an Anion Exchange Membrane Fuel Cell. Cogent Eng. 2017, 4, 1357891. [Google Scholar] [CrossRef]
  10. De Lorenzo, G.; Milewski, J.; Fragiacomo, P. Theoretical and experimental investigation of syngas-fueled Molten Carbonate Fuel Cell for Assessment of its performance. Int. J. Hydrogen Energy 2017, 42, 28816–28828. [Google Scholar] [CrossRef]
  11. De Lorenzo, G.; Fragiacomo, P. Technical Analysis of an eco-friendly hybrid plant with a micro gas turbine and a MCFC system. Fuel Cells 2010, 10, 194–208. [Google Scholar] [CrossRef]
  12. Calderón, A.J.; Vivas, F.J.; Segura, F.; Andújar, J.M. Integration of a Multi-Stack Fuel Cell System in Microgrids: A Solution Based on Model Predictive Control. Energies 2020, 13, 4924. [Google Scholar] [CrossRef]
  13. Silaa, M.Y.; Derbeli, M.; Barambones, O.; Cheknane, A. Design and Implementation of High Order Sliding Mode Control for PEMFC Power System. Energies 2020, 13, 4317. [Google Scholar] [CrossRef]
  14. De Lorenzo, G.; Andaloro, L.; Sergi, F.; Napoli, G.; Ferraro, M.; Antonucci, V. Numerical simulation model for the preliminary design of hybrid electric city bus propulsion system with polymer electrolyte fuel cell. Int. J. Hydrogen Energy 2014, 39, 12934–12947. [Google Scholar] [CrossRef]
  15. De Luca, D.; Fragiacomo, P.; De Lorenzo, G.; Czarnetzki, W.T.; Schneider, W. Strategies for Dimensioning Two-Wheeled Fuel Cell Hybrid Electric Vehicles Using Numerical Analysis Software. Fuel Cells 2016, 16, 628–639. [Google Scholar] [CrossRef]
  16. Fragiacomo, P.; Piraino, F. Fuel cell hybrid powertrains for use in Southern Italian railways. Int. J. Hydrogen Energy 2019, 44, 27930–27946. [Google Scholar] [CrossRef]
  17. Nazir, M.S.; Ahmad, I.; Khan, M.J.; Ayaz, Y.; Armghan, H. Adaptive Control of Fuel Cell and Supercapacitor Based Hybrid Electric Vehicles. Energies 2020, 13, 5587. [Google Scholar] [CrossRef]
  18. Sampietro, J.L.; Puig, V.; Costa-Castelló, R. Optimal Sizing of Storage Elements for a Vehicle Based on Fuel Cells, Supercapacitors and Batteries. Energies 2019, 12, 925. [Google Scholar] [CrossRef]
  19. Kumar, S.S.; Himabindu, V. Hydrogen production by PEM water electrolysis—A review. Mater. Sci. Energy Technol. 2019, 2, 442. [Google Scholar] [CrossRef]
  20. Mandal, M.; Valls, A.; Gangnus, N.; Secanell, M. Analysis of Inkjet Printed Catalyst Coated Membranes for Polymer Electrolyte Electrolyzers. J. Electrochem. Soc. 2018, 165, F543–F552. [Google Scholar] [CrossRef]
  21. Li, R.; Cai, Y.; Reimer, U.; Wippermann, K.; Shao, Z.; Lehnert, W. CrN/Cr-Coated Steel Plates for High-Temperature Polymer Electrolyte Fuel Cells: Performance and Durability. J. Electrochem. Soc. 2020, 167, 144507. [Google Scholar] [CrossRef]
  22. Liang, M.; Fu, C.; Xiao, B.; Luo, L.; Wang, Z. A fractal study for the effective electrolyte diffusion through charged porous media. Int. J. Heat Mass Transf. 2019, 137, 365–371. [Google Scholar] [CrossRef]
  23. Xiao, B.; Wang, W.; Zhang, X.; Long, G.; Fan, F.; Chen, H.; Deng, L. A novel fractal solution for permeability and Kozeny-Carman constant of fibrous porous media made up of solid particles and porous fibers. Powder Technol. 2019, 349, 92–98. [Google Scholar] [CrossRef]
  24. Weiß, A.; Siebel, A.; Bernt, M.; Shen, T.H.; Tileli, V.; Gasteiger, H.A. Impact of Intermittent Operation on Lifetime and Performance of a PEM Water Electrolyzer. J. Electrochem. Soc. 2019, 166, F487–F497. [Google Scholar] [CrossRef] [Green Version]
  25. Awasthi, A.; Scott, K.; Basu, S. Dynamic modeling and simulation of a proton exchange membrane electrolyzer for hydrogen production. Int. J. Hydrogen Energy 2011, 36, 14779–14786. [Google Scholar] [CrossRef]
  26. Guilbert, D.; Vitale, G. Dynamic Emulation of a PEM Electrolyzer by Time Constant Based Exponential Model. Energies 2019, 12, 750. [Google Scholar] [CrossRef]
  27. Yigit, T.; Selamet, O.F. Mathematical modeling and dynamic Simulink simulation of high-pressure PEM electrolyzer system. Int. J. Hydrogen Energy 2016, 41, 13901–13914. [Google Scholar] [CrossRef]
  28. Görgün, H. Dynamic modelling of a proton exchange membrane (PEM) electrolyzer. Int. J. Hydrogen Energy 2006, 31, 29–38. [Google Scholar] [CrossRef]
  29. Hernandez-Gomez, A.; Ramirez, V.; Guilbert, D.; Saldivar, B. Development of an adaptive static-dynamic electrical model based on input electrical energy for PEM water electrolysis. Int. J. Hydrogen Energy 2020, 45, 18817–18830. [Google Scholar] [CrossRef]
  30. Brezak, D.; Kovač, A.; Firak, M. MATLAB/Simulink simulation of low-pressure PEM electrolyzer stack. Int. J. Hydrogen Energy 2022, in press. [Google Scholar] [CrossRef]
  31. Mohan, N.; Undeland, T.M.; Robbins, W.P. Power Electronics: Converters, Applications and Design, 3rd ed.; John Wiley & Sons: New York, NY, USA, 2003. [Google Scholar]
  32. Ejury, J.; Buck Converter Design. Infineon Technologies North America (IFNA) Corporation. Design Note DN 2013-01 V1.0 January 2013. Available online: https://www.infineon.com (accessed on 17 July 2022).
  33. Larminie, J.; Dicks, A. Fuel Cell Systems Explained, 2nd ed.; John Wiley & Sons Ltd.: Chichester, UK, 2002. [Google Scholar]
  34. Hernandez-Gomez, A.; Ramirez, V.; Guilbert, D. Investigation of PEM Electrolyzer modeling: Electrical domain, efficiency and specific energy consumption. Int. J. Hydrogen Energy 2020, 45, 14625–14639. [Google Scholar] [CrossRef]
  35. Li, X. Principles of Fuel Cells, 2nd ed.; Taylor & Francis: New York, NY, USA, 2006. [Google Scholar]
Figure 1. Layout of the PEM electrolyzer system in the Simulink® environment.
Energies 15 06437 g001
Figure 2. Layout of the DC/DC Buck Converter in the Simulink® environment.
Energies 15 06437 g002
Figure 3. Layout of the PEM electrolytic stack in the Simulink® environment.
Energies 15 06437 g003
Figure 4. Comparison between the PEM electrolytic stack’s theoretical polarization and electric power curves (Vs,teo and Pel,s,teo) and PEM electrolytic stack’s corresponding experimental data (Vs,exp and Pel,s,exp).
Energies 15 06437 g004
Figure 5. Layout of the hydrogen storage system in the Simulink® environment.
Energies 15 06437 g005
Figure 6. Time trends of PEM electrolytic stack voltage and current to a supply power variation from its minimum value to its maximum value at 3 s.
Energies 15 06437 g006
Figure 7. Time trend of the SOC percentage in the H2 storage system for a supply power variation from its minimum value to its maximum value at 3 s.
Energies 15 06437 g007
Figure 8. Trend of the hydrogen production efficiency for the PEM electrolyzer system at variable stack operating current.
Energies 15 06437 g008
Table 1. Main characteristic of PEM electrolytic stack experimentally tested by Guilbert and Vitale in [26].
ParameterUnitValue
Rated electrical powerW400
Stack operating voltage rangeV7.5–8
Stack current range A0–50
Output H2 pressure bar0.1–10.5
Cell number-3
Active area sectioncm250
Table 2. Main input parameters of DC/DC buck converter.
ParameterUnitValue
f s w Hz1000
L 1 H0.107
R i n 1 Ω0.02
R o u t 1 Ω0.002
C i n 1 Fa0.023
C o u t 1 Fa4.62 × 10−5
Table 3. Main input parameters of PEM electrolytic stack.
ParameterUnitValue
I s , m i n A4.5
I s , m a x A24.5
R i d I s , m i n Ω0.8299
D R i d I s , m a x Ω−0.6774
R a n I s , m i n Ω0.0119
D R a n I s , m a x Ω−0.0075
R m e m I s , m i n Ω0.1607
D R m e m I s , m a x Ω−0.0001
R c a t I s , m i n Ω0.0465
D R c a t I s , m a x Ω−0.0303
N c -3
C c a t Fa0.05
C a n Fa0.05
Table 4. Main input parameters of the H2 storage system.
ParameterUnitValue
N c y l -3
N m o l . m a x mol34
p m a x bar16
V o l c y l L50
S O C t i -0.30
Publisher’s Note: MDPI stays neutral with regard to jurisdictional claims in published maps and institutional affiliations.

