Article

Upgrading Conventional Power System for Accommodating Electric Vehicle through Demand Side Management and V2G Concepts

by
Majed A. Alotaibi
1,2,3,* and
Ali M. Eltamaly
2,3,4,5,*
1
Department of Electrical Engineering, College of Engineering, King Saud University, Riyadh 11421, Saudi Arabia
2
K.A.CARE Energy Research and Innovation Center at Riyadh, Riyadh 11451, Saudi Arabia
3
Saudi Electricity Company Chair in Power System Reliability and Security, King Saud University, Riyadh 11421, Saudi Arabia
4
Sustainable Energy Technologies Center, King Saud University, Riyadh 11421, Saudi Arabia
5
Electrical Engineering Department, Faculty of Engineering, Mansoura University, Mansoura 35516, Egypt
*
Authors to whom correspondence should be addressed.
Energies 2022, 15(18), 6541; https://doi.org/10.3390/en15186541
Submission received: 17 August 2022 / Revised: 3 September 2022 / Accepted: 5 September 2022 / Published: 7 September 2022
(This article belongs to the Special Issue Sizing and Allocation Strategies of Renewable Distributed Generations)

Abstract

:
The continually increasing fossil fuel prices, the dwindling of these fuels, and the bad environmental effects which mainly contribute to global warming phenomena are the main motives to replace conventional transportation means to electric. Charging electric vehicles (EVs) from renewable energy systems (RES) substantially avoids the side effects of using fossil fuels. The higher the increase in the number of EVs the greater the challenge to the reliability of the conventional power system. Increasing charging connections for EVs to the power system may cause serious problems to the power system, such as voltage fluctuations, contingencies in transmission lines, and loss increases. This paper introduces a novel strategy to not only replace the drawbacks of the EV charging stations on the power system’s stability and reliability, but also to enhance the power system’s performance. This improvement can be achieved using a smart demand side management (DSM) strategy and vehicle to grid (V2G) concepts. The use of DSM increases the correlation between the loads and the available generation from the RES. Besides this, the use of DSM, and the use of V2G concepts, also helps in adding a backup for the power system by consuming surplus power during the high generation period and supplying stored energy to the power system during shortage in generation. The IEEE 30 bus system was used as an example of an existing power system where each load busbar was connected to a smart EV charging station (SEVCS). The performance of the system with and without the novel DSM and V2G concepts was compared to validate the superiority of the concepts in improving the performance of the power system. The use of modified particle swarm optimization in optimal sizing and optimal load flow reduced the cost of energy and the losses of the power system. The use of the smart DSM and V2G concepts substantially improved the voltage profile, the transmission line losses, the fuel cost of conventional power systems, and the stability of the power system.

1. Introduction

Due to climate change and energy security challenges, many countries around the world have shifted their reliance from conventional power energy sources to renewable energy sources (RES). Moreover, as means of transportation share a substantial part of fossil fuel usage, it has been recommended to gradually replace reliance of transportation on fossil fuels to RESs to supply electric vehicles (EVs) with their energy needs. The excessive use of RES and EVs in existing power systems adds great reliability challenges to the conventional systems. Moreover, the load increase requires new power plants and the replacement of the limited size of transmission lines. Moreover, the use of EVs may increase the peak demand and may change its occurrence time. In this current study we aimed to solve the challenges using a novel demand side management (DSM) method and the V2G concepts introduced in this study as its main contribution. This option may not be available and it adds financial challenges or impractical modifications to the existing power systems. Looking for alternative options, such as the use of RES as distributed generators (DG) with effective DSM strategy to feed EVs using vehicle to grid (V2G) concepts can solve the problem [1]. Renewable energy sources reduce pollution and secure energy sources, as well as reduce the cost of energy. The low maintenance and operation costs of RES can substantially offset the up-front costs of these sources. Due to the volatile nature of these sources, they need an energy storage system (ESS) to store the extra power generated from RES to be used during shortages of generation. Most technologies used as ESS are expensive and they add substantially to the cost of the system. For this reason, the battery of the EV can be used as an ESS to provide the load with its needs during shortage of generated energy and then to store surplus energy during high generation of energy from the RES. This idea is called the vehicle to grid (V2G) operation. One of the pioneer studies that started the efforts of V2G was introduced in 1997 [2]. EVs would be used to suppress the fluctuations in the real power [3,4], or to support the reactive power [5,6]. The support of reactive power using EVs uses the dc-link capacitor and does not use the stored energy of the battery, so does not cause battery degradation. Moreover, it can supply the power system with its needs even when EVs are not connected to charging terminals.
With the excessive use of EVs, the existing power system should be upgraded to be able to support these changes in load characteristics and values. The need for fast charging of the EV batteries needs a very high current source which may cause high voltage drops and contingencies in transmission lines [7,8]. Efforts have been introduced in the literature to remedy the effects of these problems [7,8,9,10,11,12]. One of the solutions introduced in the literature is to use a RES near the EV charging stations to support them without the need to rely on the existing power system. In this case, the new RES at load busbars, the existing power system, and the batteries of the EVs work in synergistic collaboration to ensure the stability of the power system. The existing power system can work as energy storage for the RES, where it can feed the shortage of energy generation from the existing conventional power plant and extract surplus power during high generation periods from the RES to save a considerable amount of fossil fuels. Smart grid concepts can be applied to support the reliability of the power system using demand side management (DSM) concepts [7,13,14]. Some studies discussed the refusal of some EV owners to participate in DSM programs and introduced some incentives to attract participation in DSM to gain benefits, as well as the electric utility [13,14,15]. A lot of effort has been introduced in the literature to use the demand response (DR) with EVs to enhance power system stability [7,8,9,10,11,12]. The use of self and cross elasticity to support the power system incorporating RES for EV charging and discharging has been suggested [7]. This DR strategy was introduced for a general power system in [15]. This study showed that with a smart charging/discharging strategy for EVs a substantial improvement to the radial distribution network (RDN) was achieved, in terms of voltage stability and contingency avoidance. Another study used the DR as further support for the power system containing EV charging stations and RES [16]. The integration of the charging stations into the existing power system may cause several problems, which should be considered to improve operating performance. Some studies [17], introduced an EV charging station to feed the EVs with optimum utilization of generated energy from the RES. Another study [18] introduced a design for an EV charging station to maximize profit and reduce battery degradation during fast charging. Most of these studies design the EV charging stations based on real-time operation [11,12,19,20,21,22,23,24] and some others use forecasting strategies, such as a day-ahead forecasting [25,26,27]. Several efforts have been introduced to reduce the effect of fast charging on the performance of the power system using optimization algorithms to increase the correlation between the generated energy from RES and EV charging load [26,27]. Many EV charging stations have used green hydrogen as an ESS and some others used batteries and diesel generators as backup sources of energy [28].
The main challenge in the modeling of the EV charging station is uncertainty around the use of EVs. It is not easy to predict the daily distance that an EV uses, the departure and return times of each EV, the state of charge (SoC) of the batteries, and the welling of the EV owners to participate in the V2G and DR programs. All these challenges have been studied in the literature [29,30,31,32,33,34]. Some of these studies used historical data to predict EV loads using neural networks [29,32] or stochastic strategies, such as Monte Carlo simulation [30,31]. Some other studies used simple distribution strategies to represent the behavior of EV owners and used this to predict the load variation due to EVs [33,34].
In this study, a DR strategy using a fuzzy logic controller (FLC) is introduced to flatten the load demand and increase the correlation between the load and the available generation from the RES. Moreover, for further support to the power system, V2G concepts are used which can switch the problem to a solution. In this study, the EV charging stations are connected to load busbars of the IEEE 30 bus benchmark power system to study their effects on the stability of the power system. The side effects of using EV charging stations are overcome using an effective DR strategy and the V2G concept. A novel DR strategy is introduced using a fuzzy logic controller to increase the correlation between the available generation from the RES and the EV charging load. An effective tariff estimation, using the time of use strategy, is introduced in this paper. Moreover, the power system gets support during shortage of generation using the V2G support. Another forecasted day ahead strategy is used to further support to the power system.
The main contributions of this study can be summarized in the following points:
  • An accurate estimation of the loads due to an EV is introduced using a novel stochastic strategy.
  • Optimal sizing for EV charging stations containing hybrid RES, the green hydrogen storage system (GHSS), and battery energy storage systems (BESS) is introduced to support the proposed EV charging station and the whole power system.
  • A novel and effective DR strategy, using FLC, adds support to the EV charging station and the power system as well.
  • A novel day ahead forecasting strategy adds more support to the power system during any unexpected operating conditions.
  • Optimal operation of the whole power system, using several EV chargers, is proposed by using a novel model for the whole system.
The rest of this study is prepared to show the modeling of different components of the EV charging station, such as the wind and photovoltaic energy systems, the modeling of the GHSS, BESS, the EV load forecasting, the DR strategy, and the optimization algorithm used to determine the optimal size of each component of the EV charging station. A detailed description of the IEEE 30 bus system and how the EV charging station is connected to different busbars is provided in the Section 3. The simulation analysis and results of the proposed system are shown in the Section 4. The conclusions of the study are shown in the Section 5.

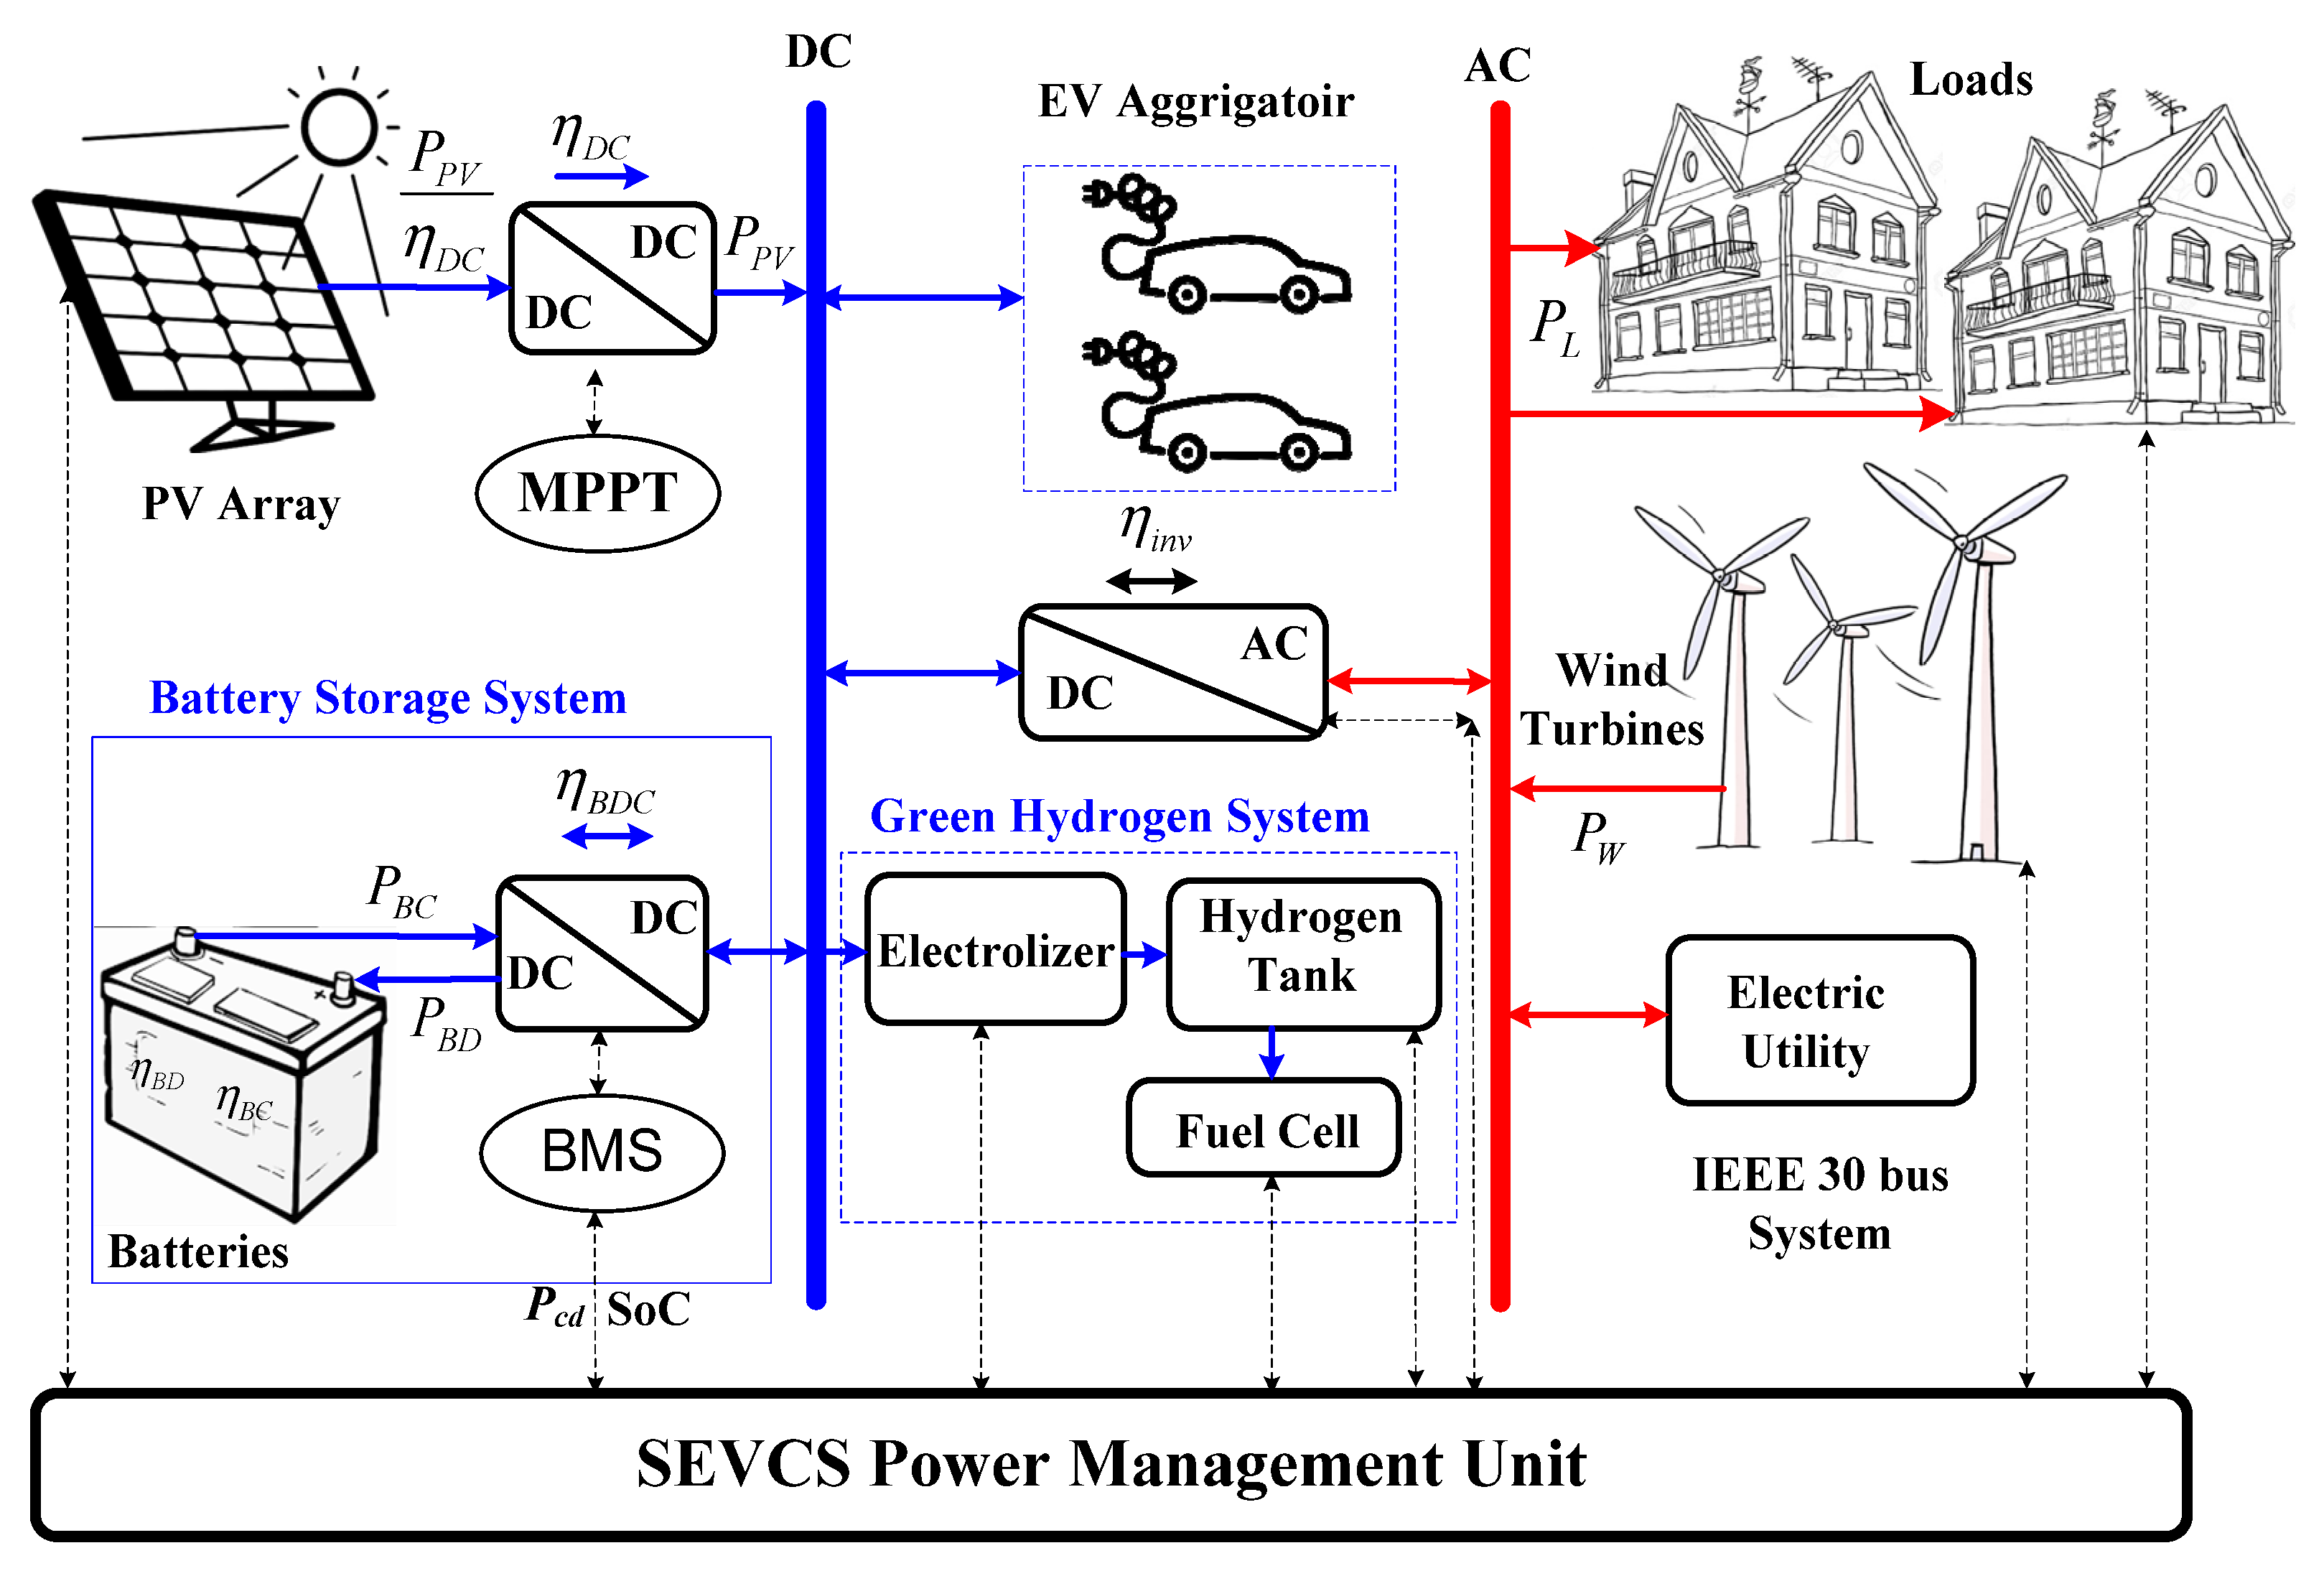
2. Smart EV Charging Station (SEVCS) Modeling

Several configurations for smart EV charging station (SEVCS) are introduced in the literature [11,12,19,20,21,22,23,24,25,26,27]. The SEVCS system is used to feed a certain number of cars, NEV. In the sizing of the SEVCS components, it is assumed that each SEVCS should be able to support the EV with its needs without any dependency on the power system. The schematic diagram of the SEVCS is shown in Figure 1. In this system wind turbines and PV are connected to the ESS through DC–DC converters. The ESS of this system has GHSS and BSS to store surplus energy that the load needs during high generation from RES and to deliver deficit energy during shortage of generation in load need periods. All the ESS components are managed using the smart controller considering DR strategy. So, in the beginning, an energy balance between the expected EV charging load and the available generation should be performed with/without consideration of the DR strategy for comparison. The sizing strategy takes the DR into consideration and the tariff changed based on the difference between the generated energy from the RES and the required load considering the SoC of the ESS system. The modeling of different components of the SEVCS is shown in the following subsections.

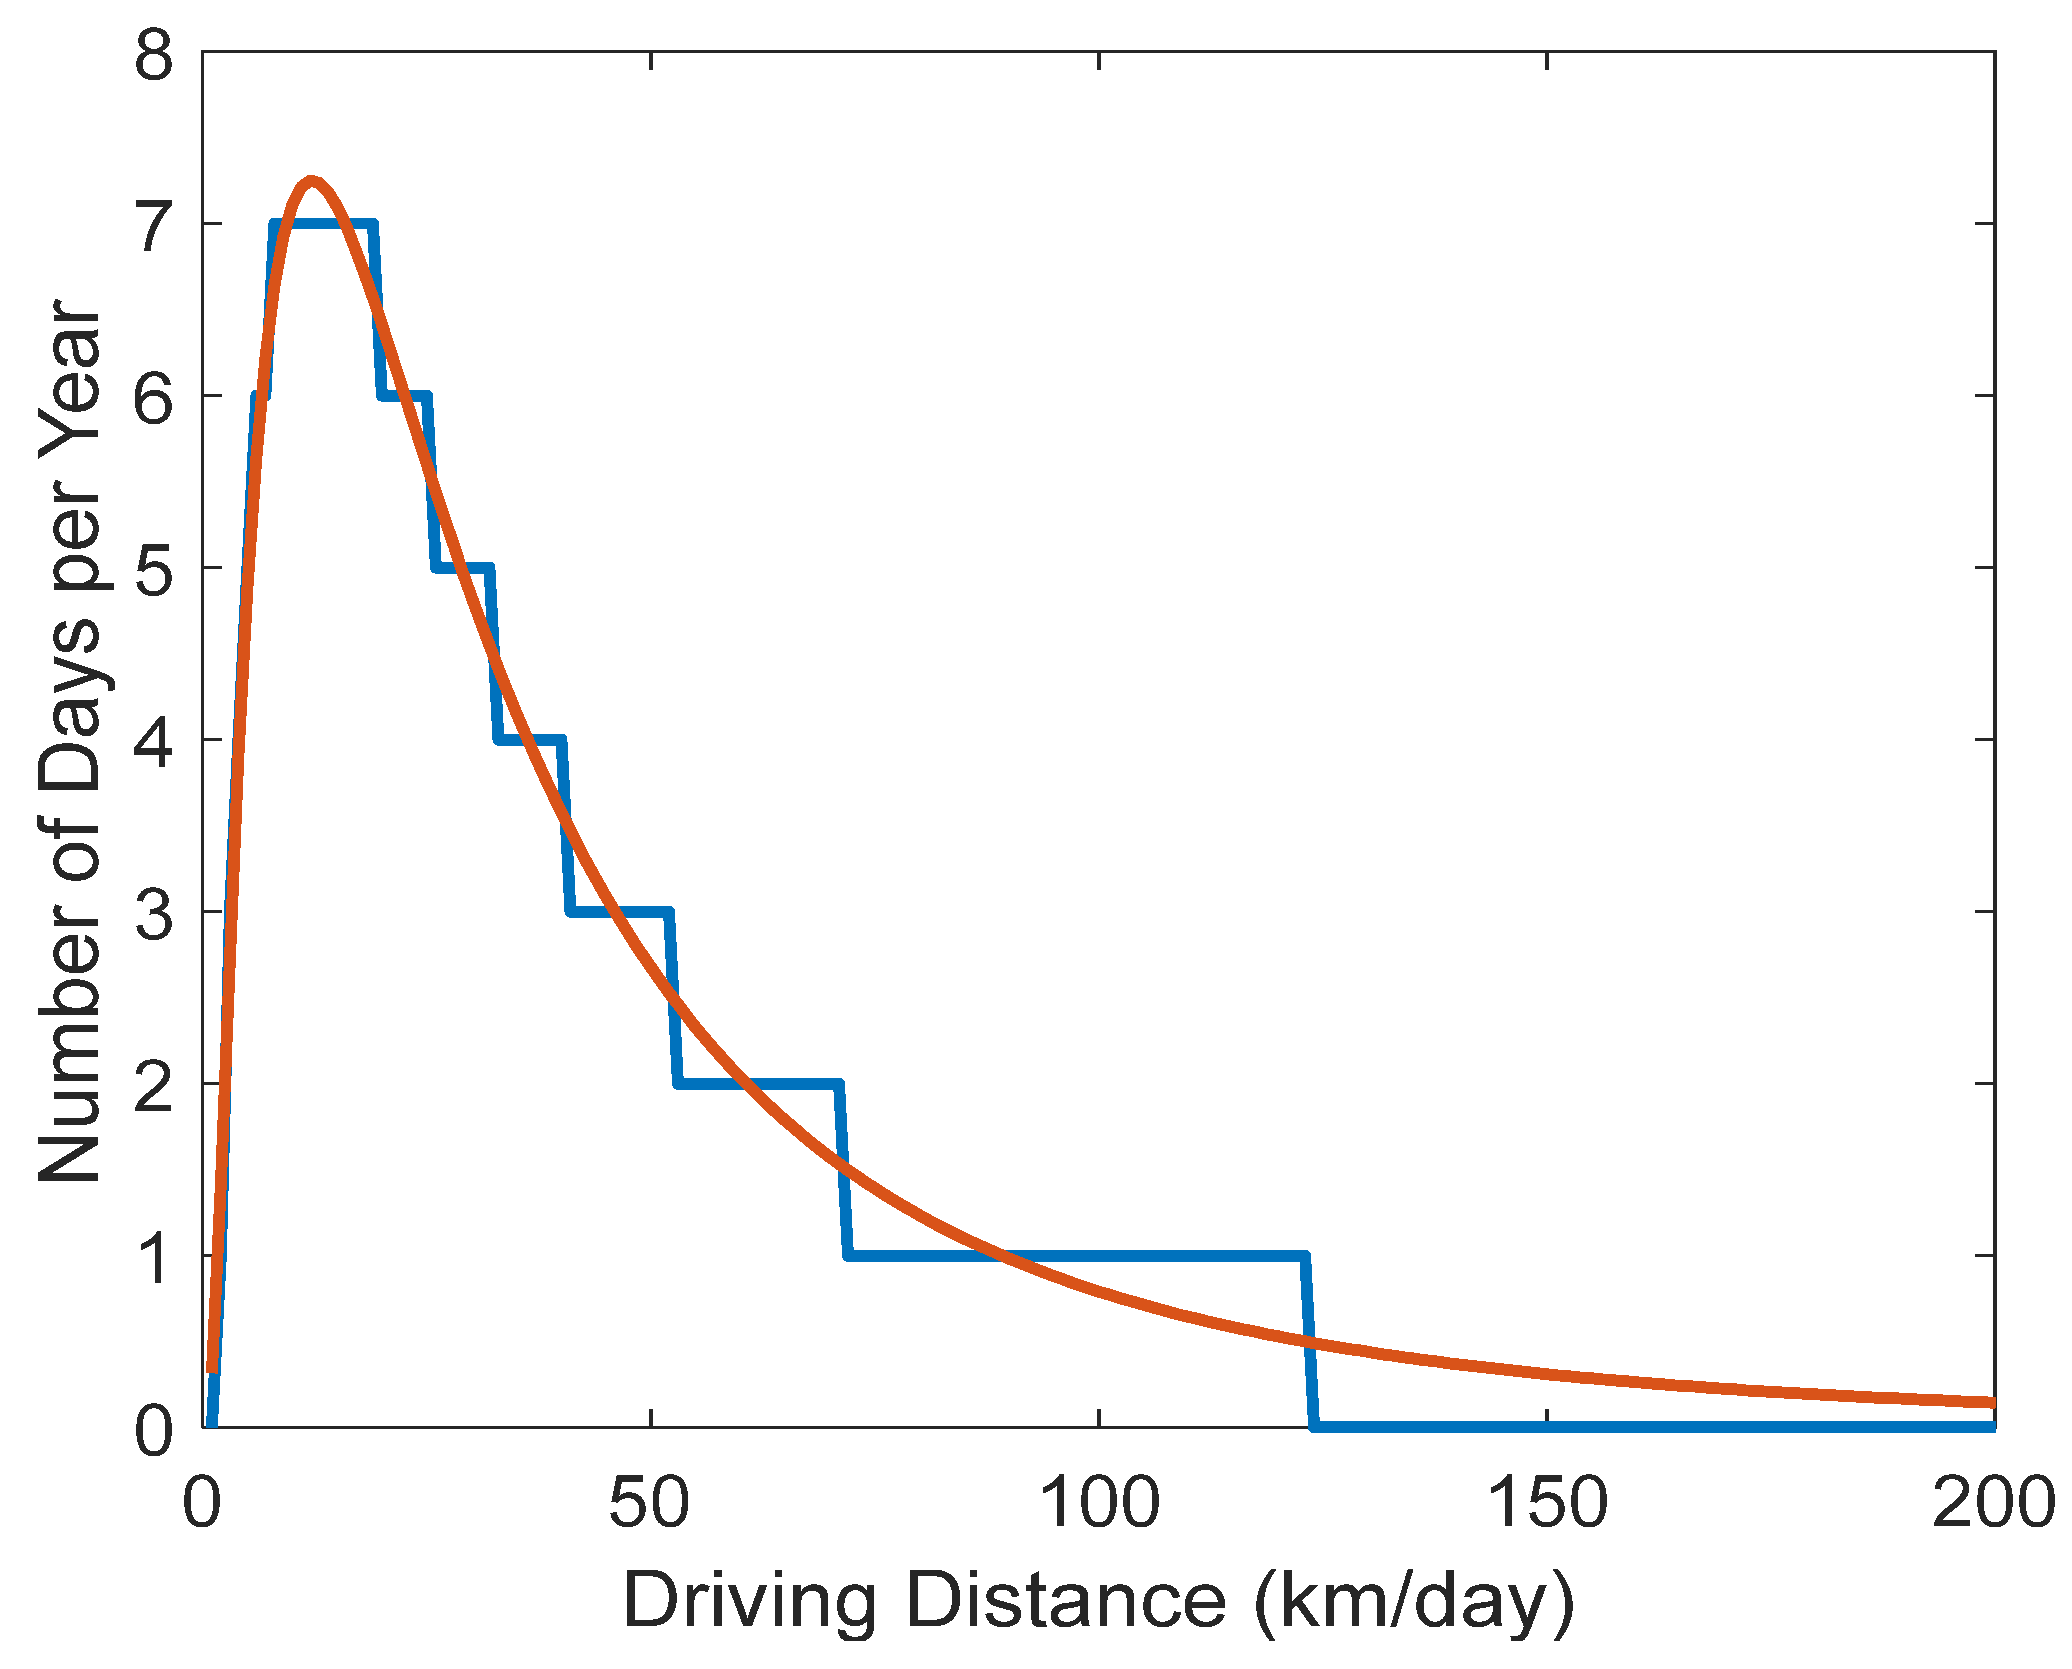
2.1. EV Load Estimation

One of the most important and complicated issues of EVs working in a V2G is the load estimation. The load estimation of the power system due to the EV is a very important task in the design of the RES used for this purpose. Different strategies have been used for load estimation of EV [29,30,31,32,33,34]. The main problem associated with load estimation is the uncertain and intermittent nature of the daily use of EVs. Several studies have been introduced to predict the behavior of EVs and the required daily charging/discharging of energy. In this section, a simple estimation of the EV loads is introduced. The daily driving distance of each EV, x is assumed to be based on the log-normal distribution function, as shown in the distribution function of Equation (1) [35]:
f d e s x = 1 x σ E V 2 π e ln x μ E V 2 2 σ E V 2
where, σEV is the average daily distance of EV; and μEV is the variance of the daily distance of EV. For example, if σEV = 1.0, μEV = 3.5.
The distribution function of Equation (1) is shown in Figure 2. The continuous distributed function shown in Figure 2 can be rounded to get the integer number of days associated with each distance, as the staircase function, shown in Figure 2. Taking the daily driving distance as random, based on the distribution shown in the staircase shown in Figure 2, the daily driving distance is shown in the upper trace of Figure 3. This is done by selecting a certain driving distance from the available ones shown in the staircase of Figure 2 and removing it from the set to randomly choose from the rest of the set in the next hour. This random distribution of the driving distance can be performed for each car separately to avoid the random nature of the performance of each car. The specific power consumption (BEV) represents the relation between the energy consumed per km driving distance. The daily energy consumed can be obtained by multiplying the daily driving distance by the BEV, as shown in Equation (2) and in the lower trace of Figure 3 for BEV = 0.15 kWh/km as an example.
E E V 1 d = L E V 1 d * β E V
Each EV is assumed to be connected to the SEVCS for a certain number of hours between the return time, Tr to departure time, Td. These times are chosen randomly for each EV and the total power consumed for all the EVs can be obtained similar to the one shown in Figure 3. Based on this modeling of EV behavior the expected daily load is shown in the simulation results of this study.

2.2. Wind Energy System Modeling

Generation from the wind energy system depends mainly on wind speeds, the characteristics of the site, and the performance parameters of the wind turbine used. The wind speeds are normally collected at the height of the anemometers, ha, and these values should be modified to the hub height of the wind turbine, hwt, as shown in Equation (3) [36,37,38,39]:
u ( h w t ) u h a = h w t h a α w
where, αw is an exponent that may differ from site to site and has an average value equal to 1/7 [36].
The generated power from the wind turbines for different wind speeds can be obtained from Equation (4) [37,38,40]:
P W u = 0 u U C & u U F P R * u K U C K U R K U C K , U C u U R P R U R u U F
where, UC, UR, and UF are the cut-in, rated, and cut-off wind speeds of the WT, K is the shape Weibull parameter of the site and WT [36], PR is the rated power of the WT.

2.3. Photovoltaic Energy System Modeling

A photovoltaic energy system is used to directly generate electric power from sunlight. The PV array consists of several PV modules connected in series and parallel to get the required voltage and current. Different types of models are used to simulate the PV module using single, double, or triple diode circuits [41]. The parameters of these circuits can be determined by using AI optimization algorithms, such as the musical chair algorithm [41]. The output of the PV array should be connected to a DC–DC converter to control its terminal voltage and current to force the PV array to extract the maximum available power using a maximum power point tracker (MPPT) [42,43,44,45,46]. The hourly generated power from the PV system can be obtained from Equation (5) [1] and depends on the area of the PV array, PVA, the solar irradiance, Ht(t), the efficiencies of the PV array and the DC-DC converter, η c t and η D C , respectively. The efficiency of the photovoltaic system depends on the temperature, where it is equal to the rated efficiency, ηcr minus the difference between the module rated temperature and cell temperature, Tcr, Tc(t), respectively, multiplied by the temperature coefficient, βt as shown in Equation (6). The temperature of the cell, Tc(t) is a function of ambient temperature, Ta(t), and solar radiation as shown in Equation (7) [1,47]:
P P V t = H t t . P V A . η c t . η D C
η c t = η c r 1 β t × T c t T c r
T c t = T a t + 3 H t t

2.4. Battery Energy Storage Model

The battery energy storage system (BESS) is a very important component of the SEVCS due to its fast response to any small change in the operating conditions. The battery is used to support the fast needs of the EV and it can store surplus energy generated from the RES. The battery should be modeled to predict its lifetime, which is a very important issue in determining the Levelized cost of energy (LCE) generated from the SEVCS. The determination of the accurate lifetime of the SEVCS batteries ensures accurate determination of their cost and time of replacement, which substantially affects the net present cost of the SEVCS and the LCE. Modern battery technologies, such as lithium-ion batteries (LIB), are gaining much interest in energy arbitrage applications due to their long lifetime, high efficiency, high energy density, and reasonable cost. The lifetime of the battery is highly affected by the depth of discharge, the level of the power extracted from the battery (C-rate), and the operating temperature [48]. In the case of constant temperature and C-rate, the loss in capacity of the batteries is shown in Equation (8):
Φ ( D o D ) = α b . D o D β b
where, constants αb and βb are constants dependent on the type of the battery and the charging/discharging power to/from the battery.
The degradation due to any charging or discharging ramp is shown in Equation (9). The state of health (SoH) of the battery can be obtained from Equation (10):
Δ Φ 12 = α . D o D 1 β α . D o D 2 β
S o H ( t ) = S o H ( t 1 ) α . D o D t β α . D o D t 1 β
It is clear from Equation (10) that, the SoH is mainly affected by the DoD variation of the battery. The lifetime of the battery can be determined based on the degradation in SoH shown in Equation (10). The lifetime of the battery can be obtained from Equation (11). As an example, if the battery end of life, SoHEoL = 0.5, and the degradation of SoH is 5% per year then the lifetime of the battery is 10 years:
L T B = 1 0.8 / t = 1 8760 Δ Φ t
The state of charge of the battery is the ratio between the energy stored in the battery, EB(t) to its rated energy, E B R , as shown in (12). The battery should be charged to its maximum energy, E B max and discharged up to its minimum allowable energy, E B min . The maximum SoCSEVCS of the EV charging station is the ratio between the E B max to the rated energy of the battery, E B R . Similarly, the minimum SoCSEVCS of the EV charging station is the ratio between the E B min to the rated energy of the battery, E B R :
S o C SEVCS t = E B t E B R
The allowable depth of discharge of the battery of the SEVCS, (DoD), is the difference between the maximum and minimum SoCSEVCS, as shown in Equation (13). As has been shown above the degradation of the batteries is directly proportional to the DoD. So, to extend the lifetime of the battery, the DoDSEVCS should be maintained at a minimum as much as possible. Meanwhile, low DoDSEVCS means that the minimum active energy of the battery, EBU, is as shown in Equation (14). Based on the value of the DoDSEVCS some studies introduced empirical formulae for the degradation cost of the batteries, as shown in Equation (15) [49]:
D o D S E V C S = S o C S E V C S max S o C S E V C S min
E B U = D o D S E V C S . E S E V C S R
A g i n g C o s t = C B D o D S E V C S 1 S o H
where, CB is the total cost of the batteries.
The SoC of the batteries is always changing based on the loss of energy due to the gaining mechanism of the battery and due to the charging and discharging power from the batteries [50]. The equation representing the variation of the SoC of the SEVCS batteries is Equation (16) [50]:
S o C S E V C S t + 1 = S o C S E V C S t 1 σ 24 + P B C t E B R . η B C P B D t E B R . η B D
where, σ is the self-discharge rate, η B C and η B D are the charging and discharging efficiencies of the batteries, respectively.

2.5. Green Hydrogen Storage System (GHSS) Modeling

The green hydrogen storage system (GHSS) is used to store the surplus energy and supply the load with its needs during shortage of generation. The GHSS consists of an electrolyzer, Hydrogen tank, and fuel cell. The function of the electrolyzer is to use the extra energy to split the chemical bond of water into Hydrogen and Oxygen. The Hydrogen is captured and stored in the Hydrogen tank under pressure to be used later to release the stored energy to the load through the fuel cell. The relation between the power transferred to the electrolyzer, PEZ(t), and the amount of hydrogen Q E Z t and the rated hydrogen flow (kg/h), Q N E Z is shown in Equation (17) [51,52]:
P E Z t = B E Z . Q N E Z + A E Z . Q E Z t
where, AEZ, and BEZ are the hydrogen consumption coefficients.
The efficiency of transferring the electric power to Hydrogen is shown in Equation (18) [53]:
a = 1 , η E Z t = 39.4 . Q E Z t . P E Z t
The relation between the generated energy from the fuel cells, PFC, and the amount of Hydrogen used to release this amount of energy QFC is shown in Equation (19) [53]:
Q F C t = B F C . P N F C + A F C . P F C
where PNFC is the rated power of the fuel cell, AFC, and BFC are the consumption coefficients of the fuel cell [53].
The relation between the generated power from the fuel cell, PFC, and the amount of Hydrogen used to release this amount of energy QFC is shown in Equation (20) [53,54]:
η F C = 100 . P F C 33.3 . Q F C t

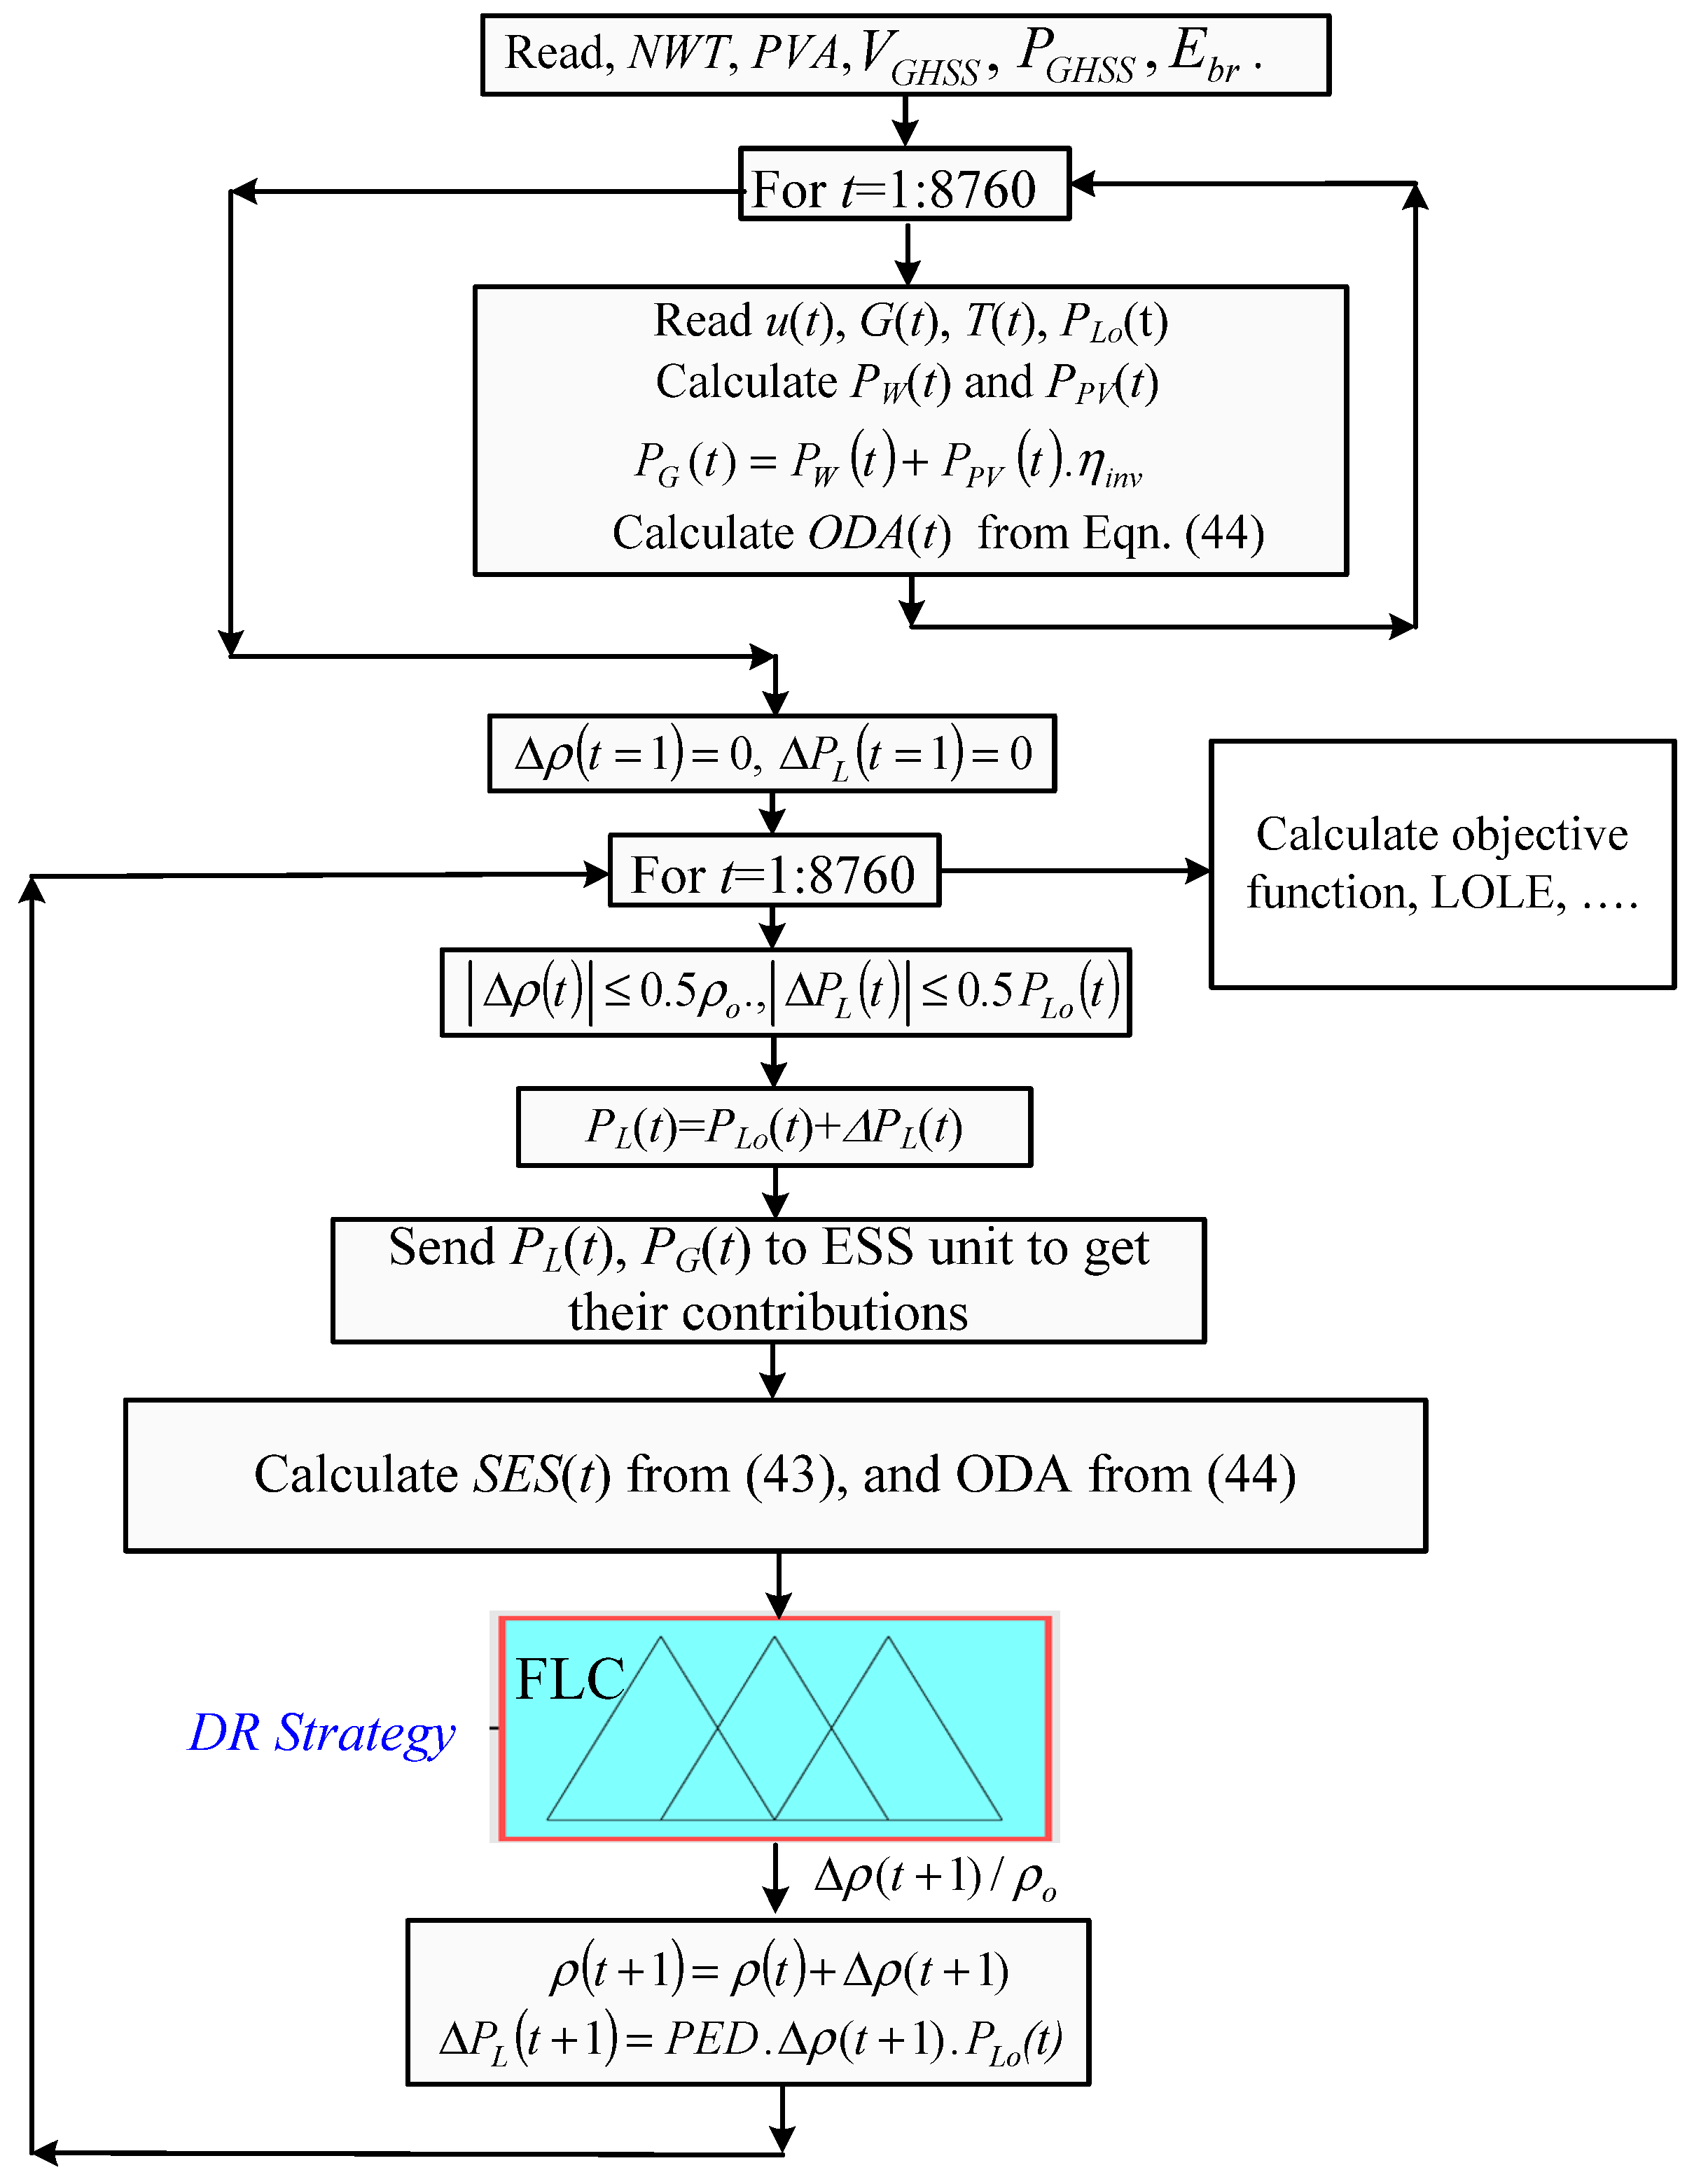
2.6. Power Dispatch Strategy

The logic used in managing the power flow through different components of the SEVCS is presented in this section. The control of power is very important in the design of the proposed SEVCS. In this logic, the dispatch strategy gives the battery the highest priority to be charged till it reaches its maximum allowable state of charge, S o C S E V C S max , and the rest of the power feeds the GHSS to store the surplus power as Hydrogen in the Hydrogen tank. In a case where more energy is still available, it is transferred to the power system. On the other hand, in a case where the generated power is lower than the EV load, the deficit power is generated from the batteries. In a case where the batteries cannot afford the required amount of power, the dispatch unit forces the GHSS to supply the rest of the needed power. In a case where the load still needs more power than the power available from the RES, BESS, and GHSS, the rest of the power should be obtained from the EV through the V2G concepts, or the power system based on the lowest cost. The flow of power is subject to the constraints shown in Equations (21)–(26). The SoC of the SEVCS should be within the maximum and minimum allowable SoC, as shown in (21). The charging/discharging power from the SEVCS should be lower than the maximum allowable power that the SEVCS batteries can process, as shown in Equation (22). The SoC of each EV battery also should be within the minimum to maximum allowable SoC of the EV, as shown in Equation (23). The maximum power that the EV battery can process should be lower than the rated maximum power, as shown in Equation (24). The volume of the Hydrogen in the Hydrogen tank should be higher than, or equal to, the rated minimum value, V G H S S min , and lower than the rated maximum value, V G H S S max , as shown in Equation (25). The power in/out of the GHSS should be between the rated minimum and maximum allowable limits by the manufacturer, as shown in Equation (26). This logic is summarized in the flowchart shown in Figure 4 and summarized in the following points:
S o C S E V C S min S o C S E V C S t S o C S E V C S max
P S E V C S t P S E V C S max
S o C E V min S o C E V , i t S o C E V max
P E V , i t P E V max
V G H S S min V G H S S t V G H S S max
P E Z min P E Z t P E Z max
If PG(t) > PSEVCS(t)
If the generated power from the RES is higher than the load requirements by the SEVCS, then, the surplus power is fed from the RES to the SEVCS battery, GHSS and E batteries, and the extra power goes to the electric power system, respectively. The SoC at time t is equal to the previous SoC minus the aging loss plus the energy charged during the time t as shown in Equation (28):
P S E V C S t = P G t P E V t
S o C S E V C S t + 1 = S o C S E V C S t 1 σ 24 + P S E V C S t . η B C E S E V C S R
Check the constraints shown in Equation (21), if not valid, then P S E V C S t = P S E V C S R and update the S o C S E V C S t + 1 using Equation (28).
Check the constraints shown in Equation (22), if not valid, then, S o C S E V C S t + 1 = S o C S E V C S max , and update the charging power of the SEVCS using Equation (29).
P S E V C S t = S o C S E V C S max S o C S E V C S t * E S E V C S R
Check if the P S E V C S t < P G t P E V t , which means that the battery of the SEVCS cannot store all the available surplus power, then the rest of the power should go to the GHSS, then EV batteries, then the power system, respectively, subject to the constraints shown in Equations (23)–(26).
If PG(t) < PEV(t)
In this case, the deficit power is compensated from the battery of the SEVCS, GHSS, or EV, and the rest of the power comes from the electric power system. Based on Equation (30), the deficit power is negative because PG(t) < PEV(t). This negative power is compensated for from the SEVCS battery, where the SoC is as shown in Equation (31):
P S E V C S t = P G t P E V t
S o C S E V C S t + 1 = S o C S E V C S t 1 σ 24 + P S E V C S t E S E V C S R . η B D
Check the constraints shown in Equation (21), if not valid, then P S E V C S t = P S E V C S R , ( P S E V C S R is the rated discharge power from the SEVCS battery) and update the S o C S E V C S t + 1 using Equation (31).
Check the constraints shown in Equation (22), i not valid, then S o C S E V C S t + 1 = S o C S E V C S min and update the charging power of the SEVCS using Equation (32).
P S E V C S t = S o C S E V C S min S o C S E V C S t * E S E V C S R
where, E S E V C S R is the rated capacity of the SEVCS battery.
Check if the P S E V C S t < P G t P E V t , which means that the battery of the SEVCS cannot supply all the required deficit power, and the rest of the power should come from the GHSS, then EV batteries, then the power system, respectively, subject to the constraints shown in (23)–(26).

2.7. Modeling of the Demand Response Strategy

Two different factors were used in this study to determine the change in tariff to flexibly control the load power. These two factors were the situation of the energy storage (SES) and the future forecasted for 24 h which is called the one-day ahead (ODA) factor. The SES factor of the SEVCS was used to measure the available stored energy in each SEVSC in the BESS and the GHSS, as shown in Equation (33). The value of the SES was directly proportional to the energy stored in the battery and the GHSS. A high SES value meant a high stability situation for the SEVCS and vice versa.
The ODA factor was used to measure the difference between the generated power and the load power of the SEVCS in the next 24 h. The one-day ahead factor, ODA, was shown in Equation (34). This factor gives a higher weight to the nearest hours by adding the factor i to the denominator of Equation (34). The higher the value of the ODA the higher the stability of the SEVCS in near future hours:
S E S ( t ) = V G H S S t V G H S S R + E S E V C S R E G H S S R . S o C S E V C S t
where, V G H S S t , and V G H S S R are the hourly and rated volume of Hydrogen tanks, E S E V C S R and E G H S S R are the rated capacities of the SEVCS batteries and GHSS, respectively.
O D A t = i = 1 24 P G t + i P E V t + i P E V A   .   i
where, PEVA is the average load of the EV during the year.
The change in the price generated from the DR based on the price elasticity of demand, PED should be subjected to these two important factors. The fuzzy roles that guide this DR strategy are shown in Table 1. The abbreviations shown in Table 1 for ODA, are NB, N, Z, P, and PB, standing for negative big, negative, zero, positive, and positive big, respectively. Meanwhile, the abbreviations shown in Table 1 for SES are VL, L, M, H, and VH, standing for very low, low, medium, high, and very high, respectively. The change in tariff can be obtained from the FLC shown in Figure 5. Based on this change, the change in power can be obtained from Equation (35) using the PED. The new tariff can be obtained from Equation (36). This price change forces the aggregator of the EVs to control their charging power and the new power can be obtained from Equation (37):
P E D = Δ P L t / P L A Δ ρ t / ρ 0
ρ t + 1 = ρ t + Δ ρ t
where, ρ t and ρ t + 1 are the tariff at the current and next hour, respectively, Δ ρ is the change in tariff, ρ 0 is the basic tariff, Δ P L is the change in load power.
P L t + 1 = P L O t + 1 + Δ P L t
where, PL and PLo are the modified and original EV demand in kW, respectively.

2.8. Levelized Cost of Energy (LCE) Estimation

The cost of the energy consumed by the EV can be determined by using the annualized cost estimation, as shown in Equation (38) [55]. The net present cost (NPC) of the SEVCS components can be determined by the whole lifetime cost discounted at the beginning of the project. The annualized cost of energy can be determined by multiplying the NPC by the capital recovery factor, CRF, as shown in the numerator of Equation (38). The yearly cost of energy is divided by the yearly generated energy from the SEVCS, as shown in Equation (38). The CRF value can be obtained from the discount rate and the lifetime of the project, as shown in Equation (39) [55]. The strategy used to determine the LCE is shown in detail in these studies [1,55].
L C E = N P C * C R F Y E
C R F = r 1 + r T 1 + r T 1
The NPC can be obtained by calculating the initial cost of SEVCS, the operating and maintenance costs, and the replacement cost subtracted from the salvage price replaced during the lifetime of the project [1,55]. A detailed discerption of the different components used to determine the NPC is shown in [1,55].

2.9. Particle Swarm Optimization Algorithm

To determine the share of power between the conventional power plants connected to the power system a particle swarm optimization (PSO) is used [56]. The PSO is an optimization algorithm inspired by the behavior of animals when they are searching for their food. The particles search for their food in a swarm and each member of the swarm should memorize the best location for food and share it among the other members of the swarm. The swarm members should know best places for food, which is called the global best position. All the search agents should move toward the global best and search for better positions for food. During the movement toward the global best position, if the position of the global best position is changed by capturing a better place by any member of the swarm, all the particles should redirect their movement to the new global best position. The same searching mechanisms of these animals have been used to search for the optimal solution to mathematical and engineering problems, such as the one introduced in this study. The PSO optimization algorithm uses many search agents with random positions to search for the best position. The best captured position is called the global best, to which all the search agents should move. During the movements of the particles toward the best position, the search agents should also consider their self-historical particle best values (pbesti). In each iteration, the new velocity of all particles (vi + 1) should consider the current position (xi), velocity (vi), the particle’s best positions, and the global best position, as shown in Equation (40) [57]. The new velocity should be added to the current position to determine the new position of particles, as shown in Equation (41) [57].
v i t   + 1 = ω v i t + c 1 a 1 p b e s t i x i t + c 2 a 2 g b e s t x i t
x i t + 1 = x i t + v i t + 1
where
  • t: Iteration number
  • i: Particle number
  • ω : Inertia weight in a range of [0.5, 1].
  • c1 & c2: Self-confidence and swarm confidence constants, respectively.
  • a1 & a2: Random numbers in the range [0, 1].
The logic used in the implementation of the PSO algorithm is illustrated in Figure 6 [57]. The PSO algorithm was used in this study in two situations. The first one was to determine the best size of all the components of the SEVCS by minimizing the cost of energy and the loss of load probability. The other use of the PSO was in determining the optimal contribution of the conventional generators of the IEEE for minimum cost and minimum TL losses, as is discussed in the next section. The use of optimal control parameters in the operation of the PSO ensured the highest convergence efficiency and lowest failure rate after several operations of the proposed logic.

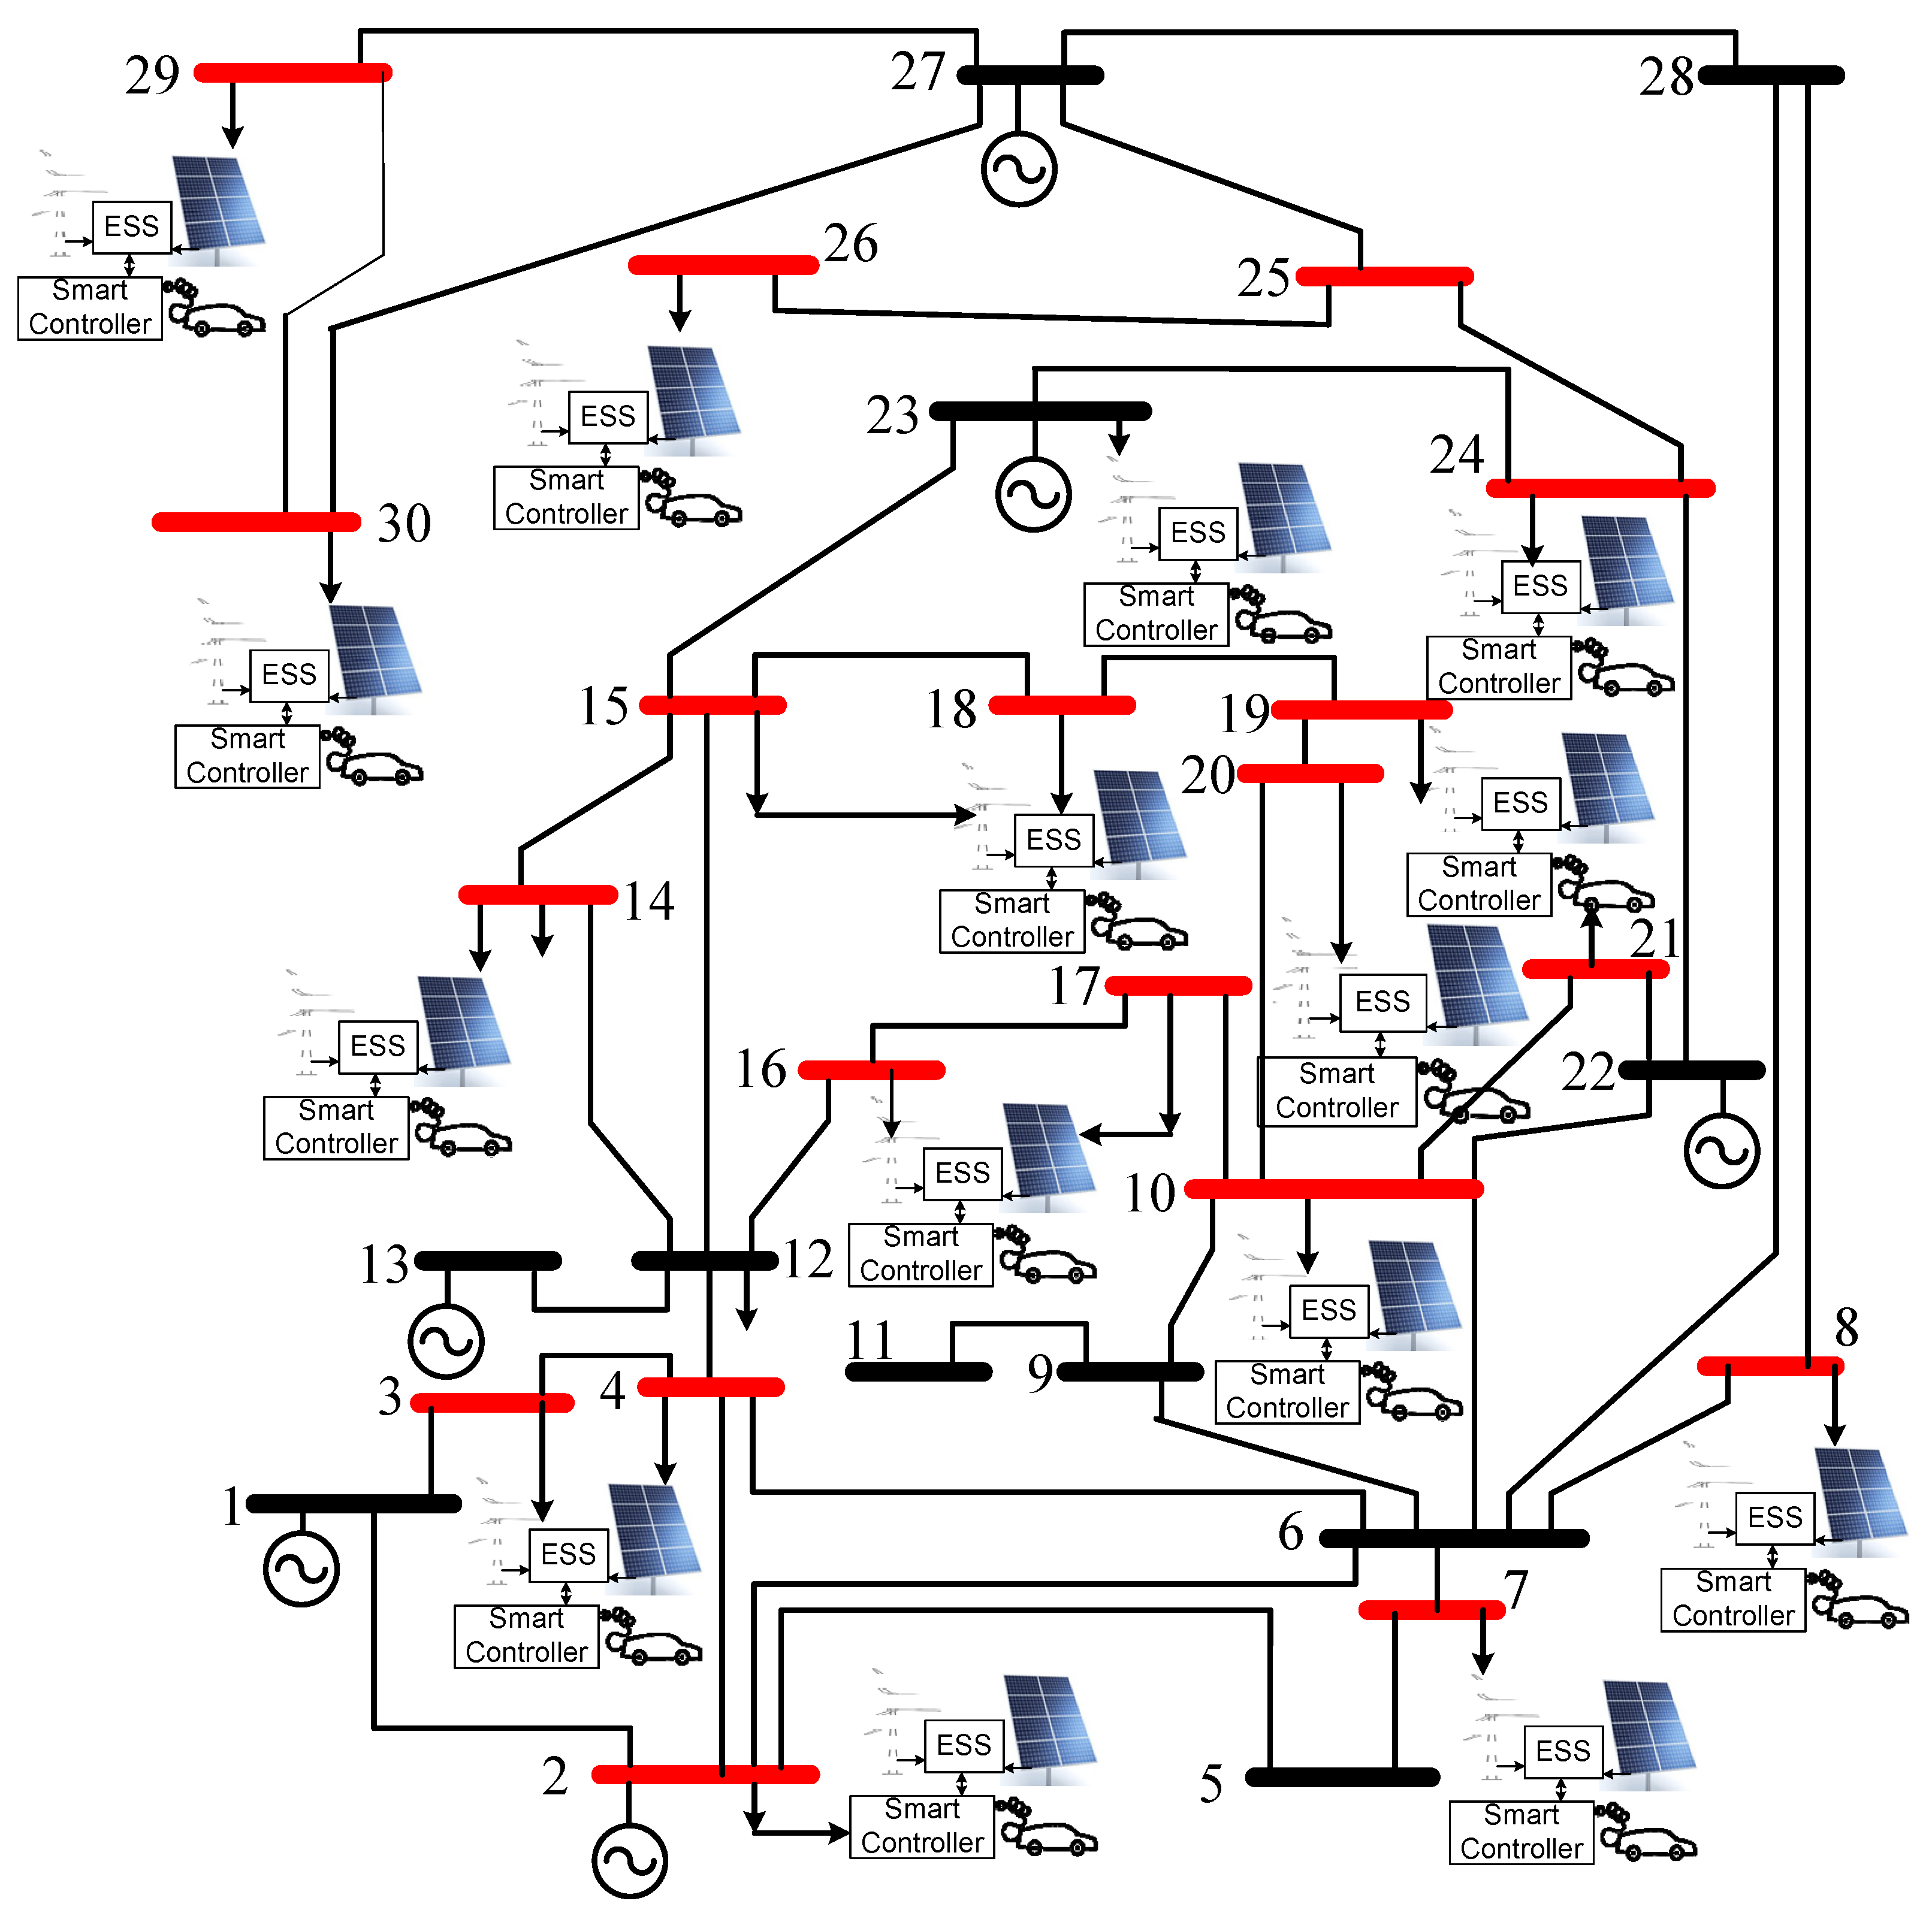
3. IEEE 30 Bus System Modeling

The IEEE 30 bus system was used in this study to be incorporated with a smart EV charging station (SEVCS). Five units of the proposed SEVCS were installed at each of the load buses of the IEEE 30 bus system. Each SEVCS had wind and photovoltaic energy systems working with a green hydrogen storage system and an internal battery system. Each SEVCS was identical at each busbar and it was assumed to be able to feed the same number of electric vehicles. The proposed IEEE 30 bus system is shown in Figure 7 [58].

3.1. Analysis of Optimal Power Flow

The flow of power through the power system should be able to feed the load with its needs without violating any constraints. This can be done with minimum cost or minimum losses using the optimal power flow (OPF) technique. Three different busbar types are shown in the power system: slack, load, and voltage-controlled buses. In most of the OPF problem solutions, the slack busbar was used to work as a reference for the whole power system, where it had constant voltage magnitude and zero angle, δ = 0 [59]. In the conventional analysis of the OPF, the load buses did not have any generation. Meanwhile, with the use of distributed generation (DG), this assumption was not valid anymore. The DGs added negative power to the load buses, which could be subtracted from the original loads at that bus. Based on the power flow between the generator power plants and the loads, the voltage magnitudes and their angles could be determined using the OPF solution.
Two different constraints should be applied to the solution of the OPF of power system: equality constraints and inequality constraints. The real and reactive powers at any busbar depend on its voltage and the other voltages connected to it through the transmission line, in addition to the series impedance and admittance at this busbar, as shown in Equations (42) and (43), respectively [59].
P i = j = 1 n Y i j V i V j C O S   θ i j + δ j δ i
Q i = j = 1 n Y i j V i V j s i n θ i j + δ j δ i
where, Vi and Vj are the buses voltages of busbars i and j, respectively. δ i , δ j are the angles of ith, and jth busbars, respectively, Yij is the admittance between buses i and j, θ i j is the admittance angle of Y i j , and NB is the number of buses.
The power balance should be met during the analysis as shown below:
i = 1 N G P G i i = 1 N D P D i + P L L = 0
where, ND is the number of load buses, NG is the number of generator buses, PGi and PDi are the generation power and load power at busbar i, and PLL is the total transmission losses.
The above equations must be solved with the following generator constraints:
  • P m i n P G i P m a x
  • Q m i n Q G i Q m a x
  • V m i n V i V m a x
  • δ m i n δ i δ m a x
where, Pmin and Pmax are the minimum and maximum active power constraints for each generator, respectively. Qmin and Qmax are the minimum and maximum reactive power constraints for each generator, respectively. Vmin and Vmax are the minima and maxima voltage magnitude constraints for each bus. δmin and δmax are the minimum and maximum voltage angle constraints for each bus, respectively.
The cost function of any generator connected to busbar i is shown in Equation (45) [59].
F i p i = A i p i 2 + B i p i + C i $ / h o u r

3.2. Multi-Objective OPF Algorithm

Different objectives can be used to optimally manage the power between different parts of the power system. Some of these objectives are technical, such as the voltage profile, the transmission line losses, reliability, etc. Some other objectives are based on an economical point of view, such as the generation cost, and the maintenance cost. Some other objective functions are based on an environmental point of view, such as the minimization of green-house gas emissions. The designers and operator can select only one objective to be the optimal operator of the power system which is called the single objective function (SO). Some other power system operators suggest more than one objective to optimally operate the power system, called multi-objective (MO) function, as shown in Equation (46) [59].
F ( x ) = [ f 1 ( x ) , f 2 ( x ) ,     f n ( x ) ]
where, F is the MO function.
  • fi is a single objective function.
  • x represents the set of decision variables.
  • n is the number of SO functions.
The multi-objective OPF problem can be solved using the MO function shown in Equation (47) in which each SO function, fi is multiplied by a certain weight function, wi. The summation of weights should equal one, as shown in Equation (48).
F ( x ) = w 1 f 1 ( x ) + w 2 f 2 ( x ) +     w n f n ( x )
where
w 1 + w 2 + + w n = 1
The weighted values of different functions can be selected based on the importance of each objective and different strategies used to determine the best weight for each function, such as the clustering strategy [59]. The main problem associated with this strategy is the time consumed getting the optimal values of different weights, so it was avoided in this study. The proposed MO function used to solve the OPF problem introduced in this study is shown in Equation (49) where the TLL is multiplied by weight function wl. and added to other cost functions:
M i n i m i z e F P i = i = 1 N A i p i 2 + B i p i + C i + i = 1 N E V O M E V * P E V , i + w l * T L L $ / h o u r
where, N is the total number of busbars having a conventional generator.
NEV, is the number of smart EV charging station connected to all busbars, OMEV is the operating and maintenance cost of the smart EV charging stations, and PEV,i is the power generated from the EV charging station connected to bus i.

3.3. Voltage Weakening Index

The voltage weakening index (VWI) is a factor representing the change in voltage between two different operating conditions. This factor is used to measure the voltage profile of different busbars with and without the use of EVs, considering the DR and V2G, compared to the original use of the power system without the use of these modifications. This factor gets the ratio of different values of voltage compared to the original case, as shown in Equation (50).
V W I i = V i 1 V i 2 V i 2 * 100
where, Vi(1) is the voltage of busbar i with the original operating case.
Vi (2) is the voltage of busbar i at new operating conditions.

4. Simulation Result

The real data for hourly solar irradiance and wind speed were collected for the Dumah AlJandal site in the north of Saudi Arabia [52]. Figure 8 shows the solar irradiance on a horizontal surface and on a 30 °C tilt angle, respectively.

4.1. Input Data

Table 2 shows wind speeds collected at 40 m above sea level, solar irradiance on a horizontal surface, and temperature for the Dumah AlJandal site.
The strategy shown above was used to determine the hourly loads of each SEVCS. Each SEVCS was assumed to have 1000 EV. Each load bus of the IEEE 30 bus system was assumed to have 5 SEVCS. Each EV was assumed to have a 5 kW battery size and all of them could be charged in fast or slow charging. The specific power consumption was 0.15 kWh/km. The load curve at one SEVCS is shown in Figure 9. The mean, maximum, and minimum energies for each SEVCS per day were 831.24, 2.069, and 89.01 kWh, respectively. The performance parameters of the SEVCS are shown in Table 3 [53,54].

4.2. Optimal SEVCS Sizing

The optimal size of the components of each SEVCS could be obtained by minimizing the LCE and the loss of load probability using the PSO algorithm. The use of an optimization algorithm is very important where the random values of the components may cause a considerable increase in the LCO, which may result in selection of the inaccurate size of components, causing serious problems in the stability and reliability of the system, as well as a higher increase in the cost of energy. The size of all components of the SEVCS with and without V2G concepts for different values of price electricity of demand are shown in Table 4. It is clear from Table 4 that the LCE without the use of the V2G were 0.052374, 0.039018248, 0.03681363 $/kWh for PED=0, −0.5, and −1.0, respectively. It was clear from these values that the DR strategy substantially reduced the LCE and increased the system stability and the size of the components used for the SEVCS. Moreover, the use of the V2G concepts reduced the LCE compared to similar values without using the V2G, which proved the importance of using it in the operation of the SEVCS. A summary of the results showing the LCE for different values of PED with and without V2G is shown in Figure 10. So, it is recommended to use the DR strategy with the V2G concepts to substantially reduce the energy costs of the SEVCS and improve the power system stability.
The use of the SEVCS with the IEEE-bus was compared with and without the V2G concepts for different values of the PED. This was performed for 8760 h to cover a whole year of operation. The original load of the IEEE-30 bus system was assumed to be constant during the year. Meanwhile, the load of the SEVCS was fed to the simulation, based on the loads shown in Figure 9. The results obtained from this study are shown in Table 4 and Figure 10, Figure 11, Figure 12, Figure 13, Figure 14, Figure 15 and Figure 16.
Figure 10 shows the LEC for different price elasticities of demand with and without the use of the V2G concepts. It is clear from this figure that, the highest LCE was associated with the case of no DR (PED = 0) and no V2G with 0.052374 $/kWh. Meanwhile, this value was reduced to 0.032488927$/kWh when using the DR (PED = −1) and V2G concepts. This high reduction (38%) in LCE proved the superiority of using load management and V2G concepts in the operation of the smart EV charging station.

4.3. Optimal Operation of the IEEE 30 bus System with EV

Figure 11 shows the per unit voltage of all busbars of the IEEE 30 bus benchmark power system for no EV (Original IEEE 30 bus system operation), minimum, average, and maximum EV loads without the use of the DR and the V2G concept. This figure shows that the voltage dropped with higher EV loads and many busbars fell below 0.8 V. This high reduction in some busbar voltages proved the side effects of the use of EV charging stations without using smart operating principles, such as the DR and the V2G concepts. The variations of the busbars’ voltages for different EV loads with the use of the DR and V2G concepts are shown in Figure 12. This figure shows that with the use of SEVCS, the busbar voltages were getting better than the original voltages of the IEEE-bus system operation and there were no busbar voltage falling below 0.99 pu. These important results clearly showed the importance of the use of the DR and V2G concepts in the operation when installing SEVCS to existing power systems.
The variation of the transmission line losses with different loads of the EV with and without DR and V2G concepts is shown in Figure 13. It is clear from this figure that the installation of the EV at the existing power system without considering the DR and the V2G concepts increased the transmission line losses, compared to the use of the DR and V2G concepts. These important results showed the superiority of using the DR and V2G concepts in installing EV charging stations with existing power systems.
Figure 14 shows the variation of the fuel cost with and without the use of DR and V2G. It is clear from this figure that the fuel cost of the conventional generator increased with the use of the EV charging station without considering the DR and V2G concepts in the operation. Meanwhile, the fuel cost of conventional power plants connected to the IEEE 30 bus systems slightly reduced with the use of a smart EV charging station that considered the DR and the V2G concept. This clearly showed the importance of the use of the DR and V2G concepts in the operation of the EV charging station when used with the existing power systems.
Figure 15 and Figure 16 show the variation of the generated power from different conventional power plants connected to the IEEE 30 bus system without and with the use of DR and V2G concepts, respectively. It is clear from these two figures that the generated power from different conventional power plants connected to the IEEE 30 bus systems increased with the use of EV charging stations without considering the DR and V2G concepts. Meanwhile, the generated power from the conventional power plants connected to the IEEE bus systems reduced when connected to smart EV charging stations that considered the DR and V2G concepts in operation and power management.

5. Conclusions

Due to the increased price of fossil fuels, the dwindling of these fuels, and the bad environmental effects which mainly contribute to global warming phenomena, most countries have switched their reliance on conventional transportation means to electric vehicles (EV). The main problem with EVs is their need to be charged in an unpredictable time frame. Charging a high number of EVs to the conventional power system adds many challenges to the conventional power system in terms of reduced terminal voltages, increased transmission line losses, and reduced reliability and stability of the power system. The side effects of this problem are avoided with the use of renewable energy sources (RES), such as wind and photovoltaic energy, green Hydrogen storage systems (GHSS), and modern batteries. Managing the power using the time of use (ToU) tariff as a demand response (DR) strategy can overcome contingency and other reliability and stability problems. In this paper, smart EV charging stations were connected to conventional IEEE 30 bus power systems. The performance of this system was studied for different sizes of EV charging stations with and without the use of the DR and the use of vehicle-to-grid (V2G) concepts. The results showed that the use of the smart EV charging station in a conventional power system, incorporating DR and V2G concepts, improved the stability, and the voltage profile reduced the fuel cost of the conventional power plant, reducing the total Levelized cost of energy (LCE), and reducing the transmission line losses, compared to the use of the power system without the use of DR and the V2G concepts. These substantial improvements in the performance of the conventional power system proved the superiority of using smart EV charging stations with DR and V2G compared to the working of the power system without using DR or V2G concepts in the operation of the power system. The main drawback of the proposed strategy is the lengthy time consumed in the optimization algorithm for sizing the smart charging station, and the optimal load flow section, which can be reduced by determining the optimal PSO control parameters.

Author Contributions

Conceptualization, M.A.A. and A.M.E.; methodology, M.A.A. and A.M.E.; software, M.A.A. and A.M.E.; validation, M.A.A. and A.M.E.; formal analysis, M.A.A. and A.M.E.; investigation, M.A.A. and A.M.E.; resources, M.A.A. and A.M.E.; data curation, M.A.A. and A.M.E.; writing—original draft preparation, M.A.A. and A.M.E.; writing—review and editing, M.A.A. and A.M.E.; visualization, M.A.A. and A.M.E.; supervision, M.A.A. and A.M.E.; project administration, M.A.A. and A.M.E.; funding acquisition, M.A.A. All authors have read and agreed to the published version of the manuscript.

Funding

This research was funded by King Saud University, Saudi Arabia, Deanship of Scientific research, Research Chair Saudi Electricity Company Chair in Power System Reliability and Security and the APC was funded by K.A.CARE Energy Research and Innovation Center at Riyadh, Riyadh 11451, Saudi Arabia.

Institutional Review Board Statement

Not applicable.

Informed Consent Statement

Not applicable.

Acknowledgments

This work was supported by the King Saud University, Saudi Arabia, Deanship of Scientific research, Research Chair Saudi Electricity Company Chair in Power System Reliability and Security.

Conflicts of Interest

The authors declare no conflict of interest.

Abbreviations

AbbreviationComplete FormAbbreviationComplete Form
BESSBattery energy storage systemsODAOne-day ahead
BEVSpecific power consumptionPEDPrice elasticity of demand
CRFCapital recovery factorPVPhotovoltaic
DGDistributed generatorPVAArea of the PV array
DoDDepth of dischargeRDNRadial distribution network
DRDemand responseRESRenewable energy sources
DSMDemand side managementSESSituation of the energy storage
ESSEnergy storage systemSEVCSSmart EV charging station
EVElectric vehicleSoCState of charge
FLCFuzzy logic controllerSoHState of health
GHSS Green hydrogen storage systemToUTime of use tariff
LCELevelized Cost of EnergyV2GVehicle to grid
LIBLithium-ion batteriesWT Wind Turbine
NPCNet present costMOMulti-objective

Symbols

SymbolDefinitionSymbolDefinition
PWOutput power of wind energy systemYEYearly generated energy
PPVOutput power from PV energy systemrInterest rate
ηBCBattery charging efficiencyTProject lifetime
ηBDBattery discharging efficiencypbestiParticle best values
ηBDCBattery charger efficiencygbestPosition of this global best
ηinvInverter efficiencyxiCurrent particle position
σEVAverage daily distance of EVviParticle velocity
μEVVariance of the daily distance of EVtIteration number
TrReturn time of EViParticle number
TdDeparture time of EV ω Inertia weight
BEVPower consumption per dayc1Self-confidence constant
LEVDaily distance of EVc2Swarm confidence constant
β E V Specific power consumption (kWh/km)a1 & a2Random numbers in the range [0, 1]
, haHeight of the anemometersVi & VjBuses voltages of busbars i and j, respectively.
hwtHub height of the wind turbine, δ i & δ j Angles of ith, and jth busbars, respectively
uHourly wind speedYijAdmittance between buses i and j
UCCut-in wind speed of the WT θ i j Admittance angle of Y i j
URRated wind speed of the WTNBNumber of buses
UFCut-off wind speed of the WTNDNumber of load buses
KShape Weibull parameter of the site and WTNGNumber of generator buses
PRRated power of the WTPGiGeneration power at busbar i
HtSolar irradiancePDiLoad power at busbar i
η c Efficiencies of the PV arrayPLLTotal transmission losses
η D C Efficiencies of the DC-DC converterPminMinimum active power constraints for each generator
ηcrRated efficiencyPmaxMaximum active power constraints for each generator
TcrModule rated temperatureQminMinimum and maximum reactive power constraints for each generator
TcCell temperatureQmaxMaximum reactive power constraints for each generator.
βtTemperature coefficientVminMinima voltage magnitude constraints for each bus
Ta(t)Ambient temperatureVmaxMaxima voltage magnitude constraints for each bus
αb and βb Constants depending on the type of battery and the charging/discharging power to/from the batteryδminMinimum voltage angle constraints for each bus
Φ Loss in capacity of the batteriesδmaxMaximum voltage angle constraints for each bus
E B R Rated energy of the batteryFMulti-objective function
E B max Maximum energy of the batteryfiSingle objective function
E B min Minimum allowable energyxSet of decision variables.
E B R Rated energy of the batterynNumber of SO functions
CBTotal cost of the batteries P S E V C S t Hourly power from the SEVCS
σSelf-discharge ratePEVPower consumed by EV
η B C .Charging efficiency of the batteriesPEVA.Average load of the EV during the year
η B D Discharging efficiency of the batteriesPEDPrice elasticity of demand
PEZ(t)Power transferred to the electrolyzerPLLoad power
Q E Z t Amount of hydrogen generated from electrolyizerPLAAverage load power during the year
Q N E Z Rated hydrogen flow (kg/h)ρElectricity price
AEZ, & BEZ Hydrogen consumption coefficients.ρ0Basic tariff
PFCGenerated power from the fuel cells V G H S S min Allowable minimum amount of Hydrogen in Hydrogen tank
QFCAmount of Hydrogen consumed in fuel cell V G H S S max Maximum amount of Hydrogen in Hydrogen tank
PNFCRated power of the fuel cellPEZPower consumed by the electrolyizer
AFC & BFCConsumption coefficients of the fuel cellPGGenerated power from the wind and PV systems

References

  1. Eltamaly, A.M.; Alotaibi, M.; Alolah, A.; Ahmed, M. A Novel Demand Response Strategy for Sizing of Hybrid Energy System with Smart Grid Concepts. IEEE Access 2021, 9, 20277–20294. [Google Scholar] [CrossRef]
  2. Kempton, W.; Letendre, S. Electric vehicles as a new power source for electric utilities. Transp. Res. Part D Transp. Environ. 1997, 2, 157–175. [Google Scholar] [CrossRef]
  3. Gao, S.; Chau, K.; Liu, C.; Wu, D.; Chan, C. Integrated energy management of plug-in electric vehicles in power grid with renewables. IEEE Trans. Veh. Technol. 2014, 63, 3019–3027. [Google Scholar] [CrossRef]
  4. Lam, A.; Leung, K.; Li, V. Capacity estimation for vehicle-to-grid frequency regulation services with smart charging mechanism. IEEE Trans. Smart Grid 2015, 7, 156–166. [Google Scholar] [CrossRef]
  5. Brenna, M.; Foiadelli, F.; Longo, M. The exploitation of vehicle-to-grid function for power quality improvement in a smart grid. IEEE Trans. Intell. Transp. Syst. 2014, 15, 2169–2177. [Google Scholar] [CrossRef]
  6. Falahi, M.; Chou, H.; Ehsani, M.; Xie, L.; Butler-Purry, K. Potential power quality benefits of electric vehicles. IEEE Trans. Sustain. Energy 2013, 4, 1016–1023. [Google Scholar]
  7. Sadeghian, O.; Nazari-Heris, M.; Abapour, M.; Taheri, S.; Zare, K. Improving reliability of distribution networks using plug-in electric vehicles and demand response. J. Mod. Power Syst. Clean Energy 2019, 7, 1189–1199. [Google Scholar] [CrossRef]
  8. Jannati, J.; Nazarpour, D. Optimal performance of electric vehicles parking lot considering environmental issue. J. Clean. Prod. 2019, 206, 1073–1088. [Google Scholar] [CrossRef]
  9. Qu, D.; Liu, Q.; Fan, J.; Yang, J.; Yao, L. Analysis on Peak Clipping Effect of Distribution Network Based on Incentive Demand Response Participated by Electric Vehicles. In Proceedings of the 2020 IEEE Sustainable Power and Energy Conference (iSPEC); IEEE: Piscataway, NJ, USA, 2020; pp. 2179–2186. [Google Scholar]
  10. Lund, H.; Münster, E. Integrated transportation and energy sector CO2 emission control strategies. Transp. Policy 2006, 13, 426–433. [Google Scholar] [CrossRef]
  11. Chen, Y.; Wang, Y.; Hou, H.; Zhao, B.; Zhang, L.; Xie, C. Optimization Strategy of Composite Charging Station with Energy Storage for Fast Charging Demand of Electric Vehicles. In Proceedings of the 2022 7th Asia Conference on Power and Electrical Engineering (ACPEE), Chengdu, China, 23–25 November 2020; IEEE: Piscataway, NJ, USA, 2022; pp. 213–217. [Google Scholar]
  12. Hu, J.; Zhou, H.; Li, Y.; Hou, P.; Yang, G. Multi-time scale energy management strategy of aggregator characterized by photovoltaic generation and electric vehicles. J. Mod. Power Syst. Clean Energy 2020, 8, 727–736. [Google Scholar] [CrossRef]
  13. Wei, J.; Zhang, Y.; Wang, J.; Wu, L.; Zhao, P.; Jiang, Z. Decentralized Demand Management Based on Alternating Direction Method of Multipliers Algorithm for Industrial Park with CHP Units and Thermal Storage. J. Mod. Power Syst. Clean Energy 2022, 10, 120–130. [Google Scholar] [CrossRef]
  14. Zeng, B.; Wu, G.; Wang, J.; Zhang, J.; Zeng, M. Impact of behavior-driven demand response on supply adequacy in smart distribution systems. Appl. Energy 2017, 202, 125–137. [Google Scholar] [CrossRef]
  15. Goel, L.; Wu, Q.; Wang, P. Reliability enhancement and nodal price volatility reduction of restructured power systems with stochastic demand side load shift. In Proceedings of the 2007 IEEE Power Engineering Society General Meeting, Tampa, FL, USA, 24–28 June 2007; IEEE: Piscataway, NJ, USA, 2007; pp. 1–8. [Google Scholar]
  16. Ghahramani, M.; Nazari-Heris, M.; Zare, K.; Mohammadi-ivatloo, B. Optimal energy and reserve management of the electric vehicles aggregator in electrical energy networks considering distributed energy sources and demand side management. In Electric Vehicles in Energy Systems; Springer: Cham, Switzerland, 2020; pp. 211–231. [Google Scholar]
  17. Deng, Y.; Zhang, Y.; Luo, F.; Mu, Y. Operational planning of centralized charging stations utilizing second-life battery energy storage systems. IEEE Trans. Sustain. Energy 2020, 12, 387–399. [Google Scholar] [CrossRef]
  18. Domínguez-Navarro, J.; Dufo-López, R.; Yusta-Loyo, J.; Artal-Sevil, J.; Bernal-Agustín, J. Design of an electric vehicle fast-charging station with integration of renewable energy and storage systems. Int. J. Electr. Power Energy Syst. 2019, 105, 46–58. [Google Scholar] [CrossRef]
  19. Pantoš, M. Stochastic optimal charging of electric-drive vehicles with renewable energy. Energy 2011, 36, 6567–6576. [Google Scholar] [CrossRef]
  20. Liu, N.; Chen, Q.; Liu, J.; Lu, X.; Li, P.; Lei, J.; Zhang, J. A heuristic operation strategy for commercial building microgrids containing EVs and PV system. IEEE Trans. Ind. Electron. 2014, 62, 2560–2570. [Google Scholar] [CrossRef]
  21. Chen, Q.; Wang, F.; Hodge, B.; Zhang, J.; Li, Z.; Shafie-Khah, M.; Catalão, J. Dynamic price vector formation model-based automatic demand response strategy for PV-assisted EV charging stations. IEEE Trans. Smart Grid 2017, 8, 2903–2915. [Google Scholar] [CrossRef]
  22. Wang, R.; Wang, P.; Xiao, G. Two-stage mechanism for massive electric vehicle charging involving renewable energy. IEEE Trans. Veh. Technol. 2016, 65, 4159–4171. [Google Scholar] [CrossRef]
  23. Yang, H.; Pan, H.; Luo, F.; Qiu, J.; Deng, Y.; Lai, M.; Dong, Z. Operational planning of electric vehicles for balancing wind power and load fluctuations in a microgrid. IEEE Trans. Sustain. Energy 2016, 8, 592–604. [Google Scholar] [CrossRef]
  24. Erdogan, N.; Erden, F.; Kisacikoglu, M. A fast and efficient coordinated vehicle-to-grid discharging control scheme for peak shaving in power distribution system. J. Mod. Power Syst. Clean Energy 2018, 6, 555–566. [Google Scholar] [CrossRef]
  25. Jin, C.; Tang, J.; Ghosh, P. Optimizing electric vehicle charging: A customer’s perspective. IEEE Trans. Veh. Technol. 2013, 62, 2919–2927. [Google Scholar] [CrossRef]
  26. Pirouzi, S.; Aghaei, J.; Vahidinasab, V.; Niknam, T.; Khodaei, A. Robust linear archi-tecture for active/reactive power scheduling of EV integrated smart distribution networks. Electr. Power Syst. Res. 2018, 155, 8–20. [Google Scholar] [CrossRef]
  27. Soares, J.; Vale, Z.; Borges, N.; Lezama, F.; Kagan, N. Multi-objective robust optimization to solve energy scheduling in buildings under uncertainty. In Proceedings of the 2017 19th International Conference on Intelligent System Application to Power Systems (ISAP), San Antonio, TX, USA, 17–20 September 2017; IEEE: Piscataway, NJ, USA, 2017; pp. 1–6. [Google Scholar]
  28. Singh, M.; Kumar, P.; Kar, I. A multi charging station for electric vehicles and its utilization for load management and the grid support. IEEE Trans. Smart Grid 2013, 4, 1026–1037. [Google Scholar] [CrossRef]
  29. Jahangir, H.; Tayarani, H.; Ahmadian, A.; Golkar, M.; Miret, J.; Tayarani, M.; Gao, H. Charging demand of plug-in electric vehicles: Forecasting travel behavior based on a novel rough artificial neural network approach. J. Clean. Prod. 2019, 229, 1029–1044. [Google Scholar] [CrossRef]
  30. Leou, R.; Su, C.; Lu, C. Stochastic analyses of electric vehicle charging impacts on distribution network. IEEE Trans. Power Syst. 2013, 29, 1055–1063. [Google Scholar] [CrossRef]
  31. Haghi, H.; Qu, Z. A Kernel-based predictive model of EV capacity for distributed voltage control and demand response. IEEE Trans. Smart Grid 2016, 9, 3180–3190. [Google Scholar] [CrossRef]
  32. Hafez, O.; Bhattacharya, K. Integrating EV charging stations as smart loads for demand response provisions in distribution systems. IEEE Trans. Smart Grid 2016, 9, 1096–1106. [Google Scholar] [CrossRef]
  33. Zhao, H.; Yan, X.; Ren, H. Quantifying flexibility of residential electric vehicle charging loads using non-intrusive load extracting algorithm in demand response. Sustain. Cities Soc. 2019, 50, 101664. [Google Scholar] [CrossRef]
  34. Lee, Y.; Hur, J. A simultaneous approach implementing wind-powered electric vehicle charging stations for charging demand dispersion. Renew. Energy 2019, 144, 172–179. [Google Scholar] [CrossRef]
  35. Eltamaly, A.M.; Alotaibi, M.; Elsheikh, W.; Alolah, A.; Ahmed, M. Novel Demand Side-Management Strategy for Smart Grid Concepts Applications in Hybrid Renewable Energy Systems. In Proceedings of the 2022 4th International Youth Conference on Radio Electronics, Electrical and Power Engineering (REEPE), Moscow, Russia, 17–19 March 2022; IEEE: Piscataway, NJ, USA; pp. 1–7. [Google Scholar]
  36. Rafique, M.M.; Rehman, S.; Alam, M.M.; Alhems, L.M. Feasibility of a 100 MW installed capacity wind farm for different climatic conditions. Energies 2018, 11, 2147. [Google Scholar] [CrossRef]
  37. Eltamaly, A. Design and implementation of wind energy system in Saudi Arabia. Renew. Energy 2013, 60, 42–52. [Google Scholar] [CrossRef]
  38. Rajesh, P.; Muthubalaji, S.; Srinivasan, S.; Shajin, F.H. Leveraging a Dynamic Differential Annealed Optimization and Recalling Enhanced Recurrent Neural Network for Maximum Power Point Tracking in Wind Energy Conversion System. Technol. Econ. Smart Grids Sustain. Energy 2022, 7, 1–15. [Google Scholar] [CrossRef]
  39. Mohamed, M.; Eltamaly, A.M.; Alolah, A.; Hatata, A. A novel framework-based cuckoo search algorithm for sizing and optimization of grid-independent hybrid renewable energy systems. Int. J. Green Energy 2019, 16, 86–100. [Google Scholar] [CrossRef]
  40. Khan, M.W.; Wang, J.; Ma, M.; Xiong, L.; Li, P.; Wu, F. Optimal energy management and control aspects of distributed microgrid using multi-agent systems. Sustain. Cities Soc. 2019, 44, 855–870. [Google Scholar] [CrossRef]
  41. Eltamaly, A.M. Musical chairs algorithm for parameters estimation of PV cells. Sol. Energy 2022, 241, 601–620. [Google Scholar] [CrossRef]
  42. Eltamaly, A.M. A novel musical chairs algorithm applied for MPPT of PV systems. Renew. Sustain. Energy Rev. 2021, 146, 111135. [Google Scholar] [CrossRef]
  43. Eltamaly, A.M. An Improved Cuckoo Search Algorithm for Maximum Power Point Tracking of Photovoltaic Systems under Partial Shading Conditions. Energies 2021, 14, 953. [Google Scholar] [CrossRef]
  44. Eltamaly, A.M. Performance of smart maximum power point tracker under partial shading conditions of PV systems. In Proceedings of the IEEE International Conference on Smart Energy Grid Engineering (SEGE), Oshawa, ON, Canada, 17–19 August 2015; pp. 1–8. [Google Scholar]
  45. Pervez, I.; Antoniadis, C.; Massoud, Y. A Reduced Search Space Exploration Metaheuristic Algorithm for MPPT. IEEE Access 2022, 10, 26090–26100. [Google Scholar] [CrossRef]
  46. Farh, H.M.; Eltamaly, A.M.; Ibrahim, A.B.; Othman, M.F.; Al-Saud, M.S. Dynamic global power extraction from partially shaded photovoltaic using deep recurrent neural network and improved PSO techniques. Int. Trans. Electr. Energy Syst. 2019, 29, e12061. [Google Scholar] [CrossRef]
  47. Ji, Y.; Wang, J.; Xu, J.; Fang, X.; Zhang, H. Real-time energy management of a microgrid using deep reinforcement learning. Energies 2019, 12, 2291. [Google Scholar] [CrossRef]
  48. Shi, Y.; Xu, B.; Tan, Y.; Kirschen, D.; Zhang, B. Optimal battery control under cycle aging mechanisms in pay for performance settings. IEEE Trans. Autom. Control 2018, 64, 2324–2339. [Google Scholar] [CrossRef] [Green Version]
  49. Cheng, Y.-S.; Hesse, H.; Truong, N.; Jossen, A.; Liu, Y.-H. Charging strategy for a residential battery storage system using fuzzy logic controller. In Proceedings of the NEIS Conference; Springer: Wiesbaden, Germany, 2016; pp. 182–189. [Google Scholar]
  50. Kaabeche, A.; Belhamel, M.; Ibtiouen, R. Optimal sizing method for stand-alone hybrid PV/wind power generation system. SMEE 2010, 1, 205–213. [Google Scholar]
  51. Smaoui, M.; Abdelkafi, A.; Krichen, L. Optimal sizing of stand-alone photovoltaic/wind/hydrogen hybrid system supplying a desalination unit. Sol. Energy 2015, 120, 263–276. [Google Scholar] [CrossRef]
  52. Alotaibi, M.; Eltamaly, A. A Smart Strategy for Sizing of Hybrid Renewable Energy System to Supply Remote Loads in Saudi Arabia. Energies 2021, 14, 7069. [Google Scholar] [CrossRef]
  53. Dufo-López, R.; Bernal-Agustín, J. Multi-objective design of PV–wind–diesel–hydrogen–battery systems. Renew. Energy 2008, 33, 2559–2572. [Google Scholar] [CrossRef]
  54. Liu, X.; Tan, Q.; Niu, Y.; Babaei, R. Techno-economic analysis of solar tracker-based hybrid energy systems in a rural residential building: A case study in South Africa. Int. J. Green Energy 2022, 1–20. [Google Scholar] [CrossRef]
  55. Lan, T.; Jermsittiparsert, K.; Alrashood, S.T.; Rezaei, M.; Al-Ghussain, L.; Mohamed, M.A. An advanced machine learning based energy management of renewable microgrids considering hybrid electric vehicles’ charging demand. Energies 2021, 14, 569. [Google Scholar] [CrossRef]
  56. Chellakhi, A.; El Beid, S.; Abouelmahjoub, Y. An innovative Fast-Converging speed MPPT approach without oscillation for temperature varying in photovoltaic systems applications. Energy Sources Part A Recovery Util. Environ. Eff. 2022, 44, 2674–2696. [Google Scholar] [CrossRef]
  57. AlHashmi, M.; Chhipi-Shrestha, G.; Nahiduzzaman, K.M.; Hewage, K.; Sadiq, R. Framework for Developing a Low-Carbon Energy Demand in Residential Buildings Using Community-Government Partnership: An Application in Saudi Arabia. Energies 2021, 14, 4954. [Google Scholar] [CrossRef]
  58. Eltamaly, A.; Al-Saud, M. Nested multi-objective PSO for optimal allocation and sizing of renewable energy distributed generation. J. Renew. Sustain. Energy 2018, 10, 035302. [Google Scholar] [CrossRef]
  59. Soliman, S.A.-H.; Mantawy, A.-A.H. Modern Optimization Techniques with Applications in Electric Power Systems; Springer Science & Business Media: Berlin/Heidelberg, Germany, 2011. [Google Scholar]
  60. Maleki, A.; Pourfayaz, F.; Ahmadi, M.H. Design of a cost-effective wind/photovoltaic/hydrogen energy system for supplying a desalination unit by a heuristic approach. Sol. Energy 2016, 139, 2016. [Google Scholar] [CrossRef]
Figure 1. Smart EV charging station (SEVCS).
Energies 15 06541 g001
Figure 2. The distribution of daily driving distance through the year.
Energies 15 06541 g002
Figure 3. The daily distance and energy consumed by each EV.
Energies 15 06541 g003
Figure 4. The power dispatch and DR strategies with the SEVCS.
Energies 15 06541 g004
Figure 5. The FLC used for DR strategy.
Energies 15 06541 g005
Figure 6. The process of the PSO algorithm.
Energies 15 06541 g006
Figure 7. The schematic diagram of the IEEE 30 bus system with SEVCS connected to each load bus.
Energies 15 06541 g007
Figure 8. Monthly Solar Radiation on horizontal and 30° tilt angle in kWh/m2. (a) Horizontal plane, (b) 30° tilt angle.
Energies 15 06541 g008
Figure 9. The variation of the EV charging load during day hours for a complete year.
Energies 15 06541 g009
Figure 10. The LCE for different values of PED with and without V2G.
Energies 15 06541 g010
Figure 11. The voltage profile of the IEEE 30 bus system with the use of the SEVCS with different load variations without using the DR or the V2G concepts.
Energies 15 06541 g011
Figure 12. The voltage profile of the IEEE 30 bus system with the use of the SEVCS with different load variations with using the DR or the V2G concepts.
Energies 15 06541 g012
Figure 13. The variation of the transmission line losses with and without the use of DR and V2G.
Energies 15 06541 g013
Figure 14. The variation of the fuel cost with and without the use of DR and V2G.
Energies 15 06541 g014
Figure 15. The variation of the generated power from the conventional generators connected to the IEEE 30 bus systems without the use of DR and V2G.
Energies 15 06541 g015
Figure 16. The variation of the generated power from the conventional generators connected to the IEEE 30 bus systems with the use of DR and V2G.
Energies 15 06541 g016
Table 1. The fuzzy rules that were used in the implementation of the FLC.
SESVLLMHVH
ODA
NBPBPBPMPSZ
NPBPMPSZNS
ZPMPSZNSNM
PPMZNSNMNB
PBPSNSNMNMNB
Table 2. The wind speeds collected at 40 m above sea level, solar irradiance on a horizontal surface, and temperature for the Dumah AlJandal site.
MonthJanFebMarAprMayJunJulAugSepOctNovDecMean
Wind speed5.65.56.56.15.96.36.65.75.55.55.45.55.84
Solar Irradiance
Wh/m2/h
162202254296319347346317281222173151256
Ta (°C)9.313.517.423.328.233.034.83630.425.315.78.826.5
Table 3. The specifications of different HRES components.
ComponentSpecifications
WT (AE-Italia) [54]Pr = 60 kW, hwt = 30 m, UC = 2.5 m/s, UR = 8 m/s, and UF = 25 m/s, TWT = 20 years, cost of wind turbines = $1500/kW, OMC of wind turbines = $100/kW/year [60]
PV parameters [54]Cost of PV system = $200/m2 [60], OMC of PV=0.01* Cost of PV system, PVA = 1.67 m2, ηpv = 17%, lifetime = 30 year, βt = 0.005 per °C, Tcr = 25 °C
Inverter [54] Inverter   cos t = $ 410 / kW ,   inverter   OMC = $ 10 / kW / year ,   salvage   price   of   inverter = $ 50 / kW ,   inverter   life   time = 10   years ,   η i n v = 0.95
Battery [54] Battery   cos t = $ 250 / kWh ,   battery   OMC = $ 0.02 / kWh / year ,   rated   battery   life = 10   years ,   η B C = 0.95 ,   η B D = 0.95, σ = 0.01%, DoD = 75%
Green HydrogenGHSS cost = $10,000/kW, GHSS OMC = $500/kW/year, GHSS lifetime = 10 years
AEZ = 40 kW/kg/h and BEZ = 20 kW/kg/h, respectively [53]. AFC = 0.05 and BFC = 0.004 [53]
Table 4. The change in system size components with different values of PED, 0 (flat tariff), −0.5, −1, respectively.
Without V2GWith V2G
ItemPED = 0PED = −0.5PED = −1PED = 0PED = −0.5PED = −1
NWT161212151211
PVA (m2)34632363217231172,1872154
EGH (kWh)17631125107316181014972
Eb (kWh)634452412578416384
TPC ($)4,954,7253,691,2343,482,6714,541,5613,383,9143,168,145
LCE ($/kWh)0.0523740.0390182480.036813630.0480066430.0337697170.032488927
Max (VWI)215.33.112.63.21.8
TL Losses (%)13.78.67.110.27.36.8
Publisher’s Note: MDPI stays neutral with regard to jurisdictional claims in published maps and institutional affiliations.

