Article

Numerical Turbulent Flow Analysis through a Rotational Heat Recovery System

1
MAST-GPEM, University Gustave Eiffel, 44344 Bouguenais, France
2
IMT Atlantique Département Systèmes Énergétiques et Environnement, UMR CNRS GEPEA, 44007 Nantes, France
*
Author to whom correspondence should be addressed.
Energies 2022, 15(18), 6792; https://doi.org/10.3390/en15186792
Submission received: 24 August 2022 / Revised: 13 September 2022 / Accepted: 15 September 2022 / Published: 16 September 2022

Abstract

:
Herein, hydrodynamic analysis from a large-eddy simulation in Couette–Taylor–Poiseuille (CTP) geometry is numerically investigated. The present geometry is inspired by a previous experimental work in which heat transport phenomena were investigated in a heat recovery system devoted to a rotary kiln facility. The streamwise and spanwise components of the velocity and the Reynolds stress tensor are firstly validated using an experimental benchmark. The effect of the axial flow rates is studied at a fixed rotational velocity. It is shown that the streamwise velocity component damps the vortex flow organization known in Couette–Taylor (CT) flow. The bulk region and its wall footprint are therefore characterized by various methods (spectral and statistical analysis, Q-criterion). It is shown that the turbulent kinetic energy of the streamwise component in the near-wall region is augmented leading to a multi-scale nature of turbulence.

1. Introduction

Waste heat is considered to be a by-product of the overall thermal processes related to the usage of fossil fuel (e.g. refinery plants), domestic heating (e.g. thermal power central), building materials manufacturing (e.g. kilns in a cement plant), or any other raw resources requiring heat treatment. For over a decade, it has attracted significant interest, since the re-use of excess heat, usually transferred to the surroundings, could improve existing equipment while giving the opportunity to introduce sustainable low-cost technologies. The benefits are multiple and could tackle major issues tied to:
-
The global carbon footprint mitigation of numerous human activities [1].
-
The social benefit due to diversified usage of the available energy power from solar [2] or biomass [3] resources.
According to the heat excess quality, the technologies devoted to its valorisation can be divided into three sub-categories. At a weak quality {T < 100 °C}, the heat is transferred into various exchangers for its direct re-use, while at a medium quality {100 < T°C < 350 °C}, energy storage materials are often preferred. For a higher quality {T > 350 °C}, the electricity conversion in various thermodynamic cycles is a relevant solution, despite some expected improvements in the design of many involved heat exchangers [4].
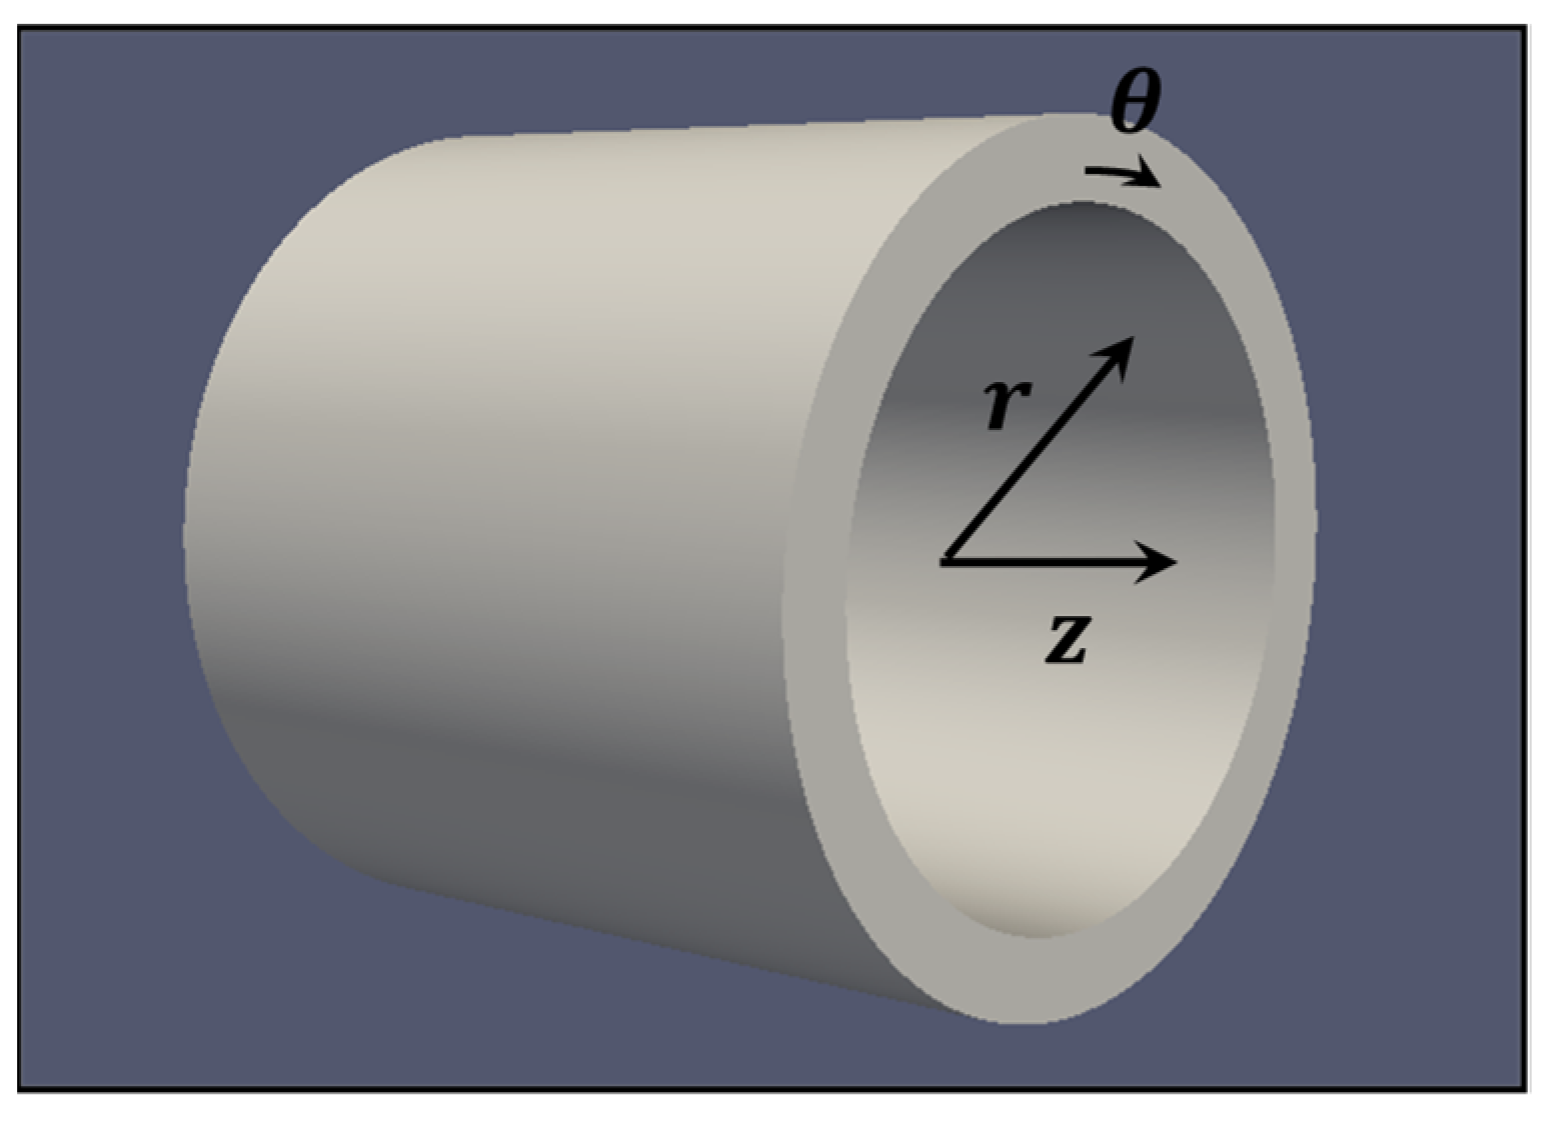
The present paper deals with the hydrodynamic characterization of heat recovery exchangers devoted to rotational thermal facilities. Rotary kilns are one such example of equipment whose energy consumption is very important, for example, in the cement industry. Ranging between 3 GJ/T and 5 GJ/T according to the clinkerization process [5], the rotary kiln process is able to transform the limestone into calcine materials at high temperatures (~2000 °C). Consequently, energy optimization [5] and CO2 sequestration [6] are of paramount importance to promote energy recovery in the rotary kiln industry (capture, transport, and storage of waste heat). This traditional equipment releases the required heat from the reactive combustion of fossil fuel resources. Slightly inclined (~3°), the kiln can reach 80 m in length and 6 m in diameter, while its rotation is relatively slow (from 2 to 10 rpm). Despite several intermediate processes such as the pre-heating of raw materials, the exergy and energy yields can reach, respectively, 39% and 59% [5,7]. The wall heat losses represent 61% of the overall waste heat [8]. Among this wall heat loss, 19% is imputed to the hot exhaust gases, 6% into the condenser, and 15% to the wall. Energy recovery from the wall is mentioned in the literature [9] as an alternative to ensure waste heat recovery. Most of the authors consider a second shell mounted to the drum as a potential technological solution [10,11]. Indeed, the medium grade energy of the wall (~150 °C) or the exhaust gases (~400 °C) require augmentation, or at least maintenance, during heat waste recovery. Consequently, only an efficient heat exchanger using a second shell would be capable of fulfilling the objective by confining a fluid between an inner moving cylinder and an outer cylinder, as shown in Figure 1.
In that context, the present paper is devoted to the numerical flow characterization of a heat recovery system preliminary studied at the pilot scale [12]. This experimental test bench was sized at a scale of 1:5 with respect to an industrial rotary dryer [13], in the perspective of a mounting on its external wall to simulate a heat exchanger. Two methods of heat recovery were proposed by so-called "natural" and "forced" convection methods. The thermal flow regimes were explored as functions of the Reynolds and Richardson numbers. The amount of heat recovered into the system is representative of wall heat fluxes measured in industrial plants [14]. A dimensionless relationship from the measurements relying on the Nusselt number, N u , and the effective Reynolds number, R e e f f , has been proposed ( N u ~ R e e f f a ). The exponent value found, equal to a~0.6, has been compared to previous works which established heat transport in swirling decaying flows. Starting from this finding, the present work aims to numerically study the turbulence properties in the annular duct involving the rotating inner cylinder.

2. Materials and Methods

2.1. Numerical Strategy

The flow within the annular duct, composed of an inner moving cylinder, has been relatively well documented in the fluid mechanics field since the historical paper of Taylor in 1923 [15] until the present [16]. The role and apparition of the instabilities in the Couette–Taylor flow are known to be complex, depending on numerous parameters (gap effect, initial condition, etc.). The fine characterization of the different turbulence structures from large- to micro-scales remains an active research question [16]. The self-sustained process of the turbulence is characterized by several flow regimes from Taylor vortex up to certain wavy shapes of the flow responsible for decreasing the wall shear stress [17]. The superposition of an axial flow called the Taylor–Couette–Poiseuille flow has also been investigated numerically [18] and experimentally in the literature. Certain experimental data [19,20] are often chosen for numerical validation where the RANS (Reynolds-averaged Navier–Stokes) method [21] including different types of turbulence closure models fails to validate the simulations. Therefore, two approaches have become the consensus in the scientific community:
-
A derived RANS approach based on a second-order model, taking into account the curve wall effect [22];
-
Large-eddy simulation, which offers significant accuracy [23,24] in solving the vortices dynamics at the fluid/wall interface.
Consequently, the LES OneEqEddy and RSM models developed by OpenFOAM software are chosen to solve the Navier–Stokes equation in CTP flow.
Three axial flow are investigated corresponding to a rotational number ranged between N = 0.85 and N = 5.12. The CTP flow is herein representative of the air-cooled heat exchanger experimentally studied [12]. The radius of the heat exchanger is identical to those of the test bench. The drum radius R i is 0.17 m and the external radius R e is 0.21 m. The thickness of the annular area between the two cylinders is e = 0.04 m for a study length of L z = 20 δ with δ = e / 2 (Figure 2). The numerical length L z corresponds here to an aspect ratio Γ = L z e = 10 and the shape factor η = R i R e = 0.809 .
The considered fluid is air (density: ρ = 1.2   kg . m 3 , dynamic viscosity: μ = 1.85 × 10 5   kg . m 1 . s 1 ). The rotational speed of the drum is equal to 50 tr.min−1 (ωRi = 0.94 m.s−1), and the axial flow rate in the exchanger is between 30 and 200 m3.h−1 ( U ¯ z = 0.21 0.95   m . s 1 ). The studied velocity ranges correspond to a turbulent regime for CTP flow as reported in Table 1.

2.2. Meshes Parameters

The computational accuracy increases with the number of meshes, while the computational time increases with the number of equations to solve directly related to the number of meshes. Therefore, there is a trade-off between the number of meshes, the computational accuracy, and the computational time. In LES simulations, the mesh size is relatively important compared to RANS approach. Large scales larger than the mesh size are solved directly, and smaller scales are modelled based on the assumption of a sub-grid turbulence model below the smaller mesh size. Consequently, it is necessary to adjust the mesh size in order to satisfy this assumption.
Large-scale structures of the flow are dependent on geometry and boundary conditions, while the behaviour of small structures at the dissipative scales is assumed to be self-similar and dependent only on the fluid viscosity ν and the amount ε of the turbulent kinetic energy dissipation rate.
The turbulent Taylor microscale λ represents the characteristic scale of the finest spatial fluctuations in velocity responsible for energy dissipation. This Taylor scale is used to define the dimension below which turbulent vortices behave universally and independently of external causes.
λ = 15   ν   u i 2 ε ¯
where u i is the standard deviation of each velocity component. ε ¯ is the averaged turbulent kinetic energy dissipation rate. In a steady-state flow, ε is the power required to be delivered to the large scales of turbulence in order to continuously maintain the turbulent agitation of the flow.
In CTP flow, the mesh is performed according to the available computational power in order to refine the mesh to be closer to the Taylor microscale λ . The mesh consists of approximately 16.5 million hexahedral cells with sizes between 0.65 mm and 2 mm. In coordinates scaled by the friction velocity V τ , the cell size is Δ r + < 1.5 , Δ z + < 15 and r   Δ θ + < 12 for the inner and outer wall, respectively.
Δ r + = ( Δ r ) ω V τ / ν
Δ z + = Δ z V τ / ν
With,
V τ = τ ρ     where   τ = μ ( V z r ) ω
The mesh specifications are summarized in Table 2. The scaled cell sizes of the mesh were compared to those of the literature on CTP flow [23,24], as seen in Table 2.

2.3. Boundary Conditions

The boundaries of the geometry study domain are two solid walls and cyclic boundary conditions. Unlike other types of boundary conditions, cyclic conditions are not boundaries. Using these conditions allows all properties to be repeated around an axis of symmetry. This cyclic boundary condition is applied between the inlet and outlet of the geometry to model the flow along the infinite in the z-direction. This approach has been previously used [23,24] for LES studies in CTP flow to obtain a fully developed flow between the two cylinders.
At the walls, a no-slip condition is applied, while the rotational speed,   ω R i , of the inner wall is imposed.

3. Numerical Validation

Here, LES OneEqEddy and RSM models were initially compared to experiments performed using laser Doppler anemometry (LDA) [20] on a geometry having a shape factor of η = 0.5 and a wide aspect ratio of Γ = 244. These experimental results have already been used by other authors [22] for validation of their numerical approaches to extend their work to real operating conditions ( η = 0.961 , Γ = 77 ), including non-isothermal flow for a wide range of axial and rotational Reynolds numbers ( 0 R e a 4870   ,   3744 R e t 37 , 443 ).
Such experiments [20] have provided a large database on mean velocity components and turbulent Reynolds stresses in CTP flow. Initially, the geometric parameters are defined in a dimensionless form with r * = ( r R i ) / ( R e R i ) and z * = z / L . Under these conditions, the inner cylinder is found to be r * = 0 and the outer cylinder is r * = 1 . The velocity components are also scaled by the mean flowing velocity U ¯ z for the streamwise component U z * = U z / U ¯ z , and by the cylinder rotation speed ω R i for the spanwise component U θ * = U θ / ω R i . The Reynolds stress components R θ θ and R z z are also scaled by the mean flow velocity U ¯ z .
Figure 3 and Figure 4 show the comparison of the numerical results of the RSM model and the LES modelling with the experimental data. In contrast with the RSM simulation, the LES simulation better predicts the average velocity, U θ * , in the annulus. The LES simulations appear to take better account of the rotational effects than the RANS simulation (Figure 3).
The numerical results of the LES simulations obtained in OpenFOAM are close to the experimental data [20]. However, it is important to note the presence of a near-wall peak ( r * = 0 ) on the experimental turbulent component R θ θ 1 / 2 . This peak was not reproduced by the numerical simulations and has not been observed in the numerical simulations available in the literature [21,22,24]. The presence of this peak may be related to the experimental difficulty in LDA of measuring the velocity in a thin boundary layer. The use of appropriate experimental methods, such as the electrochemical method, in the near-wall region is fundamental for wall shear stress determination [25].

4. Results and Discussion

The predictions of the LES simulations have been extended to the study case in order to obtain a better knowledge of the hydrodynamics of the CTP flow in the industrial application [12]. In this previous work, only heat transport characterization was performed on the exchanger geometry, characterized by a shape factor of η = 0.809 and an aspect ratio of Γ = 22.5.

4.1. Mean Flow Fields

The rotation parameter N , defined in Table 1, is used in the study of CTP flow to compare inertial effects related to the rotational and axial motions of the flow [19,20,23,24,26,27]. As shown in Figure 5, the trajectory of the fluid particles behaves differently according to the N values. The axial flow effect reduces their path lengths from the inlet to the outlet.
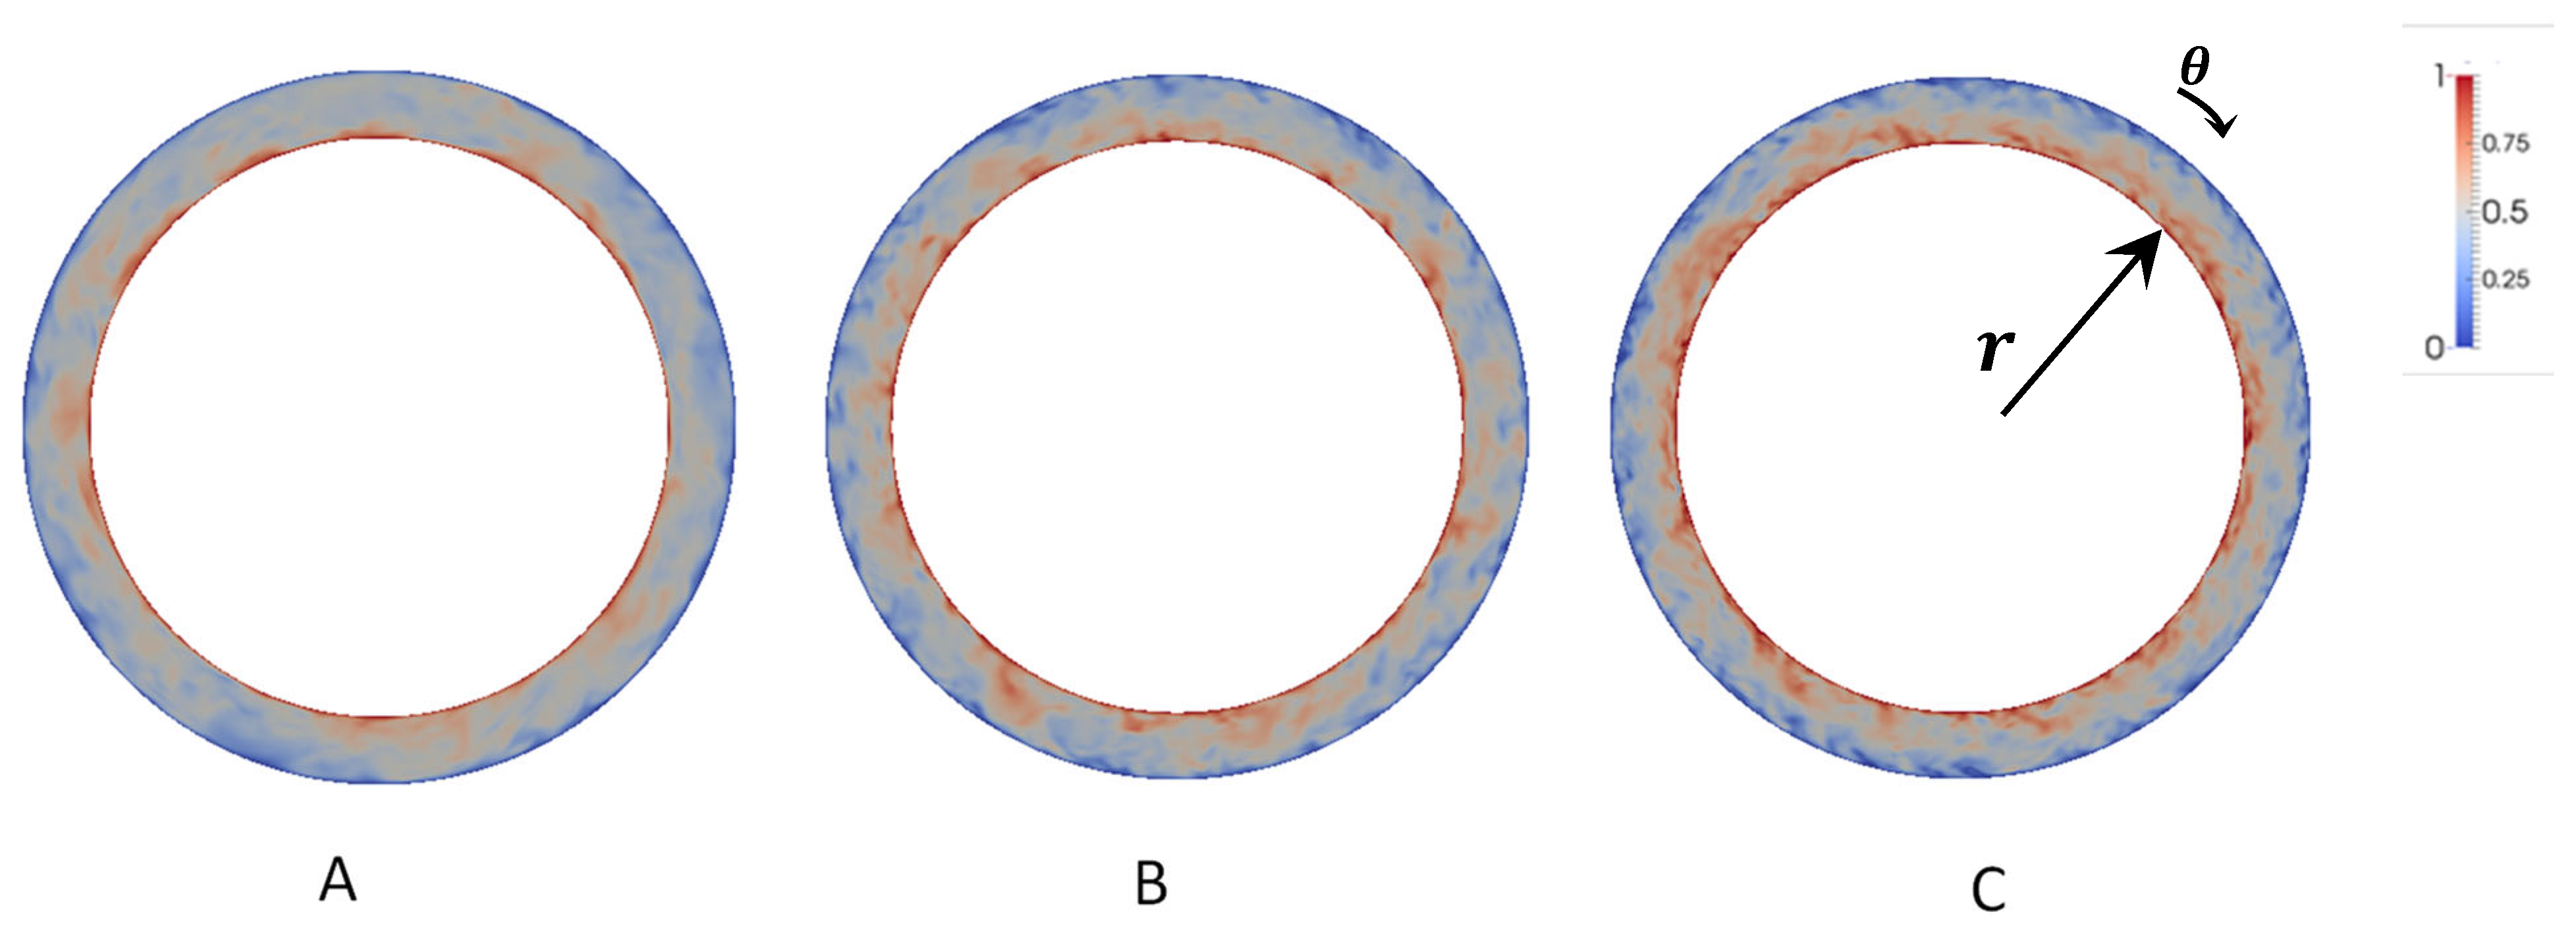
The instantaneous velocity fields of the streamwise and spanwise components are shown in Figure 6 and Figure 7, to visualize the turbulent structures of the flow. The radial velocity component has not been shown because it tends to zero throughout the system. The figures show that the flow is a combination of CT flow in the near-wall region of the rotating cylinder and Poiseuille flow in the annular space. The combination of the CT flow in the near-wall region superimposed on a Poiseuille flow explains the helical shape of the flow streamlines around the inner cylinder. Nevertheless, the effect of rotation decreases rapidly on the mean flow with the increase in the axial flow.
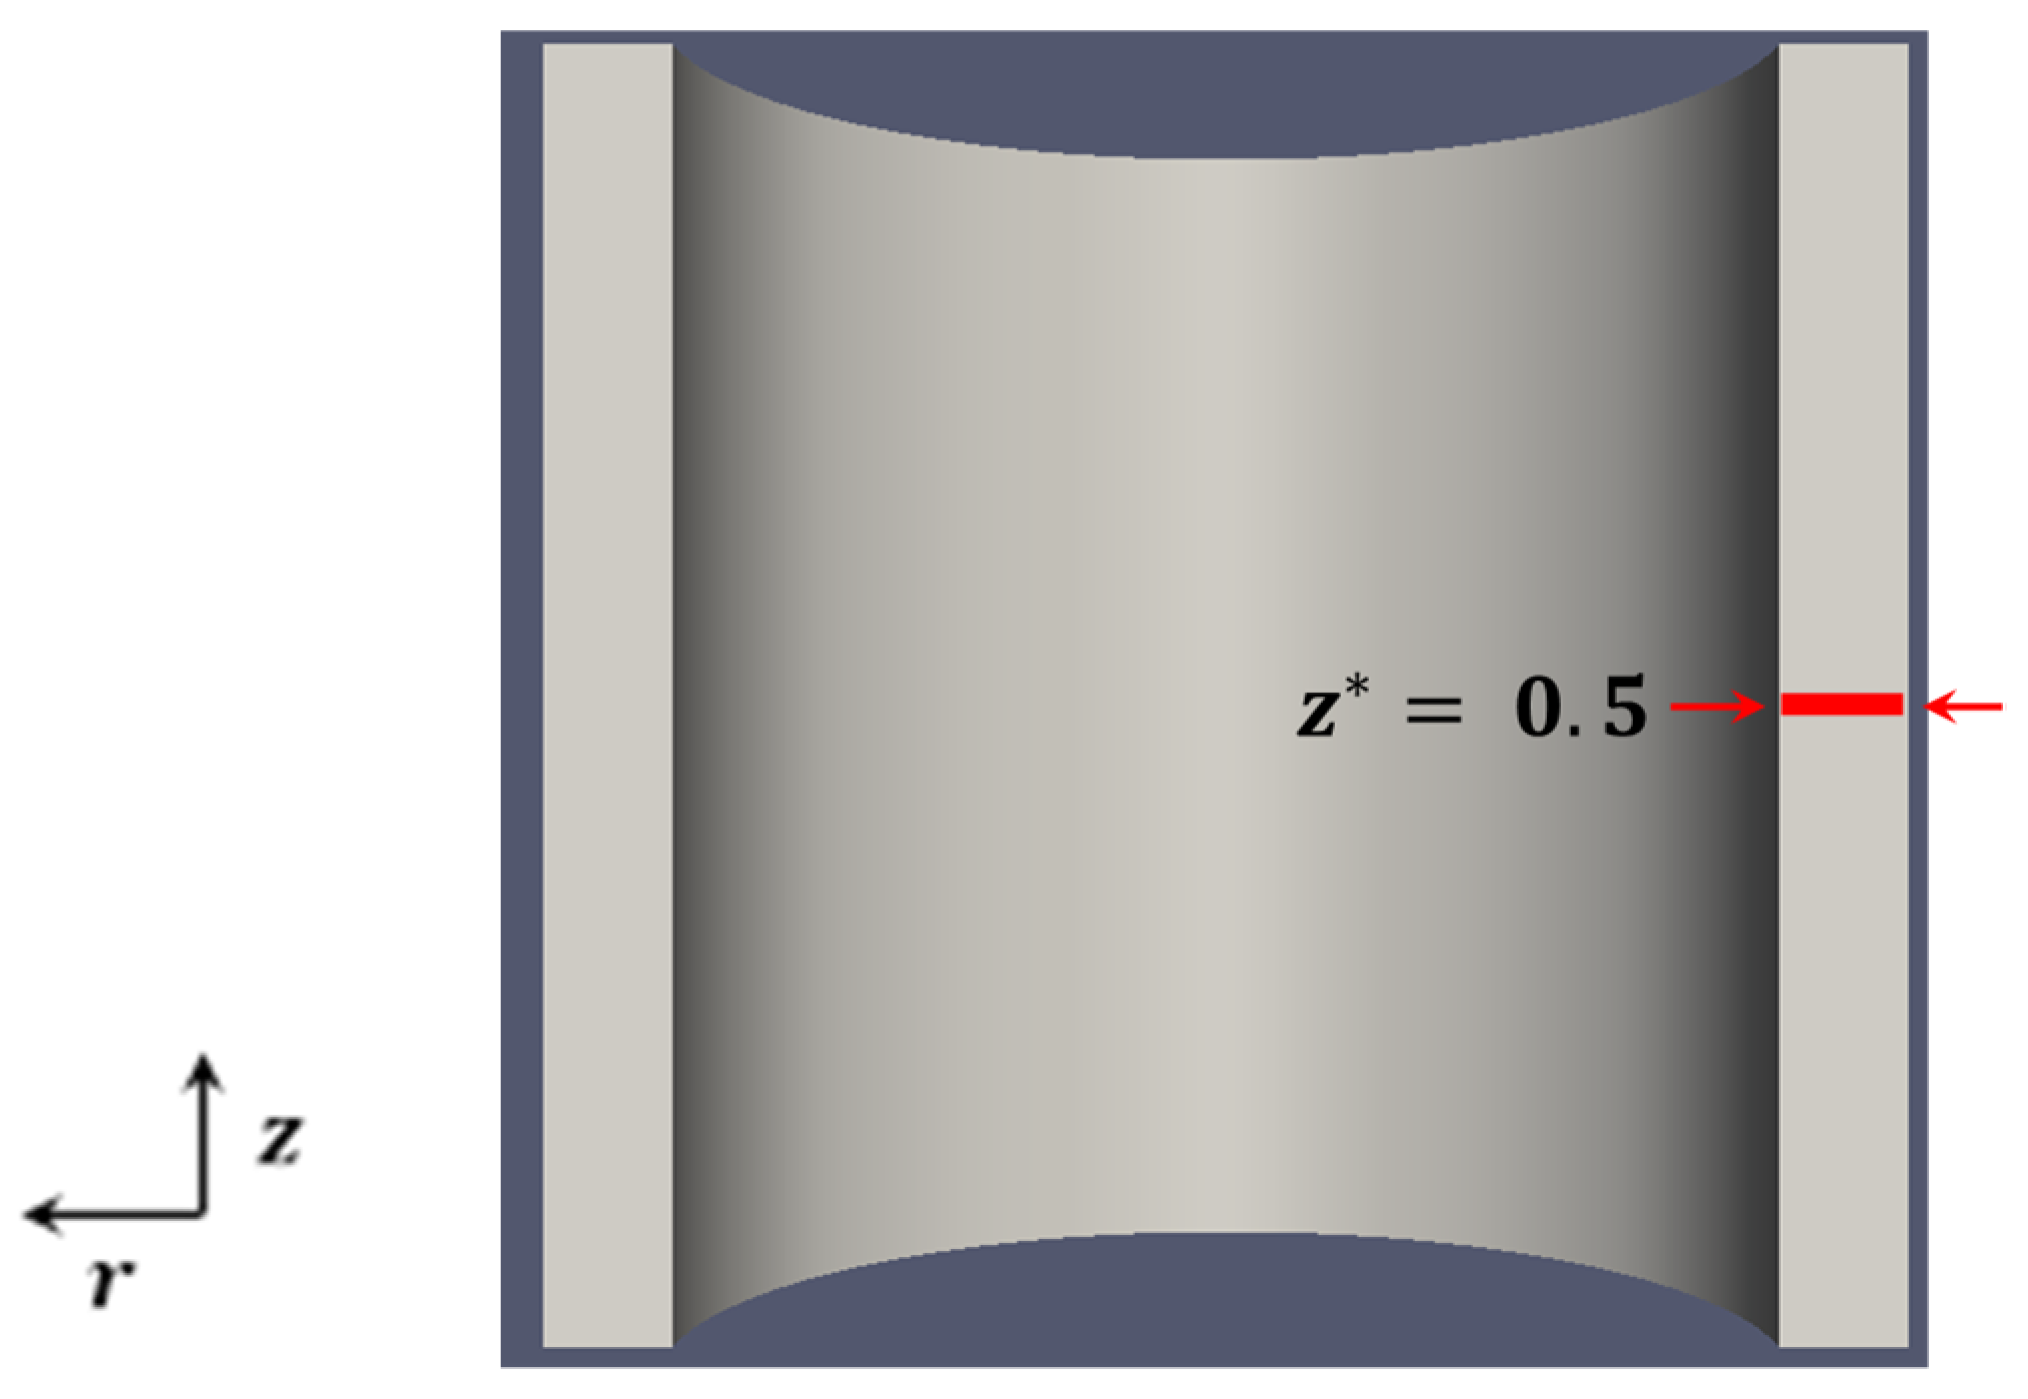
Figure 8 shows the radial distributions of the axial mean velocity components U z * and tangential U θ * for three values of N for z * = 0.5 (see Figure 9).
The mean axial velocity profile is closer to a turbulent Blasius profile than a Poiseuille flow; the streamwise velocity profile loses its symmetry plan with the increase in the rotational effect at N = 5.12. The axial flow rate has an influence on the velocity profile of the spanwise component, U θ * . The spanwise velocity component is composed of a rotating central flow, with two thin near-wall boundary layers. This type of profile corresponds to the velocity profiles typically observed in a turbulent regime in rotating flow configurations. In this case study, the central region rotates at approximately 40% of the inner cylinder velocity and the increase in the axial flow tends to stabilize the flow.

4.2. Reynolds Stress Tensor

The Reynolds stress tensor of the turbulent motion obtained by the LES simulation was analysed at z * = 0.5 (Figure 9) for different values of the parameter, N , to study its impact on the turbulent fluctuations.
The study of the distribution of the six Reynolds stresses normalized by the average axial flow velocity R z z * = R z z 1 / 2 / U ¯ z and R θ z * = R θ z 1 / 2 / U ¯ z , is displayed in Figure 10. From the Reynolds stress distribution, the turbulence rate appears to be mainly concentrated in the near-wall region of the boundary layer of the flow with relatively high turbulence peaks. The normal components R θ θ * and R z z * are lower in the bulk of the flow, while R r r * is higher in the centre of the flow. The diagonal components of the Reynolds tensor of turbulent motion form the turbulent kinetic energy = 1 / 2 ( R r r + R θ θ + R z z ) . From Figure 10, the R θ θ term appears to be dominant compared to the axial component of the turbulent fluctuations R z z . Therefore, the turbulent kinetic energy increases with N and the axial motion contributes to a large transfer of turbulent kinetic energy.
The crossed components R r z * and R θ z * show strong stress variations at the inner and outer cylinder walls. The turbulence intensity between the two cylinders increases with N and appears to be more unstable at the rotating cylinder boundary layer. This can also be attributed to the small effects of the radius of curvature.
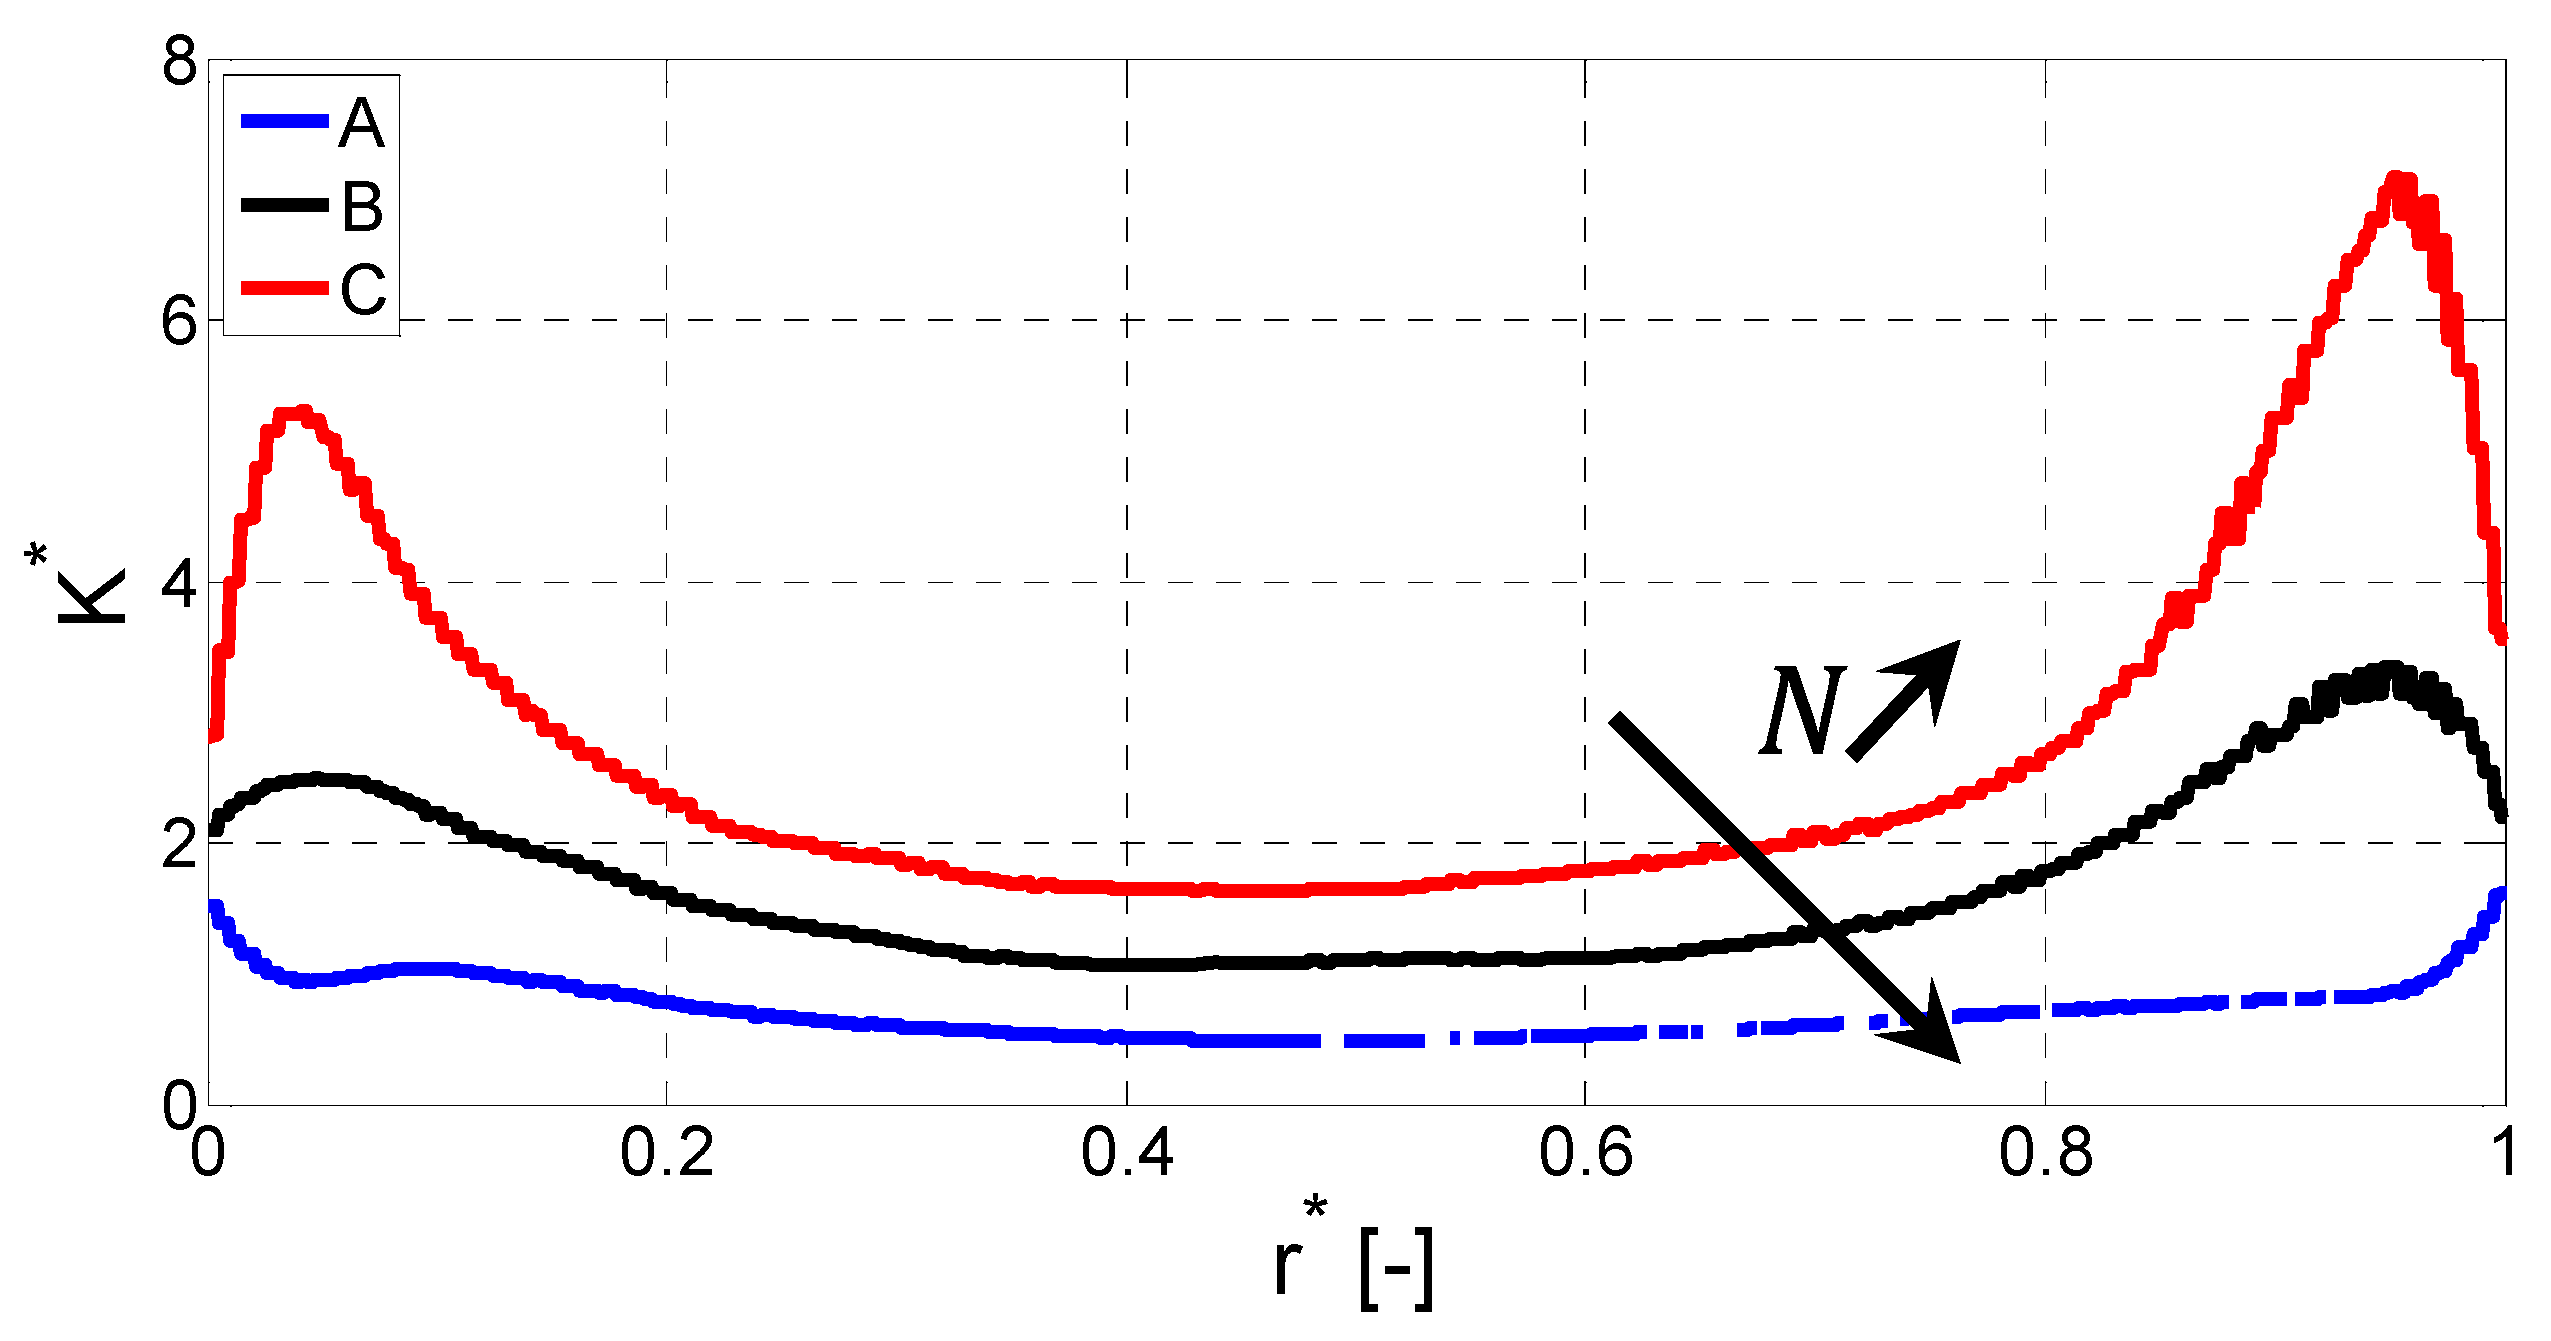
The energy redistribution induced by the effect of the radius of curvature is defined by the parameter K * [28]. This parameter measures the relative contribution of the turbulent intensity by comparing the turbulent contributions normal to the mean flow.
K * = 2 u z 2 ¯ ( u r 2 ¯ + u θ 2 ¯ )
From Figure 11, the effect of the radius of curvature appears to be less pronounced than that observed in preceding works [24,25]. It appears that the value of K * is larger at the outer cylinder wall than at the inner wall. This leads to the conclusion that the energy transferred near the wall by the streamwise component u z 2 ¯ to the other two components is enhanced at the rotating inner cylinder.
The parameter K * is greater than 1 for NC = 0.85 and NB = 1.71, and close to 1 for NA = 5.12. Therefore, the contribution of the axial turbulence intensity of the turbulent kinetic energy u z 2 ¯ is larger than the contribution of the other two normal components of the flow. With the increase in the rotational speed contribution, the values of K * decrease and are significantly lower than the values obtained by Chung et al., (2002) [26] in stationary cylinders. This decrease in the values of K * can be explained by the increase in the contribution of the turbulent intensity u θ 2 ¯ on the flow with rotation. As expected, the contributions of u z 2 ¯ decrease strongly with increases in the parameter N. For large values of N, the rotational effect dominates over the axial flow.

4.3. Boundary Layer Properties

For confined flows, the wall treatment is important because it can develop its own turbulence properties. The flow is in a laminar regime very close to the wall in the viscous sublayer, and moving away, the turbulence increases rapidly because of the high velocity gradients. The turbulent boundary layer can be divided into three areas: a viscous sublayer near the wall, a transition zone where turbulence and viscosity are equally important, and a zone dominated by turbulence.
Figure 12 shows the radial and normalized variation of the effective velocity U + = U / V τ as a function of the wall coordinate r + = r p V τ / ν , where r p is the distance between the wall and the measurement. The velocity U and the frictional velocity V τ are defined as follows:
U = U z 2 + ( ω R i U θ ) 2
V τ = ν 1 / 2 ( ( U θ r ) p 2 + ( U z r ) p 2 ) 1 / 4
In confined flow, specific treatment is required in addition to the turbulence model used in the area where the flow is developed. OpenFOAM proposes two approaches to solve the boundary layer: a wall law or a wall model. The wall law is founded on an analytical formulation of the wall region, while the wall model resolves the overall boundary layer. The resolution of the boundary layer requires a refined mesh in the near wall and is therefore expensive in terms of computation time. Thus, the present simulations were performed by a wall model in order to solve and study the boundary layer of the flow.
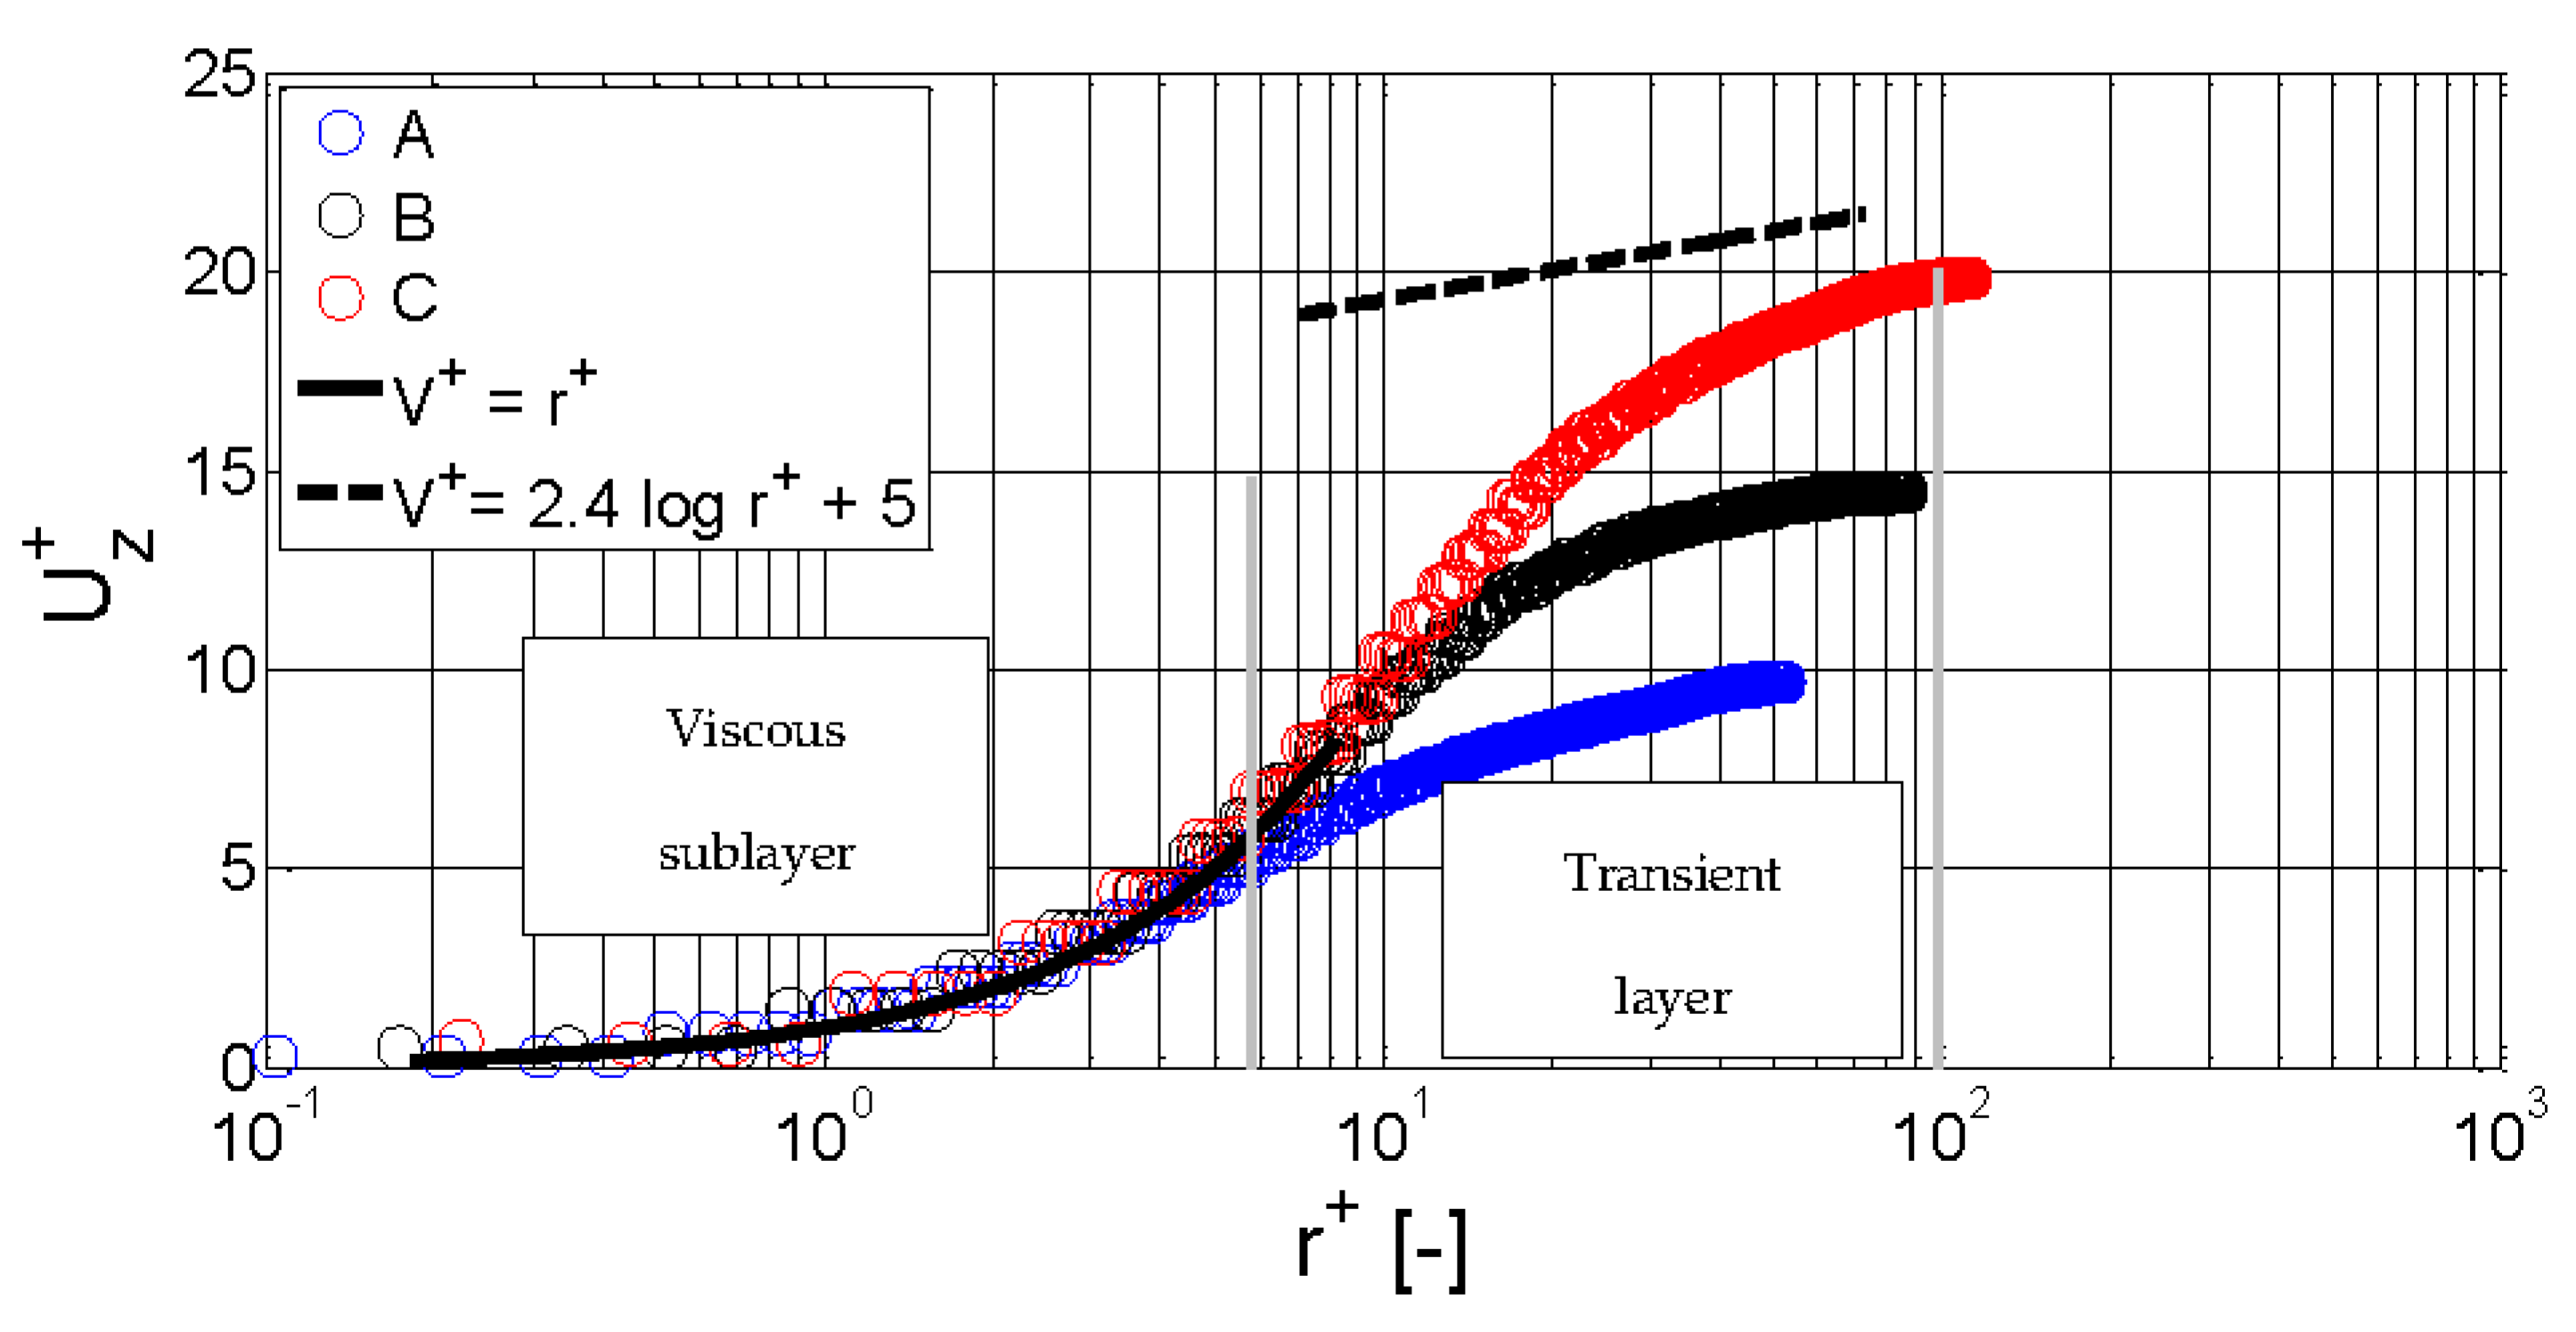
Figure 12 shows the hydrodynamic structure of the boundary layer as a function of the rotation parameter N. The wall modelling at the viscous sublayer r + < 5 appears well resolved, r + = u + . In this viscous sublayer, the viscous stress is greater than the turbulent stress. The size of the transient region between the viscous sublayer and the outer region 5 < r + < 30 is larger or smaller depending on the magnitude of the rotation parameter N . In this region, turbulent kinetic energy generation and dissipation are dominant. Finally, the logarithmic region between 30 < y + < 200 is defined by:
U + = 1 κ l n r + + B
In this equation, κ represents the universal von Kármán constant (typically 0.41) and B a constant close to 5 for a turbulent flow pipe geometry. In this study case, the von Kármán constant usually found in confined turbulent flow is not found. In the literature, the effect of the radius of curvature is known to decrease the slope of the transition zone. According to recent work [29], the rotation of the flow significantly affects the turbulence by introducing a nonlinear term into the logarithmic wall law. This observation was examined by Poncet et al., (2014) [24] in CTP flow and more recently by Belkadi et al., (2022) [30] in CT flow.
These results confirm the intensification of the hydrodynamic structures due to rotational effects. These significantly decrease the size of the boundary layer, ending up below that encountered in a pipe flow. However, the increase in the axial flow has the effect of enlarging the hydrodynamic boundary layer. The hydrodynamic boundary layer approaches the size of the boundary layer encountered in the case of pipe flow (case C, Figure 12).

4.4. Energy Cascade in the Near-Wall Region

Spectral analyses on the different cases of the Taylor–Couette–Poiseuille flow show a transfer of kinetic energy from small to large wave numbers. This evolution is called an energy cascade.
This energy cascade is calculated from the velocity fluctuations u z . The frequency domain transition of the signal recorded during the numerical experiments is ensured by a discrete Fourier transformation. The power spectral density was obtained from a series of operations to ensure a relevant statistical representation of a random signal. Based on signal processing theory and applied to turbulent wall-bounded flows [31]:
E i ( U ) = 0 N u z ( t ) N × F h a ( t ) × exp ( j 2 π f t ) d t
E ( U ) = i = 1 N E i ( U ) N
The principle is based on the extraction of the fluctuating signal from N blocks ( N   = 41), N representing the number of blocks into which the signal has been divided, each block having the same number of points, N e = 4048 . The number of points N e depends on the temporal resolution of the study. Finally, the signal is then multiplied by a Hanning’s window F h a ( t ) in order to avoid the edge effects caused by the Fourier transform on a finite signal.
F h a ( t ) = 0.5 ( 1 + cos π t N e )
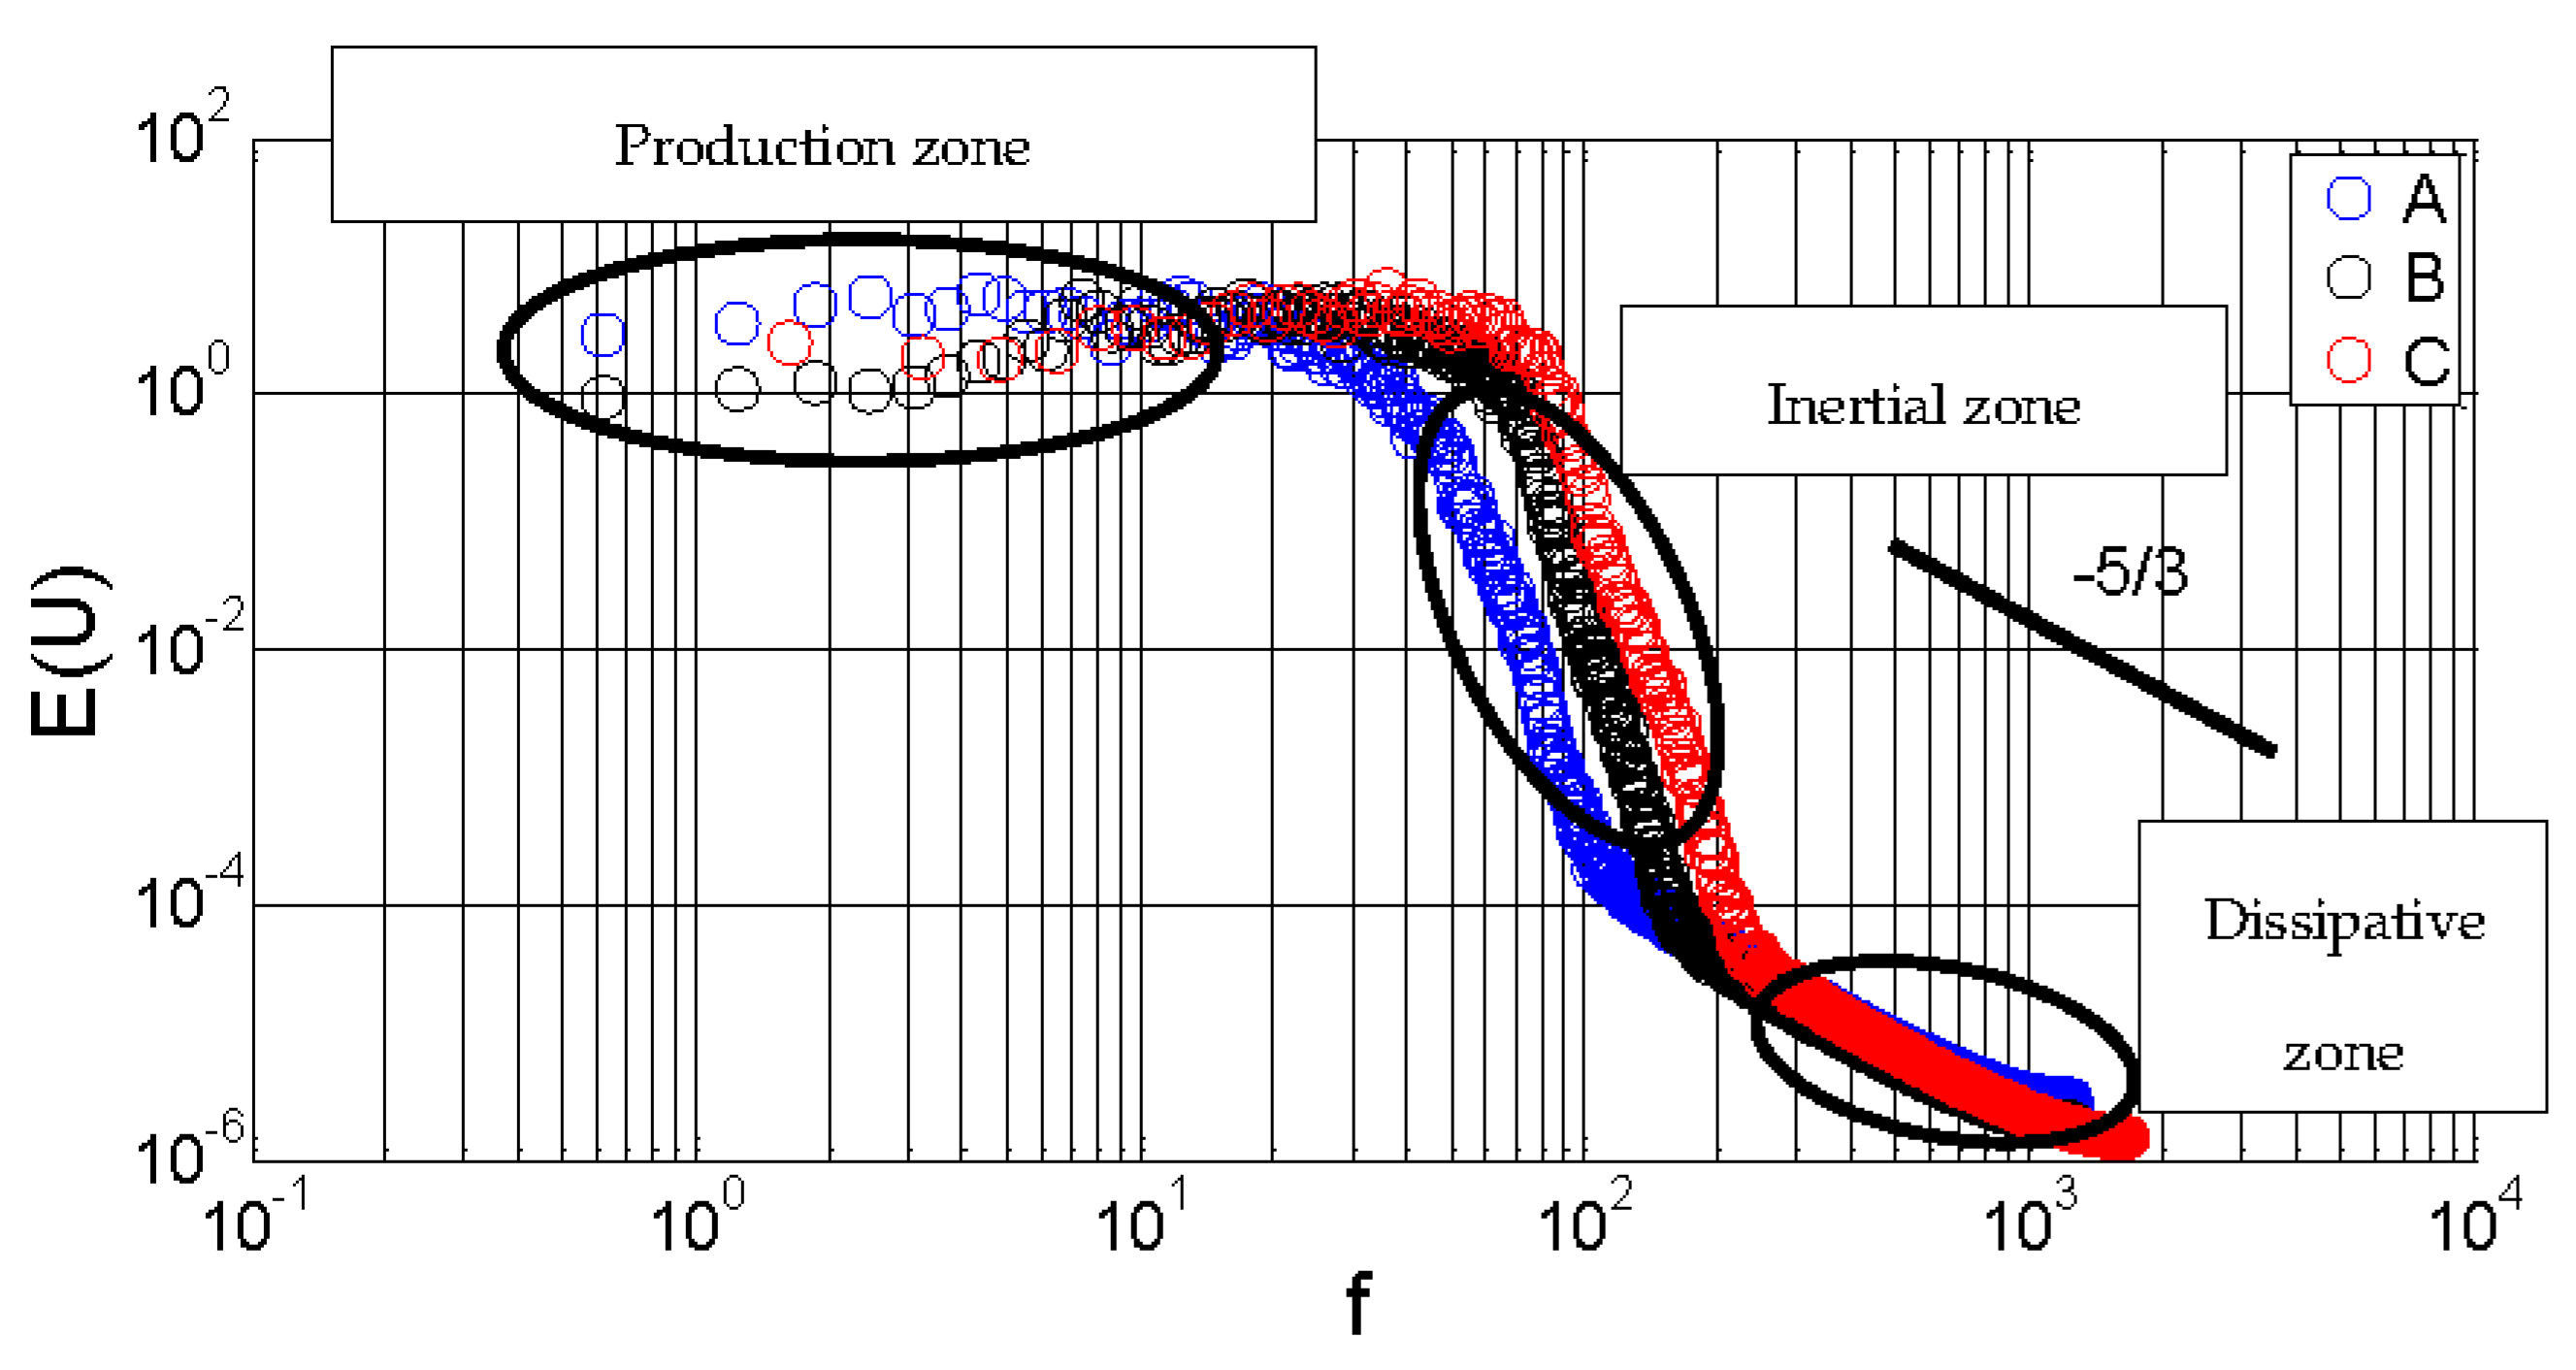
Figure 13 shows the energy cascade for three rotation numbers N at the rotating wall. Three distinct zones of the E ( U ) energy spectrum are exhibited, which were interpreted by such turbulence pioneers of the last century as Kolmogorov [32] or Hinze [33].
The first zone is the zone at large scales, where turbulence production takes place. The large-scale structures are related to the mean flow fields which obey the boundary conditions of the flow system. The second zone is the so-called “inertial zone” where a large range of micro-scales of turbulence co-exist. Its decrease is still the subject of many studies and is compared to the model of an isotropic nature of turbulence at a slope equal to −5/3. In this zone, the energy spectrum depends only on k and ε. Finally, the third zone is called the dissipation zone. It is very small in our case and consists of the smallest scales, where turbulent kinetic energy is dissipated by viscous effects.

4.5. Turbulent Structures

This section presents the transfer phenomena at the moving wall ( r = 0 ), due to the appearance of vortex structures in the flow. These vortex structures enhance the momentum transfer in the near-wall region. In numerical fluid mechanics, there are several parameters for the detection of vortex structures. Among them, the Q -criterion has been chosen for the 3D visualization of coherent structures and the vorticity criterion ω i j to track the presence of vortex structures in the boundary layer.

4.5.1. Q-Criteria

The visualization of coherent structures was obtained by using the Q -criterion proposed by Hunt et al. (1988) [34]. This criterion uses the second variant of the velocity gradient tensor defined by:
Q = 1 2 ( Ω i j Ω i j S i j S i j )
With,
Ω i j = 1 2 ( u i x j u j x i )   and   S i j = 1 2 ( u i x j + u j x i )
Ω i j measures the rotation of a portion of fluid and S i j its shear. Thus, regions for which the Q -criterion is positive characterize regions where rotation dominates shear, thus allowing visualization of coherent vortices. The Q -criterion is commonly used in the literature to identify small vortex structures.
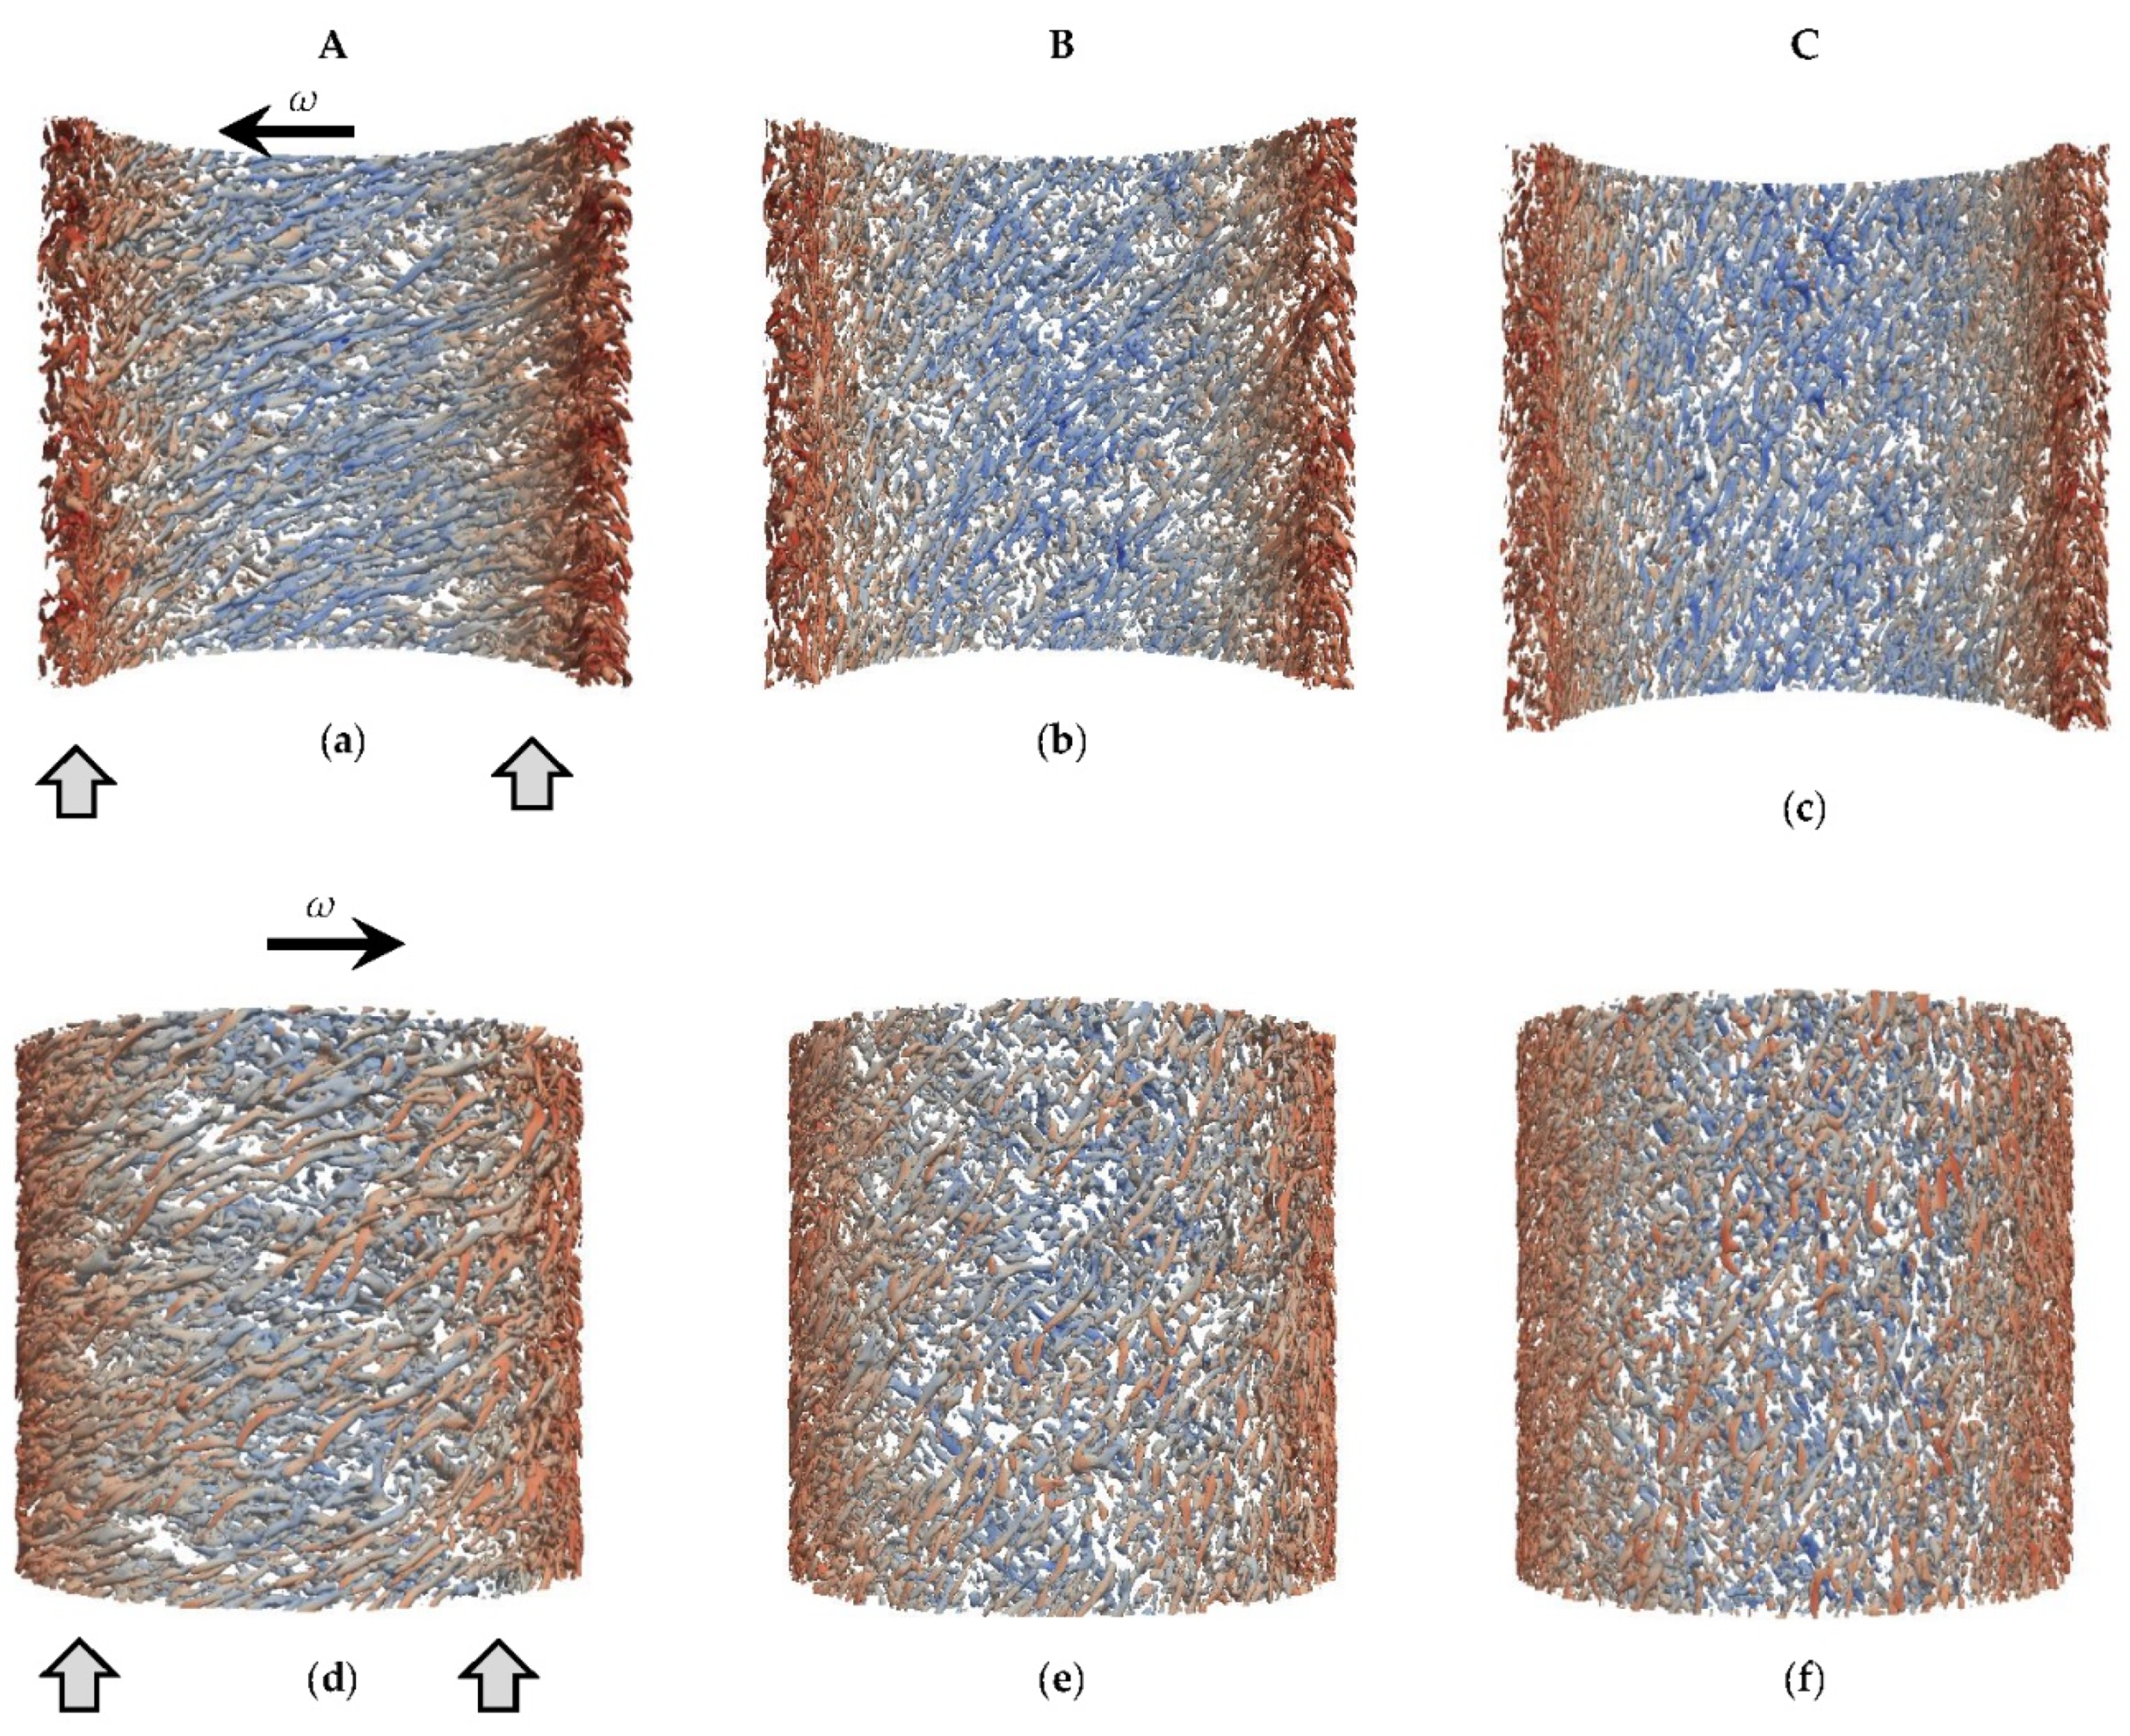
The vortex structures in the flow were thus identified by the positive iso-surfaces of the Q -criterion. The combination of Taylor–Couette near-wall flow superimposed on Poiseuille flow explains the presence of the vertical helical structures wound along the wall (Figure 14).
The results of the three-dimensional LES simulations highlight the presence of unstable coherent structures at the two opposite boundary layers. These structures appear as coiled spirals along the length of the cylinders. At the inner wall, the vortex structures are coiled in the direction opposite to the rotation of the cylinder, while they are coiled in the direction of the rotation of the cylinder at the near outer wall. With the increase in the number of rotations N, the structures tilt progressively in the tangential direction. The angle formed on the inner cylinder in the tangential direction is equal to − 18 ° for N = 5.12 (case A), 55 ° for N = 1.71 (case B), and 72 ° for N = 0.85 (case C).

4.5.2. Vorticity

To attest to the presence of vortices in the boundary layer, the ( r , z ) mapping of the vorticity vector is presented in Figure 15. The vorticity vector is defined by:
ω i j = ( u i x j u j x i ) U z
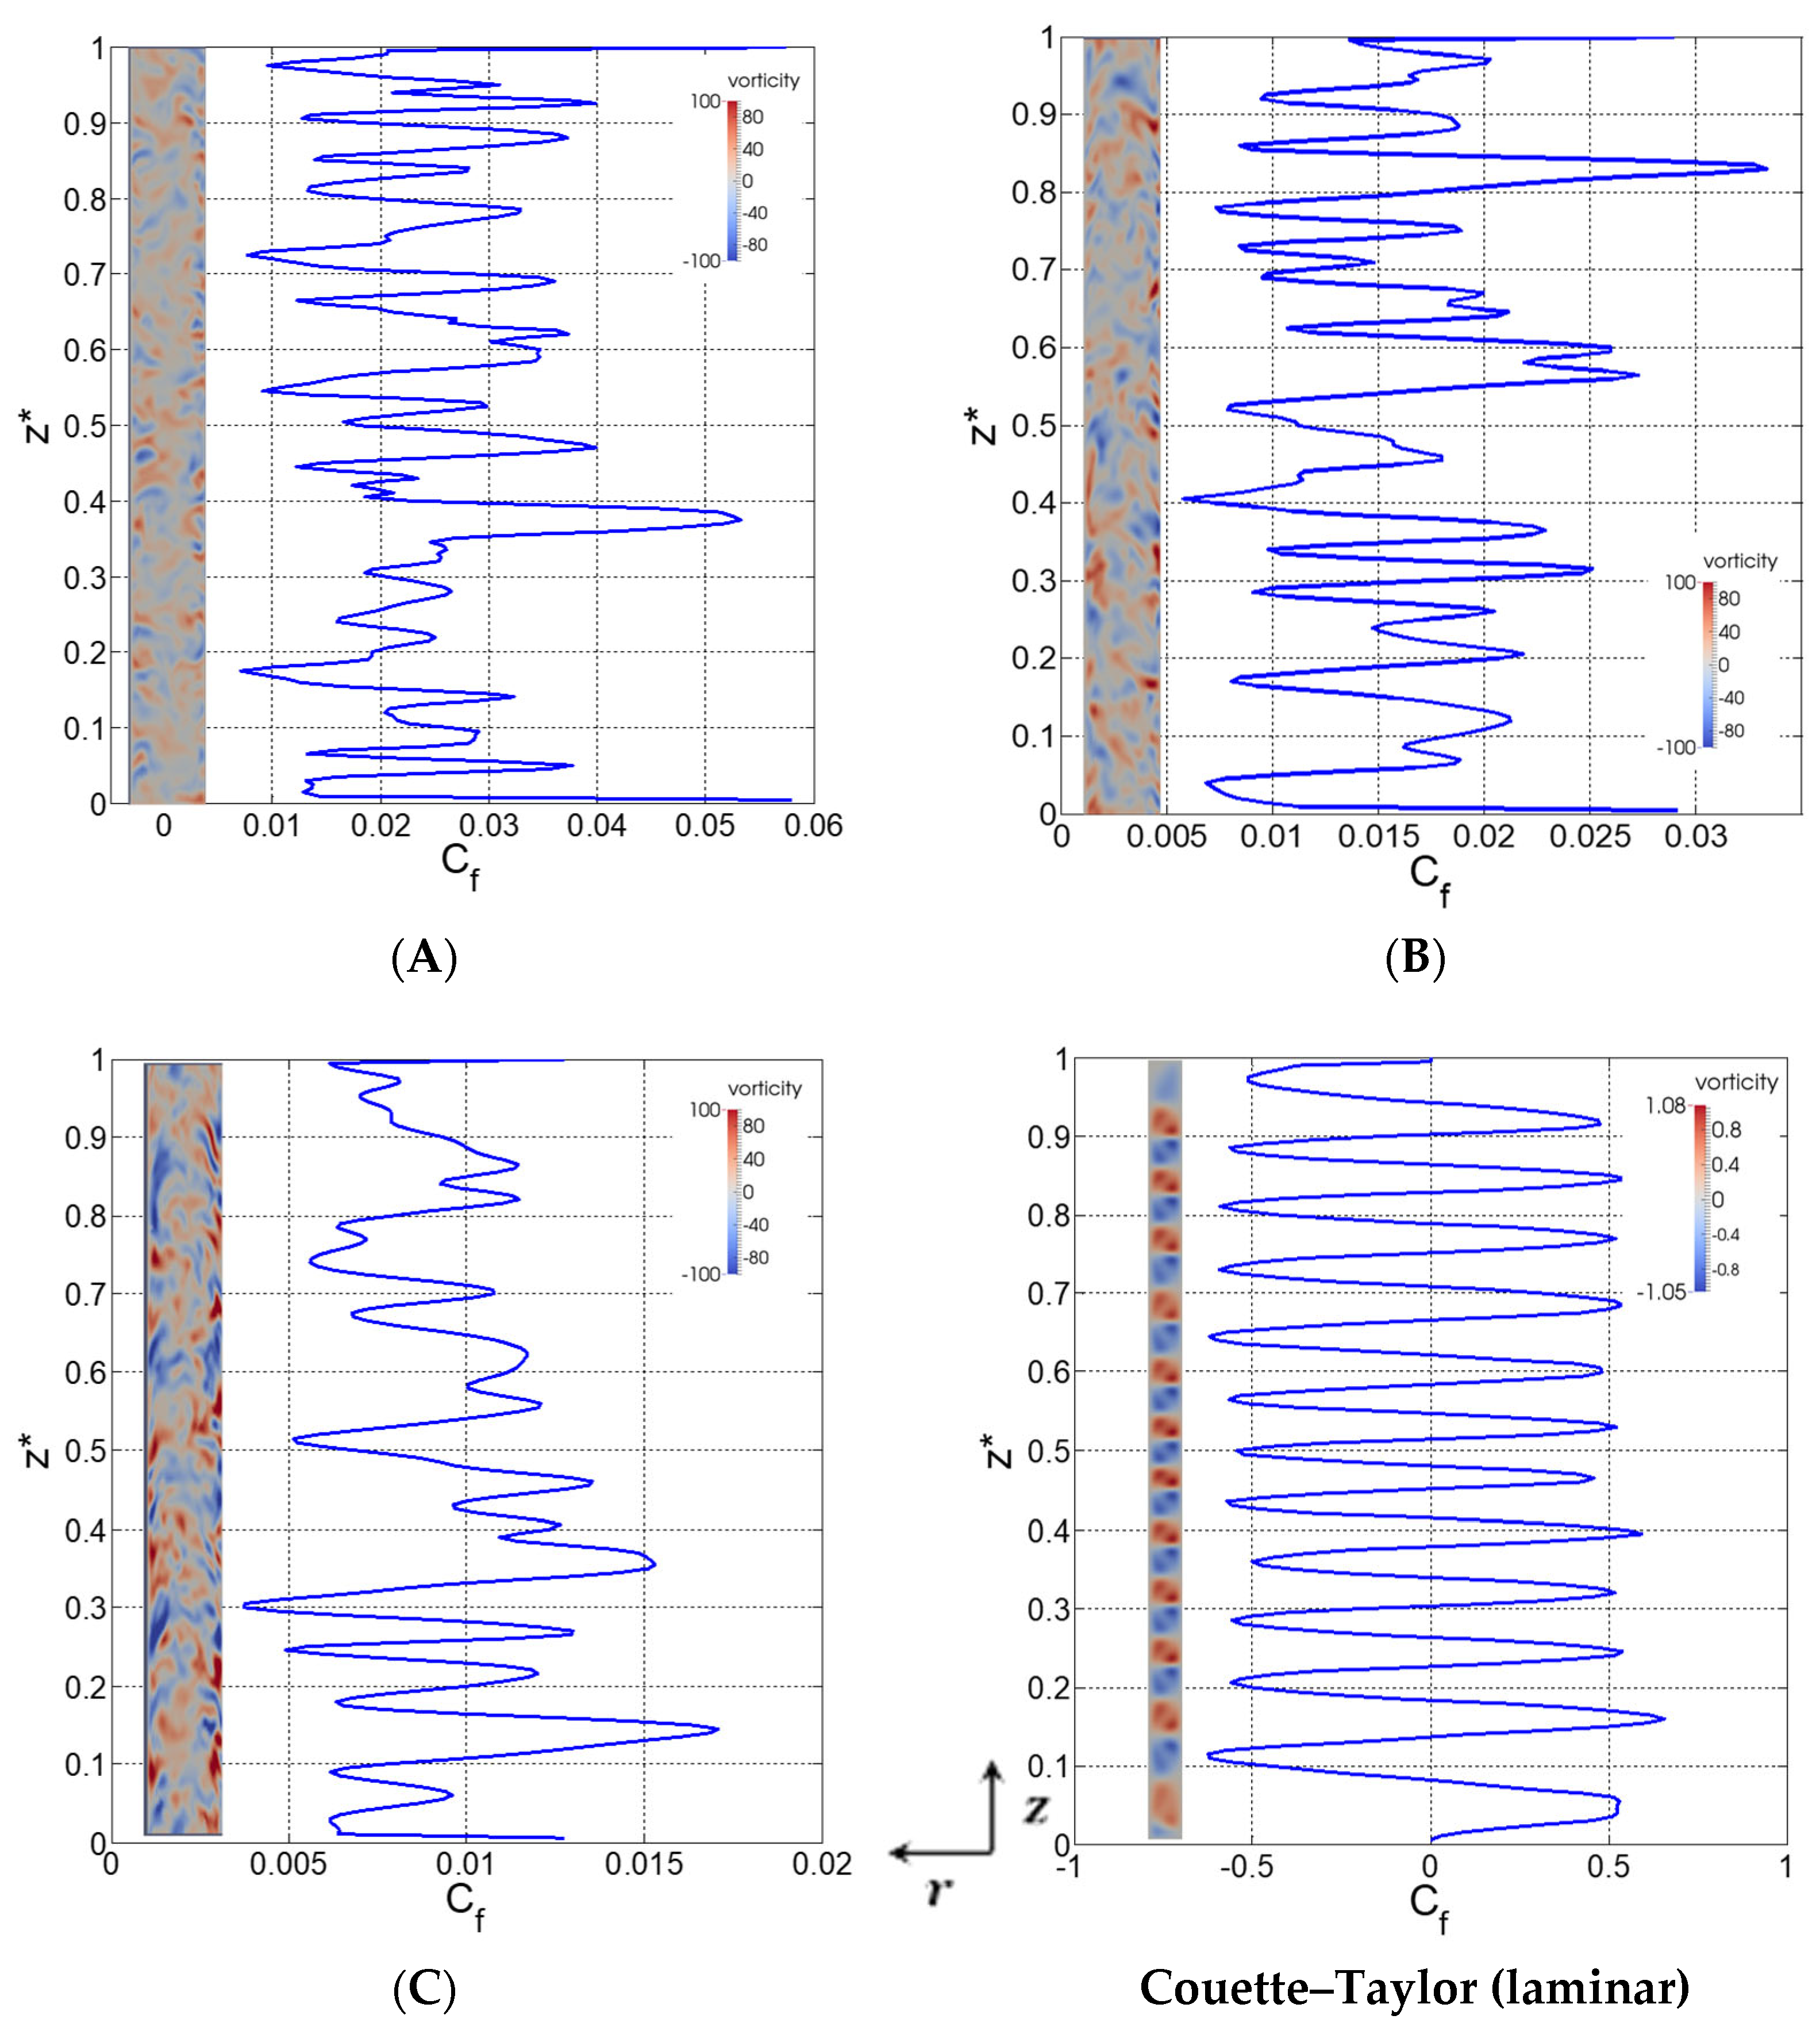
Thus, the centres of the vortices can be detected by a local maximum of the vorticity modulus. For each case, at both walls, we find an alternation of counter-rotating vortices highlighted by ω i j > 0 and ω i j < 0 .
The skin-friction coefficient C f ( z ) characterizing the wall shear stress is estimated at a time t , between r * = 0 and the first cell of the mesh located at r * = 0.03 along the z * axis.
C f = τ p 1 / 2 ρ U m 2
τ p = τ z 2 + τ θ 2
where, τ p is the wall shear stress, τ z = μ U z r | r = 0 and τ θ = μ U θ r | r = 0 .
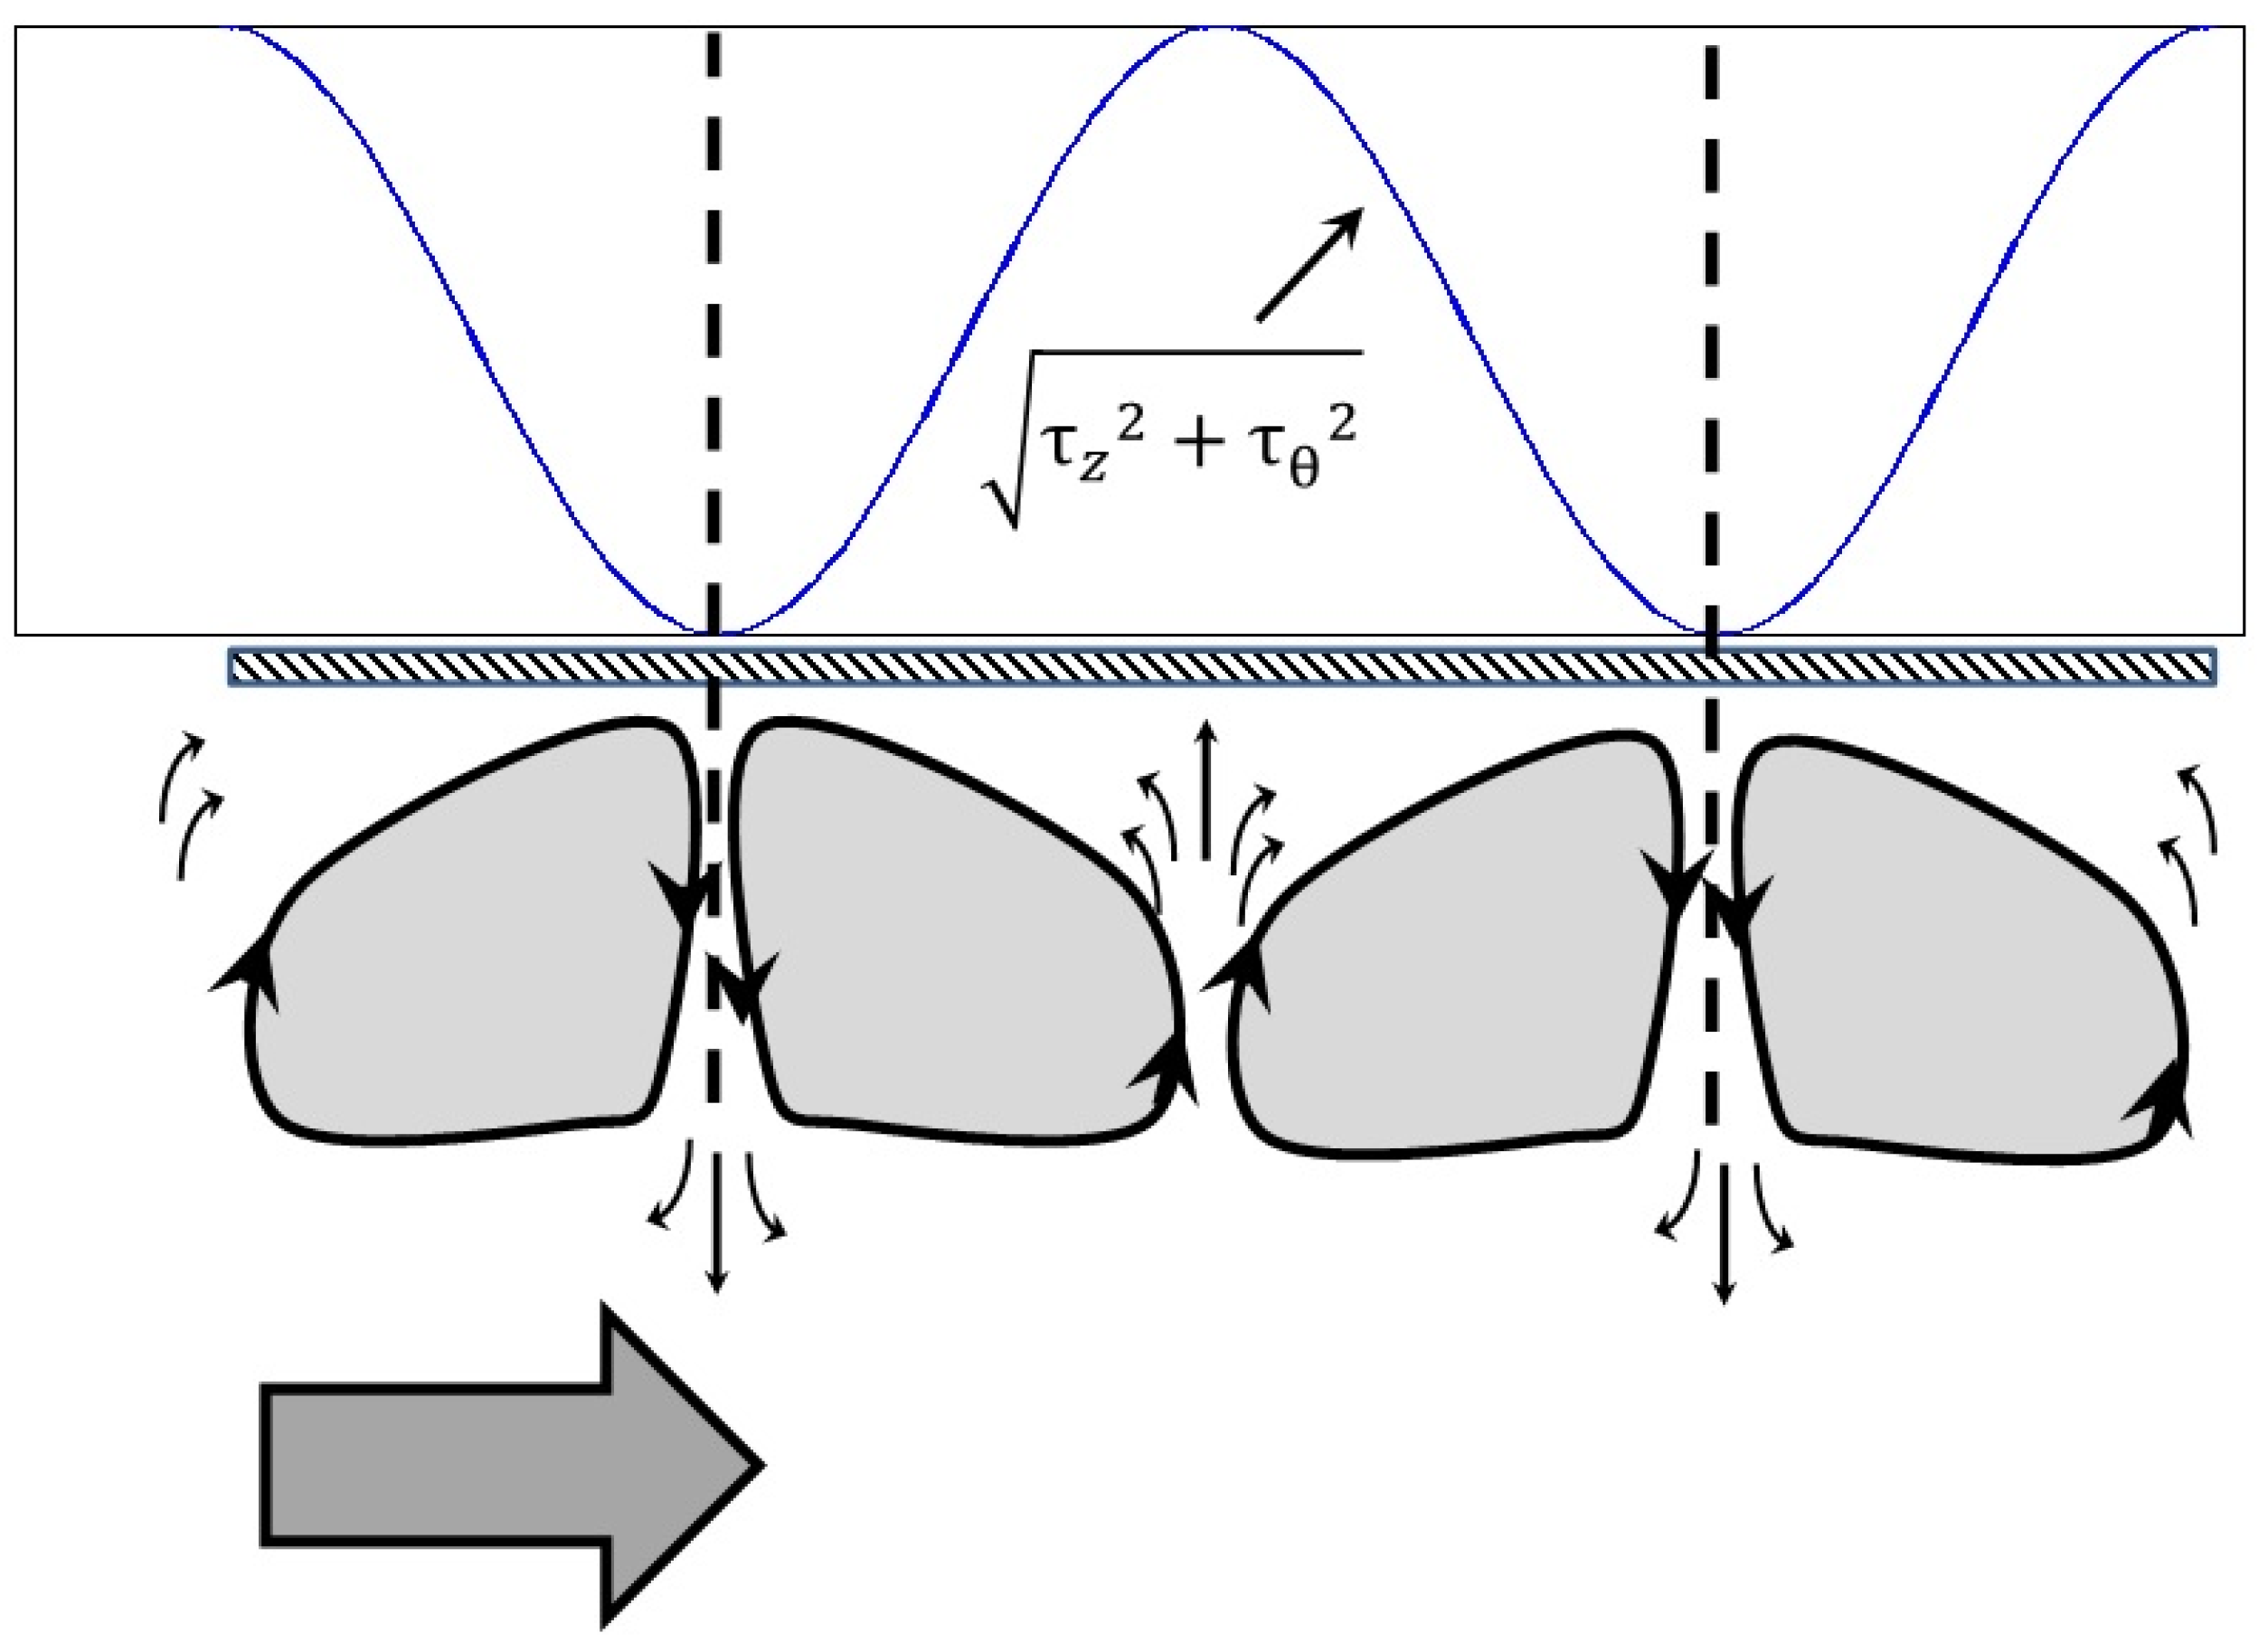
Temporal variations in the skin-friction coefficient C f are observed in the near-wall region. These intermittent fluctuations are explained by the presence of counter-rotating vortices in the boundary layer (Figure 15 and Figure 16). The magnitude of the skin-friction coefficient C f ( t ) increases with the rotation parameter N (Figure 17). This is inferred by the observation of a greater amount of energy exchanged between the counter-rotating vortices ejecting some of the fluid located in the boundary layer towards the bulk flow. However, this energy exchanged between the boundary layer and the core appears to decrease with increasing flow rate.
Figure 17 (left-hand) shows the skin-friction coefficient C f ( t ) for the study cases A, B, and C estimated as a function of time t between r * = 0 and r * = 0.03 for z * = 0.5 . The magnitude of the skin-friction coefficient is again larger for high values of N (case A) and decreases with increasing axial flow and decreasing parameter N (cases B and C). However, the wavelengths are reduced which can be explained by an increase in the turbulent kinetic energy transport of counter-rotating vortices in the near-wall region.
Finally, Figure 17 (right-hand) shows the average friction coefficient as a function of the rotation parameter N . Thus, a slight increase in the skin-friction coefficient C f ¯ is observed with parameter N , decreasing with the increase in the axial flow rate.

5. Conclusions

The present paper aims to characterize flow through a rotational heat recovery system used for heat transport in the frame of energy harvesting in the rotary kiln industry. The importance of better understanding the role of turbulent eddies in the regime of forced convection is a necessity at the pilot scale and the industrial scale. Solving unsteady 3D flow will help to improve process modelling in transient conditions. Consequently, the large-eddy simulation technique (LES OneEqEddy) with a no-slip condition was chosen to solve the flow in Couette–Taylor–Poiseuille flow geometry. Rigorous validation was first employed to compare this numerical method to the RANS method and the existing results of the literature in terms of mean velocity profiles and Reynolds stress tensors.
The LES was then applied to the case of interest, characterized by a shape factor and an aspect ratio respectively equal to 0.809 and 10. Three axial flow rates were investigated at a constant rotational velocity of the inner cylinder equal to 50 rpm, their dimensionless rotation parameters being equal to RA = 5.12, RB = 1.71, and RC = 0.85.
The main results are the following:
  • Streamwise components of the velocity exhibit a Blasius “type“ flow profile, while the spanwise components are characterized by three different regions; the inner boundary layer, the central region, and the external boundary layer.
  • The distribution of the Reynolds stress tensor is composed of two main normal components in the streamwise and the spanwise directions, the radial one being slightly less important. The crossed components are negligible compared to the normal ones. Whatever the components, the more elevated values are located in the near-wall location where the turbulence fluctuating rates are the more pronounced.
  • The fluctuating rate of the turbulence is much more important in the axial direction than the two other directions for the RB and RC cases, while in the RA case, its contribution is similar to the two others.
  • A wall model solving the overall boundary layer is used in the LES algorithm resulting in the logarithmic profiles. The wall law is verified in the viscous sublayer, while the profile in the transient region does not fit with the von Kármán constants established for pipe flow. The thickness of the boundary layer is reduced as the rotational velocity of the inner cylinder is raised compared to the axial flow rate.
  • Spectral analysis was applied to the fluctuating streamwise velocity in the near-wall region. Turbulence spectra are observed in the frequency domain with three distinct areas of production, inertia, and dissipative zones. The inertia zone is characterized by a strong anisotropy far from the −5/3 slope.
  • The turbulence scales were considered by using the Q-criterion and the vorticity in the near-wall region. The flow anisotropy is confirmed by the helix shape of the vortex flow structures. The angle of tilt of the structures is progressively reduced as the axial flow rates are raised at the inner and outer cylinders.
  • The skin-friction coefficients were assessed, showing a large amplitude imputed to the vortex flow organization. A comparison with Couette–Taylor flow results is provided, which explains the nature of the amplitude linked to the ejection of the fluid between the vortex cells toward the bulk region. The averaged and fluctuating values of the skin-friction are reduced as the axial flow rates increase; damping the counter-rotating vortex effect.
The present numerical results prove that the axial flow regime plays an important role in turbulence characteristics, which could explain the scarcity found in the Nusselt numbers correlations ( N u ~ R e e f f 0.6 < a < 0.8 ) in no-isothermal conditions for a forced convection regime. At low rotational parameters, the streamwise component of the turbulent kinetic energy modifies the momentum exchange in the near-wall region, and the axial flow rate disrupts the vortex generation and gives rise to eddies of different sizes.

Author Contributions

Conceptualization, M.P. and F.H.; methodology, F.H.; software, M.P.; validation, M.P., F.H. and O.L.C.; formal analysis, M.P.; investigation, M.P.; resources, B.C.; data curation, F.H.; writing—original draft preparation, M.P.; writing—review and editing, F.H.; visualization, M.P.; supervision, F.H. and O.L.C.; project administration, F.H.; funding acquisition, B.C. All authors have read and agreed to the published version of the manuscript.

Funding

This research received no external funding.

Data Availability Statement

Not applicable.

Conflicts of Interest

The authors declare no conflict of interest.

References

  1. Viklund, S.B.; Johansson, M.T. Technologies for utilization of industrial excess heat: Potentials for energy recovery and CO2 emission reduction. Energy Convers. Manag. 2014, 77, 369–379. [Google Scholar] [CrossRef]
  2. Kongtragool, B.; Wongwises, S. A review of solar-powered Stirling engines and low temperature differential Stirling engines. Renew. Sustain. Energy Rev. 2003, 7, 131–154. [Google Scholar] [CrossRef]
  3. Gonzales, A.; Riba, J.R.; Puig, R.; Navarro, P. Review of micro and small-scale technologies to produce electricity and heat from Mediterranean forest’ wood chips. Renew. Sustain. Energy Rev. 2015, 43, 143–155. [Google Scholar] [CrossRef]
  4. Nakhchi, M.E.; Hatami, M.; Rahmati, M. Experimental evaluation of performance intensification of double-pipe heat exchangers with rotary elliptical inserts. Chem. Eng. Process.-Process Intensif. 2021, 169, 108615. [Google Scholar] [CrossRef]
  5. Mungyeko Bisulandu, B.-J.R.; Huchet, F. Rotary kiln process: An overview of physical mechanisms, models and applications. Appl. Therm. Eng. 2022. Submitted. [Google Scholar]
  6. Swann, P.B.; Russel, H.; Jahn, I.H. Taylor-Couette-Poiseuille flow heat transfer in a high Taylor number test rig. J. Glob. Power Propuls. Soc. 2021, 5, 126–147. [Google Scholar] [CrossRef]
  7. Sögüt, Z.; Oktay, Z.; Karakoç, H. Mathematical modeling of heat recovery from a rotary kiln. Appl. Therm. Eng. 2010, 30, 817–825. [Google Scholar] [CrossRef]
  8. Engin, T.; Ari, V. Energy auditing and recovery for dry type cement rotary kiln systems-A case study. Energy Conserv. Manag. 2005, 46, 551–562. [Google Scholar] [CrossRef]
  9. Mujumdar, A.; Ranade, A. Modeling of Rotary Cement Kiln: Applications to Reduction in Energy Consumption. Ind. Eng. Chem. Res. 2006, 45, 2315–2330. [Google Scholar] [CrossRef]
  10. Caputo, A.C.; Pelegagge, P.M.; Salini, P. Performance modeling of radiant heat recovery exchangers for rotary kilns. Appl. Therm. Eng. 2011, 31, 2578–2589. [Google Scholar] [CrossRef]
  11. Mastorakos, E.; Massias, A.; Tsakiroglou, C.D.; Goussi, D.A.; Burganos, V.N.; Payatakes, A.C. CFD prediction for cement kilns including flame modelling heat transfer and clinker chemistry. Appl. Math. Model. 1999, 23, 55–76. [Google Scholar] [CrossRef]
  12. Huchet, F.; Piton, M.; Del Barrio, A.; Le Corre, O.; Cazacliu, B. Air-cooling heat exchanger applied to external rotary kiln wall in forced and natural draft. Energy Convers. Manag. 2017, 154, 517–525. [Google Scholar] [CrossRef]
  13. Leguen, L.; Huchet, F.; Dumoulin, J.; Baudru, Y.; Tamagny, P. Convective heat transfer analysis in aggregates rotary drum reactor. Appl. Therm. Eng. 2013, 54, 131–139. [Google Scholar] [CrossRef]
  14. Le Guen, L.; Huchet, F. Thermal imaging as a tool for process modelling: Application to a flight rotary kiln. Quant. InfraRed Thermogr. J. 2020, 17, 79–95. [Google Scholar] [CrossRef]
  15. Taylor, G.I. Stability of viscous liquid contained between two rotating cylinders. Philos. Trans. R. Soc. Lond. 1923, 223, 289–343. [Google Scholar]
  16. Nguyen, D.B.; Monico, R.O.; Chen, G. A Visualization Framework for Multi-scale Coherent Structures in Taylor-Couette Turbulence. IEEE Trans. Vis. Comput. Graph. 2021, 27, 902–912. [Google Scholar] [CrossRef] [PubMed]
  17. Razzak, A.; Akter, S.; Hannan, M.A. The influence of wavy vortex in reducing wall shear stress. IOP Conf. Ser. Mater. Sci. Eng. 2020, 788, 012093. [Google Scholar] [CrossRef]
  18. Mehrez, I.; Gheith, R.; Aloui, F.; Nasrallah, S.B. Theoretical and numerical study of Couette-Taylor flow with an axial flow using lattice Boltzmann method. Int. J. Numer. Meth. Fluids 2019, 90, 427–441. [Google Scholar] [CrossRef]
  19. Nourri, J.M.; Whitelaw, J.H. Flow of Newtonian and non-Newtonian fluids in a concentric annulus with rotation of inner cylinder. J. Fluid Eng. 1994, 116, 821–827. [Google Scholar] [CrossRef]
  20. Escudier, M.P.; Gouldson, I.W. Concentric annular flow with centerbody rotation of a Newtonian and a shear-thinning liquid. Int. J. Heat Fluid Flow 1995, 16, 156–162. [Google Scholar] [CrossRef]
  21. Naser, A. Prediction of Newtonian and non-Newtonian flow through concentric annulus with centerbody rotation. In Proceedings of the 1st International Conference on CFD in Mineral and Metal Processing and Power Generation, Melbourne, Australia, 13–15 December 1996. [Google Scholar]
  22. Poncet, S.; Haddadi, S.; Viazzo, S. Numerical modeling of fluid flow and heat transfer in a narrow Taylor-Couette-Poiseuille system. Int. J. Heat Fluid Flow 2011, 32, 128–144. [Google Scholar] [CrossRef]
  23. Chung, S.Y.; et Sung, H.J. Large-eddy simulation of turbulent flow in concentric annulus with rotation of an inner cylinder. Int. J. Heat Fluid Flow 2005, 26, 191–203. [Google Scholar] [CrossRef]
  24. Poncet, S.; Viazzo, S.; Oguic, R. Large eddy simulation of Taylor-Couette-Poiseuille flows in a narrow-gap system. Phys. Fluids 2014, 26, 105108. [Google Scholar] [CrossRef]
  25. Havlica, J.; Kramolis, D.; Huchet, F. A revisit of the electro-diffusional theory for wall shear stress measurements. Int. J. Heat Mass Transf. 2021, 165, 120610. [Google Scholar] [CrossRef]
  26. Chung, S.Y.; Rhee, G.H.; Sung, H.J. Direct numerical simulation of turbulent concentric annular pipe flow. Part. 1: Flow field. Int. J. Heat Fluid Flow 2002, 23, 426–440. [Google Scholar] [CrossRef]
  27. Hadziabdic, M.; Hanjalic, K.; Mullyadzhanov, R. LES of turbulent flow in a concentric annulus with rotating outer wall. Int. J. Heat Fluid Flow 2013, 43, 74–84. [Google Scholar] [CrossRef]
  28. Lee, M.J.; Kim, J.; Moin, P. Structure of turbulence at high shear rate. J. Fluid Mech. 1990, 216, 561–583. [Google Scholar] [CrossRef]
  29. Singh, H.; Suazo, C.A.; Liné, A. Log law of the wall revisited in Taylor-Couette flows at intermediate Reynolds numbers. Phys. Rev. E 2016, 94, 053120. [Google Scholar] [CrossRef]
  30. Belkadi, H.; Laghouati, Y.; Sobolik, V.; Oualli, H.; Bouabdallah, A. Axial Flow Effect on the Stability of Circular Couette Flow. J. Appl. Fluid Mech. 2022, 15, 271–281. [Google Scholar]
  31. Huchet, F.; Legentilhomme, P.; Legrand, J.; Montillet, A.; Comiti, J. Unsteady flows in milli- and microsystems: Analysis of wall shear rate fluctuations. Exp. Fluids 2011, 51, 597–610. [Google Scholar] [CrossRef]
  32. Kolmogorov, A.N. A refinement of previous hypotheses concerning the local structure of turbulence in a viscous incompressible fluid at high Reynolds number. J. Fluid Mech. 1962, 13, 82–85. [Google Scholar] [CrossRef]
  33. Hinze, J.O. Fundamentals of the hydrodynamic mechanism of splitting in dispersion processes. AIChE J. 1955, 1, 289–295. [Google Scholar] [CrossRef]
  34. Hunt, J.C.R.; Wray, A.A.; Moin, P. Eddies, Streams, and Convergence Zones in Turbulent Flows; Center for Turbulence Research Report CTR-S88; NASA: Washington, DC, USA, 1988; p. 193.
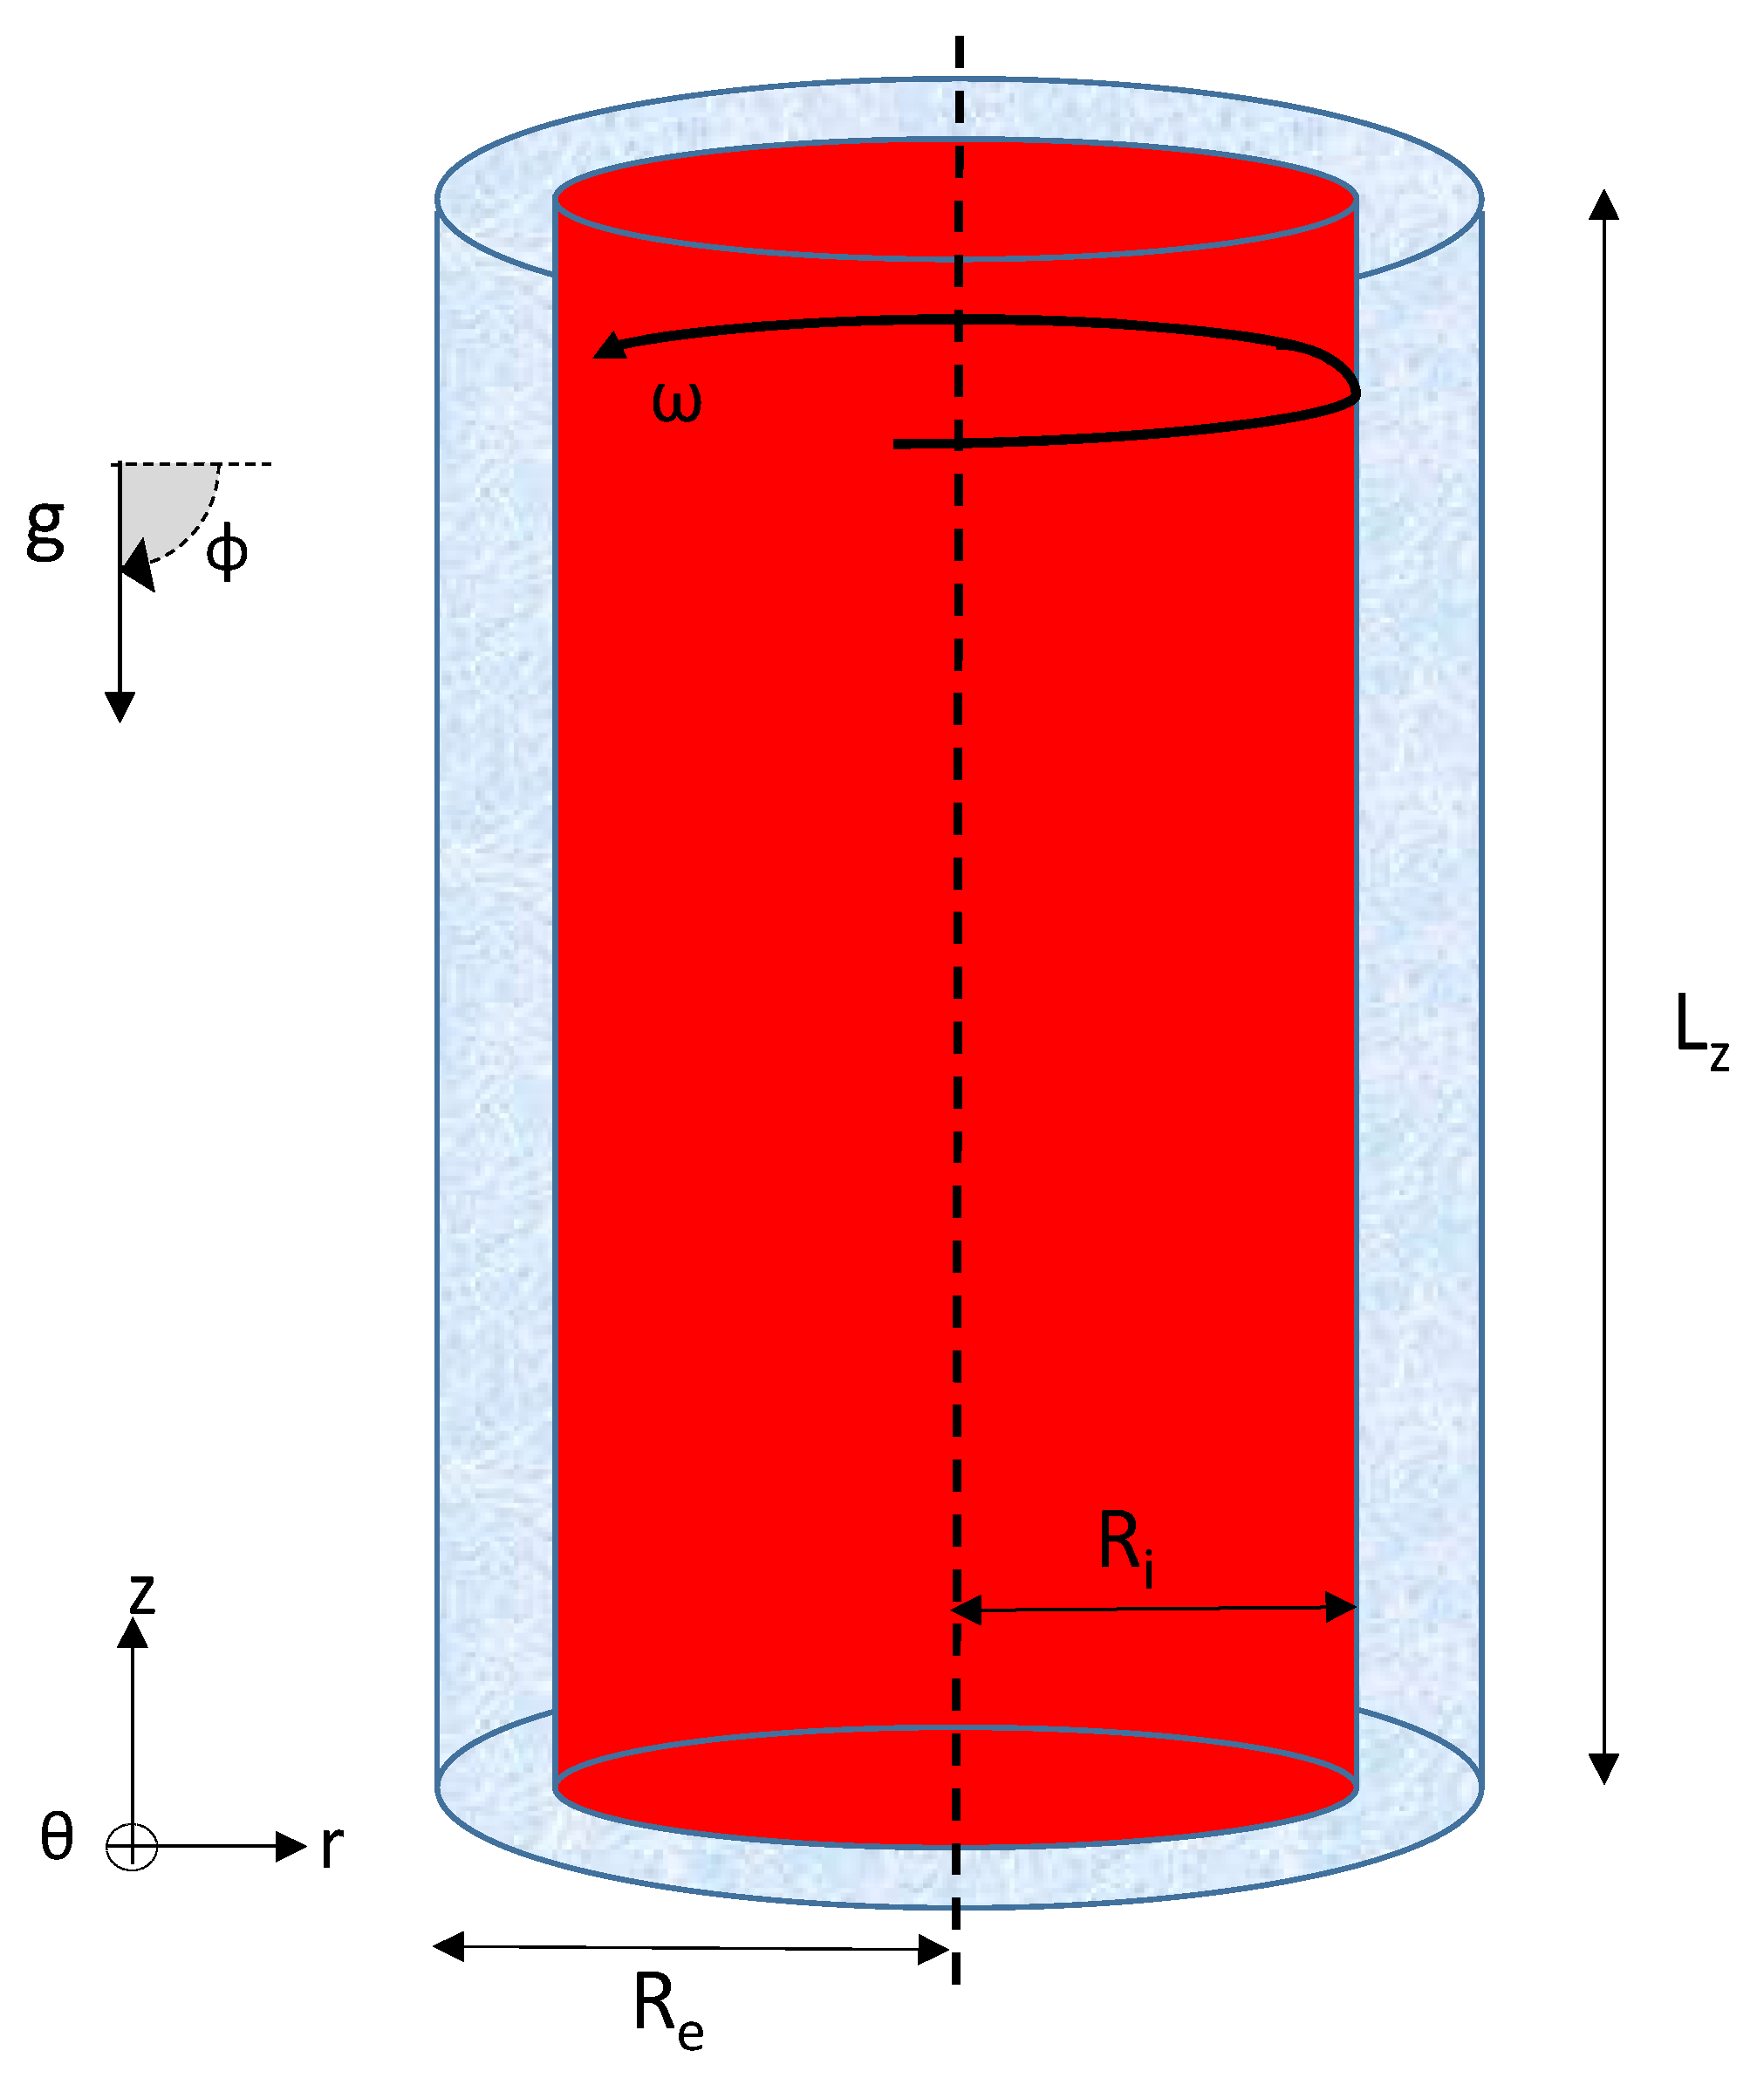
Figure 1. Position of the problem: two concentric cylindrical surfaces of internal and external radius, Ri and Re, and of length, Lz, are inclined at an angle φ with gravity. The rotation is exerted from the inner cylinder (drawn here) at an angular velocity, ω . The heat density flux can be imposed from any wall surface (the inner cylinder is chosen here) while the fluid motion is flowing into the gap: e = R e R i .
Energies 15 06792 g001
Figure 2. Geometry studied.
Energies 15 06792 g002
Figure 3. Steamwise and spanwise velocity profiles. Comparison between numerical models (RSM and LES) and the experimental measurements of Escudier and Gouldson (1995) [20].
Energies 15 06792 g003
Figure 4. Normalized Reynolds stress components R θ θ 0.5 * and R z z 0.5 * . Comparison between numerical models (RSM and LES) and the experiments of Escudier and Gouldson (1995) [20]. Adapted with permission from Ref. [20]. Copyright (1995), with permission from Elsevier.
Energies 15 06792 g004
Figure 5. Representation of the streamlines at the centre of the annular geometry for N = 5.12 case (A), N = 1.71 case (B), and N = 0.85 case (C).
Energies 15 06792 g005
Figure 6. Velocity fields of the streamwise (a) and spanwise (b) components in a cross-section of the annular geometry (the axis of rotation is on the right side of each figure and the flow moves from bottom to top).
Energies 15 06792 g006
Figure 7. Velocity fields of the spanwise component in a section of the annular geometry for N = 5.12 case (A), N = 1.71 case (B), and N = 0.85 case (C).
Energies 15 06792 g007
Figure 8. Velocity profiles of the streamwise (a) and spanwise (b) components obtained by the LES OneEqEddy model of OpenFOAM.
Energies 15 06792 g008
Figure 9. Position of the area of measurement in the studied geometry.
Energies 15 06792 g009
Figure 10. Distribution of the six components of the Reynolds stress tensor. The diagonal components of the dimensionless tensor R r r 1 / 2 * , R θ θ 1 / 2 * and R z z 1 / 2 * are represented by (a,c,e) and the cross components R r θ * , R r z * and R θ z * are represented by (b,d,f).
Energies 15 06792 g010aEnergies 15 06792 g010b
Figure 11. Radial distribution of the energy redistribution parameter obtained by the LES OneEqEddy model of OpenFOAM.
Energies 15 06792 g011
Figure 12. Logarithmic boundary layer profiles for the rotating wall.
Energies 15 06792 g012
Figure 13. Spectral analysis obtained for different values of N.
Energies 15 06792 g013
Figure 14. Iso-contours of the Q-criterion in the entire computational domain. (a,d) represent the iso-contours for case A, (b,e) for case B, and (c,f) for case C on the inner cylinder (ac), as well as on the outer cylinder (df). (a) Q = 200, (b) Q = 500, (c) Q = 1000.
Energies 15 06792 g014
Figure 15. Vorticity fields (the axis of rotation is on the right side of each figure and the flow moves from the bottom to the top) superimposed on the skin-friction coefficient C f for the study cases (AC), and a Couette–Taylor flow. Increasing the parameter N leads to an increase in the vorticity ω i j and a reduction in the coefficient C f .
Energies 15 06792 g015
Figure 16. Schematic representation of the counter-rotating vortices at the wall of the Taylor–Couette flow.
Energies 15 06792 g016
Figure 17. Skin-friction coefficient Cf versus time and its average value C f ¯ as function of the N parameter.
Energies 15 06792 g017
Table 1. Parameters studied in the numerical simulations for the different cases A, B, and C.
ABC
ω [tr.min−1] Energies 15 06792 i001 50 Energies 15 06792 i002
R e ω Energies 15 06792 i001 7488 Energies 15 06792 i002
Q [m3.h−1]31.494.3188.6
R e a 146243888776
N = R e ω / R e a 5.121.710.85
Table 2. Parameters of the numerical simulations used in LES.
[23][24]ABC
η0.500.890.8090.8090.809
N 0.21–0.861.49–6.715.121.710.85
Δ r + 0.27–0.350.47–0.861.231.241.24
R i Δ θ + 8.01–10.4094.76–44.4512.1312.1512.18
R e Δ θ + 13.86–15.8096.05–45.2715.2114.9815.01
Δ z + 9.93–22.9526.95–48.8214.9515.2815.32
N r , N θ , N z (65, 64, 128)(65, 144, 130)–(91, 128, 182)(123, 672, 200)(123, 672, 200)(123, 672, 200)
δ t (s)-- 4 × 10 4 4 × 10 4 3 × 10 4
C F L --0.200.210.27
Publisher’s Note: MDPI stays neutral with regard to jurisdictional claims in published maps and institutional affiliations.