Abstract
The long and tiring discussion of who are the best drivers, men or women, is not answered in this article. This article, though, sheds some light on the actual differences that can be seen in how men and women drive. In this study, GPS-recorded driving dynamics data from 123 drivers, 48 women and 75 men, are analysed and drivers are categorised as aggressive, normal or gentle. A total of 10% of the drivers was categorised as aggressive, with an even distribution between the genders. For the gentle drivers, 11% of the drivers, the men dominated. The driving style investigation was extended to utilise machine learning, confirming the results from statistical tools. As driving style highly impacts a vehicle’s fuel consumption, while switching over to battery electric vehicles it is important to investigate how the different driving styles impact battery utilisation. Two Li-ion battery cell types were tested utilising the same load cycle with three levels of current amplitude, to represent accelerations for the three drive categories. While one cell type was insensitive to the current amplitude, the highly energy-optimised cell proved to be sensitive to higher current amplitudes, corresponding to a more aggressive driving style. Thus, the amplitude of the dynamic current can for some cells be a factor that needs to be considered for lifetime predictions, while it can be neglected for other cells.
1. Introduction
Do women drive better than men? If only judging by the statistics, then yes. Men stand for the larger part of the traffic law violations, e.g., in Sweden, 87% of traffic violations during 2020 were conducted by men [1]. Men are also over-represented as drivers involved in traffic accidents [2]. An often heard argument for the skewed numbers is that men drive more and longer distances compared to females, which is true. However, when the number of traffic law violations are normalised over driven distance, men are still over-represented in traffic violations and accidents [3,4]. A British study showed that men have two times higher risk per driven km to be involved in a fatal accident than female drivers [5]. The main reason for this has been attributed to higher risk taking and overestimation of one’s driving skill reported for men and especially for younger men [6,7].
The statistics clearly show that there is a difference in the risks taken by men and women while driving, where men tend to drive faster than women [1,3,4,5,8,9]. It is also well established that driving style depends on the physical and emotional state of the driver. Driving style studies thus typically include characteristics such as the somatic, behavioural and emotional conditions of the driver as complements to the recorded drive data [10]. Aggressive driving is often attributed to be unsafe, including behaviour such as speeding, tailgating, cutting in front of another driver and then slowing down, running red lights, weaving in and out of traffic, changing lanes without signalling and blocking cars attempting to pass or change lanes [11]. When only GPS-driving-dynamic data are available, several of the indications of an aggressive driving style cannot be used. The usable entities are speed, acceleration, deceleration, road type and their distribution in time and given journey. Eboli et al. [11] used GPS-logged acceleration and speed data to classify safe and unsafe driving based on the friction coefficients of the car tires on dry road pavement.
Driving style is not only linked to safety; it also impacts fuel consumption [12]. High speeds and high accelerations result in higher fuel consumption. Other aspects that affect fuel consumption are the drive-train efficiency, vehicle weight and engine [13,14]. A calmer driving style is less energy- and power-demanding [10,12]. As battery electric vehicles (BEVs) are becoming more and more popular, the impact of different driver behaviour and styles on electric vehicle (EV) has also become of high interest. Several studies have compared moderate versus aggressive driver behaviour and have shown that moderate driving behaviour can reduce the energy consumption by as much as ∼30% [15,16]. An aggressive driving style results in higher energy and power consumption, i.e., higher average discharge current and larger current fluctuations due to higher average vehicle speed and higher acceleration and deceleration.
Energy consumption is not the only aspect that is important when considering BEVs; the ageing of the battery pack is also highly dependent on the usage. It is well known that the type of load profile heavily impacts Li-ion battery (LIB) ageing and, thus, the cycle lifetime. The main aspects that have proven to accelerate ageing are high state of charge (SOC), large depth of discharge (DOD), high currents and high ambient temperature [17,18,19,20,21,22]. However, there have only been a few ageing studies conducted on how different current frequencies and pulse amplitudes impact battery ageing [23,24,25,26] and even fewer related to how dynamic drive behaviour impacts LIB ageing [27,28].
The purpose of this article is to present results from a study investigating different driver styles based on GPS recordings, to answer how gender influences the selection of vehicle and driver style and how this impacts battery degradation. The drivers are categorised based on speeding, acceleration, deceleration and relative positive acceleration (RPA). Driving style and how this relates to gender is investigated by using GPS-recorded drive pattern data: acceleration, road type and speed. This research is conducted using low-dimensional statistical analysis as well as machine learning (ML). Subsequently, the driving style analysis is used to experimentally investigate how driving style impacts battery degradation and how different levels of acceleration and deceleration (regenerative breaking) impact battery ageing.
2. Materials and Methods
This work includes two studies, a driving style analysis based on GPS-recorded driving dynamics data and lifetime testing of two different 18650 Li-ion battery cells. The driving style analysis included gender aspects where the gender of the driver was determined from questionnaire answers; all participants took part in a questionnaire before the recording of the GPS data started. The cells were tested with driving cycles developed to represent three different driving styles. The development of the driving cycles that represent the different driving styles was based on the driving data analysis. Additionally, a support vector machine (SVM)-based ML approach was scripted to discern driver behaviour using the dynamics of the driving.
2.1. Driving Data Analysis
The data analysis is based on GPS-recorded driving dynamics data, collected during 2010–2012, in the Swedish car movement data project [29]. The project recorded data from 700 vehicles and 123 of these vehicles were owned by single households who reported themselves belonging to one of the binary genders in the questionnaire sent out to the participants before the start of the data recording [29]. The selection of participants was randomised; vehicles with a home address in the region of Västra Götaland were randomly selected from the Swedish vehicle registry. Participation was voluntary and a GPS tracker was sent to be installed by the driver, if they accepted to participate and answer the accompanying questionnaire. A thorough description of the GPS equipment and data acquisition procedure can be found in [29]. All vehicles in this study were of internal combustion engine (ICE) type.
2.1.1. Descriptive Statistics of the Driving Data
When analysing and characterising the driving patterns, level measures, distribution measures and oscillatory measures were used. The level measures used were maximum, average and standard deviation of speed (v), acceleration (a) and deceleration (r). The distribution measures were percentage of time in different speed intervals, road types and speeding. The oscillation measure used was the RPA. Important parameters for fuel consumption were found to be acceleration with high power demand, speed oscillation, extreme acceleration/deceleration and number of stops [12].
2.1.2. Inferential Statistics of the Driving Data
In addition to the descriptive statistical analysis of the driving style, a SVM-based algorithm from SKlearn [30] was used to further evaluate gendered driving style differences. The algorithm was trained with a gender-balanced training data set consisting of 14 randomly selected drivers, 7 females and 7 males.
In the proposed approach, the algorithm first chooses a feature randomly, quantifying its maximum and minimum values. By partitioning randomly the selected feature between these extremities, the algorithm subsequently tries to isolate an observation by testing several splitting schemes while assigning an integer value for the number of partitions. The overall structure of the partitioning is thus a forest of tree structures with branching into smaller partitions. The registered number of partitions needed to isolate a sample is the travelled distance from the root to the leaves of the recursive tree structure. After averaging this distance for each tree over the complete forest of partitions, the algorithm reaches a measure of anomalies. The decision function depends on the average distance to the investigated samples and the samples reached by the shortest paths are predicted as outliers [30]. As the approach does presume a Gaussian behaviour, it appropriately allows for a more tailored analysis of the data at hand.
2.2. Battery Lifetime Testing
The battery lifetime testing was conducted on two different 18650 cylindrical cells with Lithium Nickel Manganese Cobalt oxide (NMC) positive electrodes. The LG INR18650 MJ1 (MJ1) highly energy-optimised NMC811-Graphite with 3.5 wt% Si (3.5 Ah, 240 Wh/kg) [31,32] and the Samsung ICR18650-22P (22P) NMC111-Graphite (2.15 Ah, 175 Wh/kg) [33,34]. Both cell types have 0.2 C in standard discharge current and a maximum of 10 A in discharge current. The standard charge current is 0.5 C. The voltage interval for the MJ1 is 2.5–4.2 V and for 22P it is 2.75–4.2 V.
2.2.1. Test Setup
The cells were tested using the Neware BTS4000 system, 5V20A and 5V6A testers with CA-4008 temperature thermistor auxiliary equipment in room temperature (Figure 1). The 5V6A testers have inbuilt cell-holders, for the 5V20A tester cell-holders, shown in Figure 1, were used to ensure good connections.
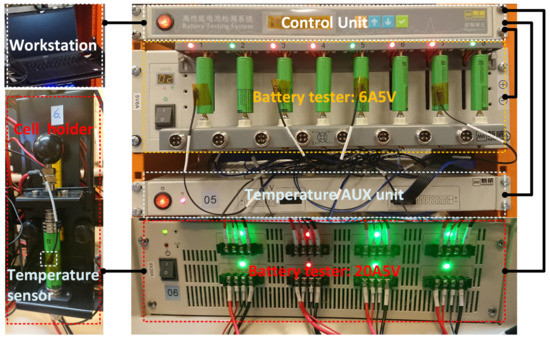
Figure 1.
Test setup used for the lifetime testing of the MJ1 and 22P cells.
2.2.2. Load Cycles
The tests were conducted in two separate groups, one utilising constant current (CC) cycles and one using dynamic current profiles. This was done in order to separate the dynamic and CC impact on cell ageing. All tests had the same charge rate of 0.5 C with CC and constant voltage (CV) for both the MJ1 and 22P cells. The synthetic CC load cycles were only tested for the MJ1 cells. The discharge was conducted at three current levels, 0.2 C, 0.4 C and 0.6 C.
The dynamic current profile was derived from an aggressive drive pattern containing 50% urban ( km/h), 30% rural ( km/h) and 20% highway (>90 km/h) driving time. To be able to analyse the contribution from acceleration and deceleration from different driving styles, the selected driving pattern was adjusted to gentle and normal driving styles. Different driving styles result in different speeds and accelerations/decelerations of a vehicle, which for a BEV results in different current drawn from the vehicle battery. Higher vehicle speed draws a higher average current from the battery and high accelerations result in high peak current. To be able to separate the transient behaviour, acceleration and deceleration, some calculations on and adjustments of the data were needed. The current was calculated by using a simple force balance, summarising all forces acting on the vehicle,
where the resistive force is composed of aerodynamic drag, rolling resistance and grading force,
To study the difference in transient behaviour, the same speed profile was assumed for all cases. This resulted in the same resistive forces in all cases, leaving the only difference to be the size of . After these simplifications, the current was calculated from
and scaled to meet the maximum short time discharge current of 10 A for the test cells. The standard charge level for the MJ1 (0.5 C, 1.7 A) was used as a limit for regenerative breaking, thus limiting all charge pulses to 1.7 A.
The power levels required for normal and gentle drivers’ accelerations and decelerations are lower compared to those of the accelerations and decelerations recorded for the aggressive drivers. Thus, the aggressive drivers’ accelerations needed to be scaled to represent the accelerations for normal and gentle drivers. Six representative drivers, two from each category, were used, where the mean of the maximum acceleration for each trip was used to calculate the scaling factors. Based on these, the normal drivers’ acceleration was 85% of the aggressive drivers’ acceleration. The gentle drivers’ acceleration was found to be merely 32% of the aggressive drivers’ acceleration. The power required for the acceleration was scaled according to these values, and the maximum discharge current for the normal driver was 8.6 A and for the gentle driver 3.7 A. Thus, the reader should note that it is not possible to achieve the speed profile in Figure 2a using the current profiles for normal and gentle driving (Figure 2b).
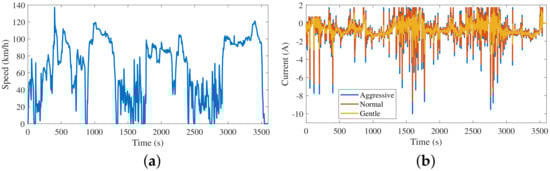
Figure 2.
(a) The speed profile for the driving cycles used for the lifetime testing. (b) The calculated current after scaling the acceleration according to the analysis of the different driving styles.
However, in this study it was the impact of the transient current that was investigated and as the same speed profile was used for all drivers the mean discharge current would be similar. Thus, the impact of acceleration and deceleration could be studied. As there was a need to limit the regenerative charge pulses, which is often the case in real applications, the mean discharge current was slightly larger for the aggressive and normal case. For the MJ1, the mean discharge current corresponded to 0.2 C for the gentle case, 0.205 C for the normal case and 0.208 C for the aggressive case. For the 22P, the mean discharge current corresponded to 0.332 C, 0.340 C and 0.345 C, respectively.
3. Results
3.1. Driving Data Analysis and Gender Aspects
To be able to conduct an investigation into the gender-related characteristics of driving, the gender of the driver needed to be known. The gender of the driver could only be defined for single households. This study was thus conducted on 123 vehicles registered to single households, 75 male and 48 female drivers. A deeper study was made into the outlier driver behaviour, especially the gentle and aggressive drivers, studying the difference in speed distribution, acceleration, inclination to follow speed limits and time driven on different road types.
3.1.1. Vehicle Selection
Based on the questionnaire sent out to the drivers with the invitation to participate in the project, additional information and user perspectives could be recorded. The drivers were asked to estimate the amount of the vehicle’s yearly distance driven by them. While 91% of the male drivers estimated that they drove 100% of the yearly distance themselves, only 81% of the female drivers gave the same estimation. Hence, the females were more prone to lend their cars compared to the males.
Studying the choice of vehicles, additional clear trends could be seen. In 2010, diesel vehicles were still marketed as an environmentally friendly choice. Among the 123 vehicles, most of the men owned diesel vehicles, 67%. However, for the women, 94% drove a diesel vehicle, while only 6% drove a petrol vehicle. This indicates that women were considering more environmentally friendly vehicles to a larger extent than their male peers. This is supported by several studies showing women to have a greater interest in sustainability and sustainable choices in their vehicles [35,36,37].
An additional aspect in line with women considering more environmentally friendly vehicles is the size of the vehicle, especially considering the weight and power. In general, a car with a low power-to-weight ratio (PWR) is more environmentally friendly, as its motor will work in, or closer to, its optimum operation window for a larger part of the driven time. A low curb weight in combination with a small motor will in most cases result in a car with lower fuel consumption [14].
Figure 3 shows the PWR distribution normalised over the number of vehicles in each gender group. The most common PWR range was 63–71 W/kg, with 35% of the male- and 33% of the female-owned vehicles. However, the majority of female-owned cars had a PWR lower than this and the group had a mean value of 59 W/kg, compared to 68 W/kg for the male-owned vehicles. This is also confirmed when looking at the choice of vehicle model: more men than women owned performance and high-end vehicle models.
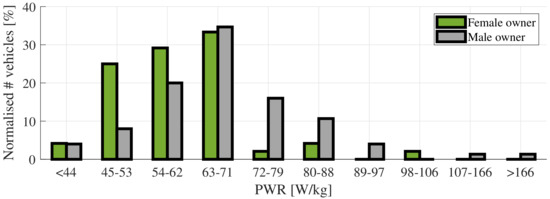
Figure 3.
Distribution of vehicle PWR for the vehicles owned by women and men.
3.1.2. Trips and Distance
The number of trips and driven distance recorded for each vehicle varied widely. However, the difference on individual level was equalised on the group level. The overall difference in driven distance followed the number of participants for each gender group, where 39% were women and 61% were men, i.e., the women drove 39% of the recorded total distance and the men 61%.
3.1.3. Vehicle Speed
Speed and time distributions were generated for the two genders by separating data into male and female drivers (Figure 4a). The distributions show that the male drivers’ speed distribution is skewed to higher speeds compared to the female drivers’. For the women, the distribution peaks at 70 km/h, while for the men, the peak is at 80 km/h.
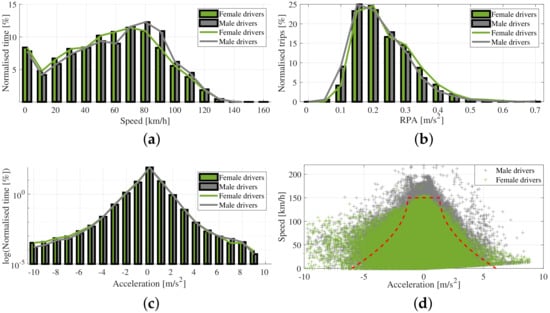
Figure 4.
Distribution of (a) time driven at different speeds and (b) RPA calculated for each trip by women and men. (c) Distribution of time driven with different acceleration and deceleration for the vehicles. (d) Recorded speed and corresponding acceleration/deceleration for the drivers compared to the unsafe driving criteria for aggressive acceleration/deceleration (red dashed line).
3.1.4. Relative Positive Acceleration
The RPA was used as an indication for accelerations that demanded high power. It is a measure of a drive pattern’s level of acceleration with strong power demand. The RPA factor is high for drive patterns with a great amount of high power demand accelerations and low for patterns with fewer and less power-demanding sequences. The RPA is the integration of the vehicle speed and positive acceleration over the total driven distance [12]:
The RPA value was calculated for each trip and the distribution of the RPA for the normalised number of trips is shown in Figure 4b. As can be seen, there is not a big difference in the RPA distributions for the two gender groups. However, the distribution for the women is slightly higher compared to the male drivers.
3.1.5. Acceleration and Deceleration
For the acceleration and deceleration, the time distributions for normalised time are fairly similar between men and women (Figure 4c). However, as could be seen in the RPA, the mean acceleration for female drivers was 0.336 m/s2, while it was slightly lower, 0.322 m/s2, for the men. In addition, for the deceleration the same trend is visible: women had a mean of −0.368 m/s2 and men −0.336 m/s2.
Defining aggressive acceleration and deceleration can be considered subjective, as it is related to what is considered to be normal acceleration and deceleration. This is also related to the speed of the vehicle. The definition of aggressive acceleration and deceleration used for this work is based on Eboli et al.’s [11] definition of unsafe driving. The criterion to evaluate safe or unsafe driving as a function of speed is based on the maximum friction value in the longitudinal direction between the road surface and tire for dry pavement conditions for rural roads:
By applying the definitions of safe and unsafe acceleration, the same trend seen in mean acceleration and deceleration can also be seen here. More female drivers triggered the criterion than men. Even so, the men that were triggering the aggressive acceleration/deceleration criteria were doing it 1.4 times more often, compared to the female drivers. In addition, when looking at the acceleration at different speeds, Figure 4d, the male drivers not only drove at higher speeds, but they also had higher accelerations at higher speeds compared to the female drivers. Of the 20 drivers most often triggering the aggressive acceleration and deceleration criteria, 14 were male drivers and six were female drivers. Interestingly, the same trend can be seen when looking at the 20 drivers with lowest numbers of times triggering the criteria (or not at al), where five were females and 15 were male drivers.
3.1.6. Inclination to Follow Speed Limits
Two investigations were conducted to evaluate the time driven at different road types. Based on the GPS position, the road type and speed limit of the road were extracted from road grid data from the Swedish Transport Administration [38]. The first investigation only took into account the actual vehicle speed and evaluated the percentage of time driven below 50 km/h (urban), in 50–90 km/h (rural) and above 90 km/h (highway). The second investigation instead considered the road classification and speed limit for the road. Fascinatingly, the investigations resulted in two rather different time distributions.
In Figure 5a, the result from the first investigation, percentage of time driven at different speeds shows that female drivers spent more time at lower speeds compared to the male drivers, as shown in the speed distribution analysis. The female drivers spent more than half of the driven time at speeds lower than 50 km/h. The male drivers instead spent more than half of the driving time at speeds above 50 km/h. When investigating time distribution based on the road speed limit, Figure 5b, the difference in the percentage of time driven in the different road categories is however minor.
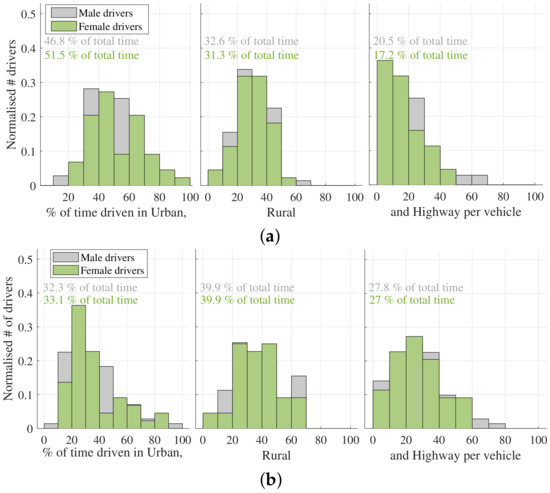
Figure 5.
Percentage of time driven on urban, rural and highway road type based on (a) vehicle speed and (b) road speed limit.
Based on road speed limit, Figure 5b, a third of the time was spent driving on roads with speeds less than 50 km/h and around 27% of the time on highway, for both men and women. However, as seen in Figure 5a the vehicle speed data did not capture this. The discrepancy is larger for the female drivers, where 18% extra time was spent at speeds below 50 km/h.
To further evaluate the inclination to follow the speed limits, the speed breach and time spent speed breaching was investigated. In Table 1, a compilation of six different speed breach levels are summarised with the resulting percentage of drivers in each gender group violating the different speed breach levels (one driver corresponds to women 2.08% and to men 1.33%).

Table 1.
Comparison of drivers speeding and the time spent speeding at different levels of speed breach in each gender group in percentage.
The results show that in this study, a large part of the drivers violated the speed limit on at least one occasion. A total of 83% of the women and 75% of the men mildly over-sped (more than 5 km/h over the speed limit) at least 5% of the driven time. However, the percentage of women speeding reduced notably with increasing percentages of time speed breaching. Additionally, when speeding, the men did it for a larger percentage of the time driven and at higher speeding levels. Looking at drivers who were speed breaching more than 10 km/h, the men are over-represented. Interestingly, both gender groups had a few drivers that stood out as more extreme speeders.
Looking at drivers with no or less than 5% driving time with speed breaching, Table 2, we find that the remainder of the drivers, 25% of the men and 17% women, fulfil this criterion. The percentage of men with very few occasions of speed breach was consistently higher than the percentage of women drivers. Drivers with less than 1% of time speeding or never speeding consist of five men and only one woman.
Table 2.
Comparison of the drivers with least time spent speeding, in percentage for each gender group.
3.1.7. Classification of Driver Style
By combining the above criteria, speeding, acceleration, deceleration and RPA, the drivers were categorised into aggressive, normal or gentle drivers. An aggressive driver was assumed to have a higher measure than the mean value plus the standard deviation, and a gentle driver was assumed to have a measure lower than the mean value minus the standard deviation. All criteria were then weighted together, for an overall evaluation of the driver. Again, the mean and standard deviation were used as criteria for aggressive and gentle drivers. No driver was considered aggressive in all four criteria; however, five drivers were considered gentle drivers in all four criteria: four men and one woman. In total, of the 14 drivers considered gentle drivers, only three were female drivers, which was not expected beforehand. For the aggressive drivers, the distribution between the genders was more even, with 13 aggressive drivers, five women and eight men, corresponding to 10% of the drivers for each gender group.
3.1.8. Inferential Quantification of Driving Style by ML
A further investigation of aggressive and gentle driving styles was conducted using ML, an isolated forest algorithm from the SVM family of classifiers [30]. The SVM was run on high-performance computing (HPC) nodes with limited computational resources. Due to this, the data set had to be reduced to a sub-group from the 123 drivers. As the initial data set was unbalanced in the disadvantage in the number of female drivers, care was taken in the choice of the ML subgroup on which the Isolation Forest outlier analysis was applied. Accordingly, an arbitrarily chosen subset of 14 drivers with a 50/50 balanced gender distribution was used. The unsafe driving criteria used in the descriptive statistical analysis, Equations (5) and (6), were used for the ML algorithm. The ML algorithm classified 72.8% of the outlier behaviour as male drivers and the remainder outliers as female drivers.
A visualisation of the results of the algorithm can be seen in Figure 6. For pedagogical reasons, the outlier plot is in a two-dimensional space and the total dimension of the data set is a five-feature hyperplane. The reported ML approach is intrinsically scalable to higher-dimensional data. The contour background is generated by the algorithm and gives an estimate of the driving style: the lighter the colour, the gentler the driving style is; the darker the colour, the more aggressive the driving style is. As can be seen in Figure 6, the zones identified by the SVM algorithm managed well to capture the driving style. The yellow circles represent a registered driving point, to the left an aggressive and to the right a gentle driving style.
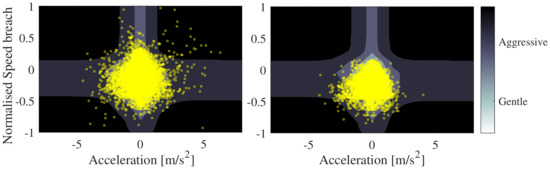
Figure 6.
Isolation forest quantification for driving style: the darker the colour of the contour, the more aggressive the driving style is. The yellow circles represent a registered driving point for two different drivers, to the left an aggressive and to the right a gentle.
3.2. Battery Cell Lifetime
The lifetime testing was separated into two test batches, where all tests were charged with 0.5 C CC-CV. The first group tested with CC discharge cycles from 0.2 C to 0.6 C, representing different power demanding driving cycles, was only applied to the MJ1 cells. For the CC tests, the expected results of increased ageing for increased C-rate were observed (Figure 7). However, the large spread between the duplicate cells was unexpected. It is not uncommon to see a small spread in performance for mass-produced cells; however, the spread seen for the MJ1 cell was surprisingly large. Spread in cell performance has been reported by other researchers [39,40,41,42]. The large spread made the analysis more difficult; however, for tests with increasing C-rate, the expected increase in cell ageing could be seen.
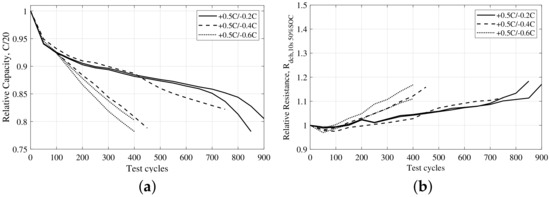
Figure 7.
(a) C/10 capacity degradation and (b) resistance increase for the MJ1 cells tested with CC with three different C-rates.
In the second test batch, with the dynamic current profiles described in Section 2.2.2, both MJ1 and 22P cells were included. This test was designed to investigate how the transient current amplitude, due to acceleration and deceleration, impact the battery ageing. Again, MJ1 cells displayed a large spread between duplicates (Figure 8). Still, cells tested with the aggressive driving cycle showed a larger loss of capacity than those with the normal and gentle driving cycles. Surprisingly, cells tested with the gentle driving cycle had a larger resistance increase (Figure 8b). For 22P cells, much more uniform ageing behaviour between the duplicates was seen. Contrary to MJ1 cells, there could not be seen any difference in the ageing trends due to the transient current amplitude (Figure 8a). If any, the normal driver case introduced a marginal resistance increase; however, the difference was too small to draw any conclusions from.
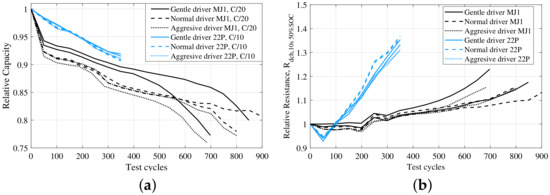
Figure 8.
(a) C/10 capacity degradation and (b) resistance increase for the two cell types when tested with the driving cycles corresponding to the three different driving styles.
4. Discussion
This study is based on a rather small number of vehicles from single households where the gender of the driver could be determined. The analysed data are GPS-recorded driver data and questionnaire replies from the drivers as well as vehicle brand, type and specification. Of the 123 drivers, 75 were men and 48 were women. The unbalanced number of drivers introduces an error that has not been calculated. Despite the unbalanced number of men and women in this study, the two groups drove almost the same amount of time on the different road types, 33% in urban, 40% in rural and 27% in highway. Thus, the road type distribution is surprisingly similar for the two groups. When it comes to vehicle selection, there was a clear difference between the gender groups. The findings in this study support previous studies which concluded that women tend to select more environmentally friendly vehicles of smaller size, with lower power capabilities, i.e., low PWR.
When looking at the recorded speed, similarities could be seen. Speeds were often lower than the allowed speed limit, very likely due to traffic congestion during rush hours. However, there are some interesting differences between the two groups. Women spent more than 50% of the time at speeds <50 km/h, 18% more than expected based on road type, while men spent 47% of the time at speeds <50 km/h, only 14% more than expected based on road type. Men also had a 10 km/h higher shift in the speed distribution. The higher speeds recorded for men were also reflected in speed limit violations. Men were speeding for longer parts of the driven time and at higher levels of speed breach compared to women. However, more than 80% of the women and 75% of the men were speeding at some point.
For the RPA, women had slightly higher values compared to men. However, when looking at acceleration, men were over-represented as drivers with aggressive or unsafe acceleration, 20% compared to only 6% for women. Interestingly, for deceleration, the trend was reversed. One reason for lower peak acceleration values for women could be the power capability of their vehicles. Women had to a larger extent vehicles with lower PWR and thus vehicles with limited acceleration capability.
Combining the four criteria, 10% of the drivers were labelled aggressive drivers with 38% women and 62% men. Despite the high speed breach levels and accelerations seen for several of the men, normalising for each gender group, the contribution of aggressive drivers was even from both gender groups. An additional fascinating result was that out of the gentle drivers, 11% of the drivers, only three were women. The analysis has shown that there is a larger spread in driver style within the male gender group, while the female drivers cluster as a group which exhibits less variance in driving dynamics. Thus, for this set of drivers, men could be concluded to be the gentler drivers but also the most aggressive.
For the inferential quantification, the computational resources were limited. The SVM was applied to a sub-group of 14 drivers total. However, the initial data set was unbalanced, while the ML subgroup for the isolation forest outlier analysis was applied to an arbitrarily chosen subset of drivers with a 50/50 balanced gender distribution. Despite the limited number of drivers, the inferential statistical analysis results conform with the initial descriptive statistical analysis results. Drivers which were outliers comprised to 70% by individuals who classed themselves as the gender man. The introduction of ML therefore enables automatised classification with higher numbers of features. The reported proof of concept using real driving data enables the introduction of more tailored products and supports sustainable resource usage.
Driver style is closely correlated with fuel consumption. A high RPA indicates high fuel use, and similarly does speed oscillations, high acceleration/deceleration and number of stops. Women had higher RPA and larger decelerations, while men had the more extreme accelerations and higher speeds for longer times.
In a BEV, energy and power are provided from the battery. It is well established that higher C-rates increase battery degradation, which was also confirmed for the MJ1 cells. An aggressive driving style, defined by higher speed and high acceleration, is more energy- and power-demanding and will result in higher average discharge current and peak transient currents. The experimental results on the cell level was inconclusive, yet gave some important indications. The MJ1 is a highly energy-optimised cell, including small amounts of silicon in the graphite electrode; for this cell, the amplitude of the transient current seems to be important. However, for the 22P, this seems not to impact ageing negatively.
An important note is that the 22P has been on the market for several years and has a well-established chemistry, while the MJ1 is one of the first highly energy-optimised cells on the market with silicon containing negative electrodes. Thus, silicon-containing electrodes are still in the early development stages. This can also be seen in the larger spread of the duplicate cells. Still, the results from this small study show that the current amplitude of the transient current can for some cells impact the ageing noticeably.
5. Conclusions
So, do women drive better than men? This study cannot answer that; however, it has concluded that there is a difference between how women and men drive. The average female driver drives at lower speeds compared to the average male driver. When separating the two gender groups’ drive behaviours, it can be seen that the male drivers have a much broader driver distribution compared to female drivers, which are a more homogeneous group. Hence, the most aggressive but also the gentlest drivers can be found among the men.
There is a large number of male drivers that drive at higher speeds, use higher accelerations and spend more time speeding and at higher speed limit breach. However, a majority of the female drivers violate the speed limit as well, though with a lower speed limit breach. Interestingly, the average female driver also tends to have higher acceleration and deceleration compared to the average male driver. This may be attributed to the gearing ratio practices by original equipment manufacturer, applied for smaller PWR vehicles.
Another clear trend seen is that men and women choose different types of vehicles. Women tend to select smaller and lighter vehicles with lower PWR compared to men. Performance and high-end vehicle models were more common among the vehicles owned by men.
For electric vehicles, the difference in driving style impacts battery ageing. The main impact for battery ageing will be from average discharge current. The amplitude of the dynamic part of the current only influences the ageing to a smaller extent. However, different battery chemistries show different levels of sensitivity to the amplitude of the dynamic current. The highly energy-optimised cell, MJ1, proved to lose more capacity for higher amplitudes of the dynamic current, though the lower amplitude generated a larger resistance increase. In contradiction, the P22 cell showed no sensitivity to the amplitude of the dynamic current. Thus, the amplitude of the dynamic current can for some cells be a factor that needs to be considered for lifetime predictions, while it can be neglected for other cells.
Author Contributions
Conceptualization, E.W. and T.T.; methodology, E.W. and R.O.; software, E.W., S.F. and R.O.; validation, E.W. and R.O.; formal analysis, E.W. and R.O.; investigation, E.W.; resources, T.T.; data curation, E.W. and R.O.; writing—original draft preparation, E.W.; writing—review and editing, E.W., T.T., S.F. and R.O.; visualization, E.W.; project administration, E.W.; funding acquisition, E.W., T.T. and S.F. All authors have read and agreed to the published version of the manuscript.
Funding
This research was funded by GENIE|Gender Initiative for Excellence, Chalmers.
Institutional Review Board Statement
Not applicable.
Informed Consent Statement
Informed consent was obtained from all subjects involved in the study.
Data Availability Statement
Not applicable.
Acknowledgments
The authors are grateful for the computational resources provided by Volvo Car Corporation.
Conflicts of Interest
The authors declare no conflict of interest.
Abbreviations
The following abbreviations are used in this manuscript:
| EV | electric vehicle |
| BEV | battery electric vehicle |
| LIB | lithium-ion battery |
| SOC | state of charge |
| DOD | depth of discharge |
| RPA | relative positive acceleration |
| GPS | Global Positioning System |
| ML | machine learning |
| SVM | support vector machine |
| ICE | internal combustion engine |
| NMC | Lithium Nickel Manganese Cobalt oxide |
| MJ1 | INR18650 MJ1 |
| 22P | ICR18650-22P |
| CC | constant current |
| CV | constant voltage |
| PWR | power-to-weight ratio |
| HPC | high-performance computing |
References
- Brå. Rattfylleri och Trafikbrott. 2021. Available online: https://www.bra.se/statistik/statistik-utifran-brottstyper/rattfylleri-och-trafikbrott.html#Lagforda (accessed on 24 August 2021).
- Amin, K.; Yamazaki, R.; Forsman, A.; Vadeby, A.; Fredriksson, R.; Hurtig, P.; Larsson, P.; Lindholm, M.; Sternlund, S.; Lindberg, J.; et al. Analys av Trafiksäkerhetsutvecklingen 2019, Målstyrning av TrafiksäKerhetsarbetet mot Etappmålen 2020. Available online: https://trafikverket.ineko.se/Files/sv-SE/75691/Ineko.Product.RelatedFiles/2020_120_analys_av_trafiksakerhetsutvecklingen_2019_malstyrning.pdf (accessed on 24 August 2021).
- Melkersson, M.; Tano, B. Vägtrafikskador. 2018. Available online: https://www.trafa.se/globalassets/statistik/vagtrafik/vagtrafikskador/2018/vagtrafikskador-2018—blad.pdf (accessed on 1 February 2022).
- Melkersson, M. Vägtrafikskador. 2020. Available online: https://www.trafa.se/globalassets/statistik/vagtrafik/vagtrafikskador/2020/vagtrafikskador-2020.pdf (accessed on 1 February 2022).
- Aldred, R.; Johnson, R.; Jackson, C.; Woodcock, J. How does mode of travel affect risks posed to other road users? An analysis of English road fatality data, incorporating gender and road type. Inj. Prev. 2021, 27, 71–76. [Google Scholar] [CrossRef]
- Turner, C.; McClure, R. Age and gender differences in risk-taking behaviour as an explanation for high incidence of motor vehicle crashes as a driver in young males. Inj. Control. Saf. Promot. 2003, 10, 123–130. [Google Scholar] [CrossRef] [PubMed]
- Engström, I.; Gregersen, N.P.; Hernetkoski, K.; Keskinen, E.; Nyberg, A. Young Novice Drivers, Driver Education and Training: Literature Review; Technical Report 491A; Swedish National Road and Transport Research Institute: Linköping, Sweden, 2003. [Google Scholar]
- Brå. Rattfylleri och Trafikbrott. 2017. Available online: https://www.dekra.com/en/men-are-not-better-drivers-but-they-do-drive-faster/ (accessed on 24 August 2021).
- Cook, C.; Diamond, R.; Hall, J.V.; List, J.A.; Oyer, P. The Gender Earnings Gap in the Gig Economy: Evidence from over a Million Rideshare Drivers. Rev. Econ. Stud. 2020, 88, 2210–2238. [Google Scholar] [CrossRef]
- Eboli, L.; Mazzulla, G.; Pungillo, G. How drivers’ characteristics can affect driving style. Transp. Res. Procedia 2017, 27, 945–952. [Google Scholar] [CrossRef]
- Eboli, L.; Mazzulla, G.; Pungillo, G. Combining speed and acceleration to define car users’ safe or unsafe driving behaviour. Transp. Res. Part C Emerg. Technol. 2016, 68, 113–125. [Google Scholar] [CrossRef]
- Ericsson, E. Independent driving pattern factors and their influence on fuel-use and exhaust emission factors. Transp. Res. Part D Transp. Environ. 2001, 6, 325–345. [Google Scholar] [CrossRef]
- Canada, N.R. 2019 Fuel Consumption Guide. Available online: https://www.nrcan.gc.ca/sites/www.nrcan.gc.ca/files/oee/pdf/transportation/tools/fuelratings/2019%20Fuel%20Consumption%20Guide.pdf (accessed on 27 August 2021).
- Koffler, C.; Rohde-Brandenburger, K. On the calculation of fuel savings through lightweight design in automotive life cycle assessments. Int. J. Life Cycle Assess. 2009, 15, 128. [Google Scholar] [CrossRef]
- Bingham, C.; Walsh, C.; Carroll, S. Impact of driving characteristics on electric vehicle energy consumption and range. IET Intell. Transp. Syst. 2012, 6, 29–35. [Google Scholar] [CrossRef]
- Al-Doori, M.; Paluszczyszyn, D.; Elizondo, D.; Passow, B.; Goodyer, E. Range extended for electric vehicle based on driver behaviour recognition. In Proceedings of the 5th IET Hybrid and Electric Vehicles Conference (HEVC 2014), London, UK, 5–6 November 2014; pp. 1–7. [Google Scholar] [CrossRef]
- Wikner, E. Ageing in Commercial Li-ion Batteries: Lifetime Testing and Modelling for Electrified Vehicle Applications. Ph.D. Thesis, Chalmers University of Technology, Göteborg, Sweden, 2019. [Google Scholar]
- Groot, J. State-of-Health Estimation of Li-ion Batteries: Cycle Life Test Methods. Licentiate Thesis, Chalmers Tekniska Hogskola, Göteborg, Sweden, 2012. [Google Scholar]
- Schmalstieg, J.; Käbitz, S.; Ecker, M.; Sauer, D.U. From accelerated aging tests to a lifetime prediction model: Analyzing lithium-ion batteries. In Proceedings of the 2013 World Electric Vehicle Symposium and Exhibition (EVS27), Barcelona, Spain, 17–20 November 2013; pp. 1–12. [Google Scholar] [CrossRef]
- Ecker, M.; Nieto, N.; Käbitz, S.; Schmalstieg, J.; Blanke, H.; Warnecke, A.; Sauer, D.U. Calendar and cycle life study of Li(NiMnCo)O2-based 18650 lithium-ion batteries. J. Power Sources 2014, 248, 839–851. [Google Scholar] [CrossRef]
- Käbitz, S.; Gerschler, J.B.; Ecker, M.; Yurdagel, Y.; Emmermacher, B.; André, D.; Mitsch, T.; Sauer, D.U. Cycle and calendar life study of a graphite|LiNi1/3Mn1/3Co1/3O2 Li-ion high energy system. Part A: Full cell characterization. J. Power Sources 2013, 239, 572–583. [Google Scholar] [CrossRef]
- Wright, R.B.; Motloch, C.G.; Belt, J.R.; Christophersen, J.P.; Ho, C.D.; Richardson, R.A.; Bloom, I.; Jones, S.A.; Battaglia, V.S.; Henriksen, G.L.; et al. Calendar-and cycle-life studies of advanced technology development program generation 1 lithium-ion batteries. J. Power Sources 2002, 110, 445–470. [Google Scholar] [CrossRef]
- Bessman, A.; Soares, R.; Wallmark, O.; Svens, P.; Lindbergh, G. Aging effects of AC harmonics on lithium-ion cells. J. Energy Storage 2019, 21, 741–749. [Google Scholar] [CrossRef]
- Uno, M.; Tanaka, K. Influence of High-Frequency Charge–Discharge Cycling Induced by Cell Voltage Equalizers on the Life Performance of Lithium-Ion Cells. IEEE Trans. Veh. Technol. 2011, 60, 1505–1515. [Google Scholar] [CrossRef]
- Bala, S.; Tengnér, T.; Rosenfeld, P.; Delince, F. The effect of low frequency current ripple on the performance of a Lithium Iron Phosphate (LFP) battery energy storage system. In Proceedings of the 2012 IEEE Energy Conversion Congress and Exposition (ECCE), Raleigh, NC, USA, 15–20 September 2012; pp. 3485–3492. [Google Scholar] [CrossRef]
- Uddin, K.; Moore, A.D.; Barai, A.; Marco, J. The effects of high frequency current ripple on electric vehicle battery performance. Appl. Energy 2016, 178, 142–154. [Google Scholar] [CrossRef]
- Mueller, S.; Rohr, S.; Schmid, W.; Lienkamp, M. Analysing the Influence of Driver Behaviour and Tuning Measures on Battery Aging and Residual Value of Electric Vehicles. In Proceedings of the EVS30 International Battery, Hybrid and Fuel Cell Electric Vehicle Symposium, Stuttgart, Germany, 9–11 October 2017. [Google Scholar]
- Jafari, M.; Gauchia, A.; Zhang, K.; Gauchia, L. Simulation and Analysis of the Effect of Real-World Driving Styles in an EV Battery Performance and Aging. IEEE Trans. Transp. Electrif. 2015, 1, 391–401. [Google Scholar] [CrossRef]
- Karlsson, S. The Swedish Car Movement Data Project. 2013. Available online: http://publications.lib.chalmers.se/records/fulltext/187380/local_187380.pdf (accessed on 9 March 2020).
- Pedregosa, F.; Varoquaux, G.; Gramfort, A.; Michel, V.; Thirion, B.; Grisel, O.; Blondel, M.; Prettenhofer, P.; Weiss, R.; Dubourg, V.; et al. Scikit-learn: Machine Learning in Python. J. Mach. Learn. Res. 2011, 12, 2825–2830. [Google Scholar]
- Sturm, J.; Rheinfeld, A.; Zilberman, I.; Spingler, F.; Kosch, S.; Frie, F.; Jossen, A. Modeling and simulation of inhomogeneities in a 18650 nickel-rich, silicon-graphite lithium-ion cell during fast charging. J. Power Sources 2019, 412, 204–223. [Google Scholar] [CrossRef]
- LG Chem. Product Specification Rechargeable Lithium Ion Battery Model: INR18650 MJ1 3500mAh; Rev. 1; LG Chem: Seoul, Korea, 2014. [Google Scholar]
- Liu, Y.; Sun, P.; Lin, S.; Niu, H.; Huang, X. Self-heating ignition of open-circuit cylindrical Li-ion battery pile: Towards fire-safe storage and transport. J. Energy Storage 2020, 32, 101842. [Google Scholar] [CrossRef]
- Samsung SDI. Specification of Product for Lithium-Ion Rechargeable Cell Model: ICR18650-22P; Rev. 1; Samsung SDI: Yongin-si, Korea, 2010. [Google Scholar]
- Smidfelt Rosqvist, L.; Winslott Hiselius, L. Understanding high car use in relation to policy measures based on Swedish data. Case Stud. Transp. Policy 2019, 7, 28–36. [Google Scholar] [CrossRef]
- Kronsell, A.; Dymén, C.; Rosqvist, L.S.; Hiselius, L.W. Masculinities and femininities in sustainable transport policy: A focus on Swedish municipalities. NORMA 2020, 15, 128–144. [Google Scholar] [CrossRef]
- Häglund, G. Bilindex 2012—Index över Nya Bilars Klimatpåverkan. 2013. Available online: https://trafikverket.ineko.se/Files/sv-SE/11407/RelatedFiles/2013_053_index_over_nya_bilars_klimatpaverkan_2012_i_riket_lanen_och_kommunerna.pdf (accessed on 22 June 2022).
- Lastkajen6.0. 2022. Available online: https://lastkajen2-p.ea.trafikverket.se/login (accessed on 17 January 2022).
- Dechent, P.; Greenbank, S.; Hildenbrand, F.; Jbabdi, S.; Sauer, D.U.; Howey, D.A. Estimation of Li-Ion Degradation Test Sample Sizes Required to Understand Cell-to-Cell Variability. Batter. Supercaps 2021, 4, 1821–1829. [Google Scholar] [CrossRef]
- Zilberman, I.; Ludwig, S.; Jossen, A. Cell-to-cell variation of calendar aging and reversible self-discharge in 18650 nickel-rich, silicon–graphite lithium-ion cells. J. Energy Storage 2019, 26, 100900. [Google Scholar] [CrossRef]
- Paul, S.; Diegelmann, C.; Kabza, H.; Tillmetz, W. Analysis of ageing inhomogeneities in lithium-ion battery systems. J. Power Sources 2013, 239, 642–650. [Google Scholar] [CrossRef]
- Devie, A.; Baure, G.; Dubarry, M. Intrinsic Variability in the Degradation of a Batch of Commercial 18650 Lithium-Ion Cells. Energies 2018, 11, 1031. [Google Scholar] [CrossRef]


Publisher’s Note: MDPI stays neutral with regard to jurisdictional claims in published maps and institutional affiliations. |
© 2022 by the authors. Licensee MDPI, Basel, Switzerland. This article is an open access article distributed under the terms and conditions of the Creative Commons Attribution (CC BY) license (https://creativecommons.org/licenses/by/4.0/).