1. Introduction
Currently, the use of biopolymer-inorganic (BIN) composites has become widespread in various sectors of the economy: chemical production, oil and gas production, medicine, and agriculture, among others [
1,
2,
3,
4]. Microphotographic image (MPI) processing methods play an important role in the study of BIN composites [
3,
4,
5,
6].
The developed algorithm is based on the Hölder exponent that uses a specific measures of local pixels configuration. So, for oriented polymer study, the specific measure should be elaborated. It should be noted that fractal mechanic properties of Polymeric Materials were well described in the paper [
5] (G. V. Kozlov and Yu. G. Yanovskii. Fractal Mechanics of Polymers: Chemistry and Physics of Complex Polymeric Materials. Toronto, New Jersy: Apple Academic Press, 2015. 372p.). Chapter 14 of this monograph is devoted to the fractal analysis of oriented polymers.
In Refs. [
7,
8], a new version of fractal dimension was proposed, as it was shown that the Hausdorf-Besicovitch dimension might be not only positive but also negative. In case of negative values, the fractal dimension measures the degree of emptiness of empty sets. So, multifractals may be considered as separated into two sets: the first set has positive multifractal dimension
, and the second set has negative multifractal dimension
. The practical usage of negative fractal dimensions found itself in the quantum field theory for regularization of divergent Feynman integrals. The authors of [
7,
8] use the new fractal dimensions in development of quantum field theory in fractal spacetime. The future development of multifractal theory and numerical multifractal calculation algorithms may use both positive and negative dimensions of cluster objects in microphotographs of composite materials.
This paper is aiming to study cluster formation and its impact on the properties of BIN composites. Similar problems occur in many other composites and alloys; for example, one may consider the formation of dendrites in alloys. So, problems of BIN composites and dendrites in alloys are related on the same cluster and fractal basis. It should be noted that a new algorithm based on cellular automaton and fractals was used for dendrite formation modeling in [
9,
10,
11].
New dimensions discover additional fractal properties of materials, which, in some cases, play a decisive role in texture analysis. The authors of [
12] considered using the so-called biometric dimension. Podosenov S. A., Foukzon J., and Potapov A. A. [
13] studied the fractal dimension of dynamic systems. Churikov V.A. [
14] proposed new methods of texture classification based on the integration and differentiation of fractals. Diethelm K. [
15] and Anastassiou G. [
16] produced a new branch of differential equations, known now as fractal differential equations. L. Malerba, A. Caro, and J. Wallenius et al. [
17] and Svetukhin V., L’vov P., and Tikonchev et al. [
18] proposed new technologies for FeCr alloy production. Zhu M. F and Hong C.P. [
9], Shin Y.H and Hong C.P. [
10], and LEE Kyong-Yee and HONG Chun P. [
11] used a new algorithm based on cellular automaton and fractals for dendrite formation modeling. One of the widely known application fields of texture classification is image processing, of which the main features were discussed in [
19]. Goodfellow I, Bengio Y, and Courville A. [
20] discussed deep learning and its use for texture modeling. Many other texture classification technologies and algorithms may be found in [
21,
22,
23,
24,
25,
26]. Majid Mirmehdi, Xianghua Xie, and Jasjit Suri [
25] published a majority of the most popular texture classification algorithms developed before 2008. In the books [
27,
28], clustering algorithms were used to solve data mining problems.
Metallurgical applications of different clustering algorithms were presented in [
29]. The collection of nanoparticle clustering algorithms developed before 2011 may be found in [
30,
31]. The application of clustering algorithms in biosciences is discussed in [
32]. Many useful algorithms for clustering may be found in the Proceedings of the Meetings of the International Federation of Classification Societies (IFCS) [
33].
Stochastic and statistic processing algorithms are presented in [
34]. The practical applications of fuzzy clustering algorithms were discussed in [
35,
36]. Parasuraman Selvam [
37] presented the clustering of nanofilaments and other one-dimensional objects.
The methods of fractal texture analysis of MPIs have been successfully used to classify polymers and macromolecules [
3]. In [
3], the theory and fundamentals of the fractal analysis of the MPI structure of macromolecules are described in detail. From MPI texture analysis, it was found that cluster sizes reach up to several nanometers.
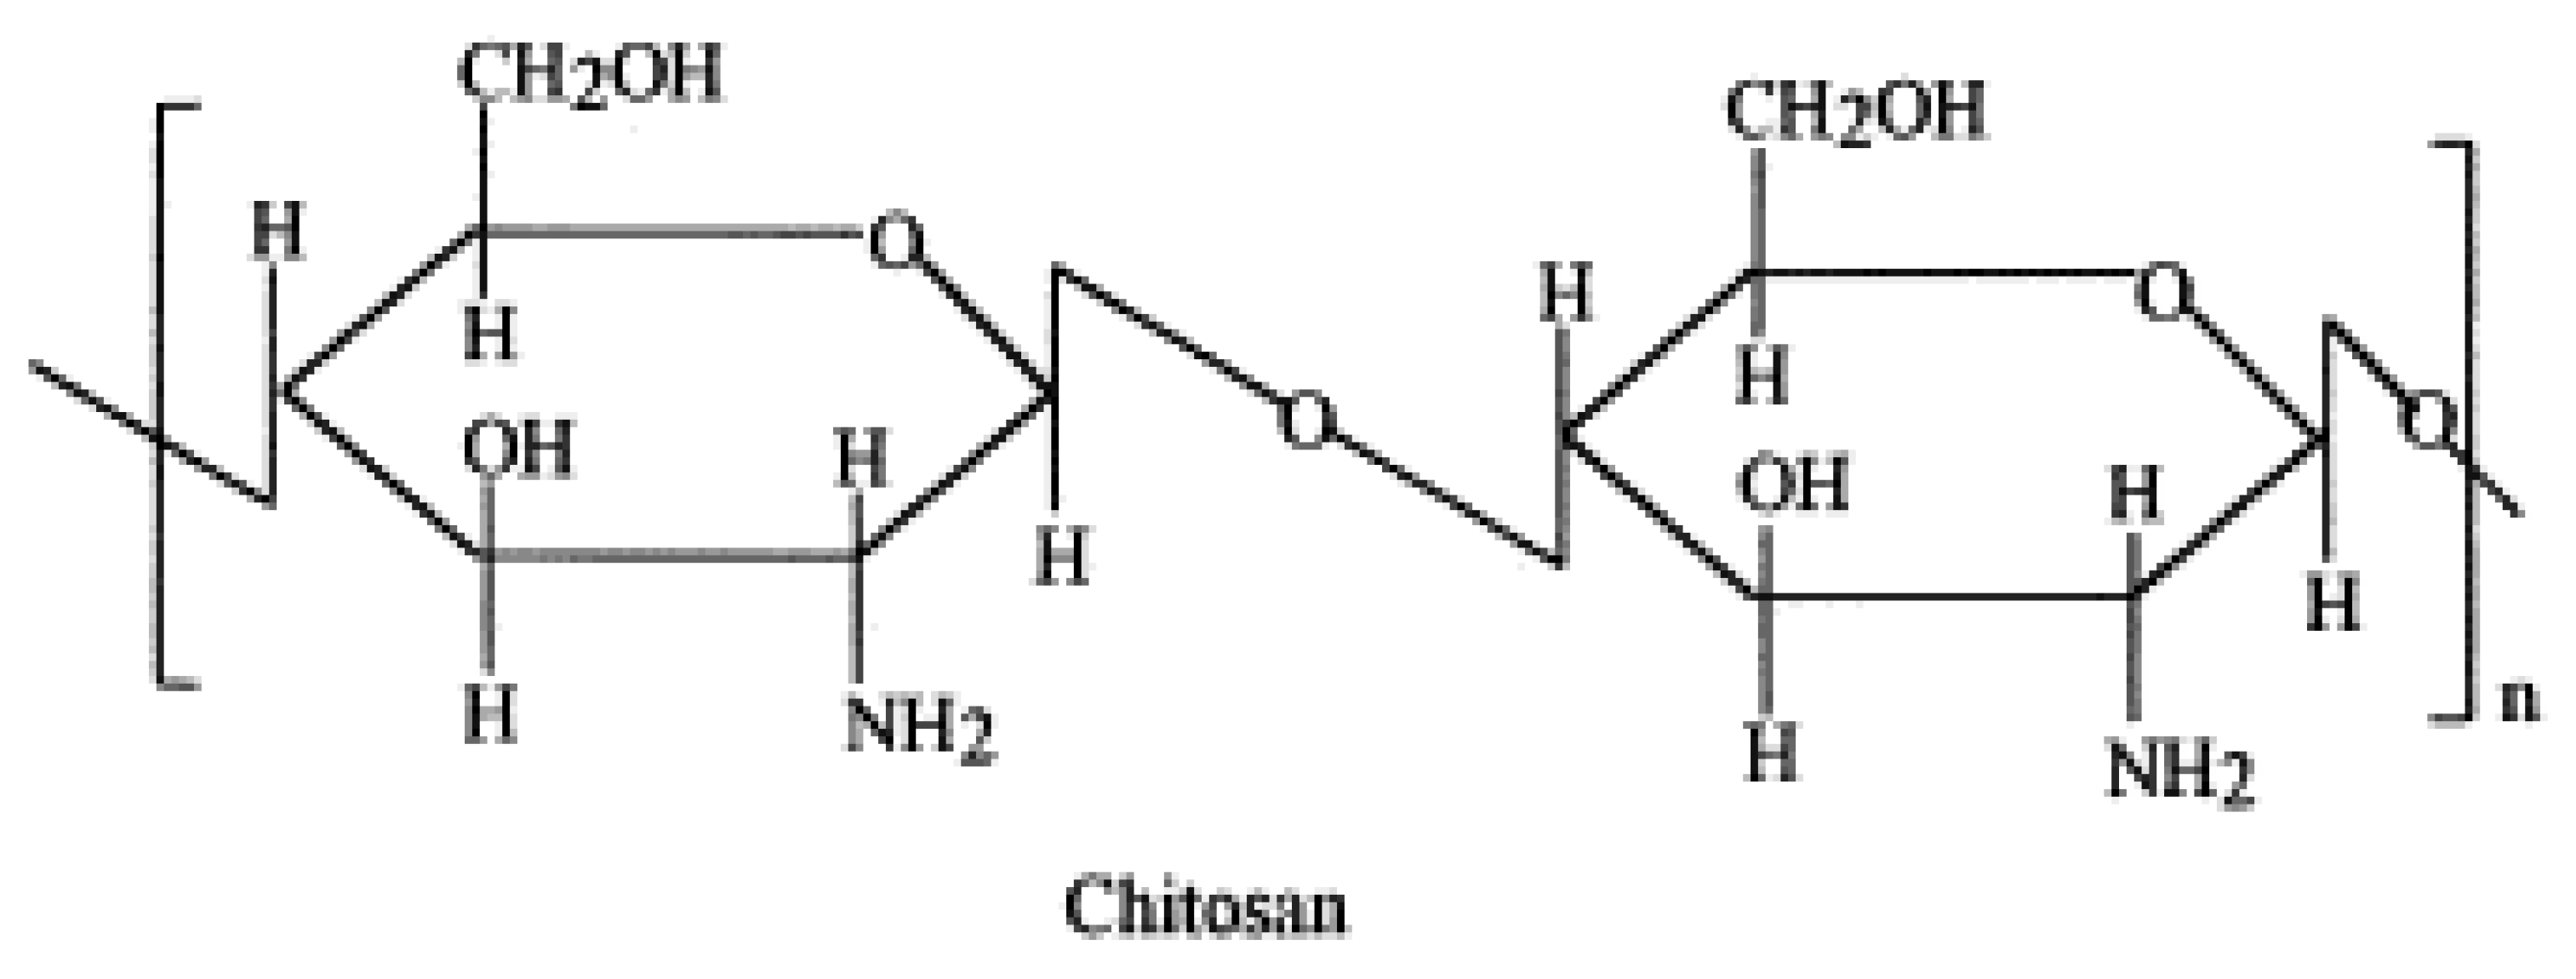
One of the currently actively developing areas of practical use of polymer films is the development of biodegradable polymer films. The decomposition of synthetic polymers is accompanied by the release of harmful substances in the form of reusable waste. For this reason, a relatively new direction in the synthesis of biodegradable polymer films has great prospects. To this end, this paper considers the application of fractal analysis methods to study the texture of chitosan-based bioinorganic polymer films.
Chitosan is an N-deacetylated derivative of chitin (see
Figure 1).
On the basis of chitosan, samples of BIN composites were created with the possibility of a controlled long-term targeted release of nutrients (N-P-K) and bioprotective substances (for example, the introduction of silicon dioxide as a precursor) for use in an agricultural complex with no damage to the environment. One of the main directions of BIN composites application in the agro-industrial complex is the preservation and protection of seeds, increasing the speed of their germination and providing a targeted delivery of nutrients to them. The use of BIN composites in the production of complex fertilizers with the possibility of long-term release of active substances is a promising area of research. Silicon dioxide extracted from a BIN composite nourishes seeds and seedlings, which contributes to their better development. For effective use, the composite must have a certain strength, depending on the number and location of cluster agglomerates of silicon dioxide.
The objects of the research presented in this article are the microphotographic images (MPIs) of the BIN texture of the “chitosan-silicon dioxide” composite.
The subject of the research is the quantitative analysis of the influence of the concentration and density of cluster agglomerates of silicon dioxide formed in the texture of BIN composites on their mechanical properties (strength and plasticity) using an original multifractal algorithm for calculating the characteristic values of the MPI texture of BIN composites.
Research tools: chemical diagnostic devices and microphotographic images (MPIs) of the texture of BIN composite samples.
Studies of the mechanical properties of the BIN composite were carried out on the INSTRON 3382 Testing Machine.
The practical significance of the research is to assess the possibility of delivering silicon dioxide particles using a BIN composite to protect plants from harmful bacteria.
There are many methods for applying chemical diagnostics to the study of the texture of composites, such as Auger spectroscopy, Fourier spectroscopy, Mesbauer spectroscopy, Raman spectroscopy, ultraviolet, and infrared spectroscopy. Other methods include the use of atomic force microscopes (AFM), scanning electron microscopes (SEM), transmission electron microscope (TEM), X-ray computed tomography (CT), and metallographic microscopes (MM), all of which allow one to obtain MPIs of composite textures.
The gap in the study is the absence of knowledge about the strength of correlation between mechanical properties and the multifractal dimension of the BIN “chitosan-silicon dioxide” composite with different amounts of silicon dioxide in samples.
Segmentation, pattern recognition, and feature extraction are widely used in various scientific fields [
38,
39,
40,
41,
42,
43]. Some of the most informative means of segmentation are edge and contour detection. Segmentation combines image pixels into homogenous fragments, which represent the structural features of an image. The feature fragments may be shown in different colors. In some cases, fragments are shown only in black and white. In such a case, fragments are called binary objects, and images are called binary images [
44]. Sometimes, a fractal dimension is used for segmentation [
42,
43,
44]. It should be noted that in composite study features may be stored not only as area objects but also as linear objects. These linear objects are called skeletons [
45,
46]. Various objects in image may be singled out by segmentation. The procedure is called feature extraction. So, the objects in the image can be presented as homogeneous pixel regions or as edge contours. Contours may be closed or unclosed. Unclosed contours are called skeletons. Sometimes, skeletons can be parts of unclosed contours (incomplete contours) or can be true linear objects. To make skeletons more distinct, different morphological thinning algorithms are used [
6,
47]. For example, thinning algorithms may be used for pattern recognition purposes in composite fillers cluster analysis. Other names for the skeletons include the one-pixel wide object or the quasi one-dimensional object [
39]. A one-pixel wide binary skeleton may be produced from a quasi skeleton using a simple morphological operation (for example, “binary erosion”). Of course, a quasi skeleton’s definition is not so strict, but it allows one to use simpler and not as time-consuming algorithms.
The theory of fractals well reflects the specifics of the structure of clusters and is promising for describing the properties of strongly inhomogeneous materials [
48]. In its initial formulation, it is similar to the theory of percolation, which is intended to describe the behavior of systems near topological phase transitions. Usually, the percolation model is considered for a lattice system in which nodes or bonds are distinguished with the probability P [
49,
50]. For a small P, the selected nodes are mostly isolated, but as their concentration increases, clusters appear—groups of connected isolated particles. With a further increase in P, aggregation takes on an avalanche-like character and will occur simultaneously according to several schemes: particle-particle, particle-cluster, and cluster-cluster. The most important characteristic of a percolation system is the percolation threshold Pc, by passing through which, the quantity turns into quality. In a system of selected nodes, the connectivity caused by the appearance of a percolation hypercluster extending through the entire system becomes global [
49,
50]. The topological phase transition that has taken place means that the resulting structure begins to play the role of a formed independent phase
2. Laboratory Method for Obtaining a Biopolymer-Inorganic Composite “Chitosan-silicon Dioxide”
Chitosan, obtained from the industrial processing of crustacean waste in orthophosphoric acid, is dissolved. To obtain the BIN of the composite, a solution of “chitosan-orthophosphoric acid–water” is used in the ratio of 3.2 g to 3.2 mL and 50 mL. The solution is prepared in a measuring cup (100 mL), which is then placed on a tiled lab bench, where the process of chitosan dissolution takes place with continuous stirring by an automatic agitator at T 40 °C for 40~60 min. The resulting solution is a viscous transparent honey-colored liquid. Next, SiO2 filler is added to this solution in various volumes with stirring for 10 min and an average particle size of 177 microns. The obtained solution is gradually filled into a glass vessel after which a fixing solution (ammonia (150 mL) and ethyl alcohol (50 mL)) is added to “stitch” chitosan. The exposure time in the fixing solution is 20 min. Subsequently, the fixing solution is removed and rinsed with distillate. The “stitched” chitosan is placed in a drying cabinet at T 40 °C for 2 h. The thickness of the manufactured samples of the BIN composites ranges from 8 to 10 mm, depending on the amount of silicon dioxide.
3. The Main Prerequisites for the Development of a Multifractal Algorithm
The proposed multifractal algorithm is based on the use of the iterative procedure of “box-counting” (BC-methods) that sequentially reduces the size of a specially created square grid covering a cluster binary-pixel MPI by a specified number of times.
At the first stage of the BC-method, pixel binarization of the original MPI is carried out in order to isolate the studied elements of the landscape of the original image into binary pixels. A binarization threshold is set to detect pixel objects.
At the next stage of the BC-method, the pixel image is uniformly covered with a special square grid of a given initial size.
Next, the number of squares into which at least one of the binary pixels falls is calculated. At each subsequent iteration, the grid size is reduced by a specified number of times, after which the calculations are repeated.
4. The Goal and Main Stages of the Multifractal Algorithm for Calculating Generalized Fractal Dimensions on the MPIs of the Textures of BIN Composites
The original multifractal algorithm proposed by the authors for calculating fractal characteristics of the cluster texture of BIN composites according to the MPIs of their textures is distinguished by its use of the statistical probabilistic model for the processing of binary pixels from the original MPIs previously converted into skeletons. The algorithm includes special median filters for calculating cluster texture indicators, which are generalized fractal dimensions for the detection of areas of various configurations and densities in the texture of the MPIs. Detecting these clusters of inorganic materials allows one to determine the quantitative dependence of the mechanical properties of the BIN composite on the characteristics of the composite texture and the content of silicon dioxide.
The multifractal algorithm allows the use of MPIs to detect silicon dioxide clusters in the texture of BIN “chitosan-silicon dioxide” composites of various configurations and densities affecting its mechanical properties.
The proposed multifractal algorithm consists of the following stages and steps:
Stage 1. Preprocessing of the initial MPIs to obtain a binary pixel structure of BIN composites, which includes procedures for converting the original three-channel color image into a single-channel image and procedures for constructing contours of black-and-white pixel skeletons.
Step 1.1. Converting the original three-channel color MPIs into single-channel black-and-white pixel images.
This step is necessary when using microscopes with pseudo-color-effects, in which the microscope creates three-channel pseudo-signals instead of single-channel signals.
1.1.1. Conversion of the original MPIs from three-channel to single-channel by calculating the arithmetic mean values of pixel brightness in each of the three channels.
1.1.2. Conversion of the original MPI from a three-channel to a single-channel image using a median filter that increases the contrast of the MPI.
Step 1.2. Converting MPIs using gradient filters to highlight skeleton pixels and identify areas of pixels with a large brightness ripple.
Step 1.3. Binarization of the transformed single-channel black-and-white pixel MPI to select skeletons and configure a multitude of binary pixels.
Step 1.4. Construction of connected skeleton contours using the procedure of linking (combining) skeleton pixels into connected contours.
Stage 2. Calculation of the Helder exponent for each pixel of the transformed MPI. The Helder exponent is a fractal dimension calculated for a specific form of a fractal measure and for each pixel of the MPI.
The fractal dimension is an exponent of the power-law of self-similarity that determines the fractal structure.
Fractal measure is a method of numerically representing the features of the fractal structure of an MPI using a sequential chain of square windows used to model the power-law of self-similarity. For example, as a fractal measure, the arithmetic mean or median of the number of pixels of the original MPI can be used for each of the square windows of the chain.
For instance, the fractal “iso measure”, which characterizes the correlation of pixel values, is calculated by the formula:
where
is the brightness of the pixel,
, ε—the specified threshold (algorithm parameter), and (
r,
p) are the coordinates of the central pixel.
Step 2.1. Choosing a fractal measure for calculating Helder exponents, which characterizes the local configuration of pixel clusters. As a fractal measure, an arithmetic mean, a correlation measure called an “iso measure”, or other types of statistical measures (for example, a median measure) can be used.
Step 2.2. Transformation of a binary pixel image using the sliding window (SW) method, which is a square fragment of an image, the side of which has an odd number of pixels, and the center moves sequentially along the pixels of the original image.
For each new position of the SW, that is, for each pixel of the original image, a square chain (SC) is formed with the side size increasing from one pixel to the size of the SW. In this case, two one-dimensional arrays are formed: an array of SC sizes and an array of fractal measures calculated for each new SC square.
Step 2.3. Calculation of the local Helder exponent for each MPI pixel using linear-logarithmic regression and two one-dimensional arrays of SC sizes and fractal measures modeled in Step 2.2.
Step 2.4. Constructing images of Helder exponents as a set of exponents previously calculated for each MPI pixel in Step 2.3
Step 2.5. Calculating the range of values of the Helder exponent as the interval from the minimum to the maximum value of the exponents calculated in Steps 2.3 and 2.4.
Stage 3. Calculation of the multifractal spectrum in the form of the function that describes the dependence of the fractal dimension of MPI pixel clusters on the value of the Helder exponent.
Step 3.1. Dividing the interval of values of the Helder exponent obtained in Step 2.5 by a given number of equidistant layers, for example, by 50 or 100 layers.
Step 3.2. Application of the BC-method of fractal dimension of clusters of MPI pixels on each of the layers of the Helder exponent obtained in Step 3.1.
Step 3.3. Representation of the multifractal spectrum function in tabular or graphical form.
Stage 4. Calculation of the multifractal dimension indicators characterizing the location of pixel cluster configuration using the multifractal spectrum calculated in at Stage 3.
Step 4.1. Calculation of the scaling exponent , which then allows one to calculate generalized fractal dimensions (Renyi dimensions). The scaling exponent is calculated using the BC-method.
Step 4.2. Calculation of generalized fractal dimensions
Dq:
where
is the scaling exponent, and
q is the parameter (the Renyi exponent).
Stage 5. Calculation from several generalized fractal dimensions—for example, the first three dimensions of the value of complex multifractal factor (CMF) account for several generalized fractal dimensions.
For example, various statistical characteristics can be used as a CMF: the arithmetic mean, the length of a three-dimensional vector composed of several generalized fractal dimensions, or the median.
Stage 6. Construction of tables and graphs of generalized fractal dimensions of Di and calculation of the CMF values that allow one to quantify the location of configurations and density of particle clusters of inorganic silicon dioxide material in the texture of the BIN “chitosan-silicon dioxide” composite.
When calculating the local Hölder exponent (α-image), square windows are used with a successive increase of size. The half-size of each window should not be greater than the distance from the central point to the edge pixels. As a result, each processing image has a frame of unused pixels. The frame width can be considered as a boundary condition. It is reasonable to use a frame size (boundary condition) of approximately ten percent of the size of the entire image.
Another boundary condition is related to the calculation of the fractal dimension by the box-counting method. The α-image is covered by a square grid, with the cell size halving to one pixel. This implies the second boundary condition: , where p is the number of steps required to reduce cell size to one pixel, and N is the image size.
The proposed multifractal algorithm is developed in the M language of the Matlab package using a special library of image processing (IP) procedures.
5. Results of the Application of the Multifractal Algorithm to Texture Analysis of BIN-Chitosan Film Samples
In this work, the authors conducted a multifractal analysis of microphotographic images (MPIs) of the texture of a BIN composite obtained using the ALTAMI optical microscope. The samples were examined at magnifications of ×10, ×20, ×40 and resolutions for light and lumen.
Let us consider the results of the conducted studies in which the effect of the concentration of silicon dioxide addition on the generalized fractal dimensions of chitosan films forming the BIN “chitosan-silicon dioxide” composite was studied. The following five sequentially increasing concentrations of silicon dioxide in the BIN composite were used in the experiments: 0.5 g; 0.75 g; 1.0 g, 1.25 g; 1.5 g. We will also consider the results of the application of a complex multifractal algorithm (CMA) to the extreme points of a given sequence of concentrations of silicon dioxide.
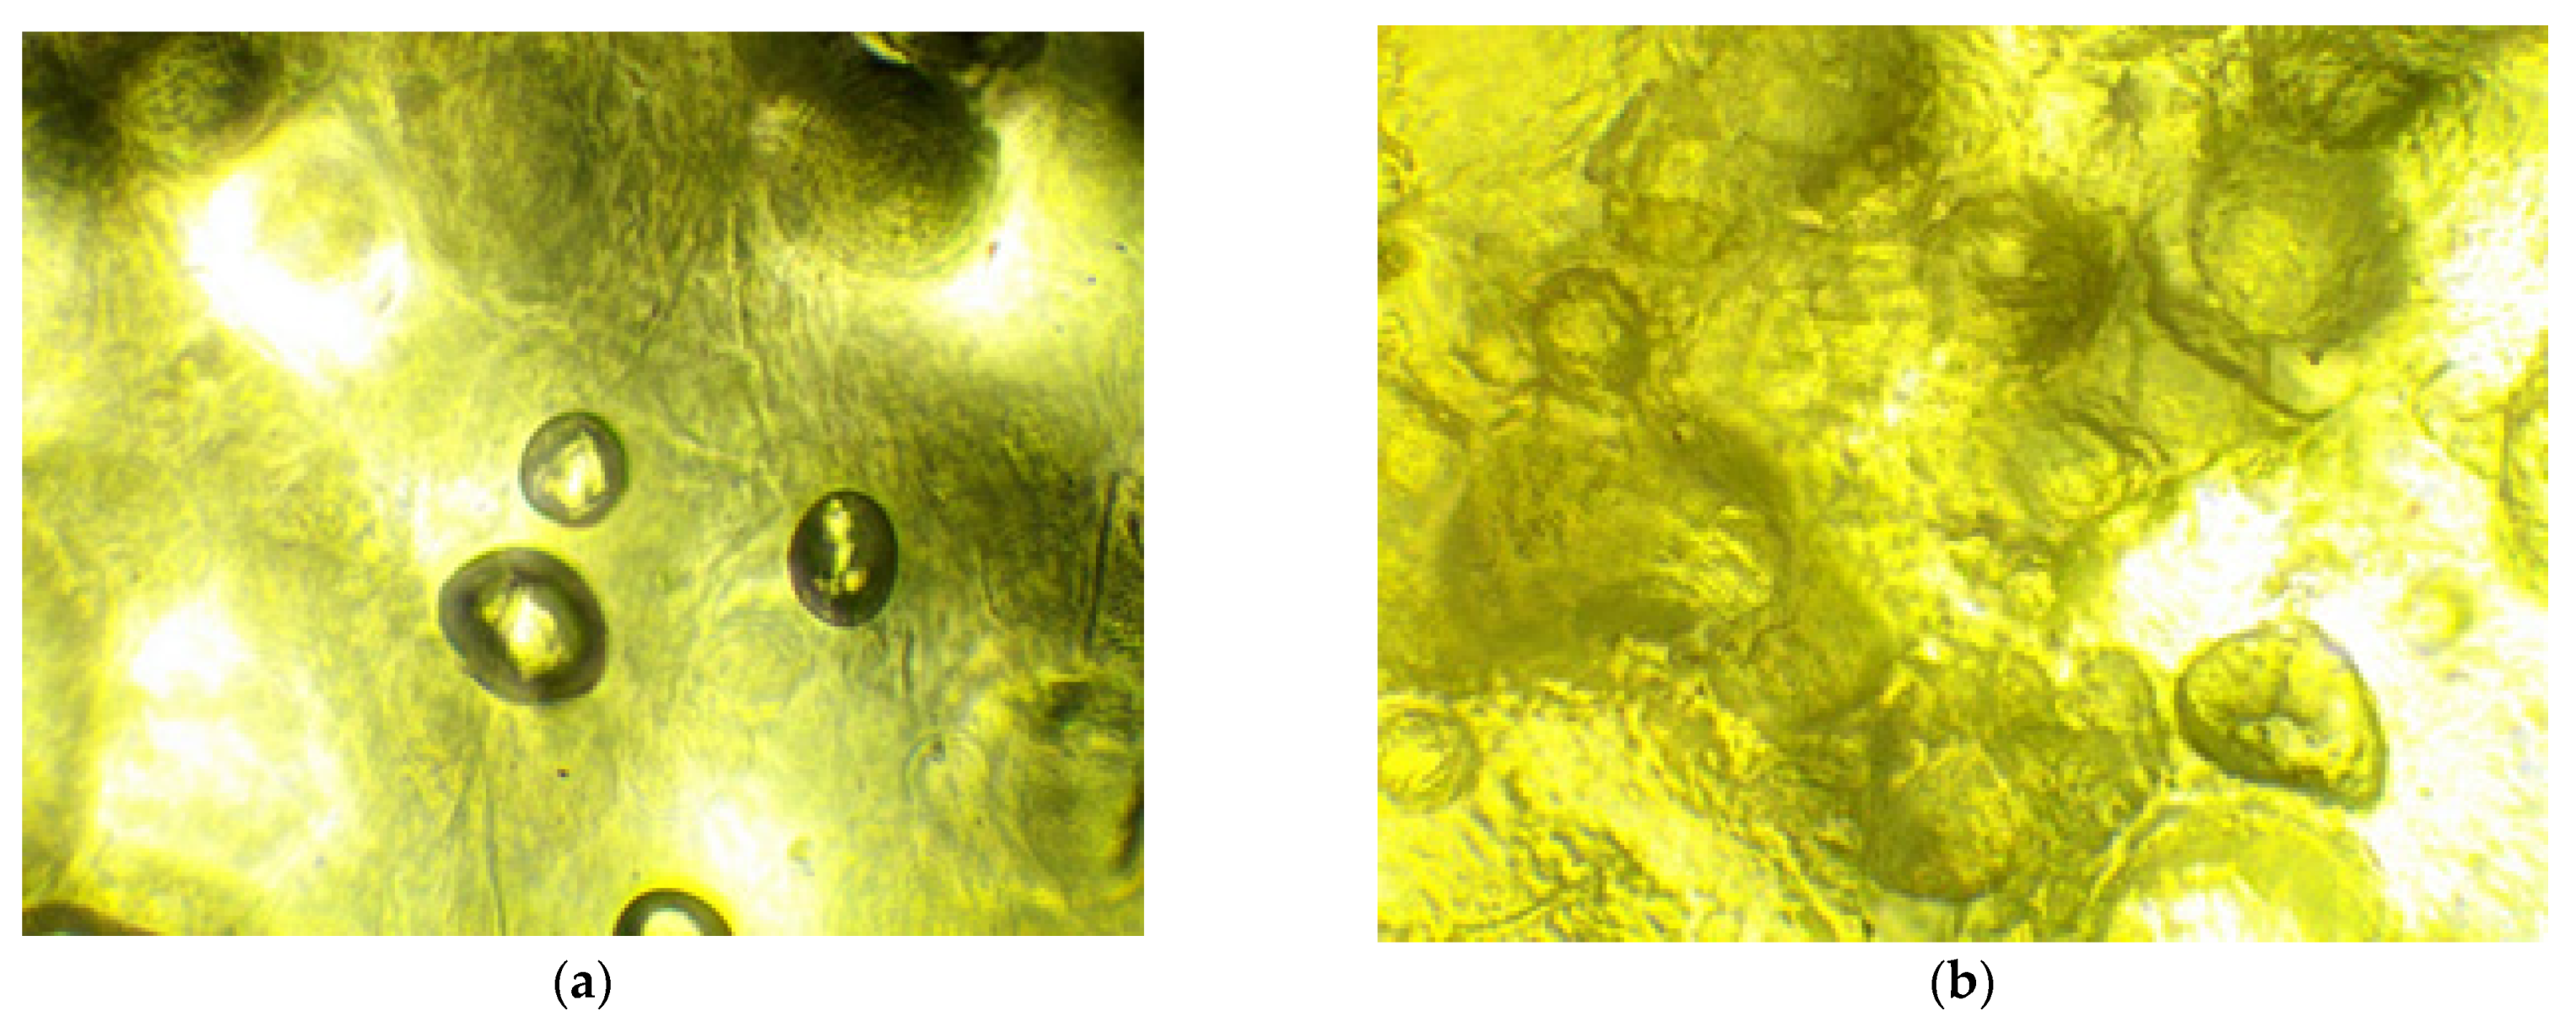
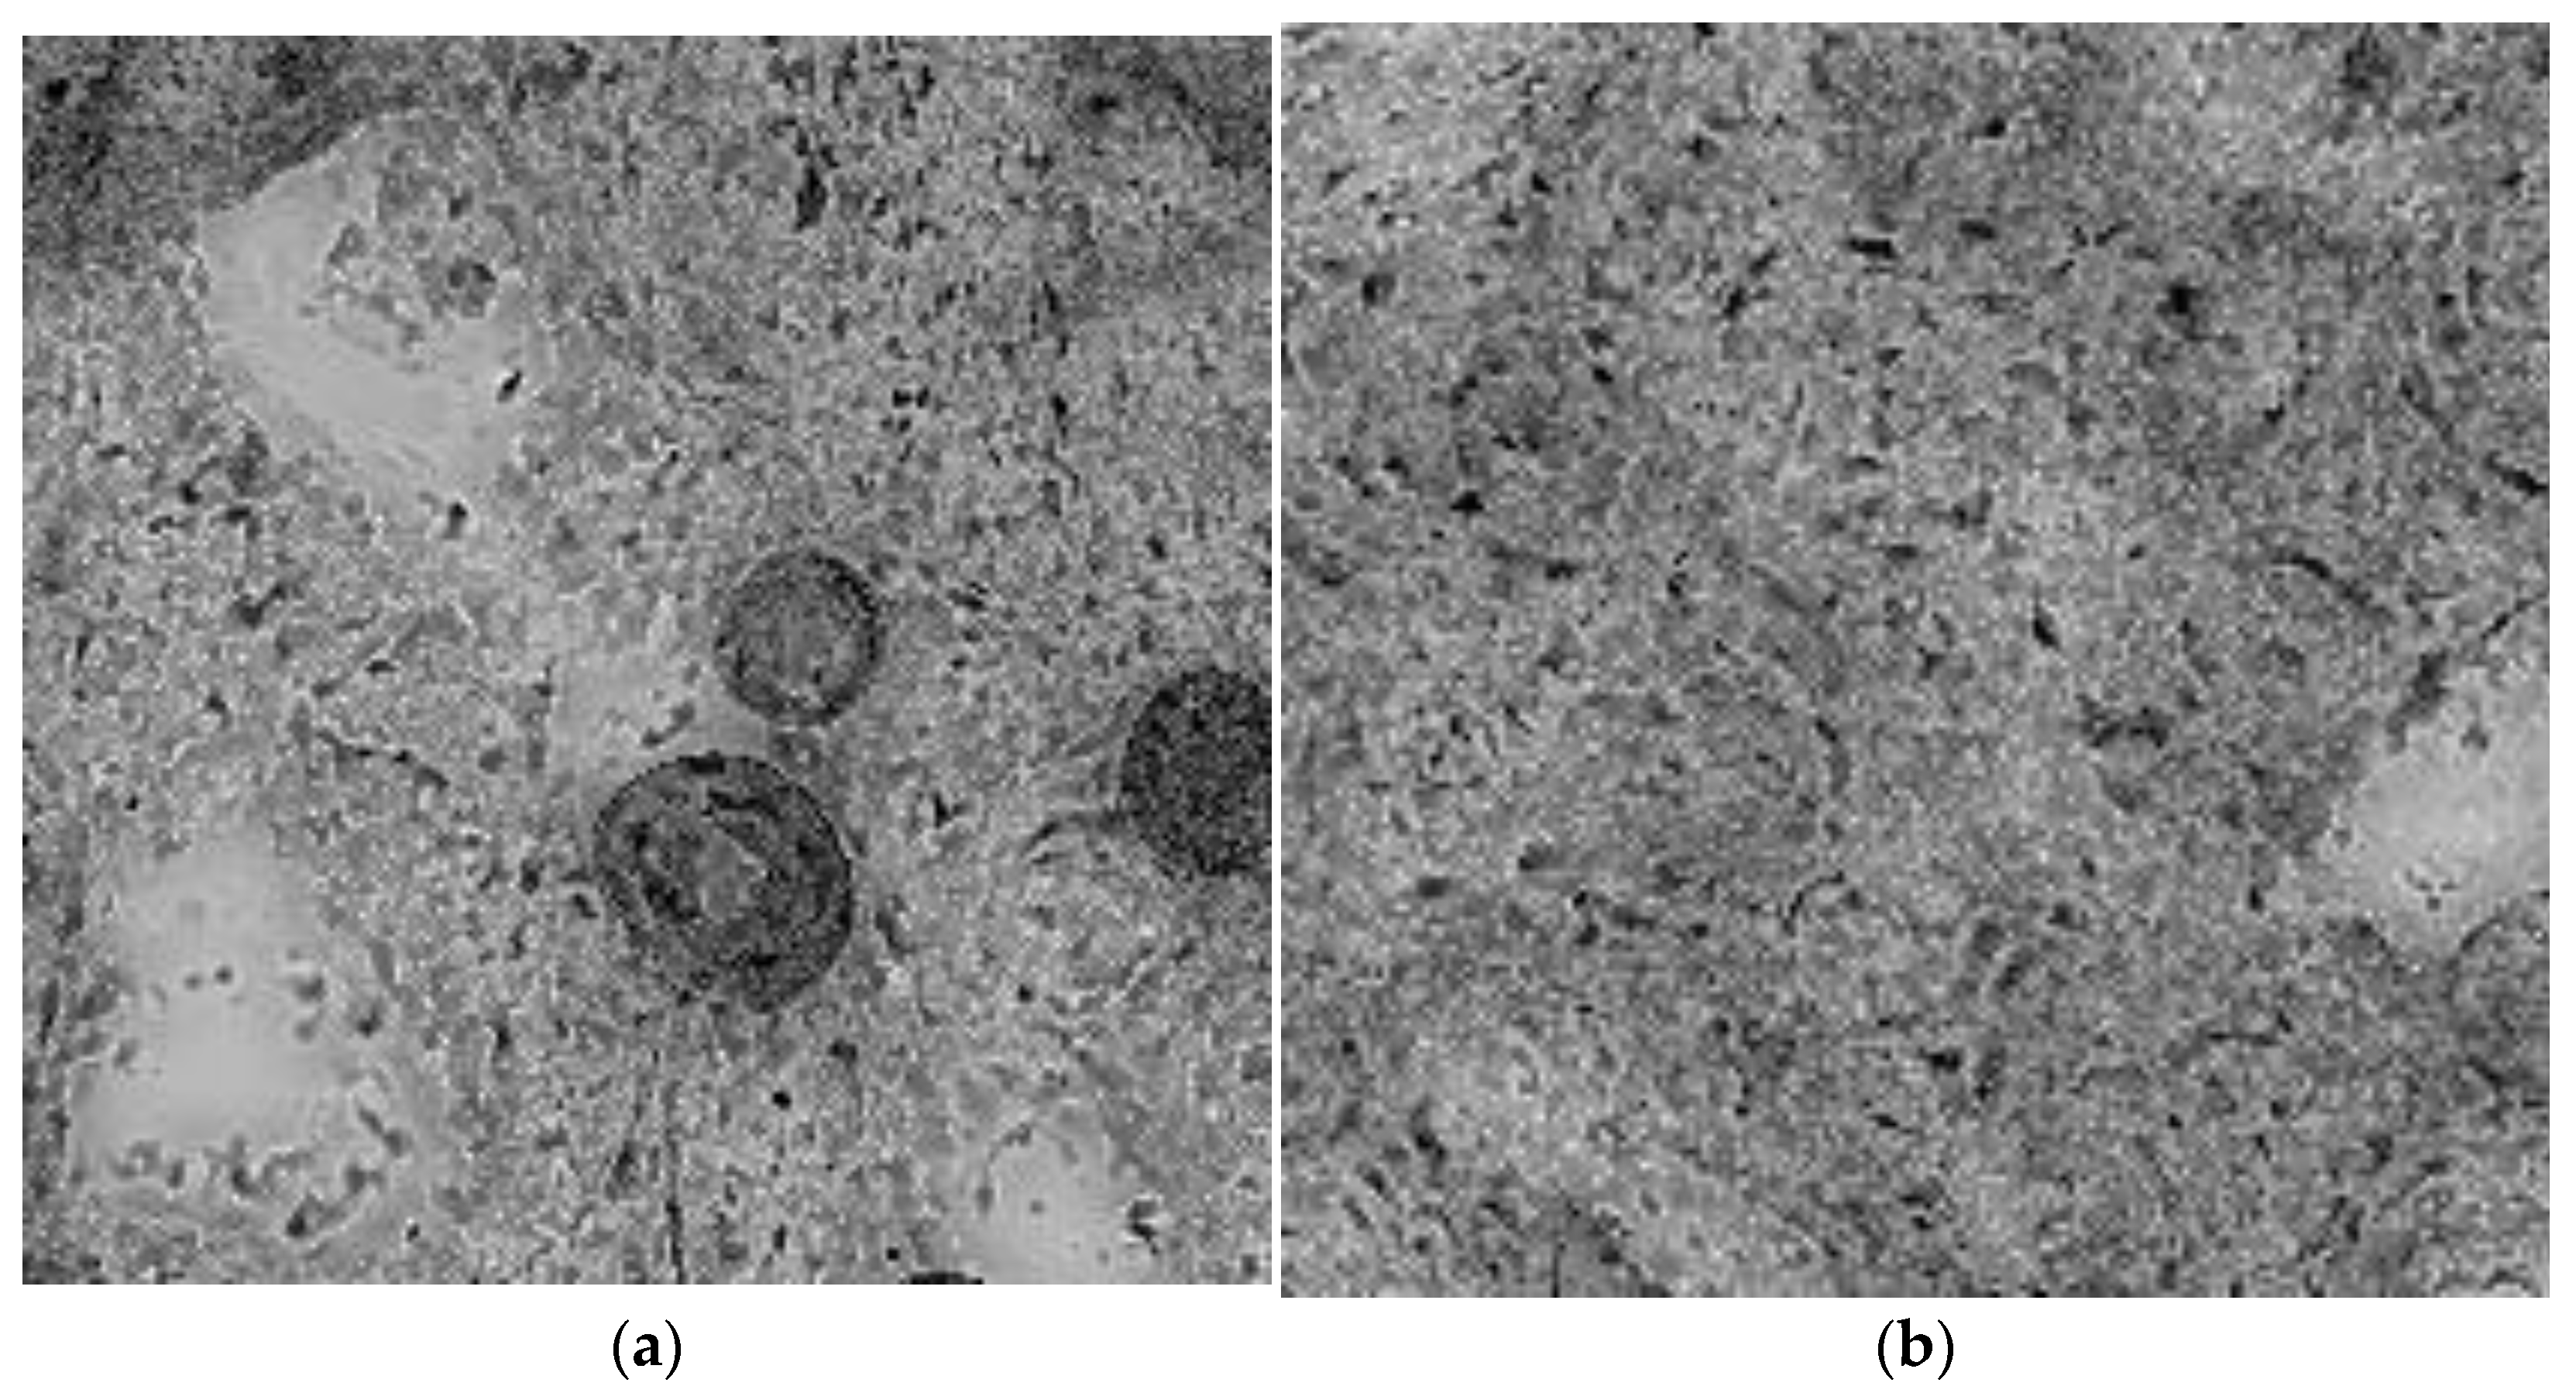
Figure 2 shows the initial MPI textures of BIN composite samples. We denote the MPI of the sample with 0.5 g of SiO
2 as MPI-1, and the sample with 1.5 g of SiO
2—as MPI-2. A three-channel median filter was used to convert the original three-channel color MPIs into single-channel pixel ones. The results of the transformation are shown in
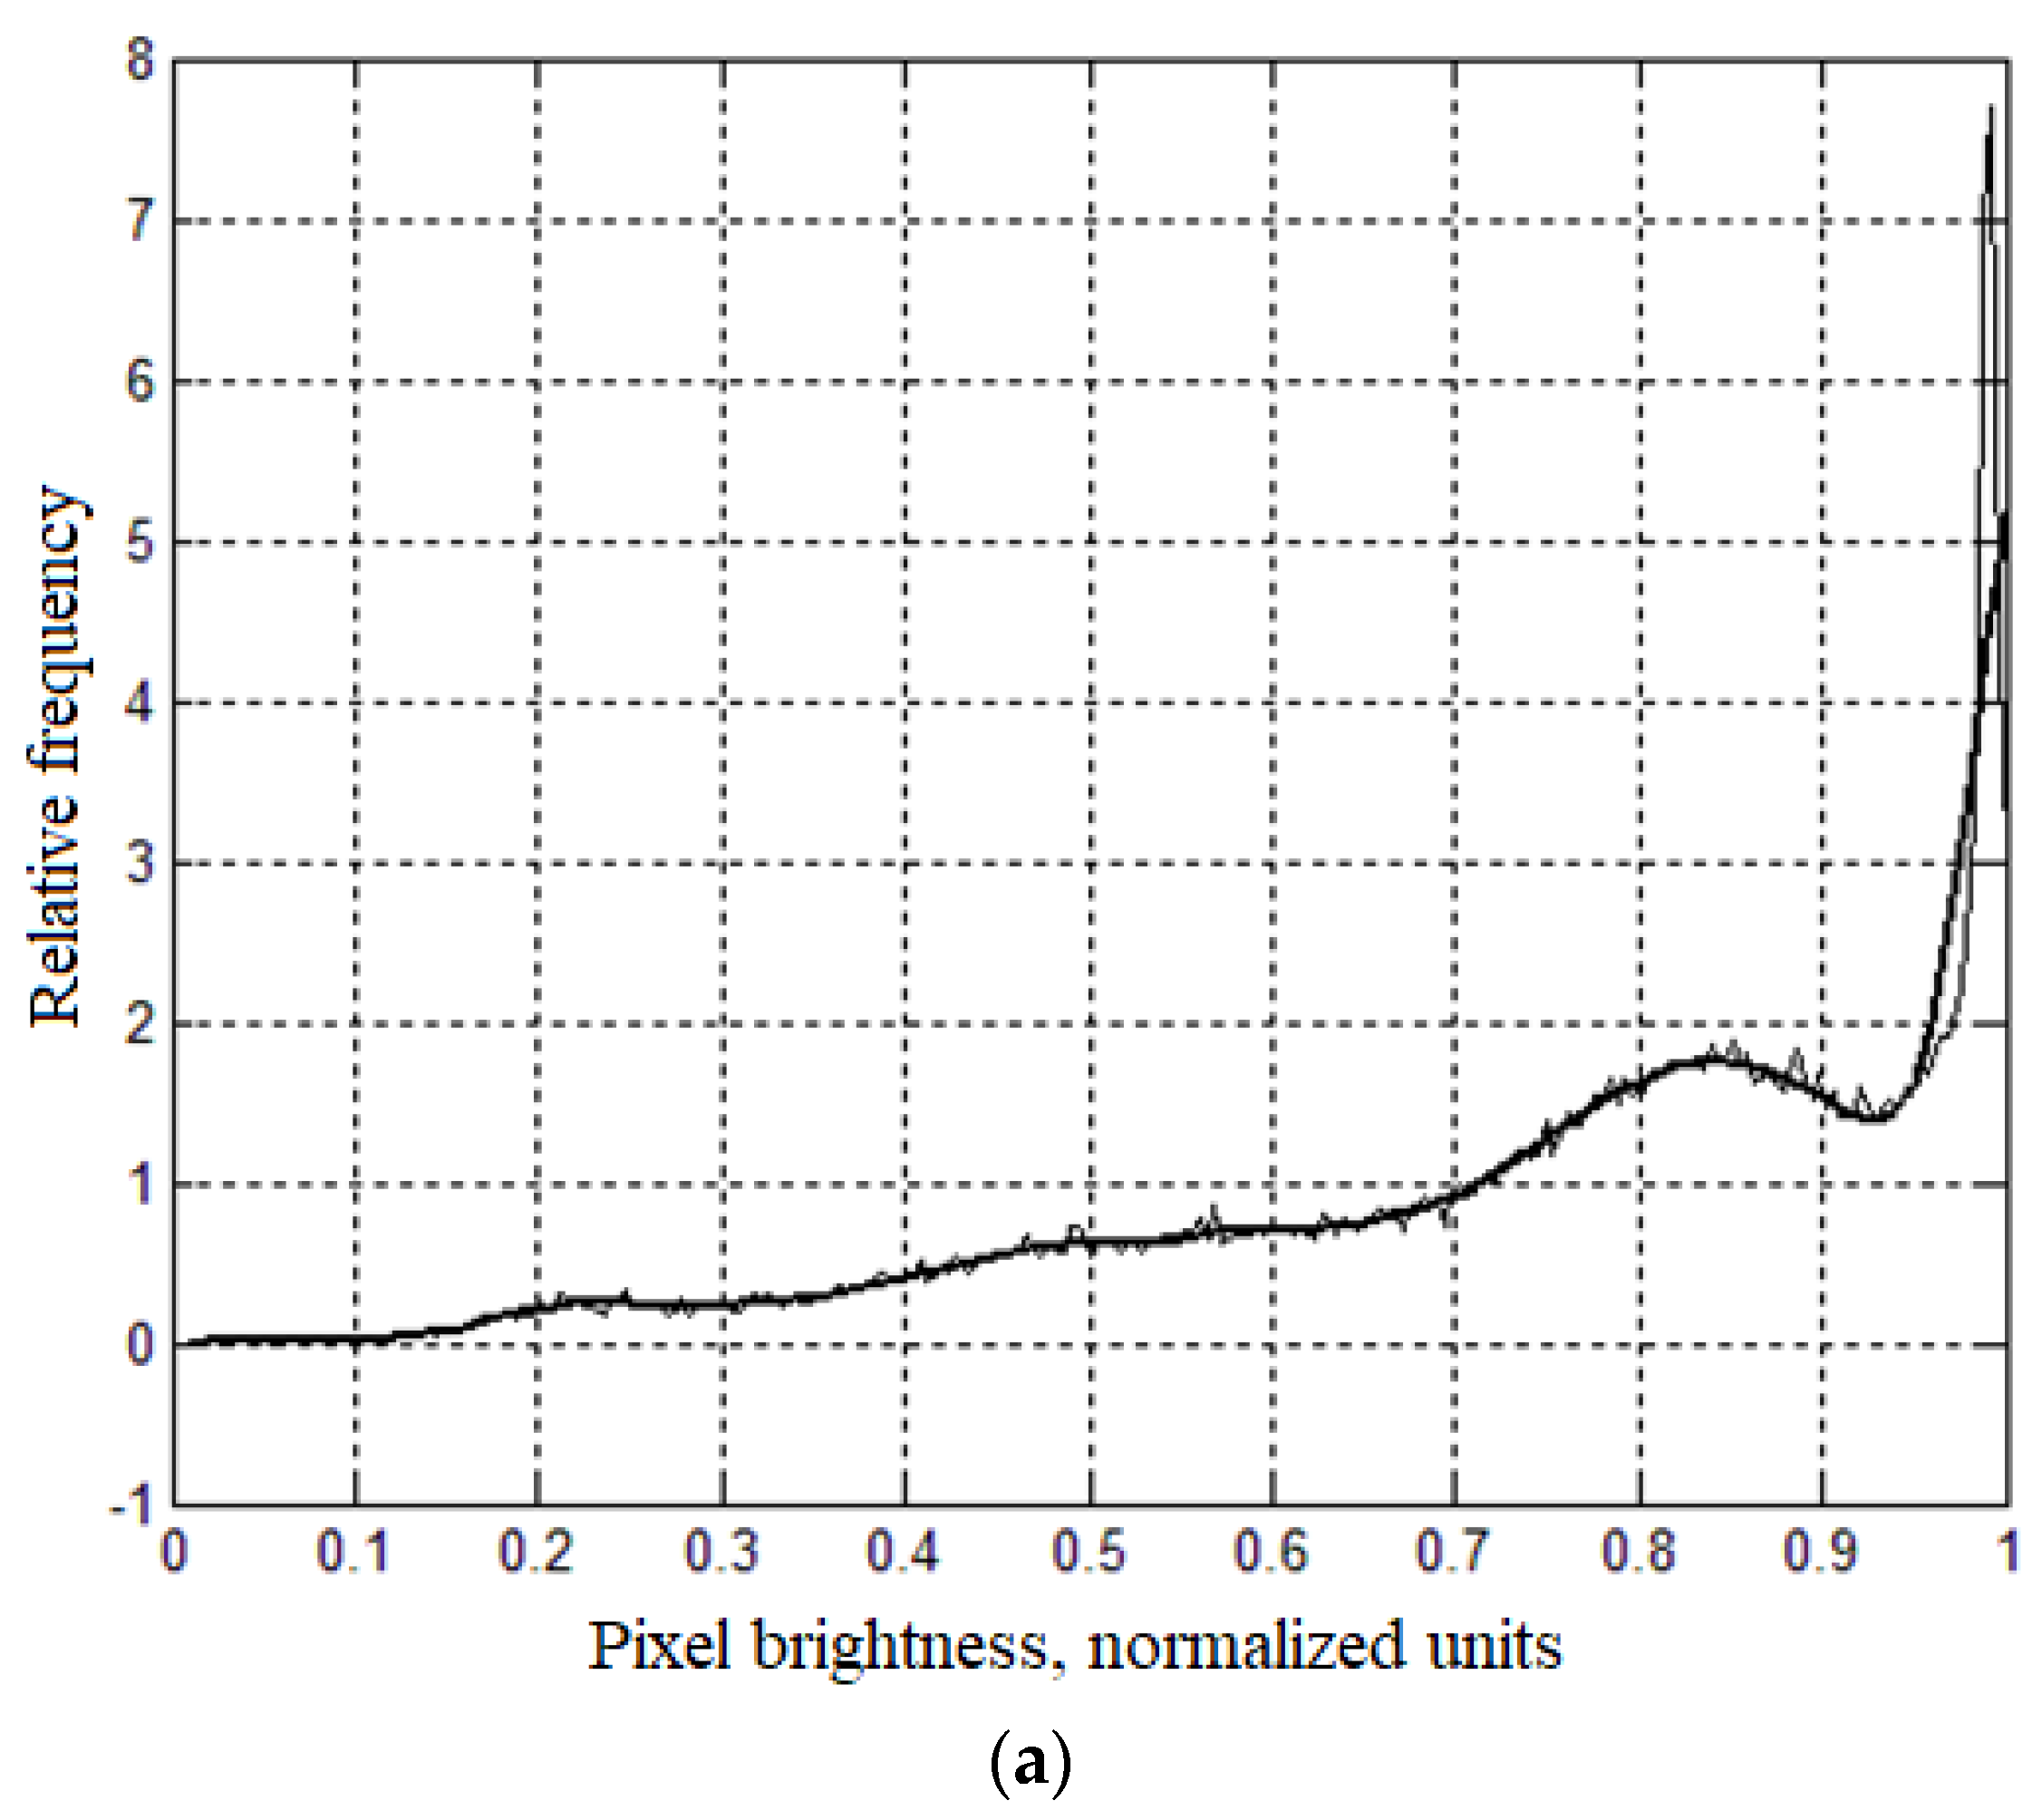
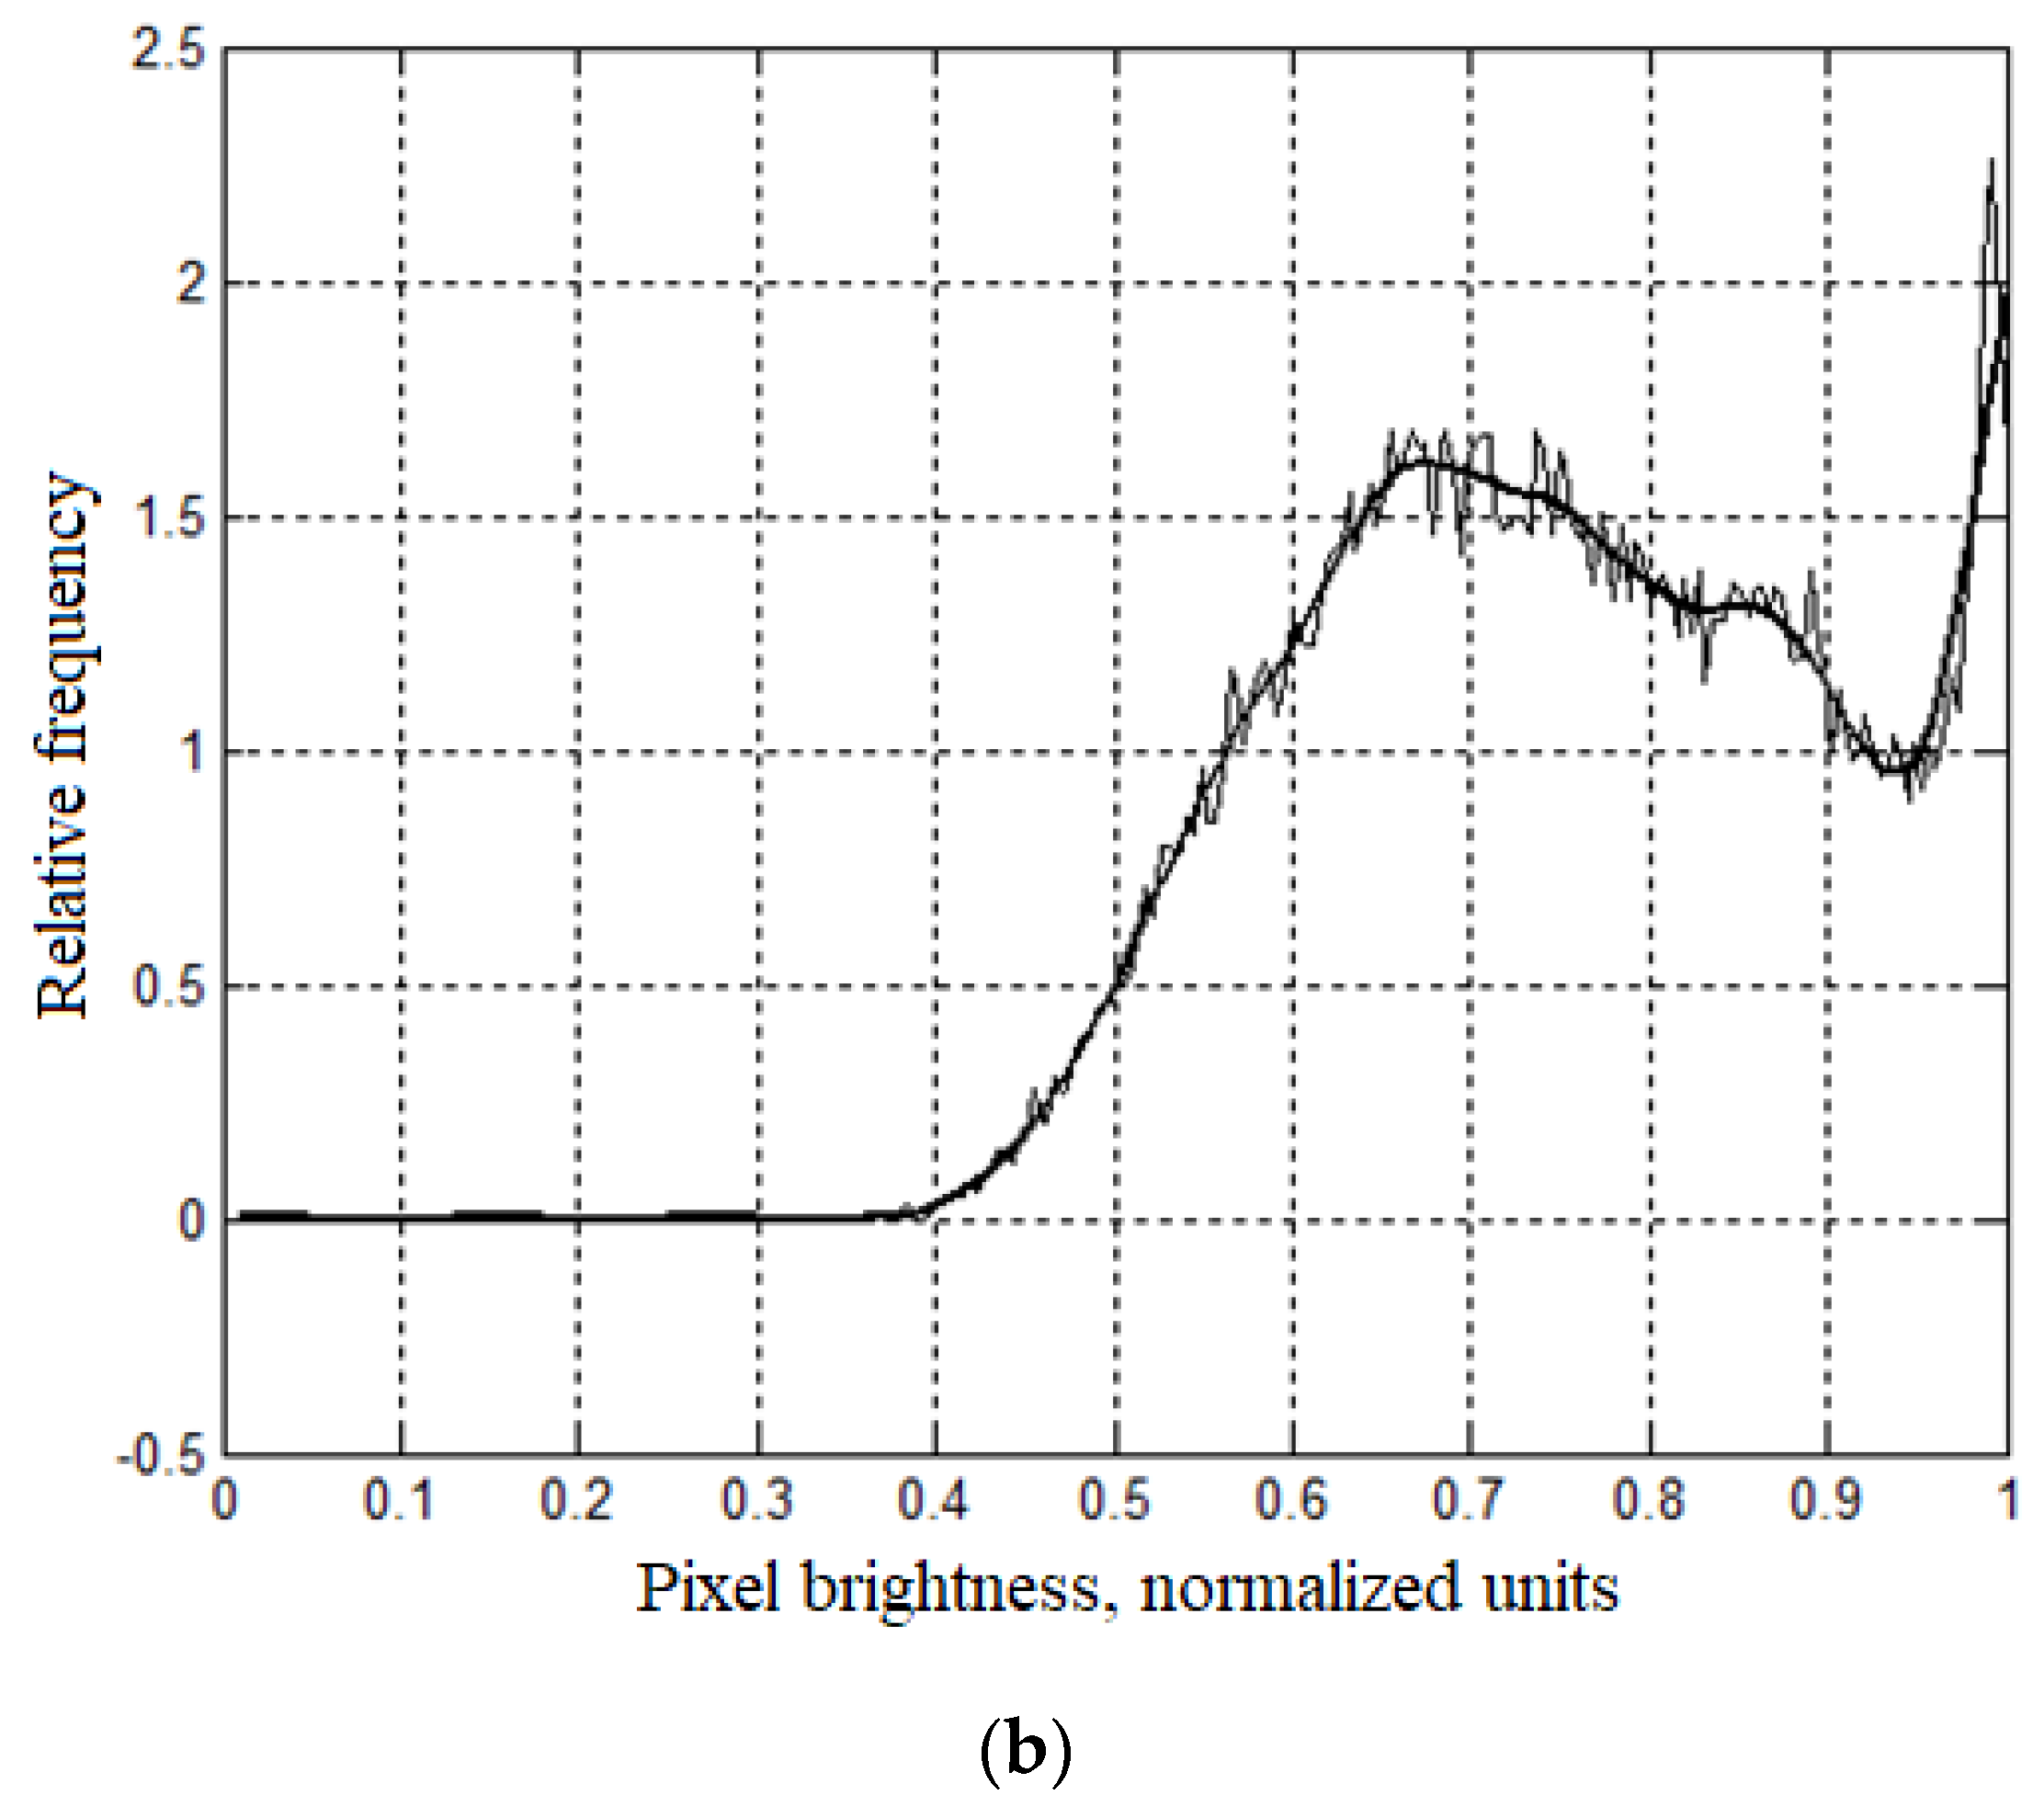
Figure 3. On MPI (see
Figure 2 and
Figure 3), there are areas consisting of pixels of maximum brightness that do not have an internal fractal structure. These regions appear on histograms in the form of singularities (see
Figure 4).
In the pertinent figures, SiO2 particles, the structure of chitosan, and its distribution are considered altogether. So, certain areas of the figure are shown less clearly.
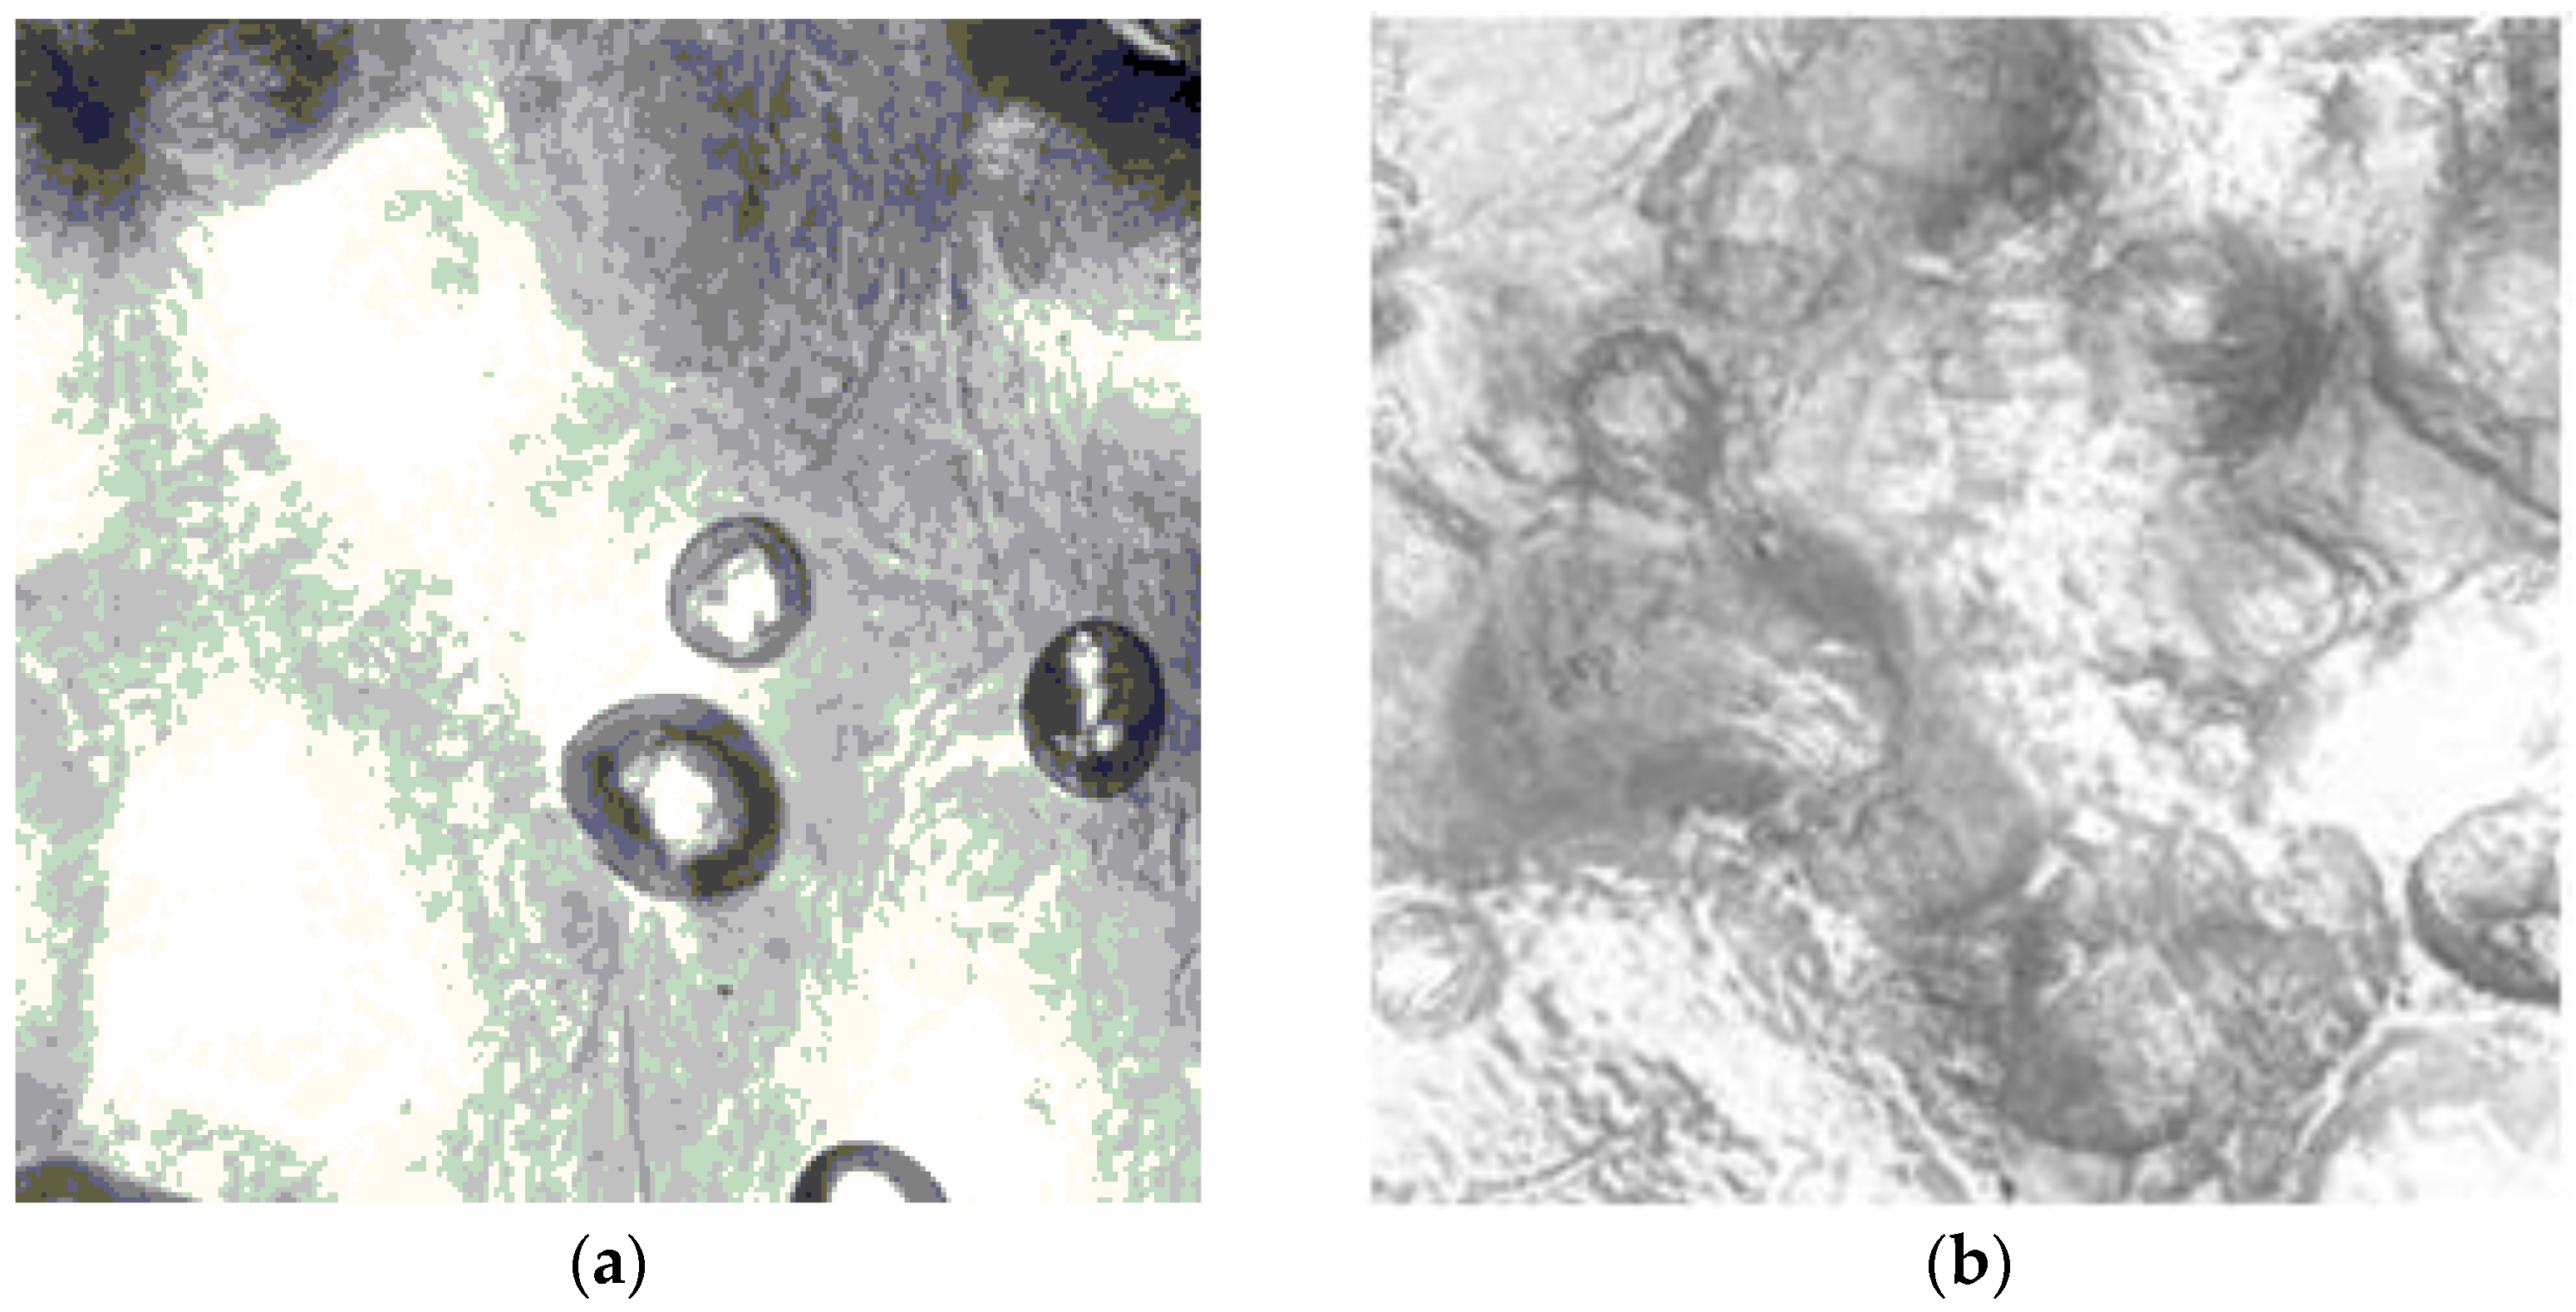
The results of the MPI conversion using a three-channel median filter (Algorithm Step 1.1) are shown in
Figure 3. Histograms of median filters (Algorithm Step 1.1) are shown in
Figure 4.
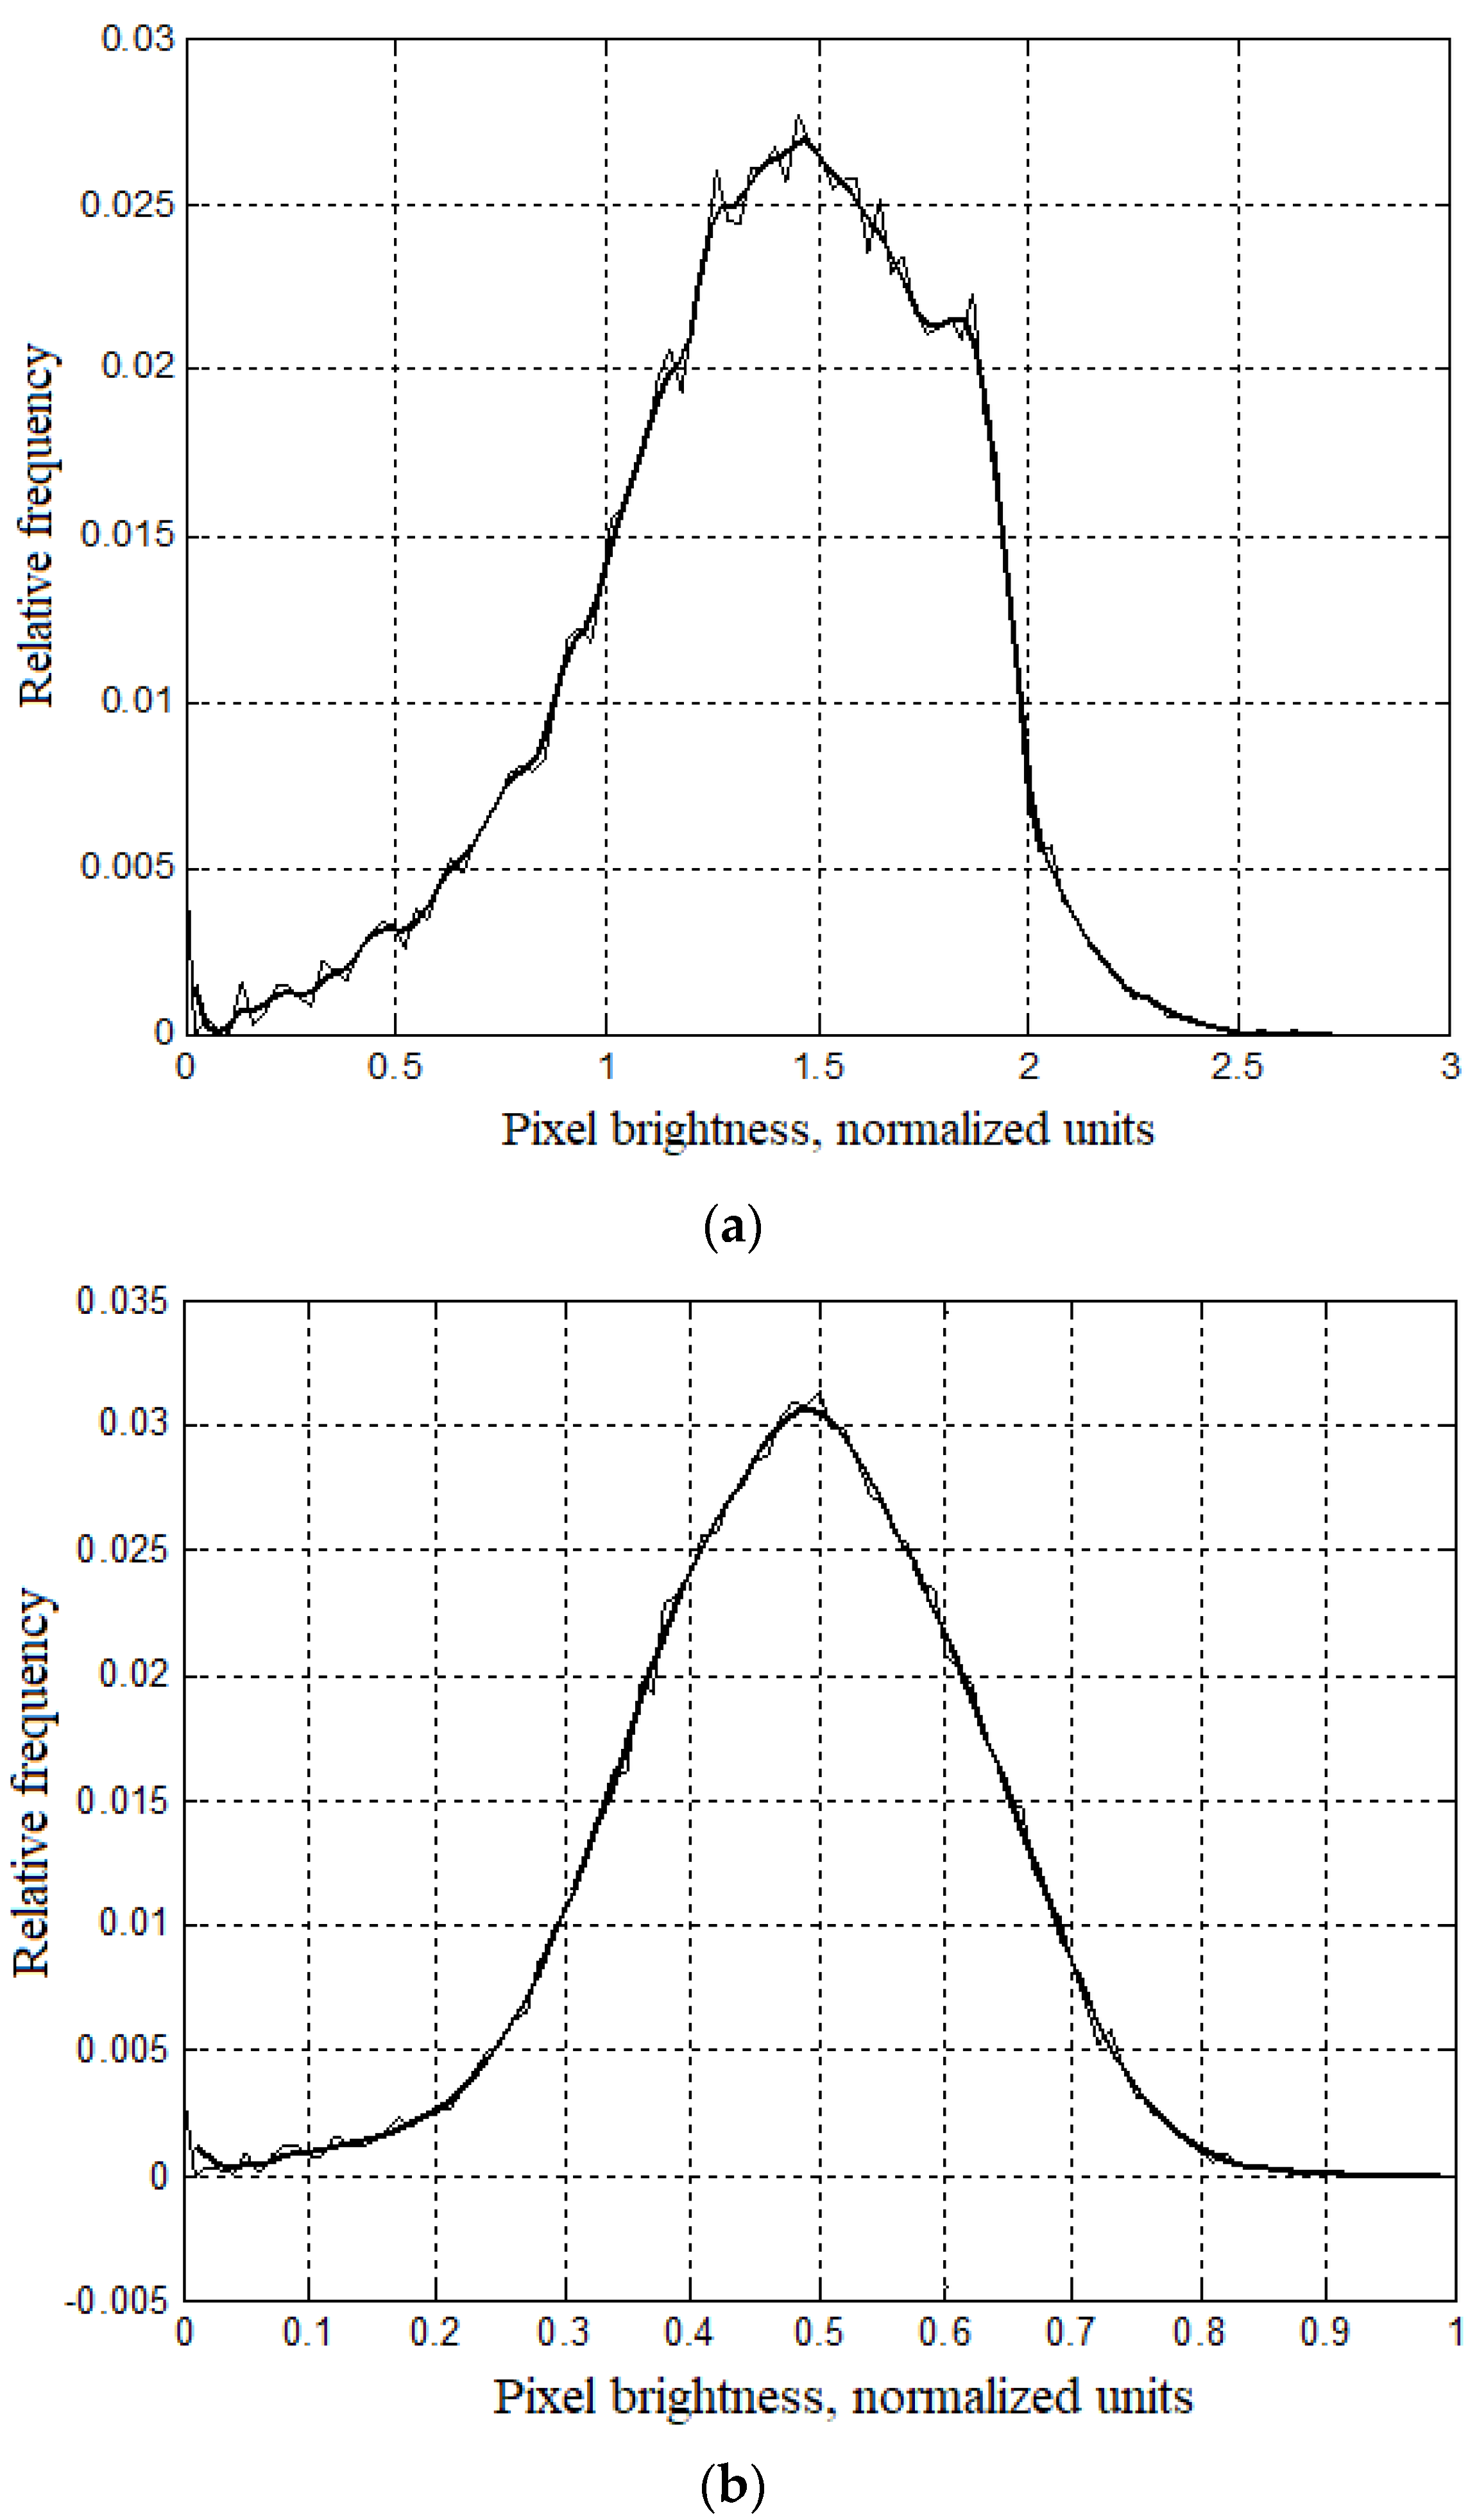
Figure 5 shows images of pixel brightness displayed by Helder exponents (Algorithm Step 2.4), and
Figure 6 shows histograms corresponding to these images. The Helder exponents are calculated using the sliding window method and using the fractal measure “iso” (see formula (1)). As follows, from
Figure 6, the pixel brightness distribution displayed by the Helder exponents has the form of a normal distribution, which corresponds to the theoretical understanding of the parabolic shape of the histogram near the maximum.
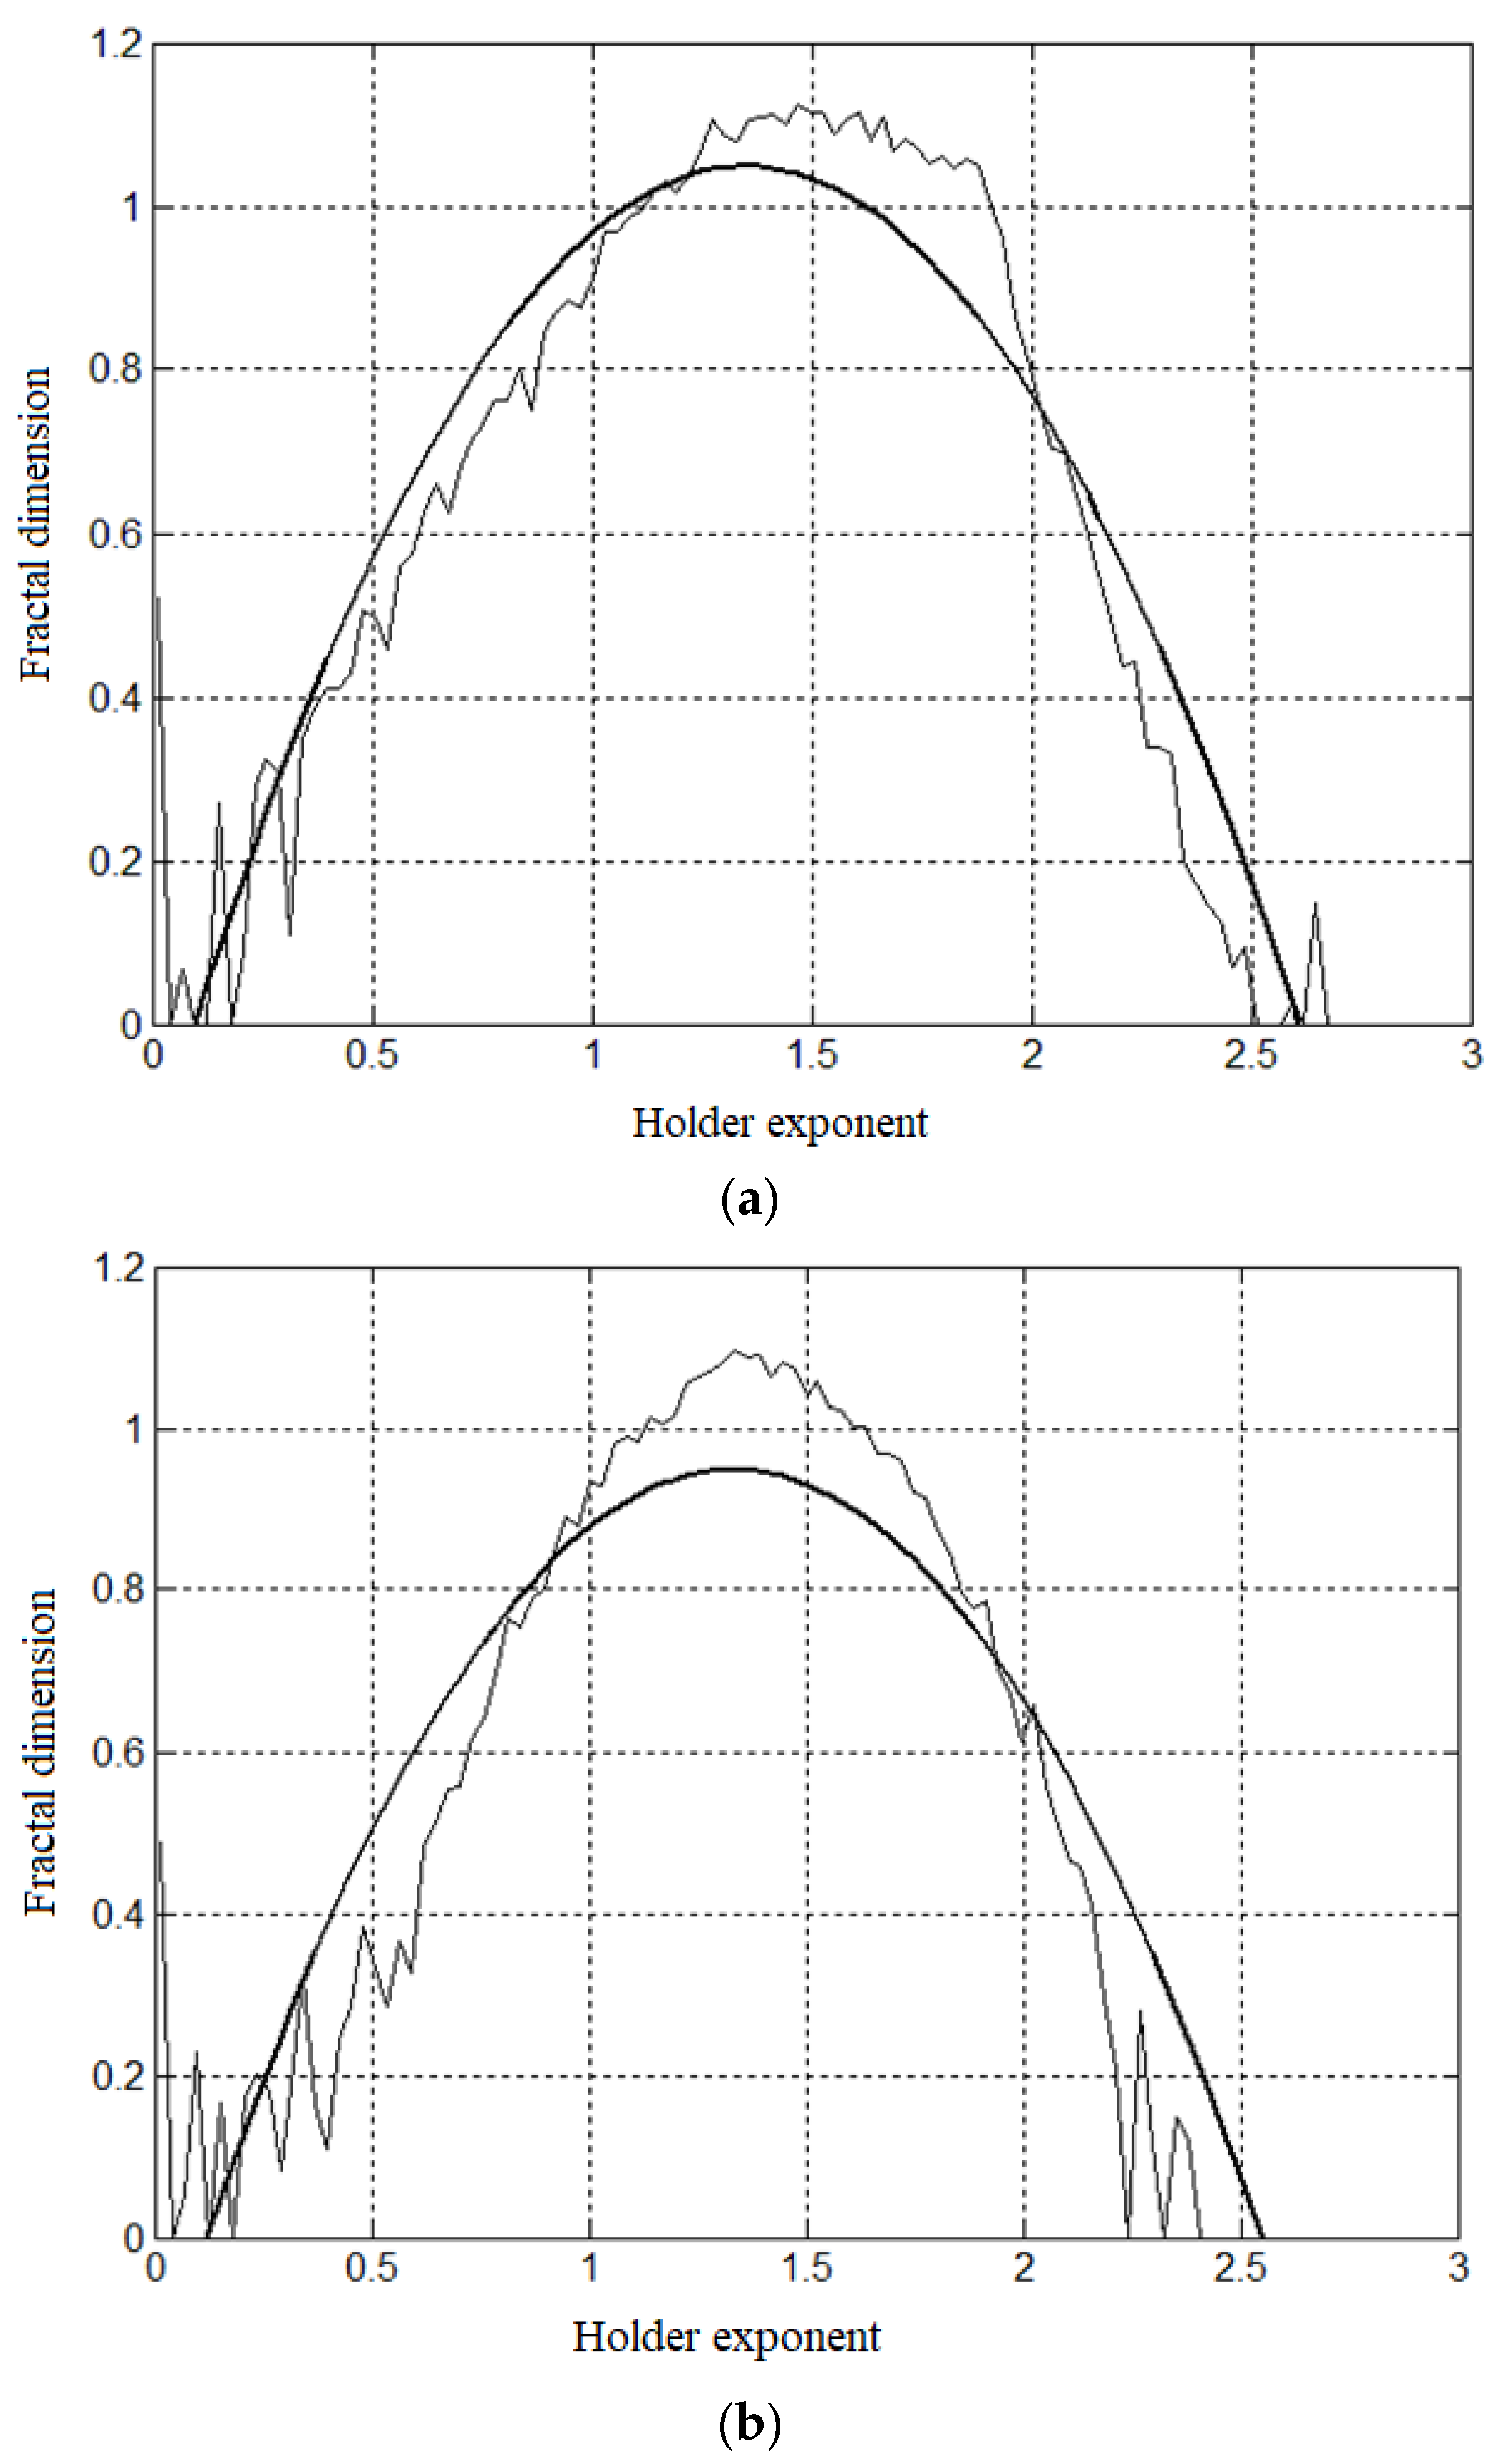
Figure 7 shows the multifractal spectra (Algorithm Steps 3.2 and 3.3). As follows, from
Figure 7, the multifractal spectra of the samples have a parabolic shape, which is probably due to the choice of the “iso measure” as an indicator of multifractality (see Formula (1)).
The multifractal spectra of
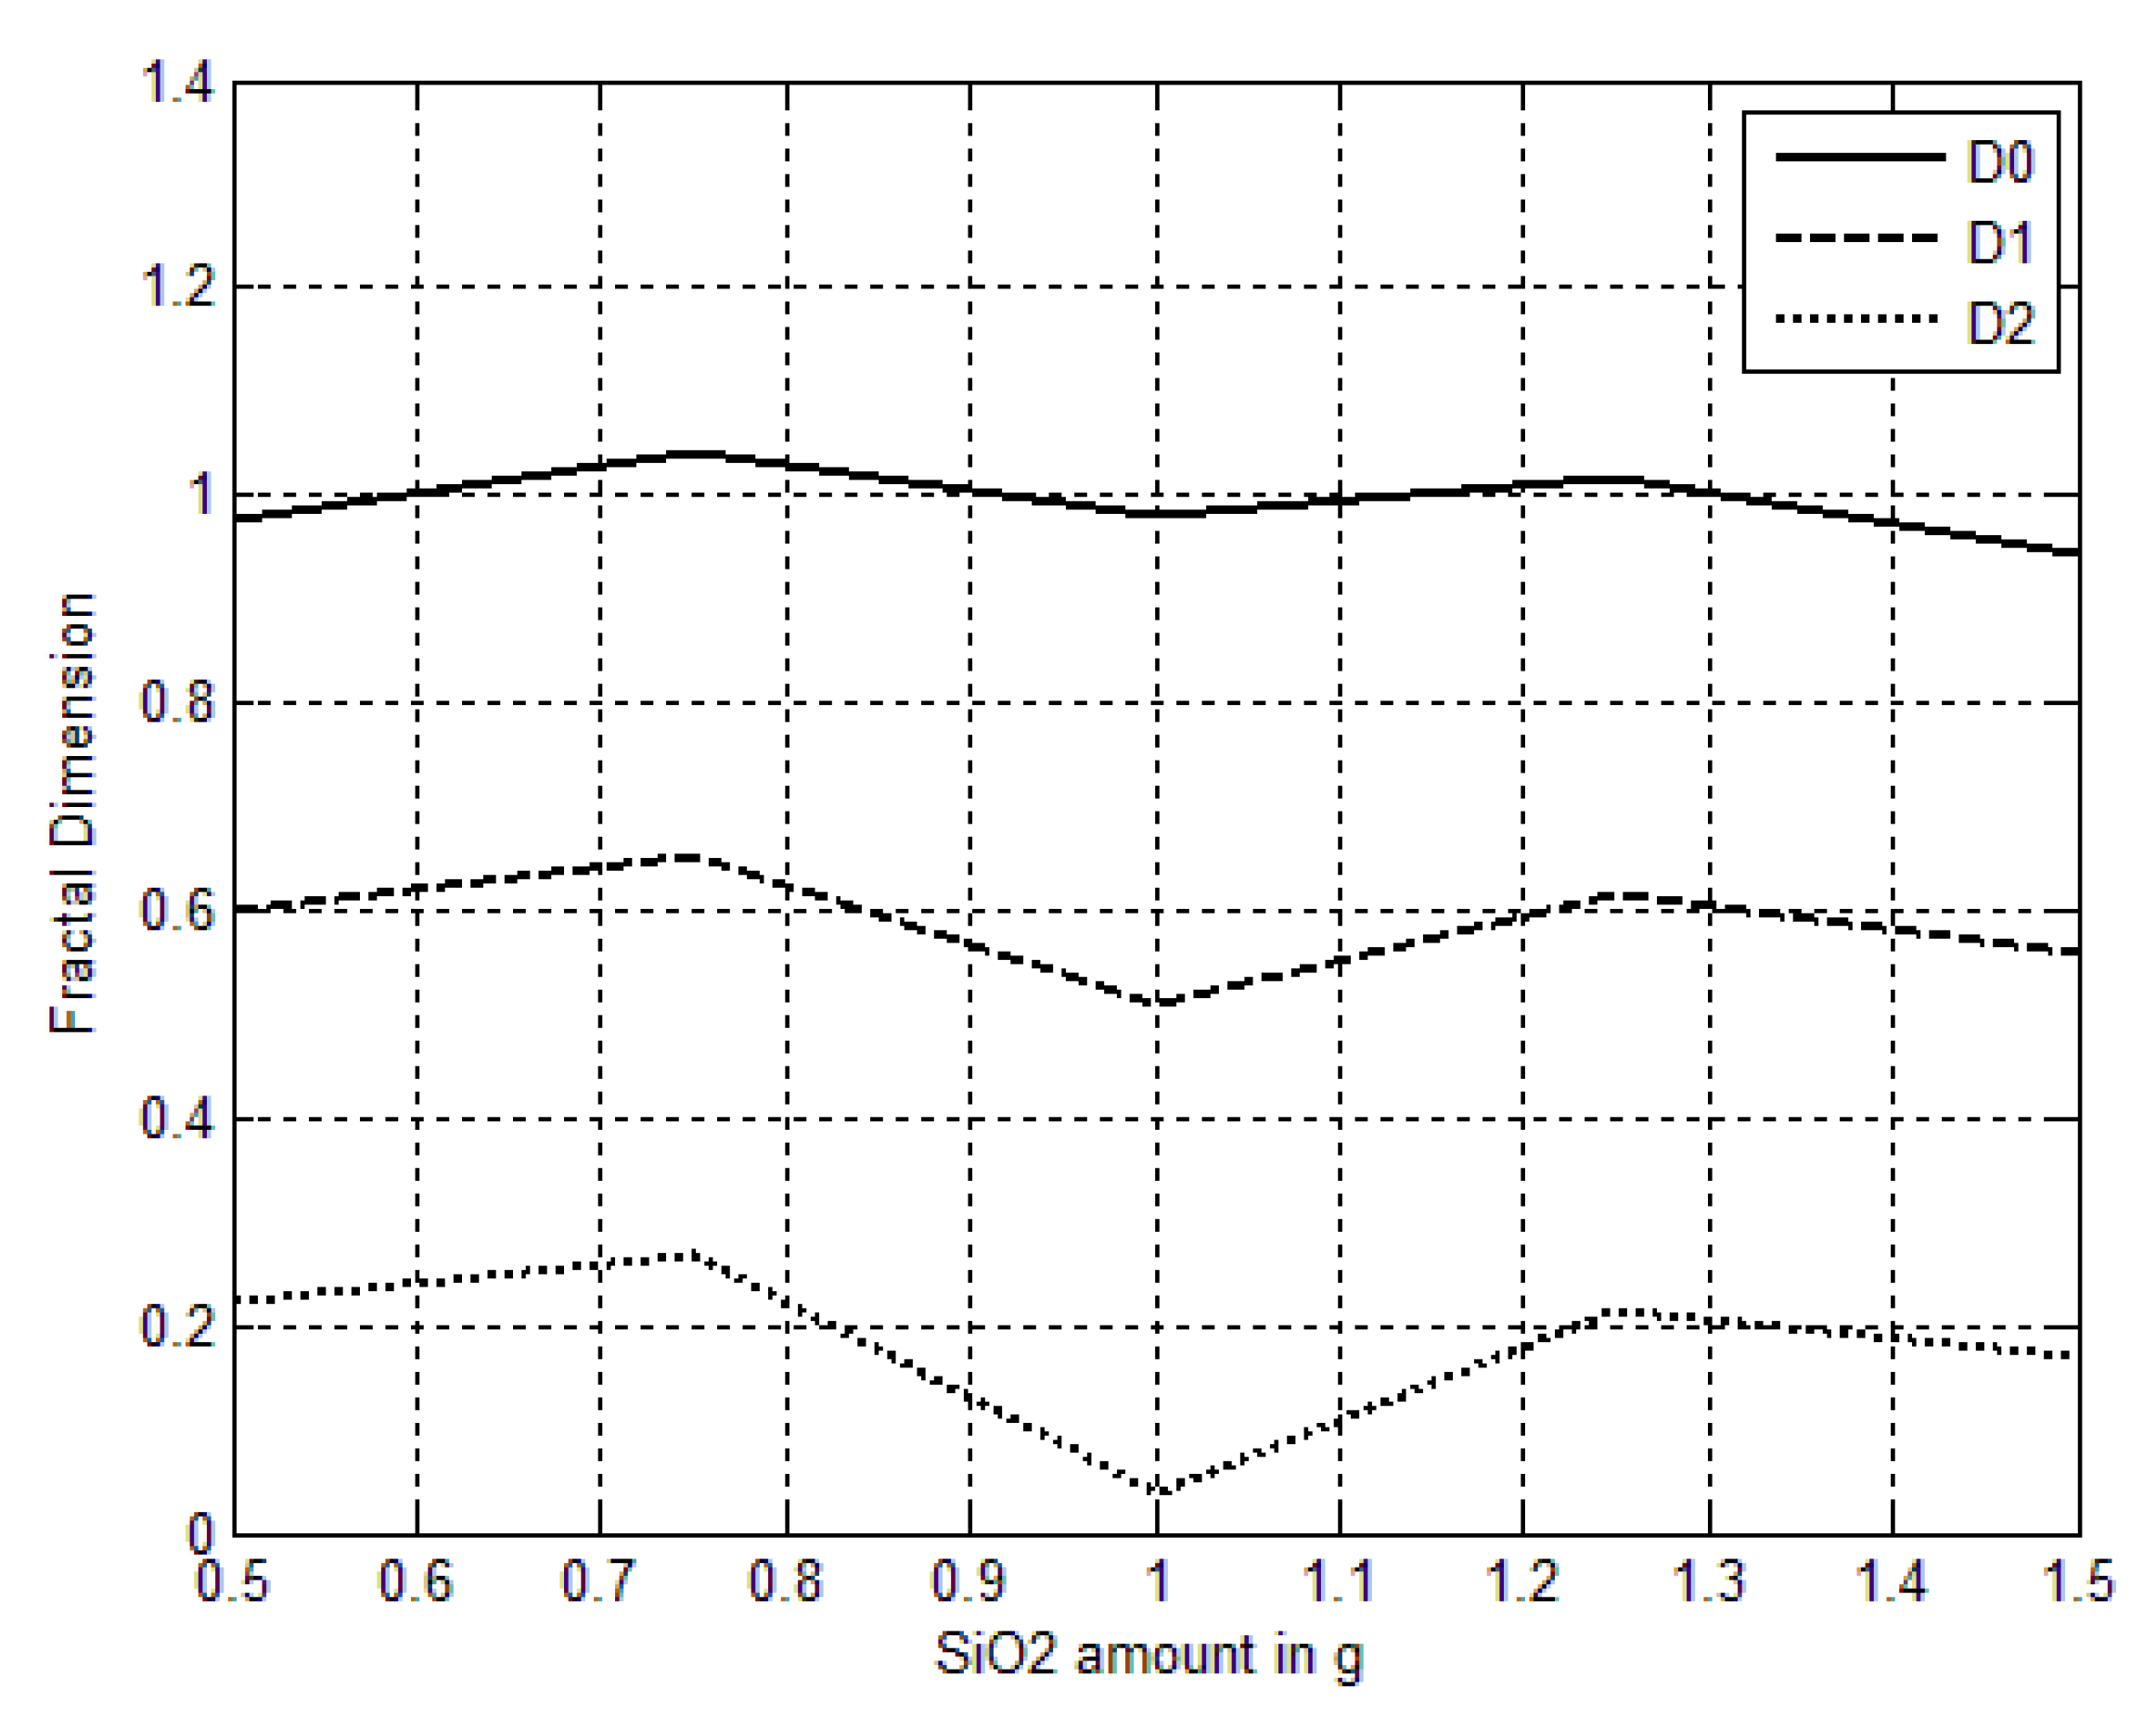
Figure 7 are used to calculate generalized fractal dimensions (Algorithm Step 4.2 and Stage 6):
, the graphs of which are shown in
Figure 8.
A distinctive feature of the graphs shown in
Figure 8 is their obvious and significant correlation.
Based on these results, it can be concluded that the silicon dioxide clusters formed in the texture of the BIN “chitosan-silicon dioxide” composite have the same effect on the generalized fractal dimensions of the MPI biopolymer of the inorganic composite.
As follows, from
Figure 8, the fractal generalized dimension D
0 is close to unity, which coincides with the topological dimension of the line. The correlative dimension
D2 has the lowest value. At the same time, the criterion
for the fractal dimension
D2 is the largest at about 50%. Considering that the generalized fractal dimension
D2 describes the magnitude of correlations between clusters of silicon dioxide particles in the structure of the BIN composite, it can be assumed that this dimension can be used as a measure for the formation of cluster agglomerates of silicon dioxide in the texture of the BIN “chitosan-silicon dioxide” composite.
The application of the developed original multifractal algorithm for quantitative evaluation of the results of mechanical tests on samples of the BIN “chitosan-silicon dioxide” composite with different amounts of silicon dioxide allowed to establish that such important indicators as strength and plasticity can be quantitatively described in the form of generalized fractal dimensions of pixel clusters on MPIs.
6. Practical Results of Experimental Studies of the Mechanical Properties of the BIN “Chitosan-Silicon Dioxide” Composite
Following mechanical tests of BIN composite samples, a statistical relationship was established between the strength of the samples and the amount of silicon dioxide in the BIN “chitosan-silicon dioxide” composite.
Following the initial analysis using an ALTAMI microscope, the manufactured samples of the BIN composite were subjected to mechanical tests conducted using the INSTRON 3382 Universal Testing Machine at the speed of 2 mm/min. Next, INSTRON Bluehill 2.0 software was used for numerical processing of these results.
Table 1 shows the results of measuring the strength of a BIN composite depending on the amount of silicon dioxide in its texture.
Table 2 presents the data used in the regression analysis of tensile strength of BIN composite samples.
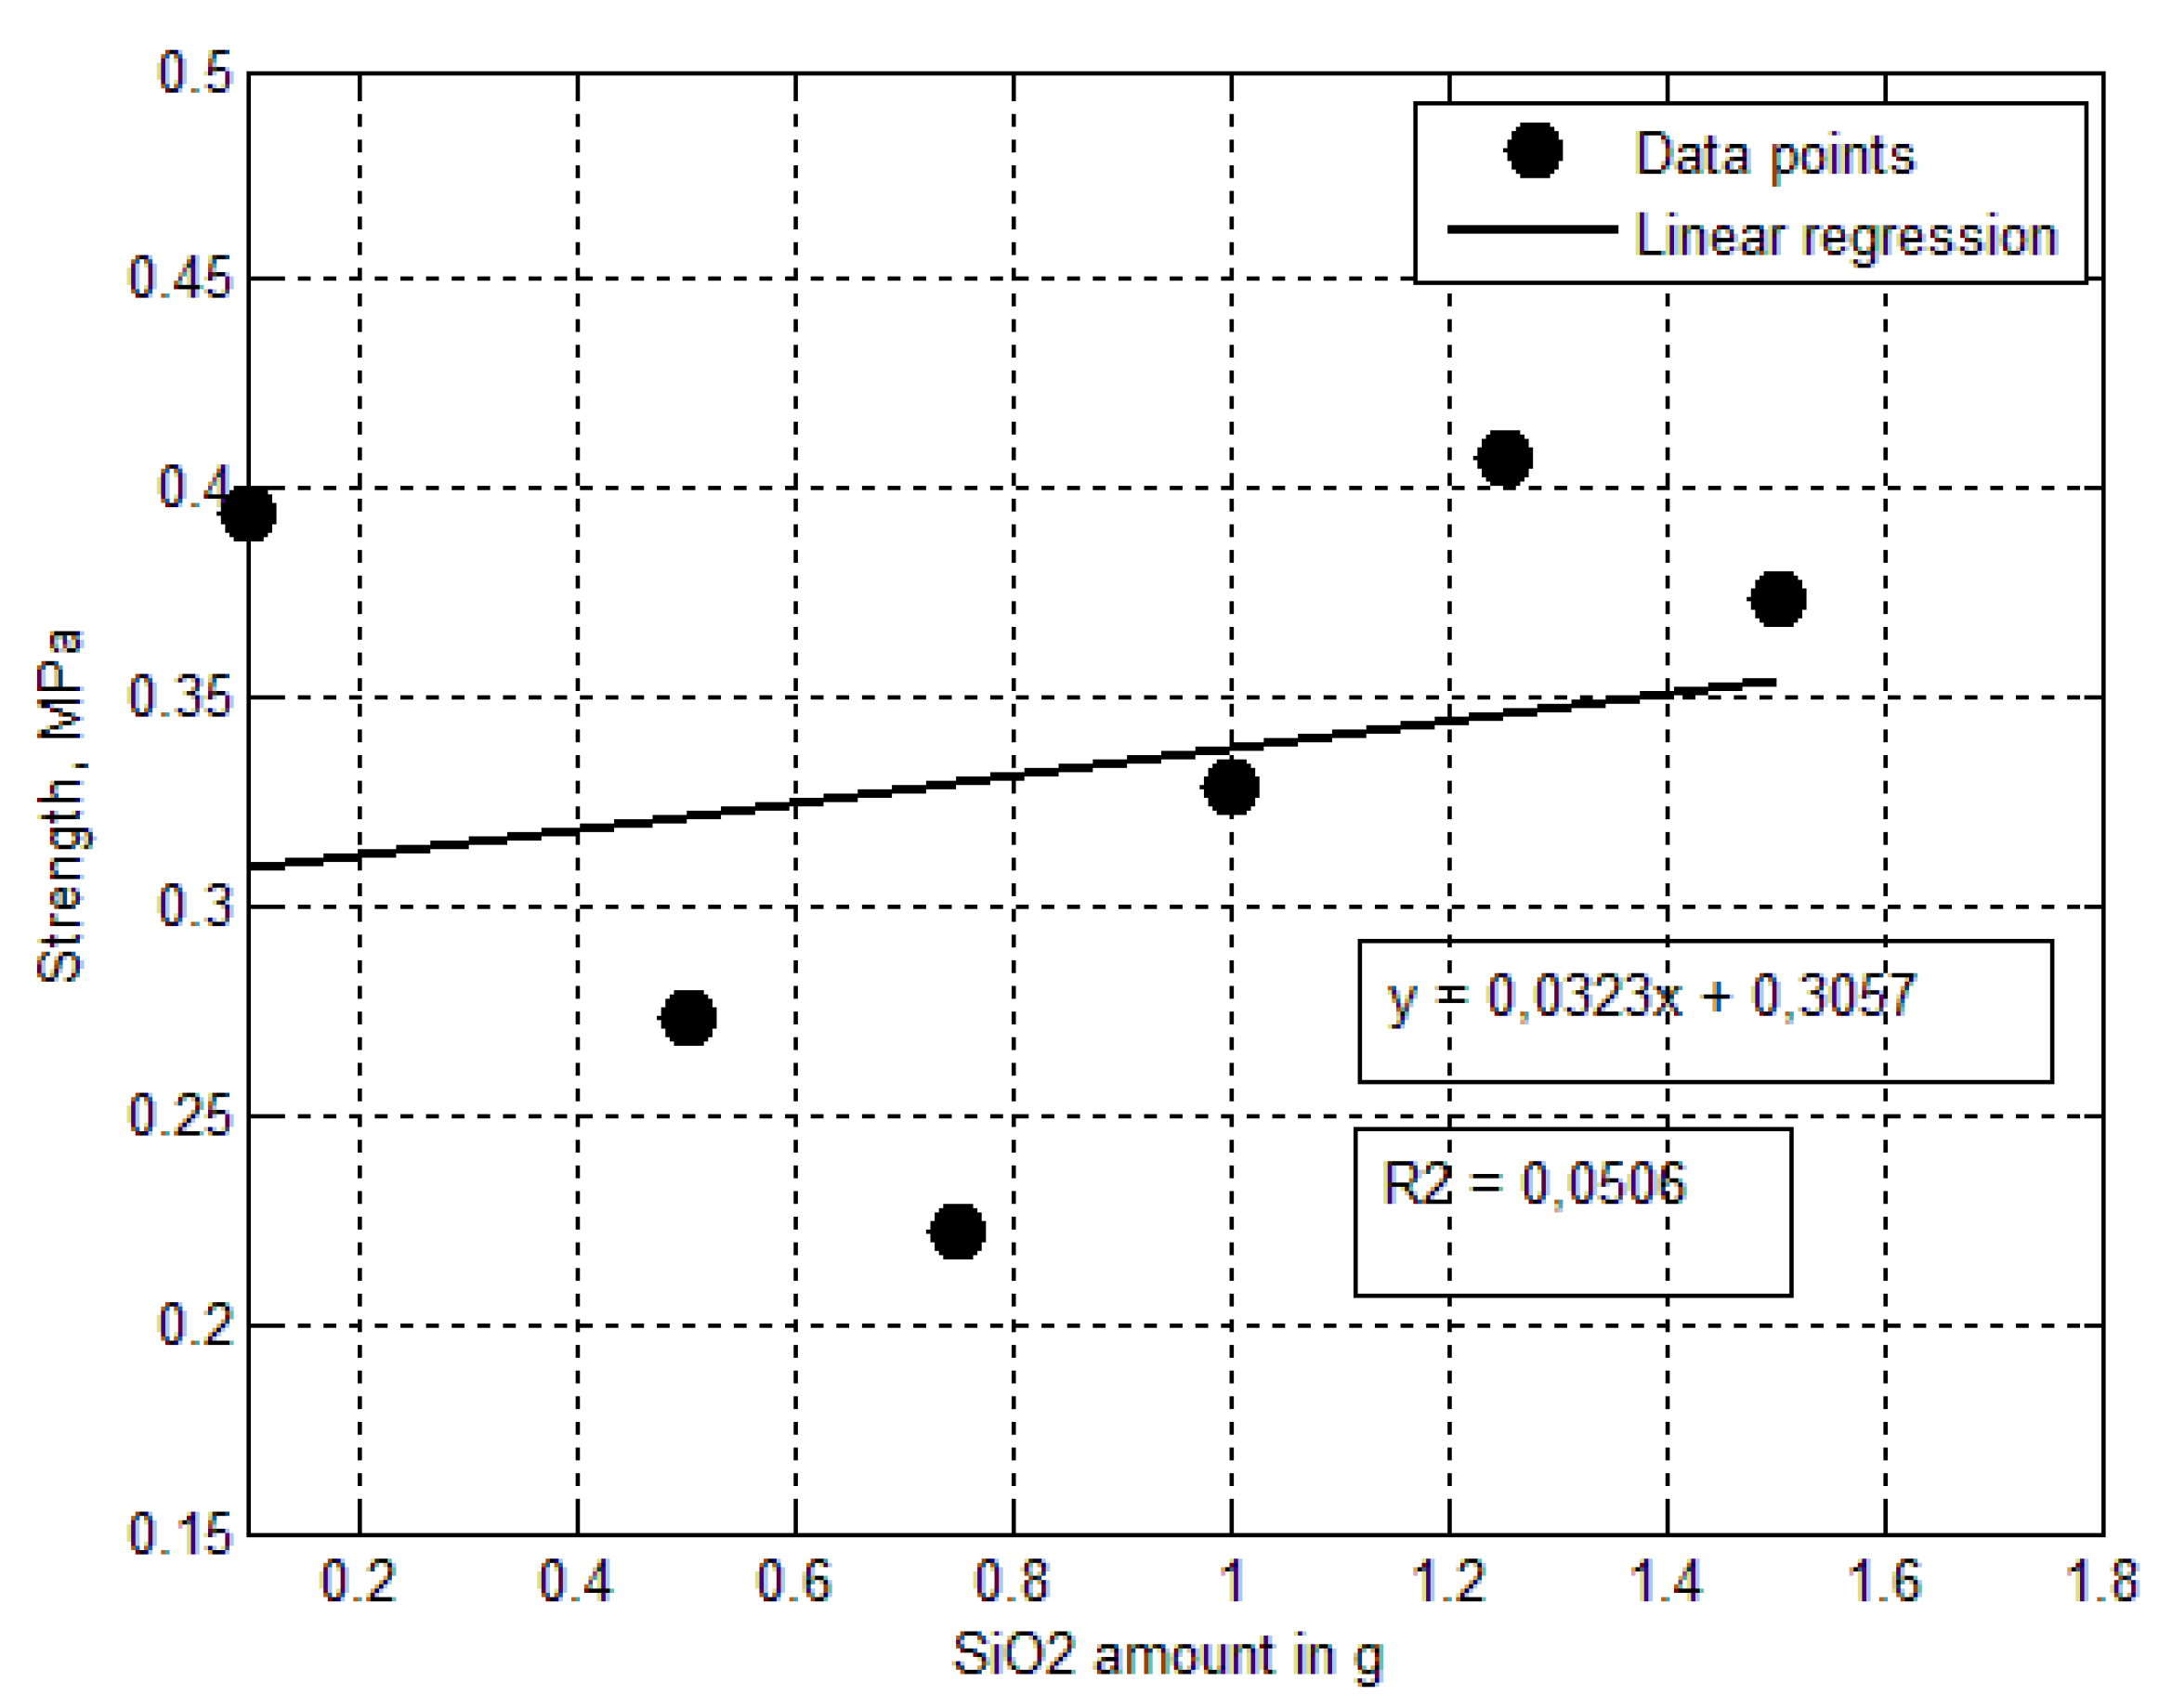
Figure 9 shows the results of calculations of linear regression dependence of the strength index on the amount of silicon dioxide in the samples. The criteria used are the angular coefficient of linear regression k ≈ 0.0323 MPa/g and the coefficient of determination
. Based on the analysis of the regression model, it was found that the tensile strength of the samples of the BIN “chitosan-silicon dioxide” composite decreases initially and then increases depending on the increase in silicon dioxide, while the plasticity of the samples decreases.
When silicon oxide is added, the strength properties decrease due to the resulting non-uniformity stresses and development of defects. When more SiO2 particles are added, hardening occurs in matrices with an increase in strength characteristics and a decrease in ductility characteristics.
Further addition of SiO2 particles leads to the appearance of their agglomerates in the matrix, an increase in porosity, and hence a decrease in strength.
7. Conclusions
1. As a result of studies conducted using the original multifractal algorithm of the MPI texture of the BIN “chitosan—silicon dioxide” composite, it was found that important characteristics of the BIN composite such as strength and plasticity can be quantitatively described using generalized fractal pixel dimensions of MPI samples.
2. The analysis of microphotographic images of BIN composite samples using the original multifractal texture algorithm showed that the criterion (σ is the standard deviation, is the arithmetic mean) characterizing the amount, concentration and density of silicon dioxide in the clusters formed at different amounts of SiO2 (0.5; 0.75; 1.0; 1.25; 1.5 g) has the following values of generalized fractal dimensions: D0 approximately 5%; D1—10%; D2—50%.
3. The generalized fractal dimension of Di pixels of microphotographic images of the BIN composite D2 can be used to evaluate both intra-cluster formations of silicon dioxide and inter-cluster correlations in the texture of the BIN composite, which quantitatively characterize the mechanical and physico-chemical properties of the composite.
4. The proposed multifractal algorithm for analyzing microphotographic images of the biopolymer texture of the inorganic “chitosan-silicon dioxide” composite was used to analyze the results of the study of mechanical properties of numerous samples of the BIN composite with different amounts of silicon dioxide. As a result, it was found that the tensile strength of samples of the BIN “chitosan-silicon dioxide” composite decreases initially and then increases depending on the increase in silicon dioxide, while the plasticity of the samples decreases.


 ,
, 


