Abstract
A transmission tower-line system consists of many towers and cables, which is a long-span structure. Due to topographical restrictions, the structure inevitably passes through wide areas prone to landslide hazards. The landslide causes the failure of the tower foundation and threatens the safety of the power transmission system. Therefore, the aim of this study was to investigate the collapse patterns of a transmission tower-line structure under landslides. The explicit analysis method was used to deal with the nonlinear dynamic response equations of the structure. To prove the effect of the landslides on the collapse patterns of the transmission tower-line structure, two foundation failure cases (Case 1 and Case 2) under landslides were considered. For each case, the displacement responses at tower tops and the progressive collapse behavior were analyzed, which illustrate that the failure patterns of the tower-line structure under landslides are dominated by two factors, i.e., the failure mode of the tower foundation and the pulling effect of cables. The overall tilting and hinge formation in the middle of the tower body are the main collapse patterns of the structure under Case 1 and Case 2, respectively. In addition, because of the pulling of cables, the collapse of one tower induced by the landslides always triggers the local failure of neighboring tower heads.
1. Introduction
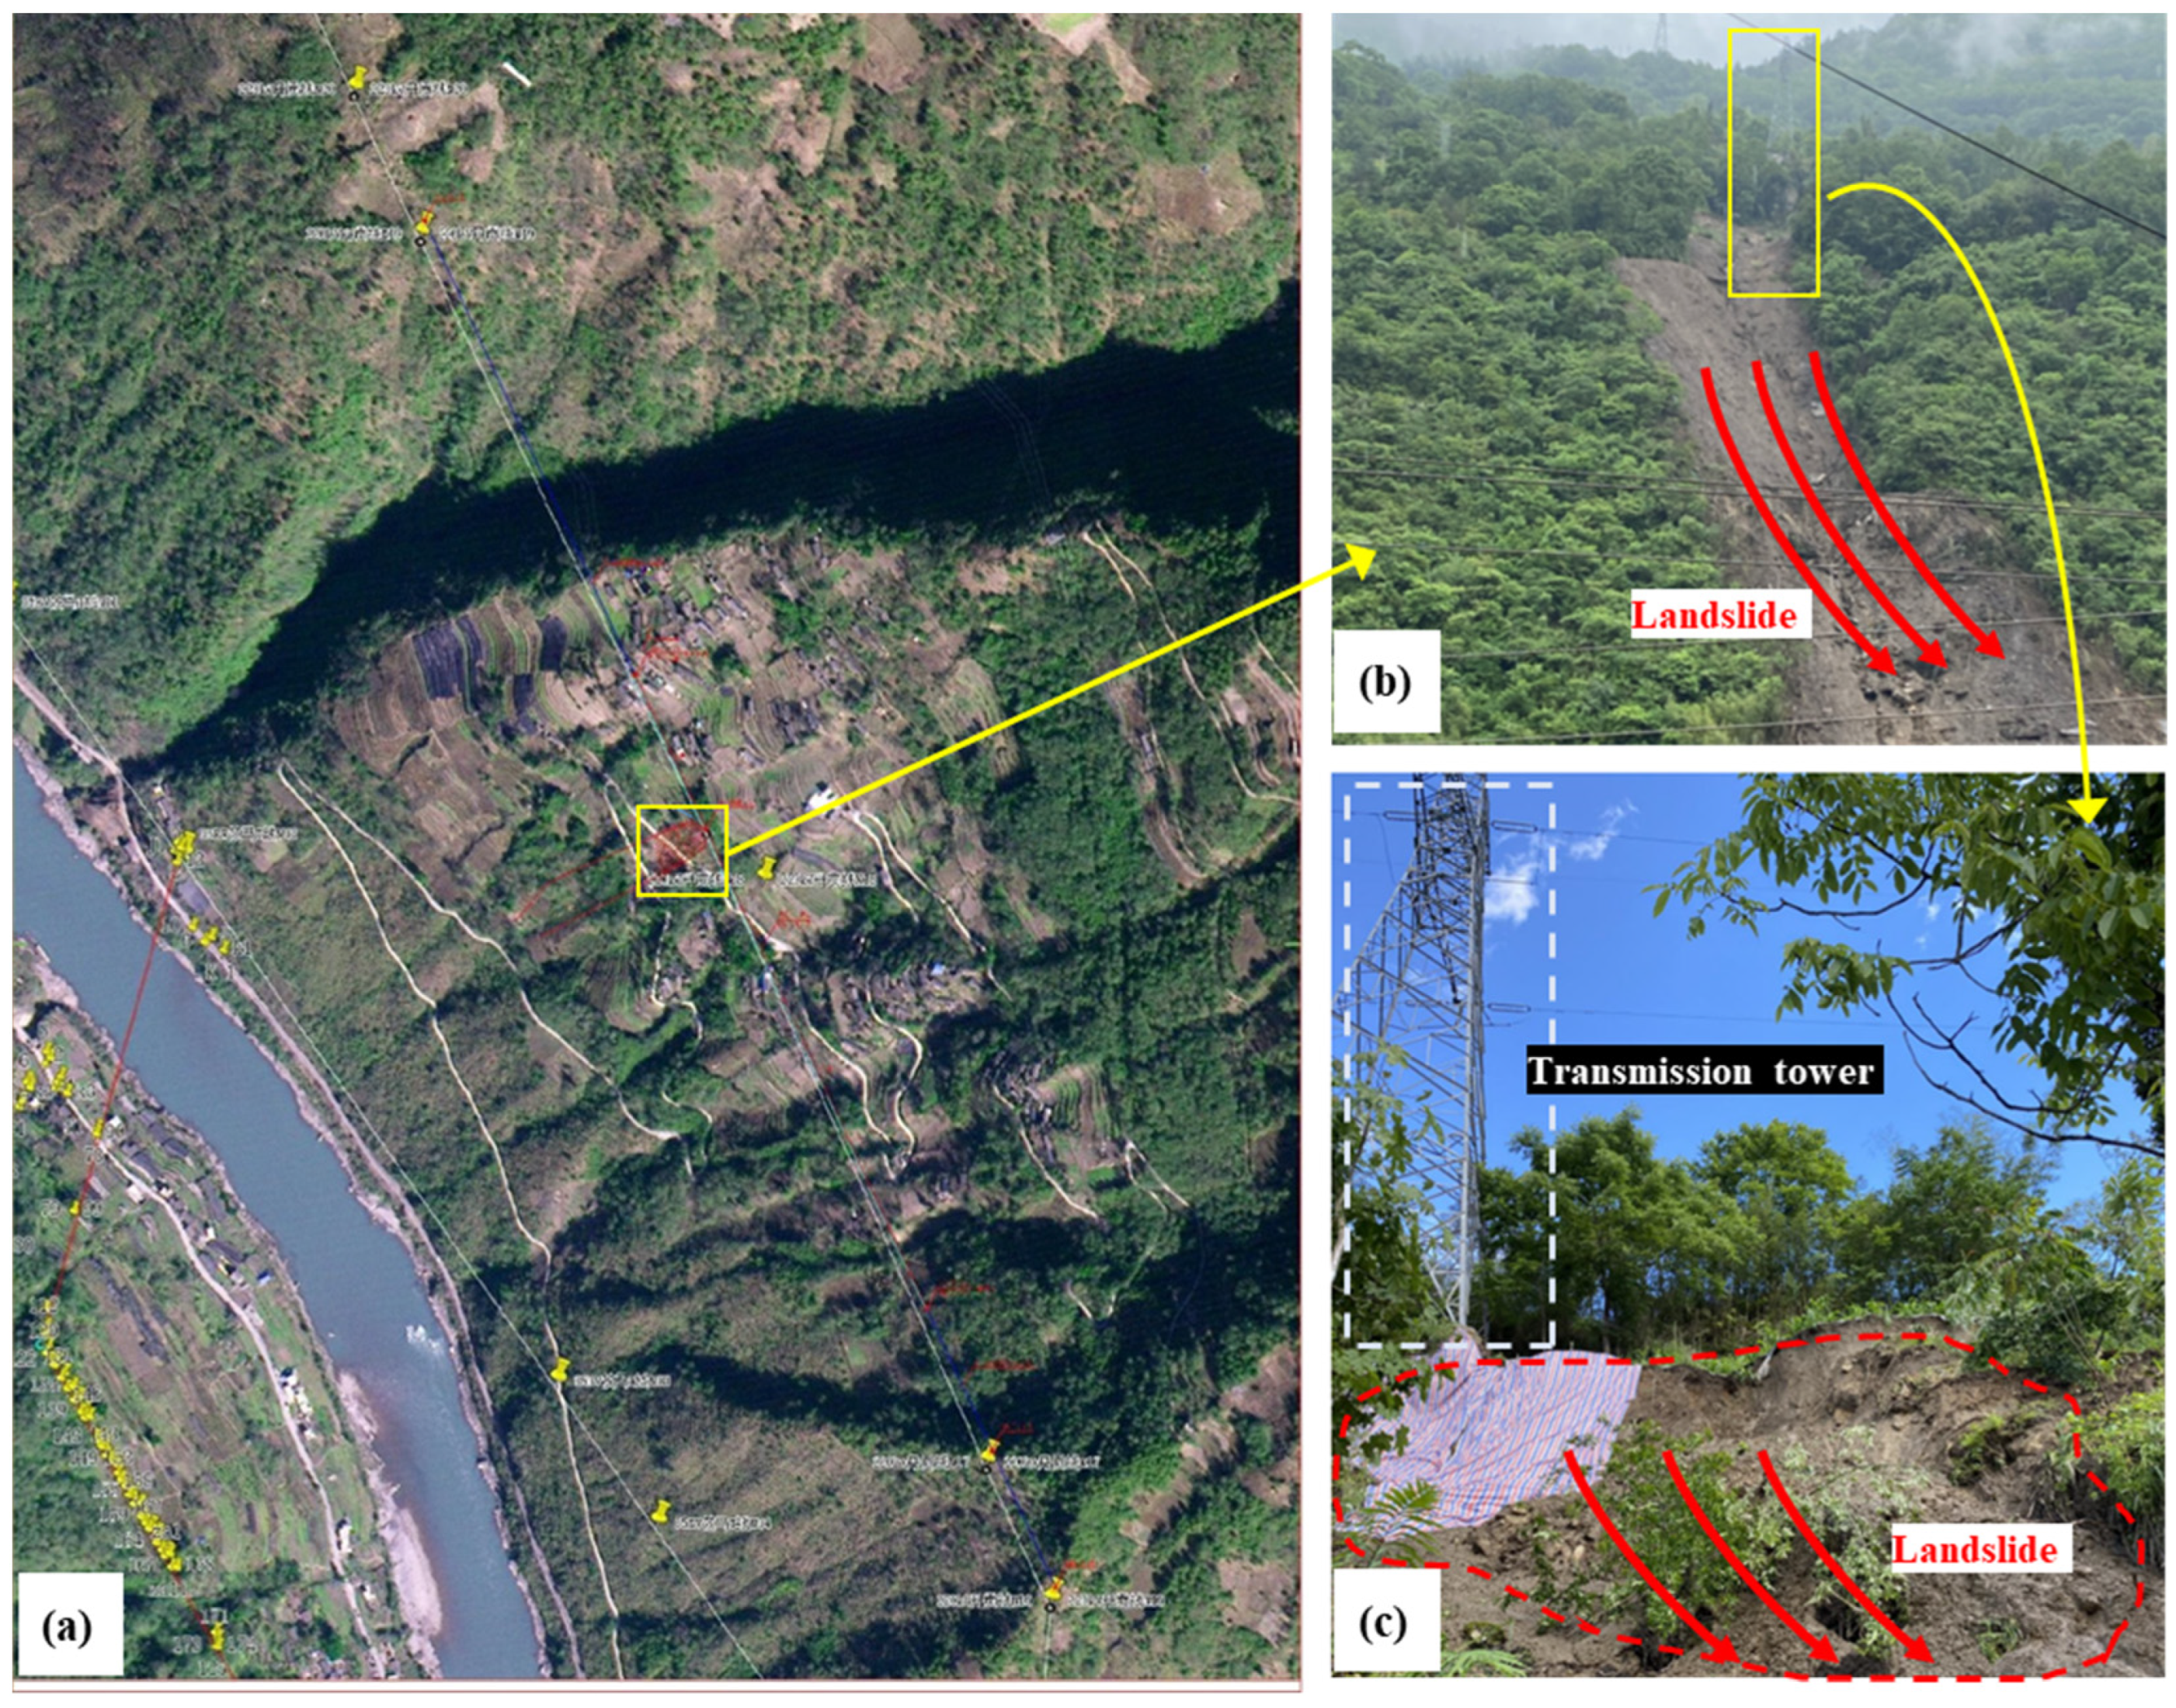
Due to the increasing demand for electricity, the malfunctions of the power grid can produce adverse effects on people’s livelihoods and the national economy. For example, the massive outage in the state of Texas in the United States [1] has caused a more than $200 billion economic loss [2] and 70 deaths [3], and the severe electricity shortage in China has caused financial and operational crises for many companies [4]. The tower-line structure is a carrier for the transmission of electric energy, which belongs to the main part of the power grids. For such a long-span structure, the towers are inevitably constructed on high-altitude mountainous areas, where the geohazard, especially the landslide, usually occurs at the steep slopes and ridges of the mountains [5]. Landslides can probably lead to the tilting and even collapse of transmission towers, as shown in Figure 1. A recent report [6] by China Electric Power Research indicates that there are more than 1500 transmission towers that are in the potential threat of landslides. Figure 2 illustrates the field pictures of the landslide located at Tower N18 in the Dan-Gong transmission line in China. Therefore, the investigation into the failure mechanisms of transmission tower-line structures under landslides is significant.
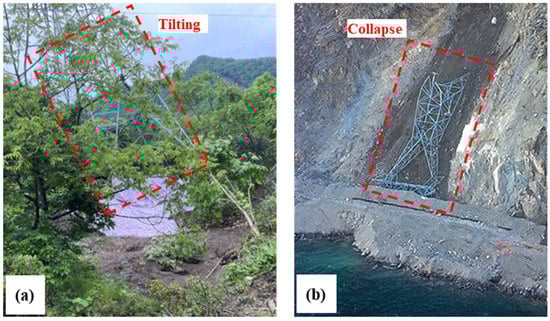
Figure 1.
The grid accidents induced by landslides: (a) tilting; (b) collapse.
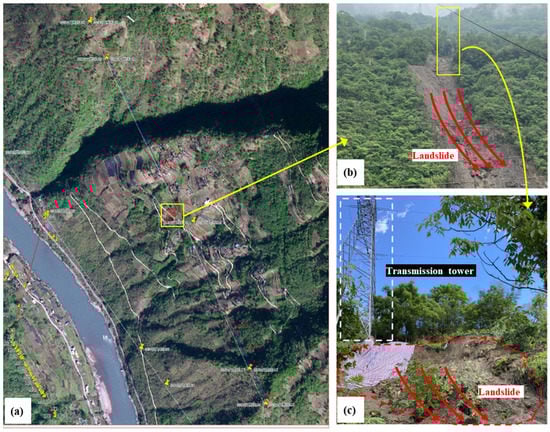
Figure 2.
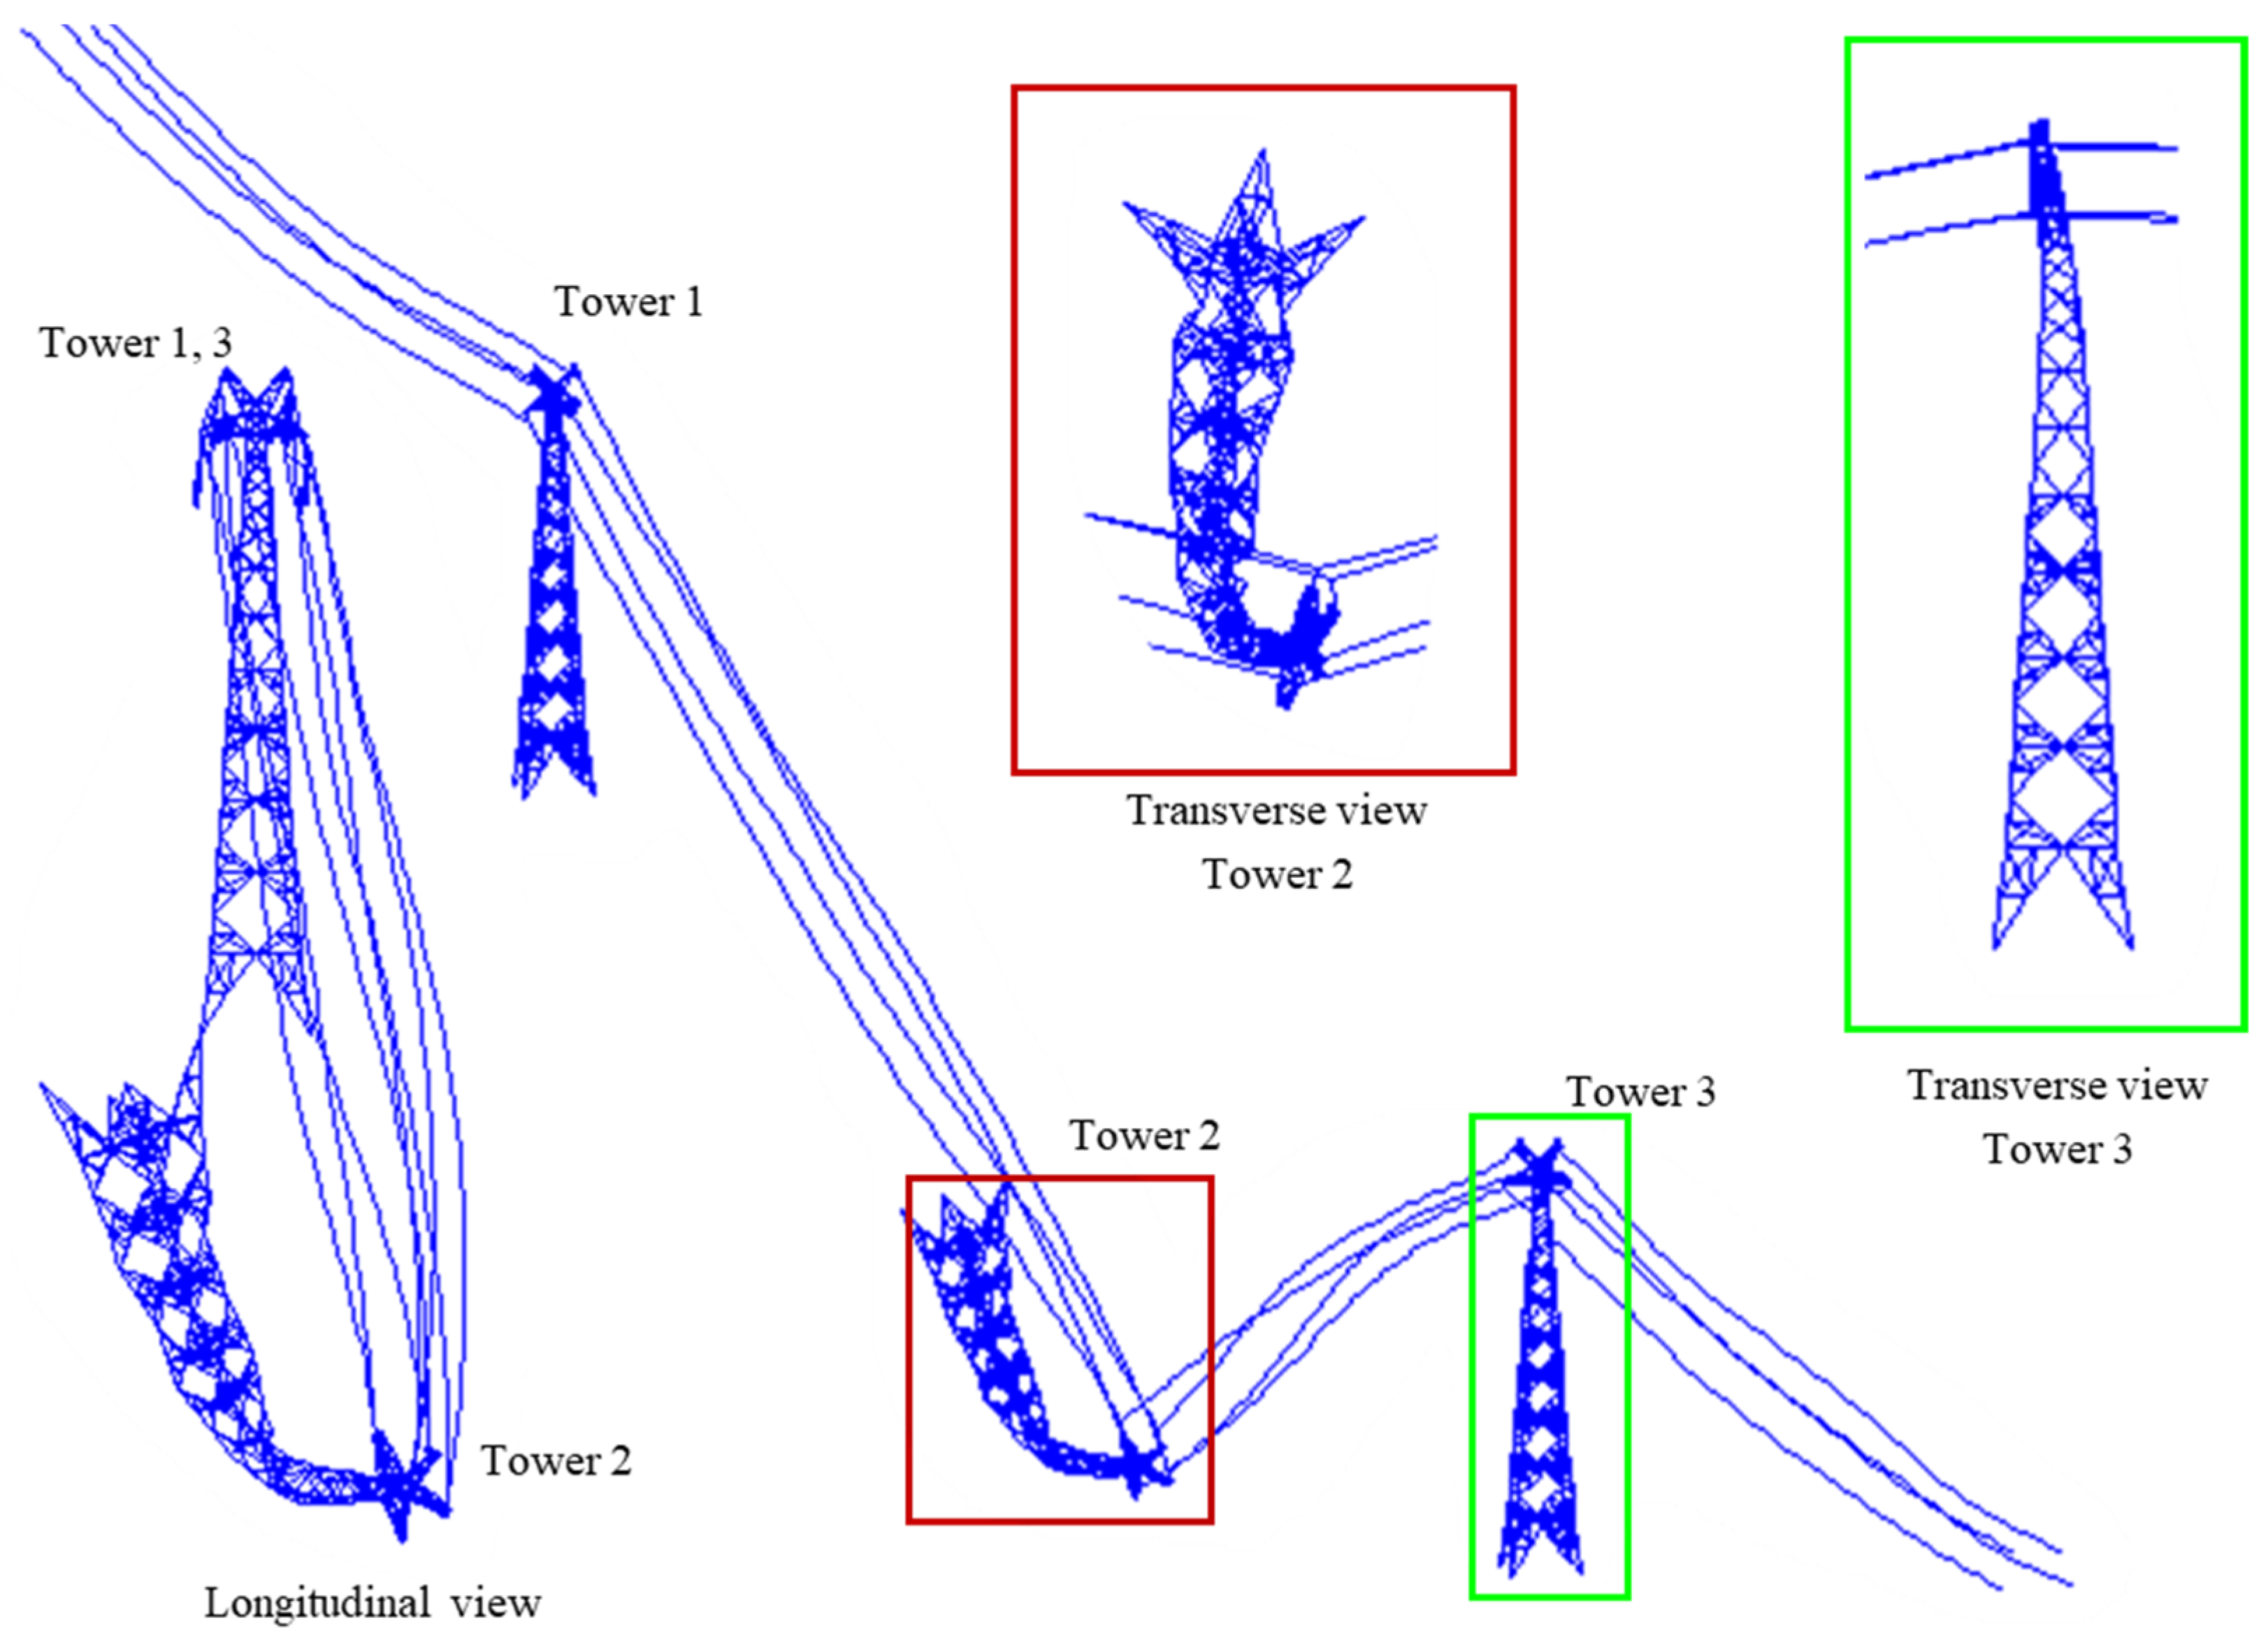
The landslide located at tower N18 in the Dan-Gong transmission line: (a) general view of the landslide, with the yellow rectangle locating the position of the tower; (b) landslide at the foundation of the tower; (c) landslide at one leg of the tower (photographed by authors).
Landslide events can be induced by earthquakes and rainfall and they are a major geomorphological process that influences landscape evolution in mountainous areas [7]. The mechanism of the development of the landslide has been studied by many researchers. Some studies [8,9,10,11] have investigated the effect of various influential factors, such as the slope angle, slope height, geological structure, and rock type, on the landslide spatial distribution. In addition, the landslide travel distance has also been evaluated by the theoretical model [12], empirical model [13,14], and numerical model [15]. Because the essential input parameters in the theoretical and numerical models are difficult to be measured during the landslide movement [16], the two models need to be greatly simplified through many assumptions. The empirical model follows the rules that are calibrated based on the experimental and field-measured data. It can describe the landslide using simple mathematical formulas and therefore it is more popular than the other two above-mentioned models.
The transmission tower-line system consists of many towers, which are connected by a series of cables. For this type of structure, the progressive collapse behavior usually occurs [17,18]. Therefore, some studies have been conducted to investigate the nonlinear dynamic response of transmission tower-line systems under extreme environmental conditions [19,20,21,22,23]. Zheng and Fan [19] investigated the progressive collapse mechanisms of a tower-line system subjected to hurricanes through fully coupled dynamic simulations, showing that the collapsed transmission tower would lead to the cascade collapse of the neighboring towers. Kassem et al. [20] also conducted a comparative study on the failure patterns of a transmission tower under far-field and near-field earthquakes. Li et al. [21] investigated the collapse mechanism and failure modes of the transmission tower under strong wind load, showing that the wind-induced coefficients in the current design code are not accurate enough. Fu et al. [22] comprehensively evaluated the failure modes of a transmission tower under combined wind and rain loads and they provided a critical collapse surface to quickly and conveniently judge the structural failure states at different wind intensities. However, the above-mentioned studies are mainly on the failure patterns of tower-line structures under hurricanes, earthquakes, and so on, whereas the relevant research for the structures subjected to landslides is scarce. Though one study [24] has tried to identify the failure modes of transmission tower foundations under landslides, the consequent collapse patterns of the tower-line structures have not been investigated yet.
In this research, we selected a segment of the transmission tower-line system over the Yangtze River as the study object. The nonlinear dynamic response and the collapse process of the structure under landslides were simulated. To deal with the discontinuous problems involved in the collapse simulations, the MATLAB code based on the explicit computation method was adopted. Two failure cases under landslides were considered. For each case, the structural displacement response and the collapse scenarios at the specified moments were analyzed and the corresponding collapse mechanisms of the transmission tower-line system under landslides were then identified.
2. The Yanzi Landslide
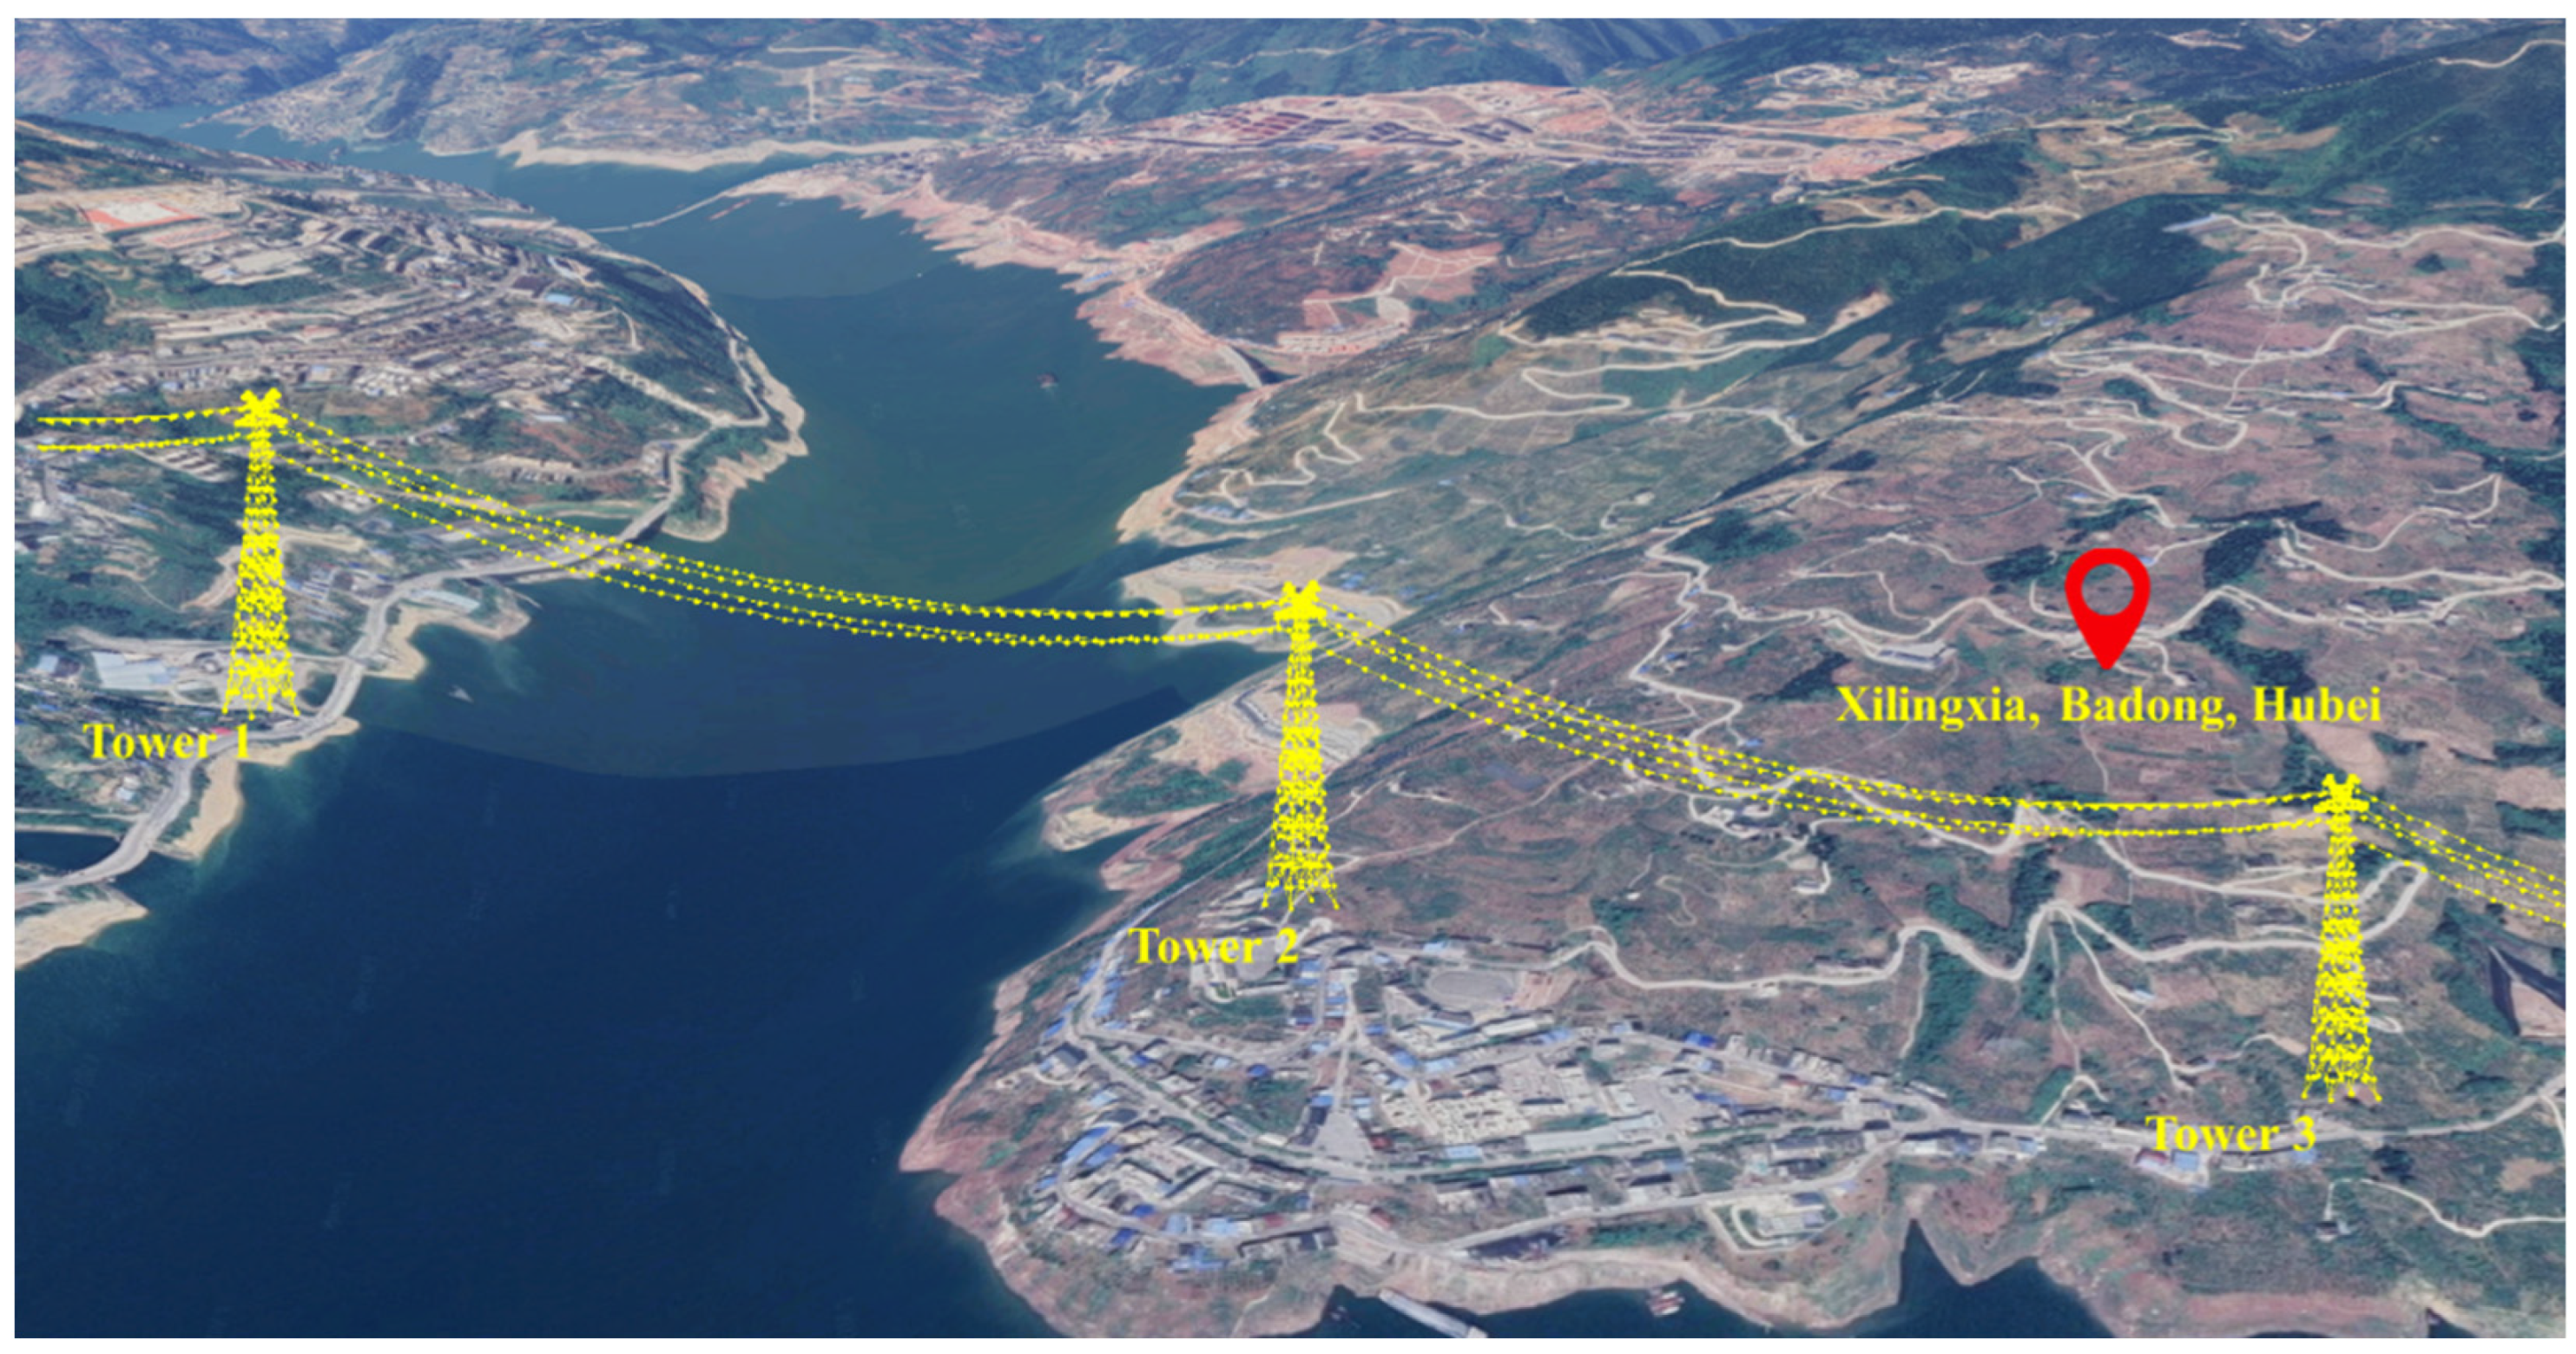
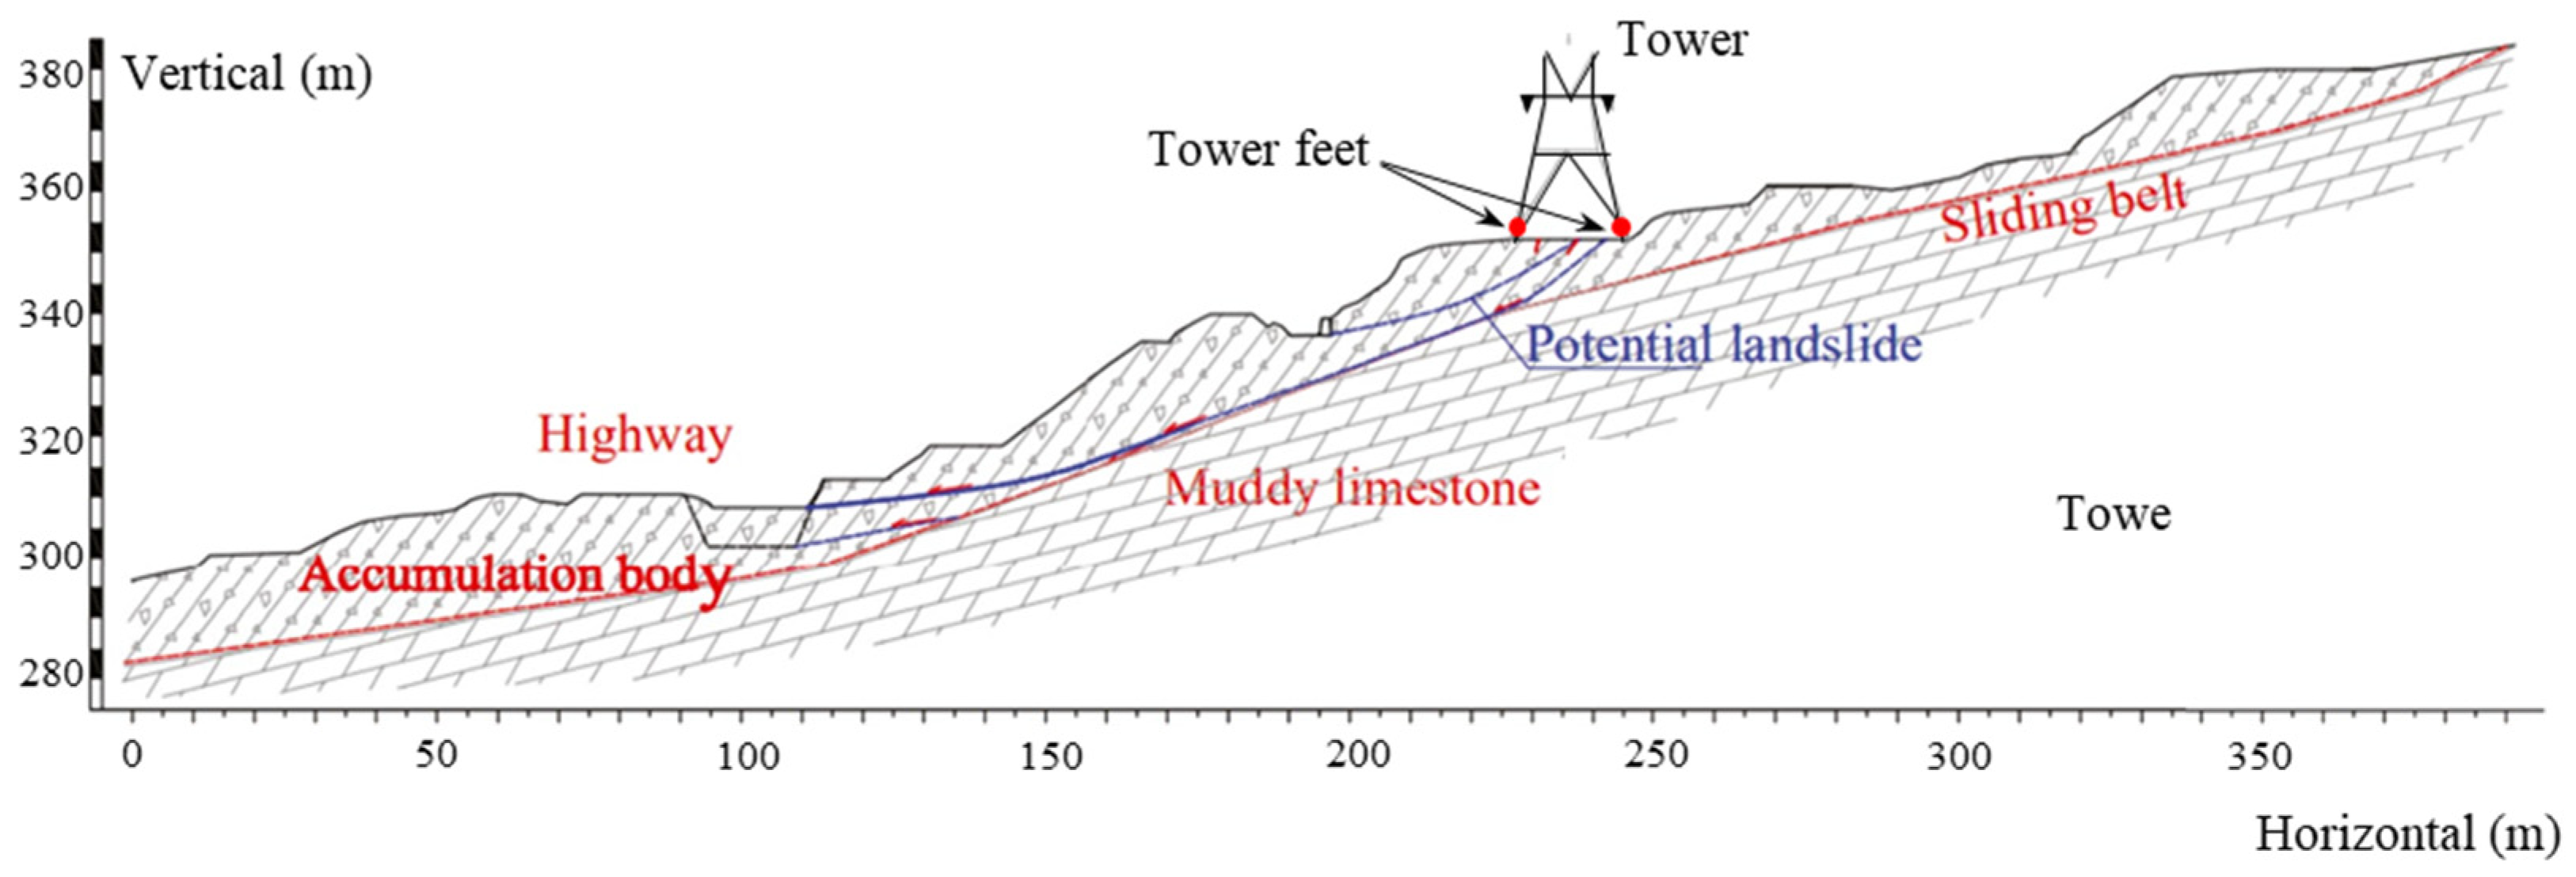
As shown in Figure 3, the Yanzi landslide is located in the power transmission zone (Tower 2) from Wuxia to Xilingxia. The overall terrain is low in the east and north and high in the west and south, where the volume of the landslide body is about 60 × 104 m3 with an area of 60 × 104 m2 and an average thickness of 10 m [24]. The landslide body looks like a long tongue, which has a slope of about 25–40 degrees. The material composition of the landslide is characterized by the silty clay mixed with gravel soil. The slipping zone is the contact surface between the overlying deposits and the bedrock, as shown in Figure 4. Since 2002, the Yanzi landslide has shown many creep-related slipping events due to rainfall and many cracks have presented on the surface of the slope. Then, the G209 National Highway was constructed through the slope and a 100 mm crack formed between the transmission tower feet. More information about the Yanzi landslide can be found in Ref. [24].

Figure 3.
River-crossing transmission tower-line system (Google Maps, 17 August 2022).
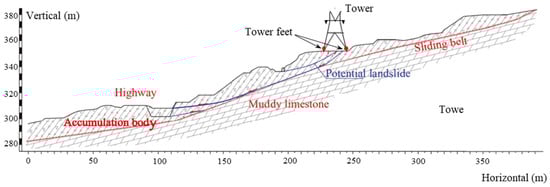
Figure 4.
Geological section of Yanzi landslide.
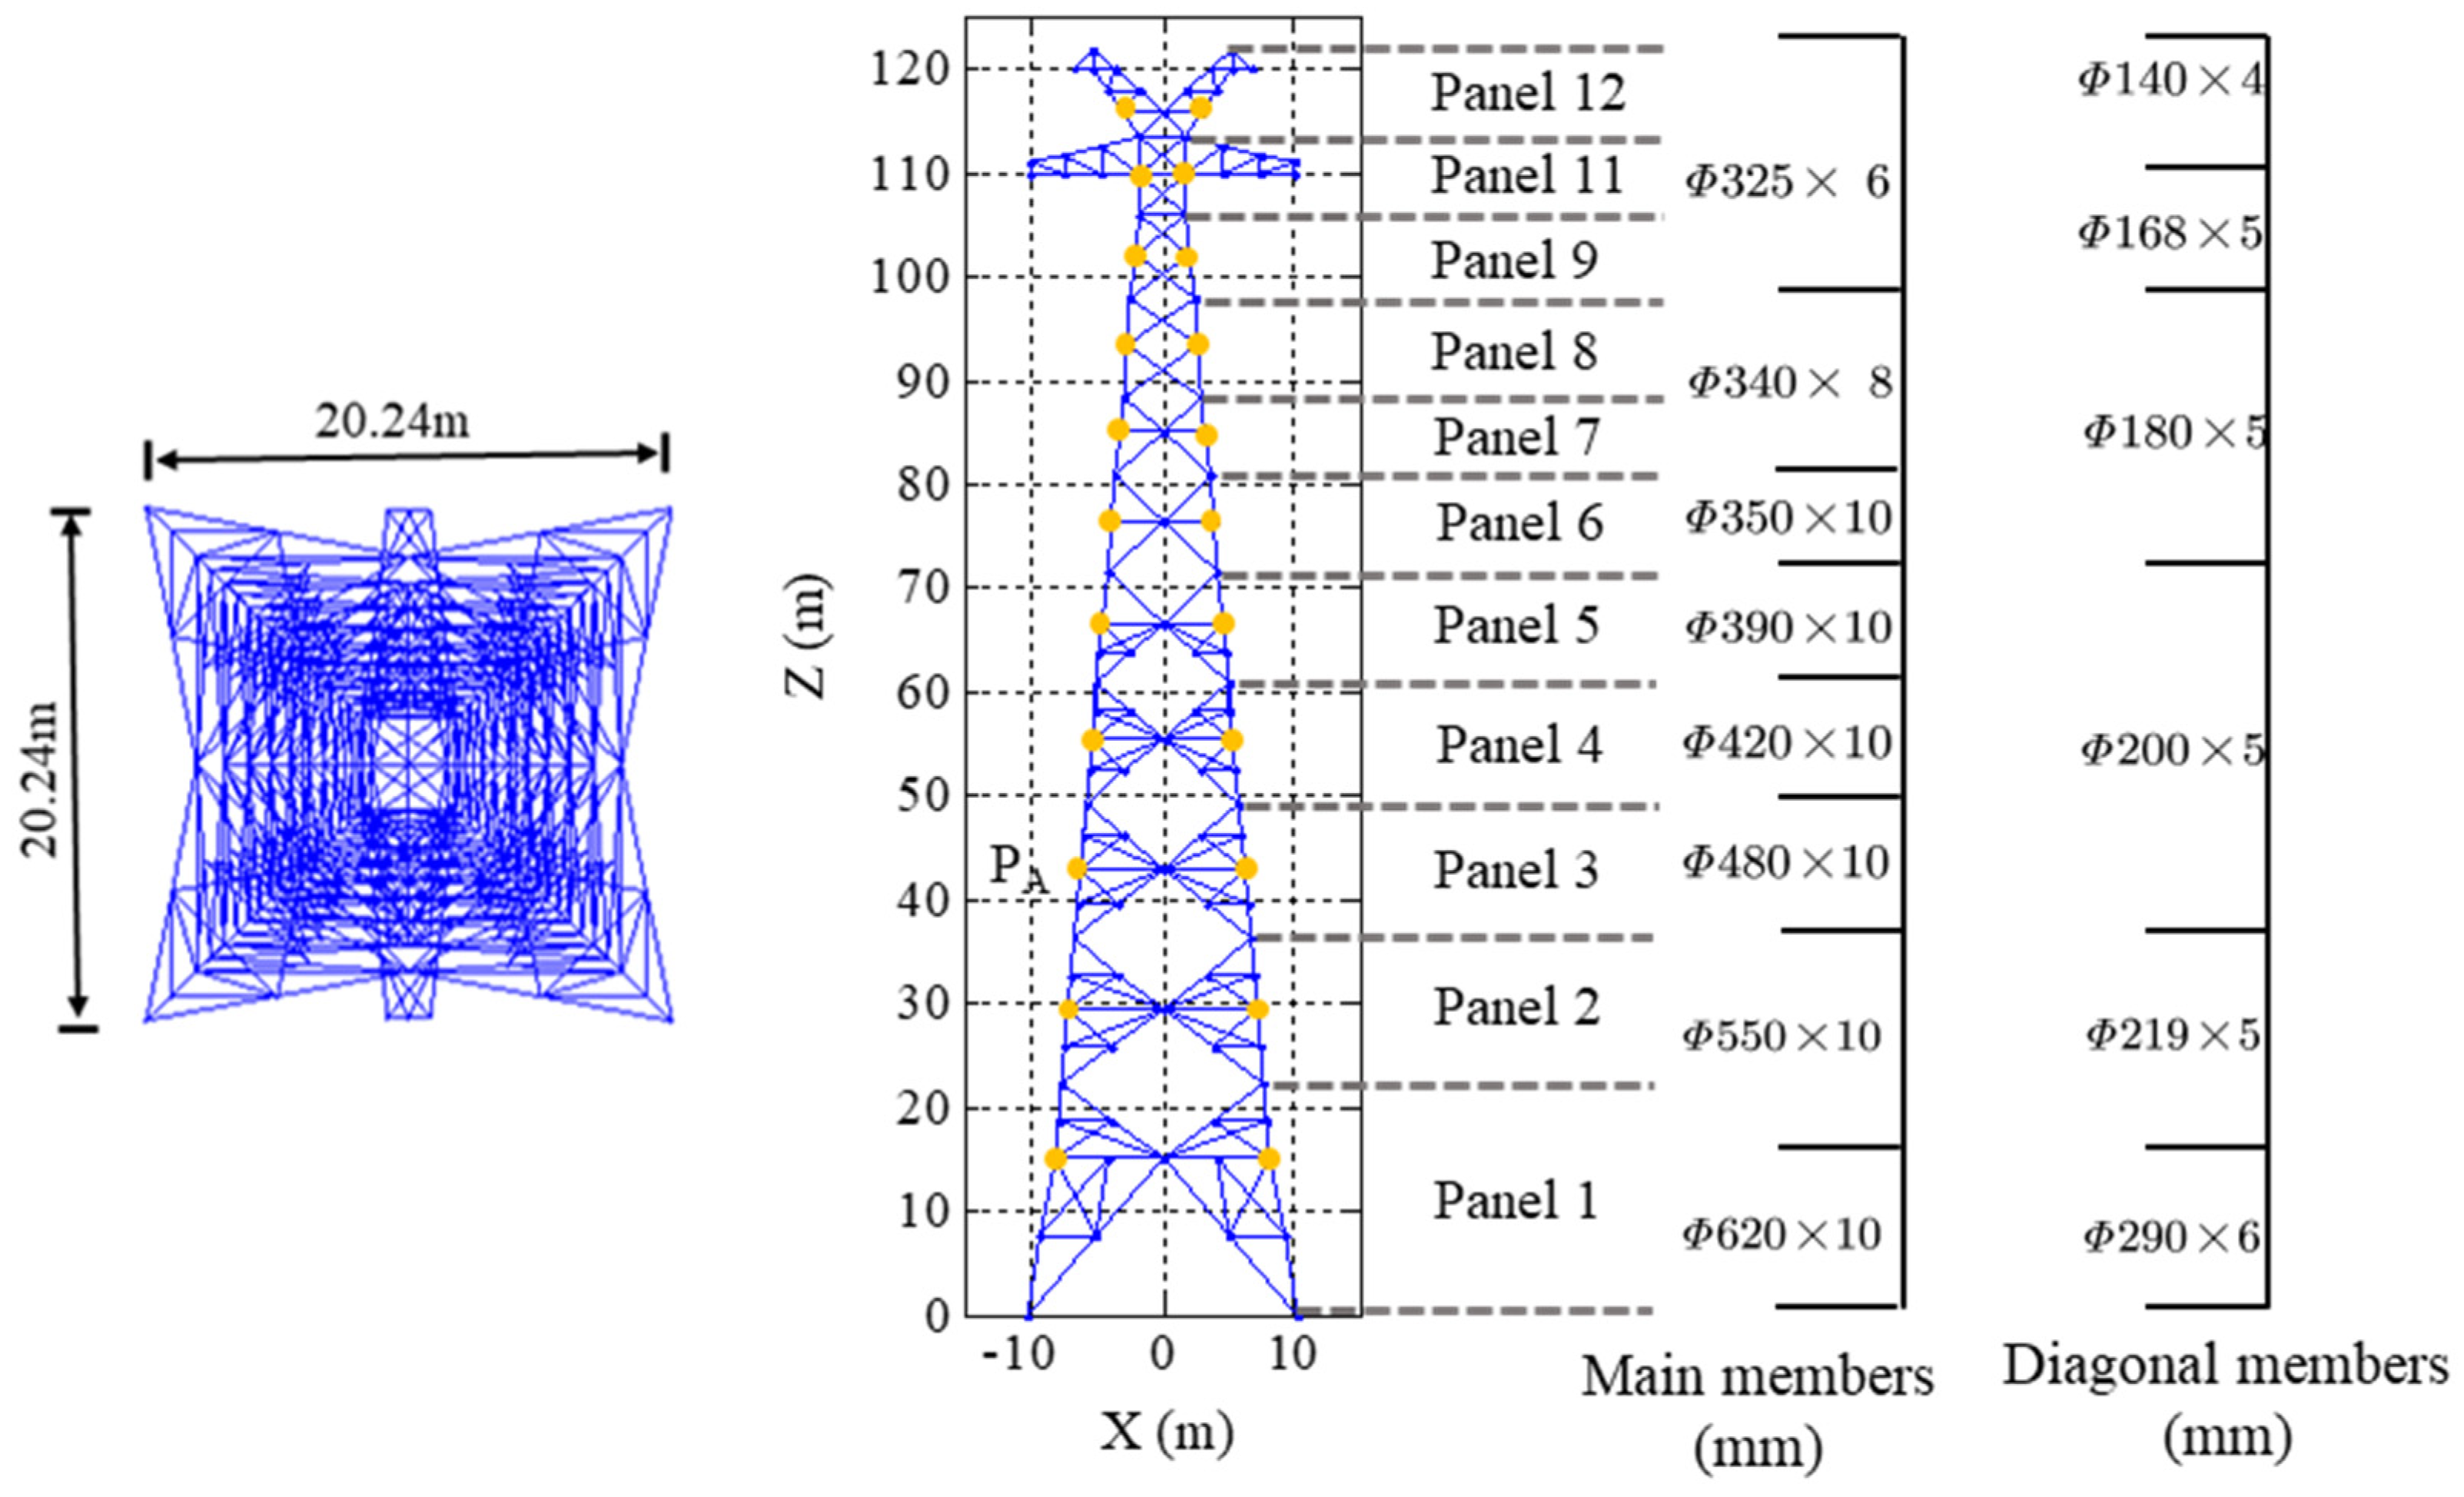
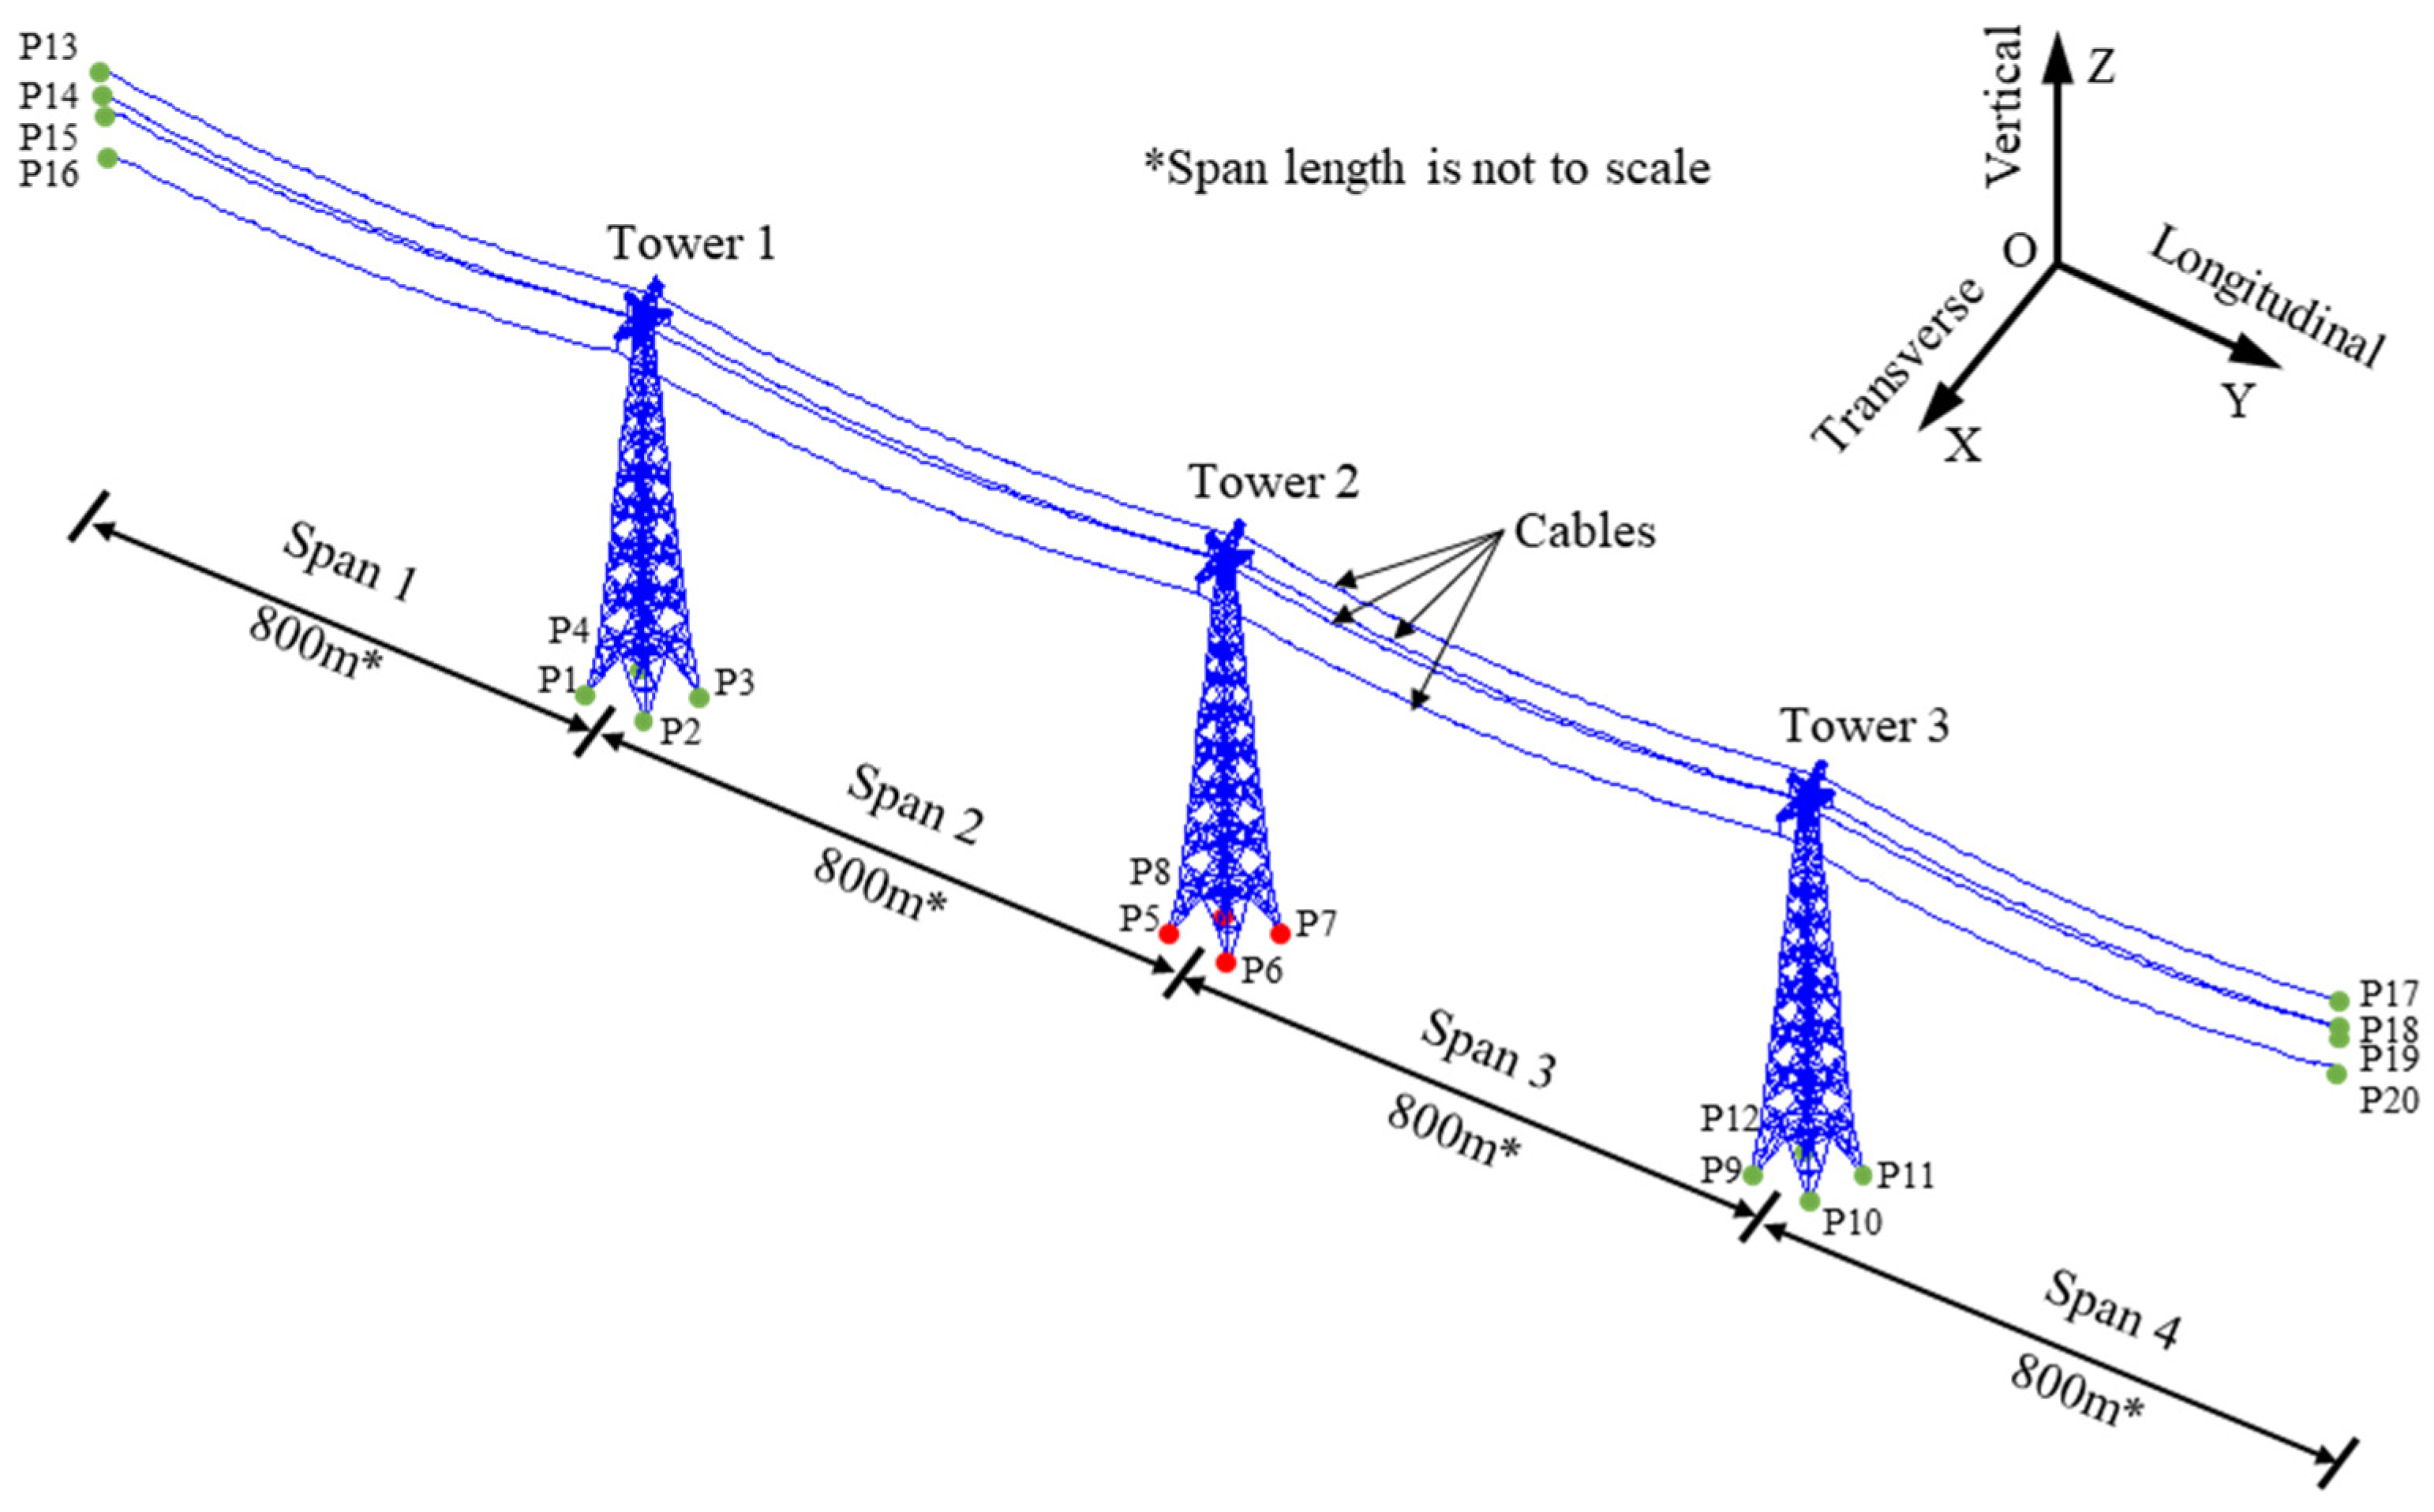
As shown in Figure 3, the prototype of the transmission tower-line system is a segment of a 500 kV transmission line, which involves three lattice transmission towers with the same structural design and four spans of cables. The tower height is 122 m and the foot-to-foot distance is 20.24 m, as shown in Figure 5, which illustrates the top and front views of the structure. The main legs and diagonal members are steel tubes and the dimensions are also given in Figure 5. The material of the tower members is Q235 steel and the material constants are listed in Table 1. The cables can be classified into conductors and ground wires, whose span length is 800 m. The type of conductors is JL/G1A-400/35 with a diameter of 26.82 mm, a mass per unit length of 1.35 kg/m, and an elastic modulus of 65 GPa. The type of ground wires is JLB40-150 and the corresponding values are 15.75 mm, 0.7 kg/m, and 103.6 GPa, respectively.
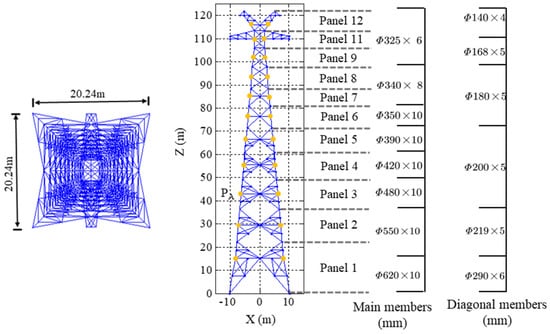
Figure 5.
Top and front views of Tower 2.

Table 1.
Material constants of tower members.
3. Wind Load Formation
When the wind travels through the transmission tower-line structure, drag forces on the transmission towers are produced. For convenience in calculating the wind loads, the tower was divided into 12 panels, as illustrated in Figure 5. The drag forces, (X-direction) and (Y-direction), can be expressed as
where is the wind speed; is the angle between wind and panels; and are the drag coefficients of tower members [25]; and are the projected areas of tower members; is the air density.
The drag forces on cables, , can be calculated using
where is the angle between wind speed and cables; is the drag coefficient of cables, whose value is 1.0 [19]; is the projected area of cables.
The wind speed is the summation of the turbulent component and the mean component .
The mean wind component varies with the height and it can be expressed using a normal wind profile.
where is the wind speed at the reference height ; is the ground roughness index, taken as 0.14 [26].
For a wind field point, the turbulent wind speed can be simulated using the Kaimal spectrum [27]. However, to consider the turbulent wind speed correlations between Point i and Point j in a wind field, the cross-spectrum, , (Equation (6)) should be used, which can be obtained based on the Kaimal spectrum and correlation function (Equation (7)).
where is the wind speed frequency; is the Kaimal spectrum at Point i; is the Kaimal spectrum at Point j; is the distance between the two points; is the correlation coefficient between the two points [27]. If there are n field points, the cross-spectrum matrix, , can be yielded.
Then, the turbulent wind speed time history at Point i, which considers the influences from other field points, can be written as
where is the number of sampling points; is the phase angle that satisfies the uniform distribution; is the lower triangular matrix that can be computed via the Cholesky decomposition of [28]; .
4. Dynamic Response Analysis Method of the Tower-Line Structure
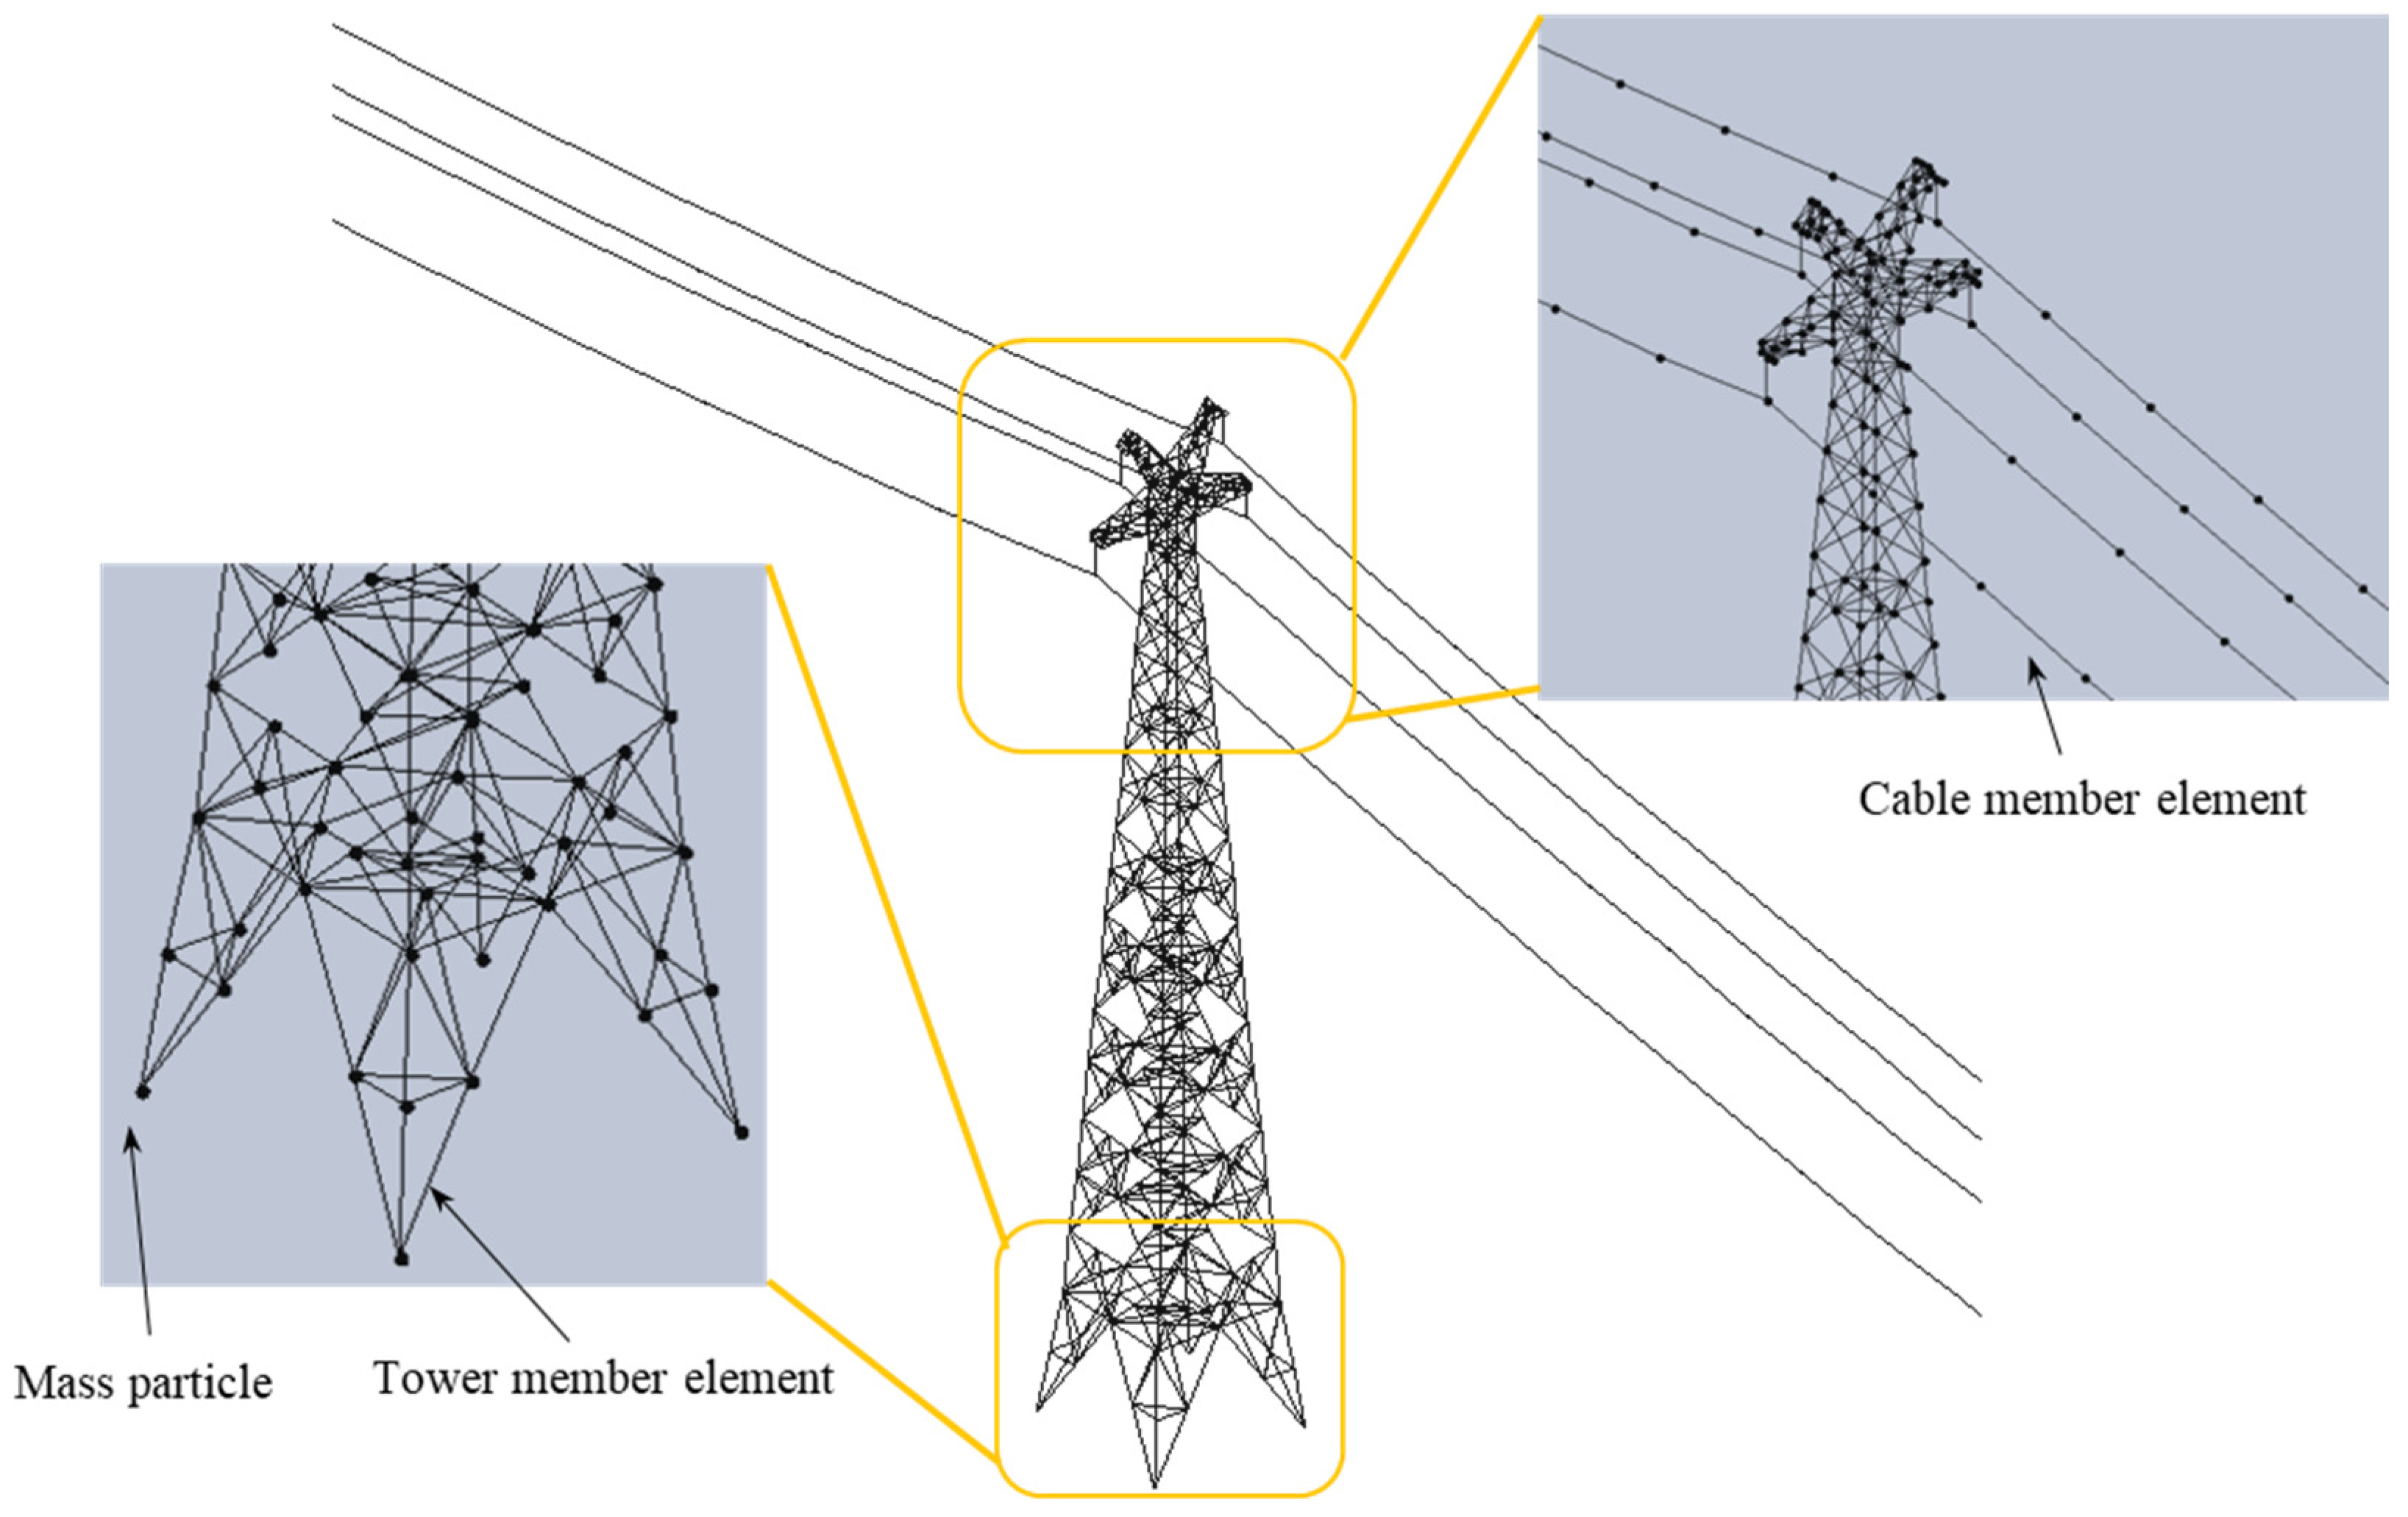
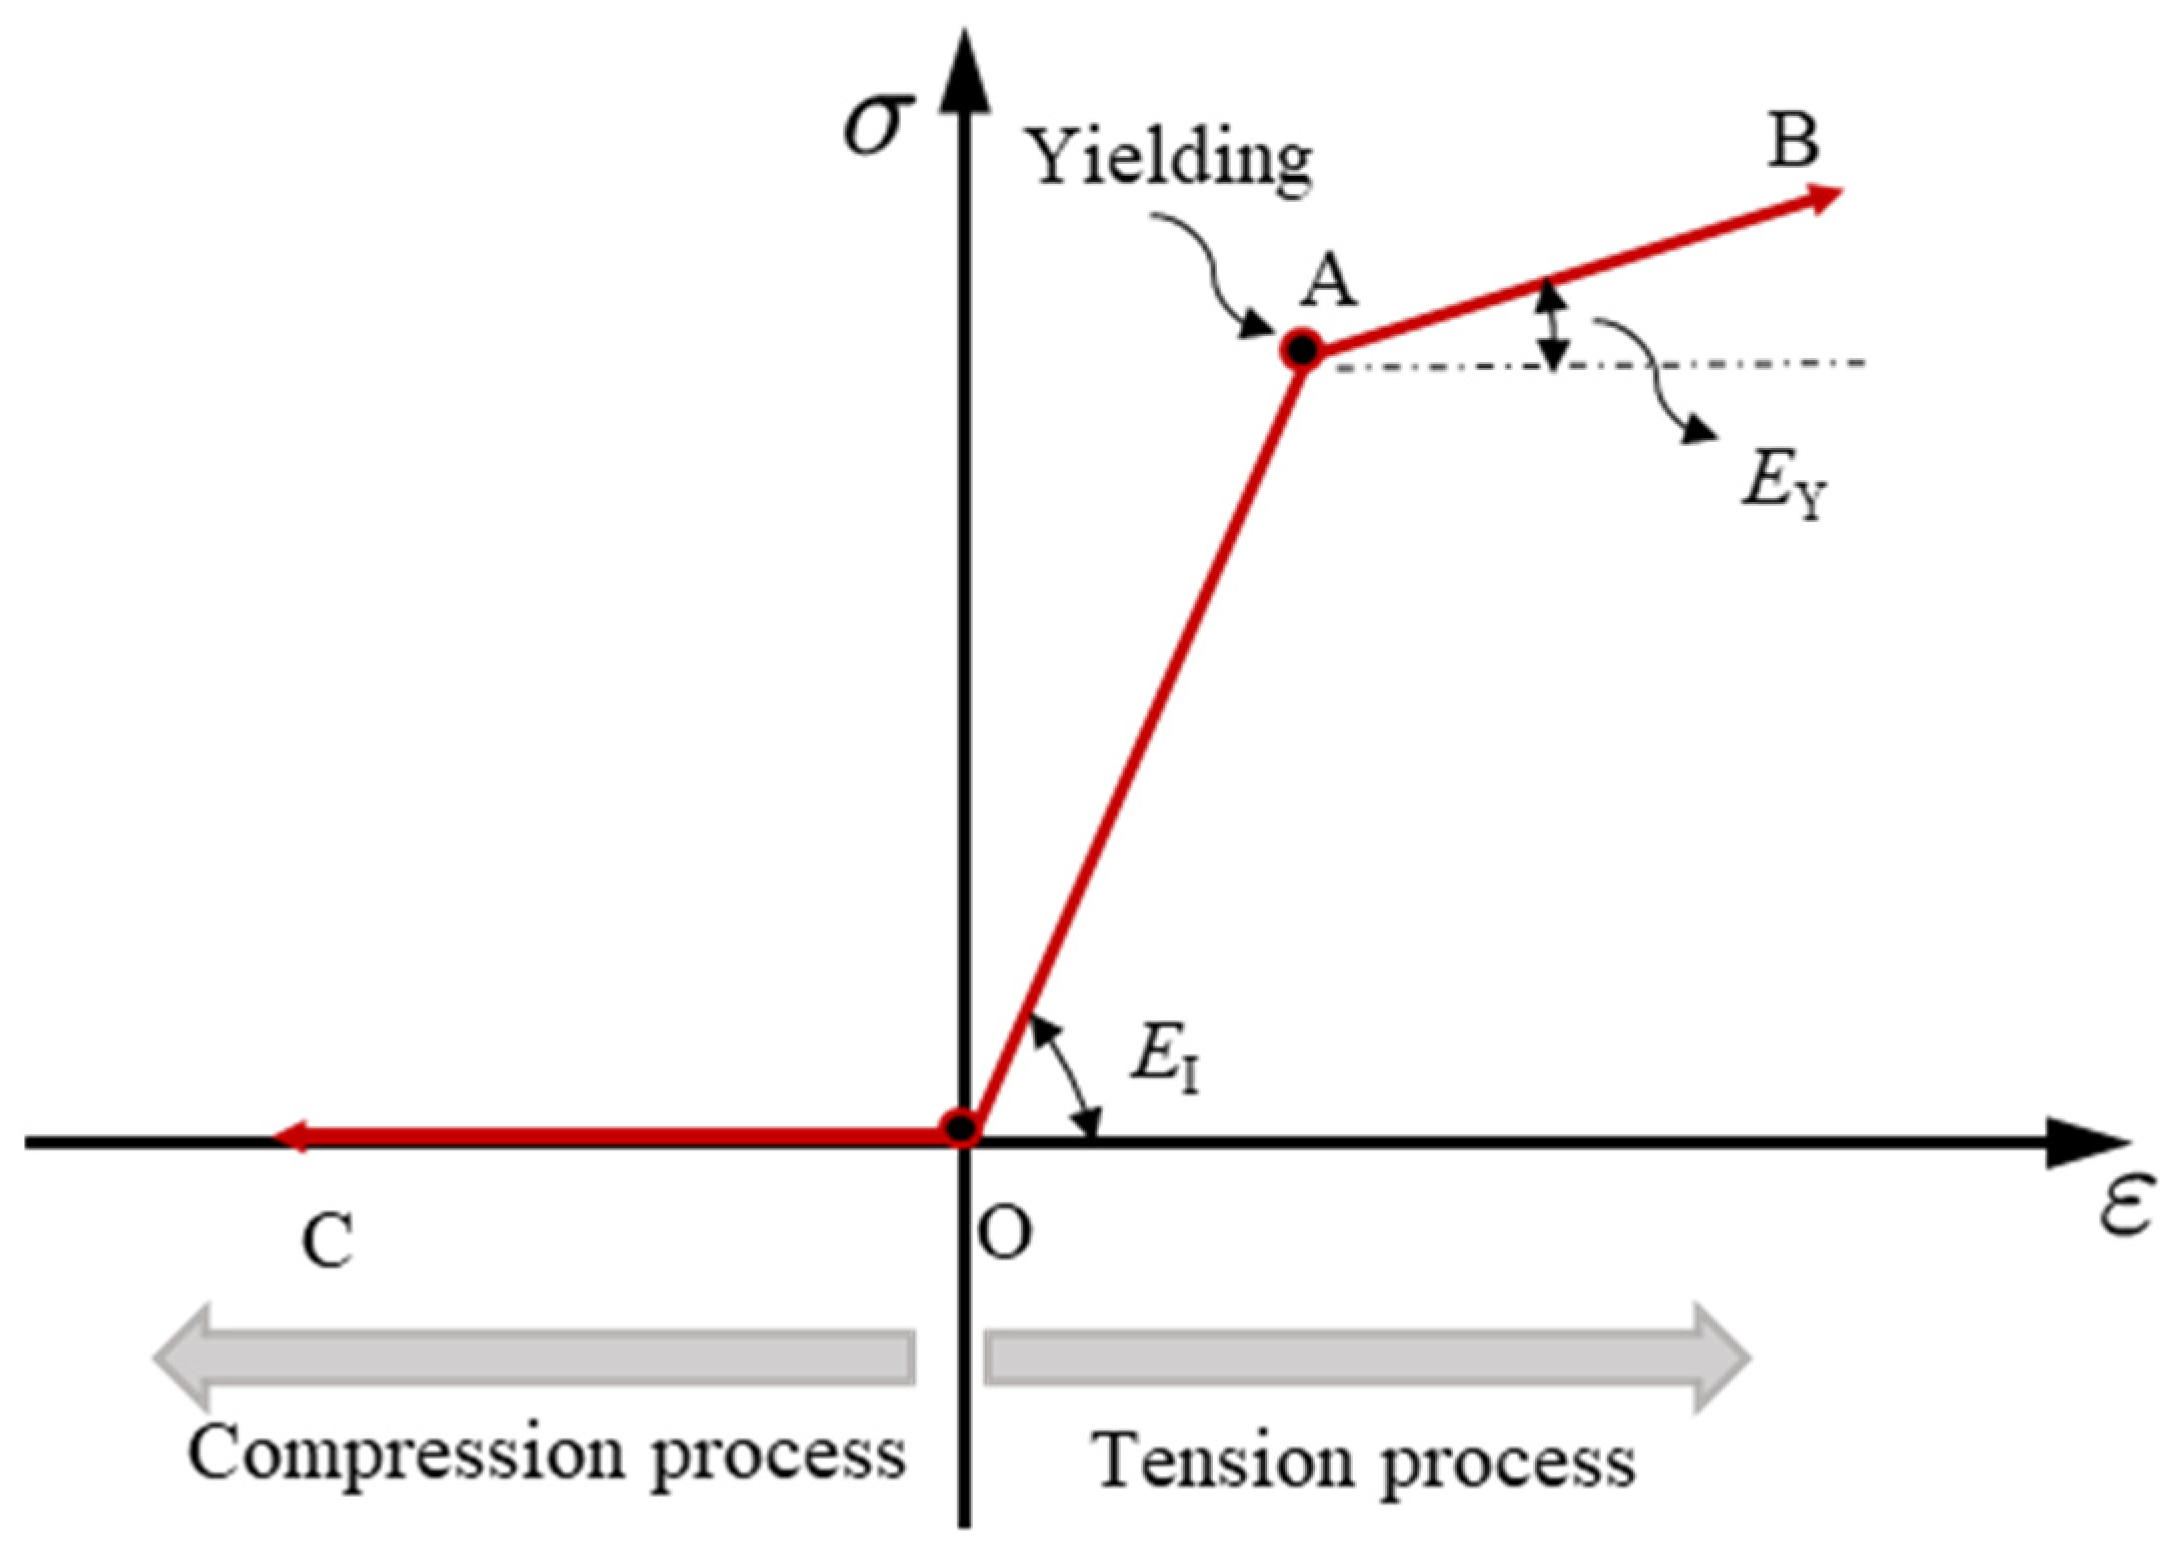
Figure 6 provides the discretization model of the transmission tower-line structure, which is represented by a number of mass particles and member elements. The total mass of the structure is modeled by mass particles. The member element describes the topological relationship between mass particles. The element model developed by the researchers in [29] was adopted to simulate tower members, which can account for the yielding in tension, the buckling in compression, and the critical force degradation due to the Bauschinger effect [30]. For the cable members, the relationship is shown in Figure 7. It can be found that when the cables are tensioned, the material behaves in a bilinear way. The slope of stage OA is , and the slope of the yielding stage AB is . The value of is 0.05 in this study [31]. The cable member element in Figure 7 assumes that the cables cannot experience any compression actions, which means that the internal forces become zero when the cables are compressed.
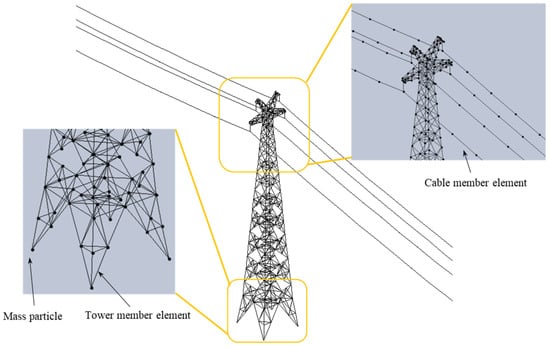
Figure 6.
The discretization model of the tower-line system.
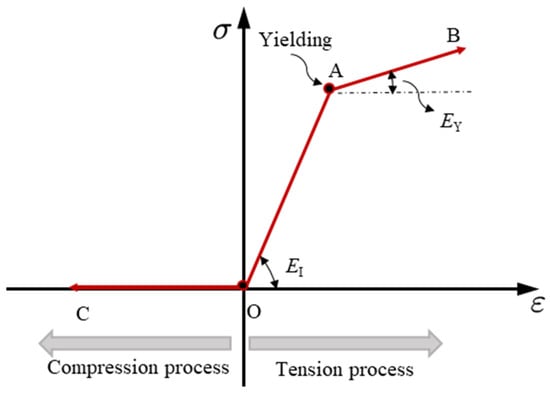
Figure 7.
The relationship of cables in this study (OA: Elastic stage; AB: Yielding stage).
The dynamic response of structures is actually a function of time and space. The motion response of mass particles can be regarded as a series of sequential motions in small time steps [32]. The motion of mass particles in a small time step is called a path unit, which can be calculated based on Newton’s second law [33]. For the mass particle i, the expression can be expressed as
where is the mass of the particle i, which is the half sum of member elements connected to the particle; and are the vectors of displacement and acceleration of the particle i; is the vector of internal force in member elements, which can be obtained through the model of member elements; is the vector of external force exerted on the particle i, which depends on the wind speed (Equations (1)–(3)) and landslide conditions used in this study. Finally, is the vector of damping force, which can be further written as
where is the damping coefficient, which is the same as the definition in Ref. [34]; is the velocity vector of the particle i.
To avoid the complex iteration calculations and the formation of a global stiffness matrix, Equation (10) can be solved by an explicit central difference method [35]. For this, the acceleration and velocity can be written as
where , , and are displacement vectors of a particle at steps n + 1, n, and n-1, respectively; is the time step, taken as 10−5 s [36]. By substituting Equations (11)–(13) into Equation (10), the displacement response of the structure can be obtained.
Because the time step in a path unit is pretty small, the deformation and internal force increment of member elements in the path unit are linear and small [37]. The material properties of elements, the number and mass of particles, and the topological relationship can be regarded to be not changed in the path unit, but they can be changed between path units. Therefore, the total deformation of member elements could be nonlinear and very large throughout the whole analysis process, and even the discontinuous issues of member fractures can also be dealt with between path units. The above-mentioned calculation method has been programmed using MATLAB [38], which was already validated by comparison with other numerical models and was found to be accurate with an error within 4.04% [33].
5. Collapse Analysis of the Tower-Line System under Wind and Landslide Action
5.1. Numerical Model of the Tower-Line Structure
As illustrated in Figure 3, the investigated segment includes three transmission towers connected by four spans of cables. MATLAB was used to create the numerical model of the transmission tower-line structure, as shown in Figure 8. The members in the numerical model are connected by hinges. The feet of Towers 1 and 3 (P1–P4 and P9–P12) are assumed to be fixed. However, the boundary condition at the feet of Tower 2 (P5–P8) varies with the landslide cases defined in Section 5.2. The boundary conditions at P13–P16 and P17–P20 are modeled using end springs and their stiffness is defined by the elastic characteristic of the transmission towers [39]. According to previous studies [40,41], the damping of the steel tower is 2% and the damping of cables is 20%. For each simulation, the wind loads are always applied to the structure, whereas the landslide actions are exerted on the structure over 5–15 s.
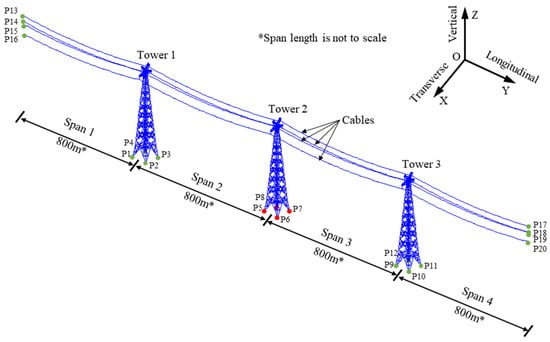
Figure 8.
Numerical model of the structure.
5.2. Load Cases
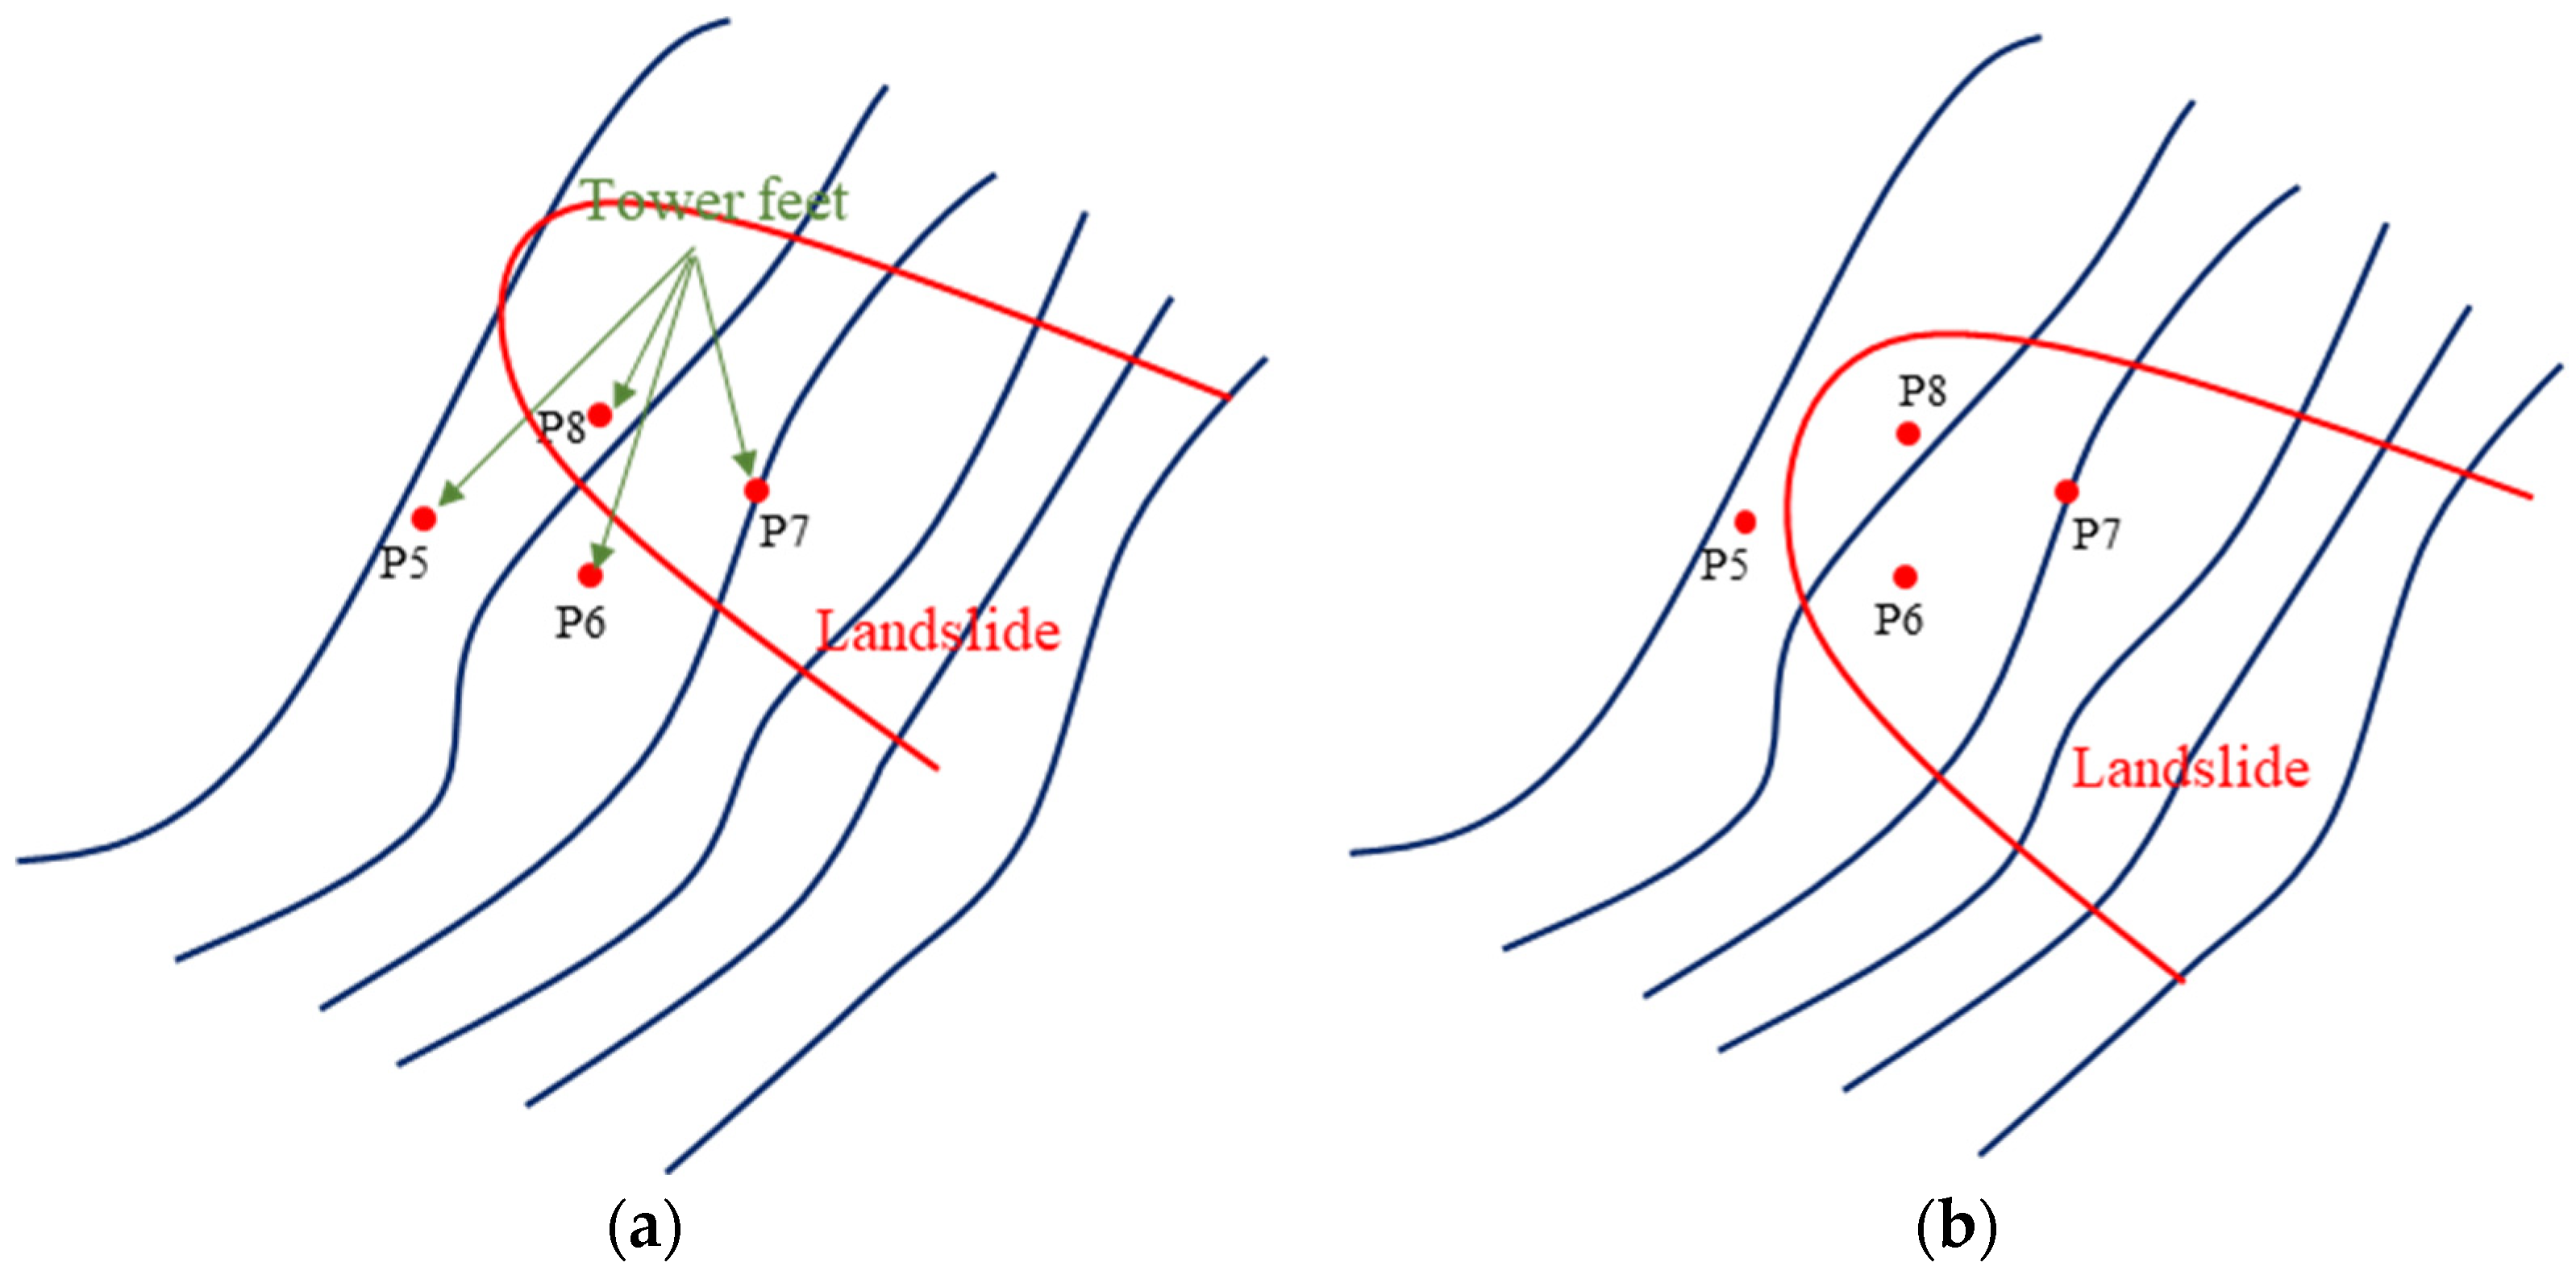
The landslide would lead to the foundation failure of transmission towers. In Figure 8, the P5-P8 are feet of Tower 2. We investigated two failure cases of the tower foundation on the landslide, as illustrated in Figure 9. For Case 1, P7 and P8 of Tower 2 are located in the sliding zone (Figure 9a); for Case 2, P6, P7, and P8 of Tower 2 are located in the sliding zone (Figure 9b). We assumed that part of the tower foundation is on a potential landslide. Once the slide occurs, the part of the tower foundation that sits on the potential landslide could lose its bearing capacity and the corresponding tower feet could lose their suddenly supports [24].
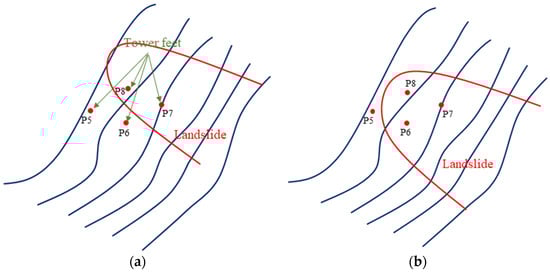
Figure 9.
Two failure cases of towers on the landslide. (a) Case 1; (b) Case 2.
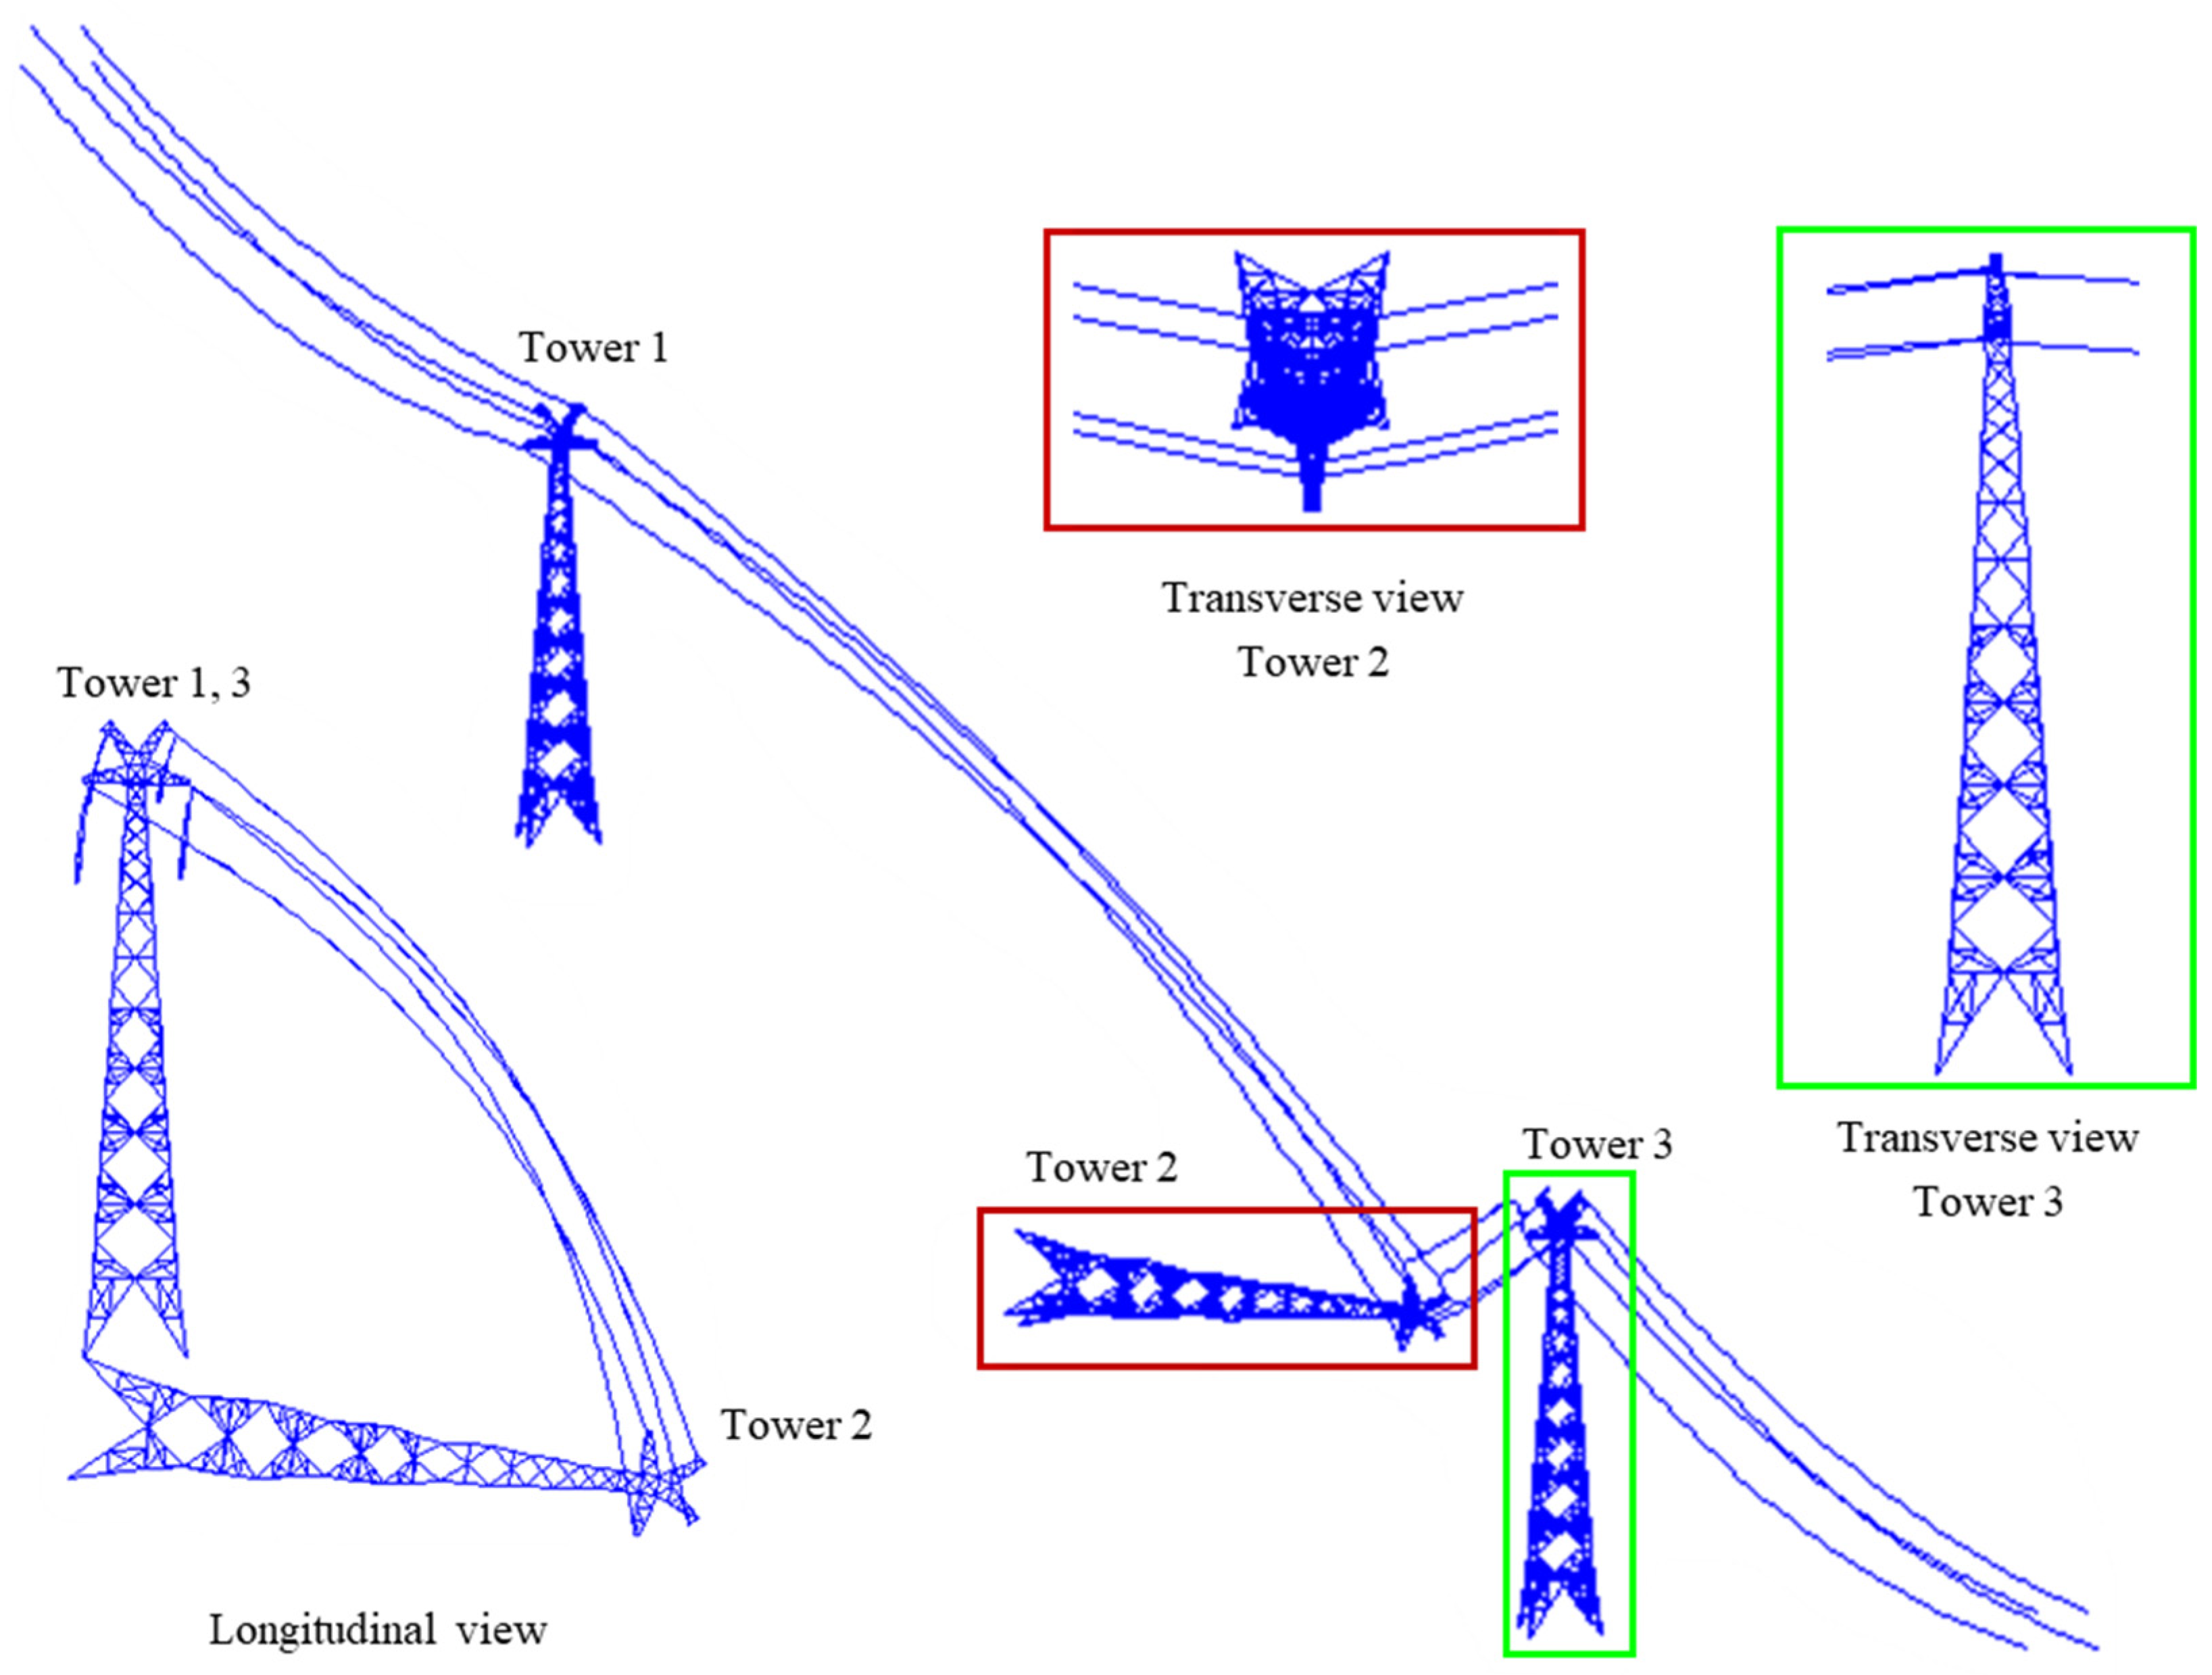
5.3. Progressive Collapse under Case 1
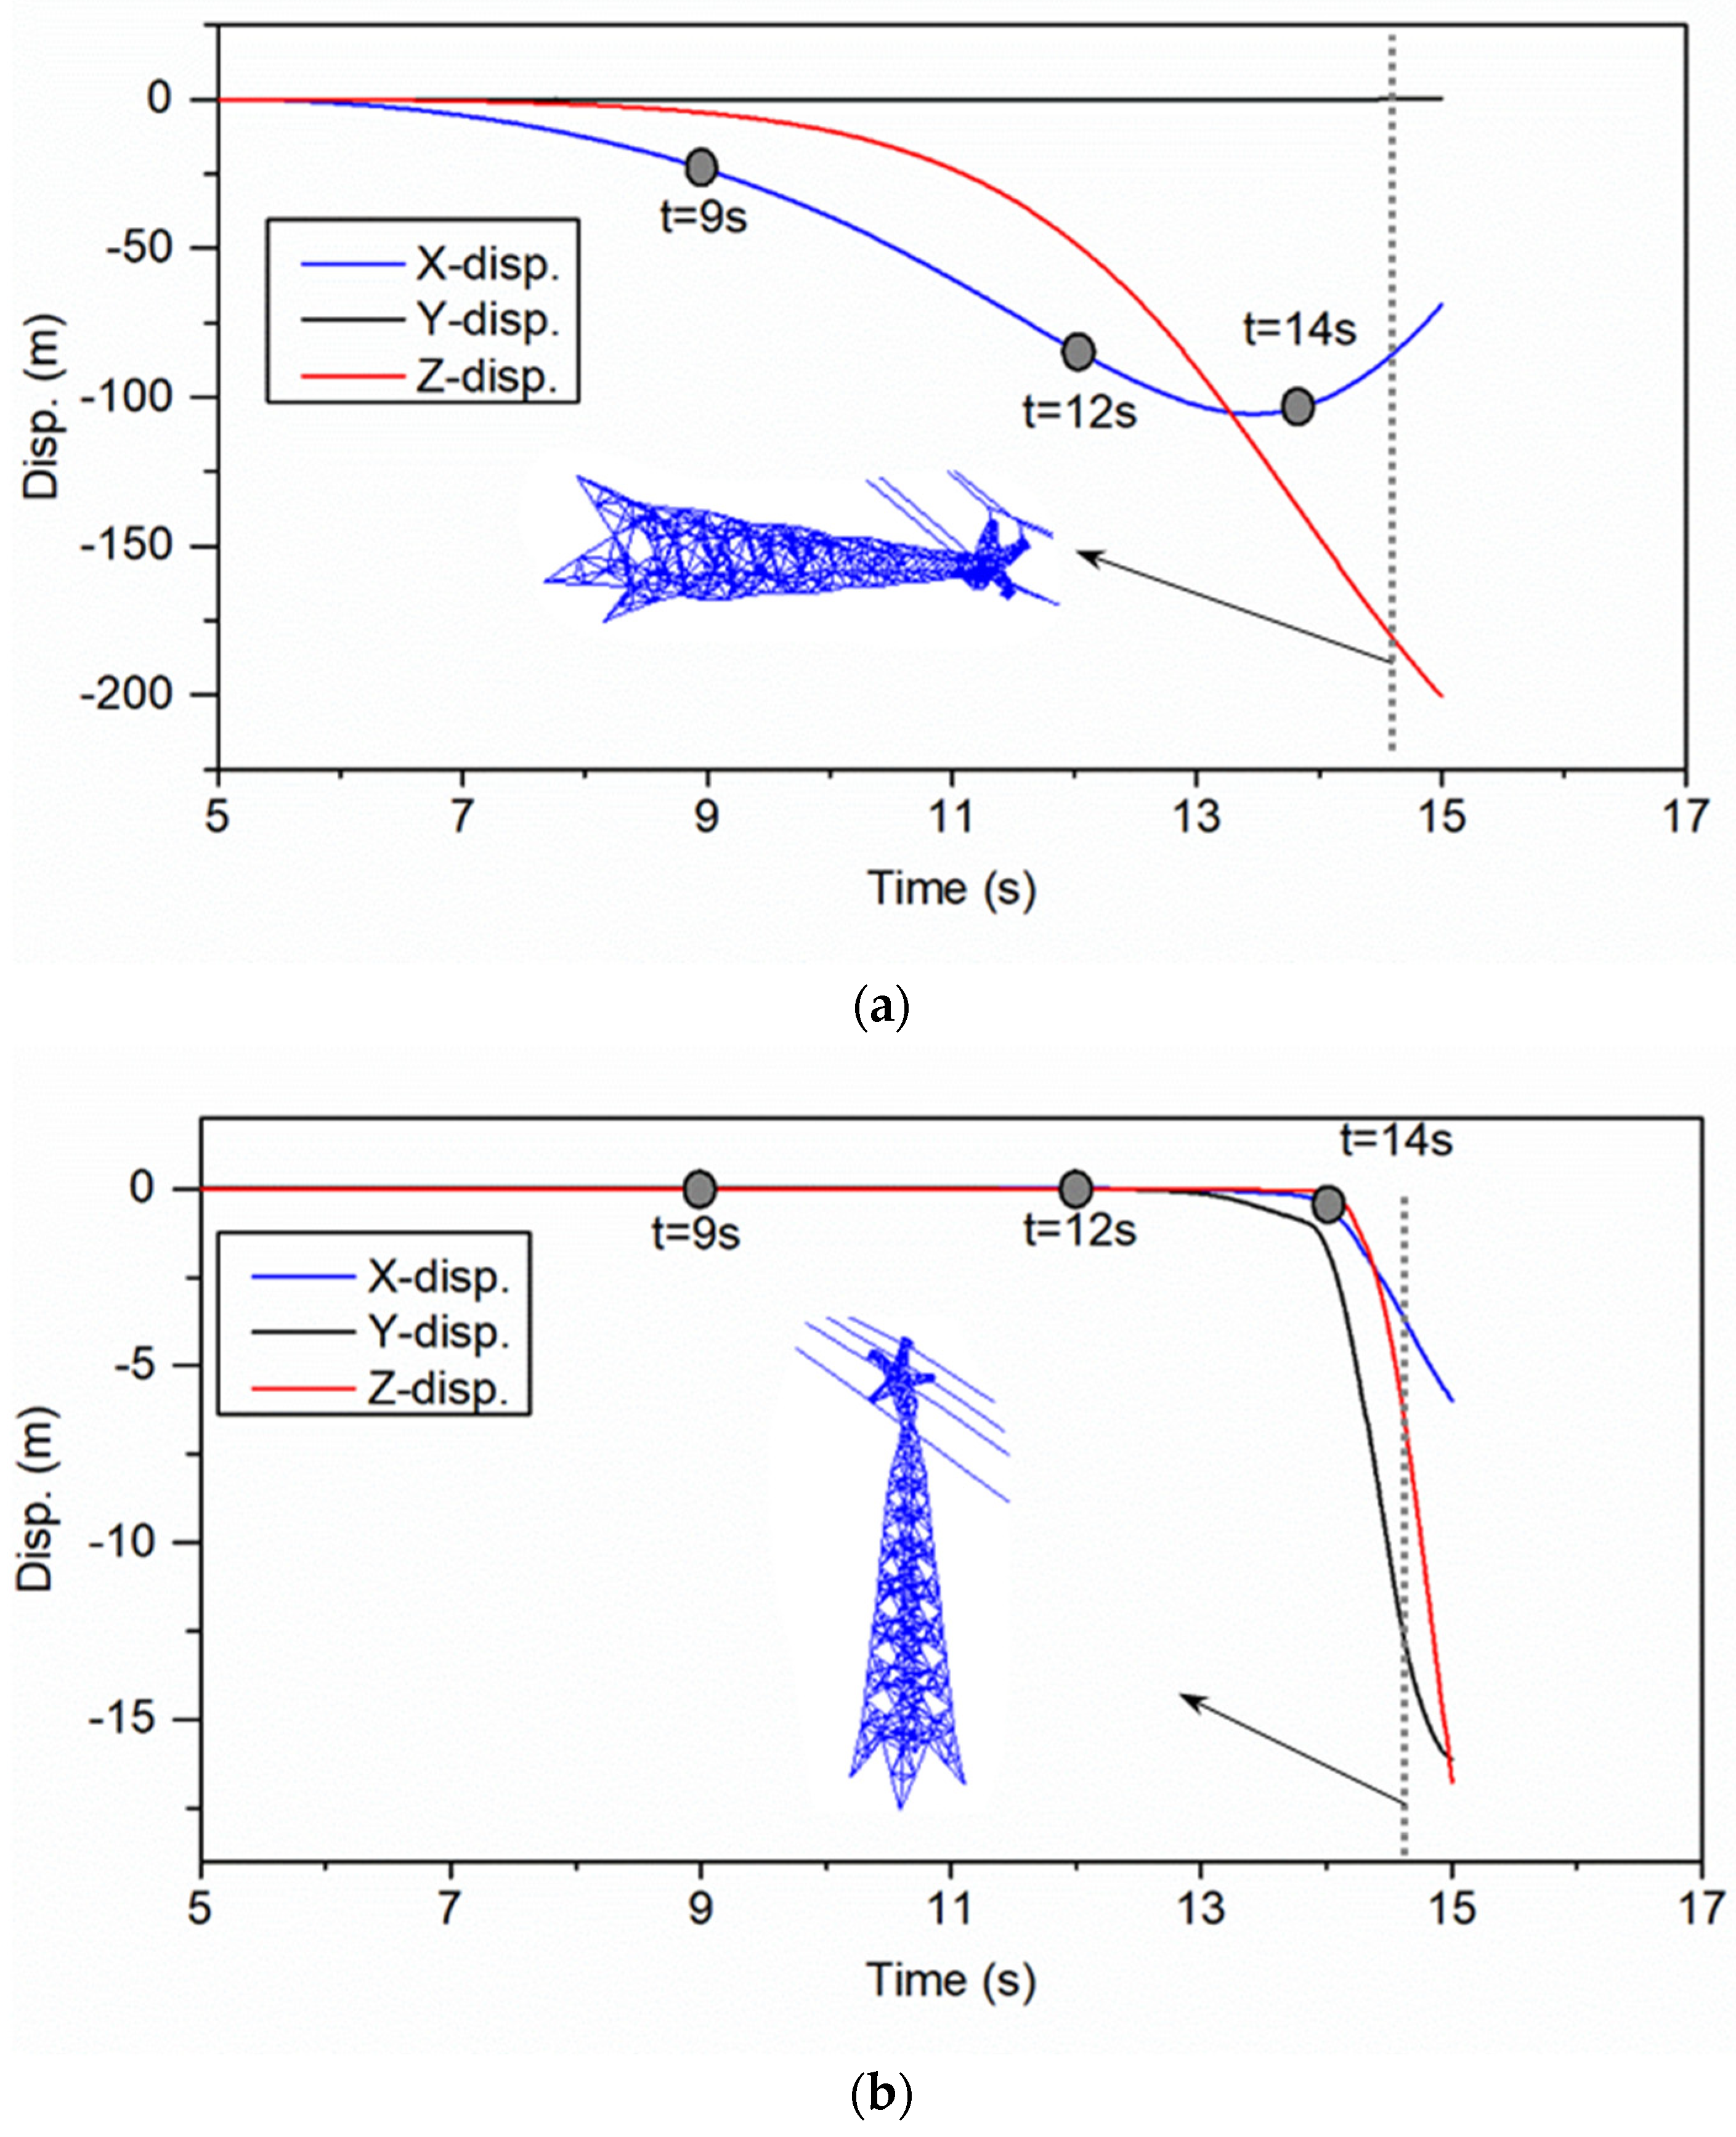
For Case 1, the displacement time histories at the tops of Towers 2 and 3 are shown in Figure 10. The collapse scenarios for the transmission tower-line system at the special moments are presented in Figure 11, Figure 12, Figure 13 and Figure 14. The displacement response of Tower 1 is not presented here since the response curves show similar features to those of Tower 3. The coordinate system of OXYZ is defined in Figure 8. In Figure 10, it can be found that the displacements in the X-, Y-, and Z-direction are very small at 5 s because there are only wind loads and dead weight applied to the structure for 1–5 s. After that, the feet of Tower 2 at P7 and P8 start losing their supports due to the landslide (Figure 9a) and the tower body gradually tilts in the X-direction, as shown in Figure 11. Accordingly, the displacement at the tower top also sees an increment in the X- and Z-direction, as illustrated in Figure 10a. It also can be observed in Figure 11 that the cables between transmission towers are also lifted by wind loads, which produce insignificant influences on the response of towers. As the tilt level of the tower body increases, the slack cables in the initial state (Figure 8) have straightened at t = 12 s, as shown in Figure 12. Due to the pulling effect by cables, the neighboring Towers 1 and 3 show the bending shape in the Y-direction at t = 14 s (Figure 13). The bending shape at the head of Towers 1 and 3 becomes more obvious at t = 14.3 s (Figure 14). This conclusion can also be drawn from the increment of the Y-displacement in Figure 10b. Then, the displacement at the top of Tower 3 shows a sharp decline in three directions and the duration from the start of the bending to the end of the total failure (Figure 10b) at the tower head is less than 1 s. This indicates that the collapse process of the neighboring transmission towers would be greatly accelerated by the pulling of the cables.
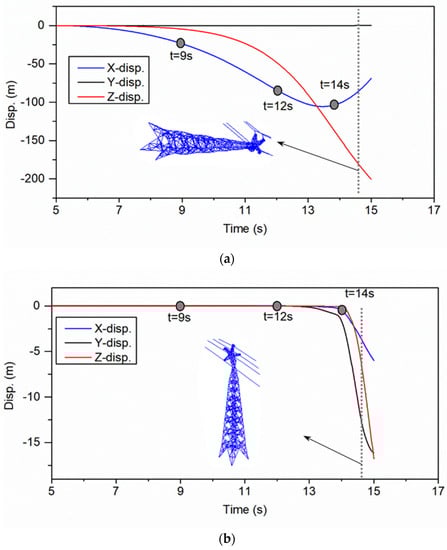
Figure 10.
Displacement response at tower tops under Case 1. (a) Tower 2; (b) Tower 3.
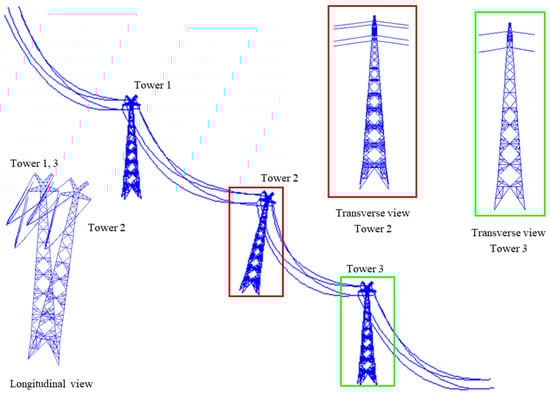
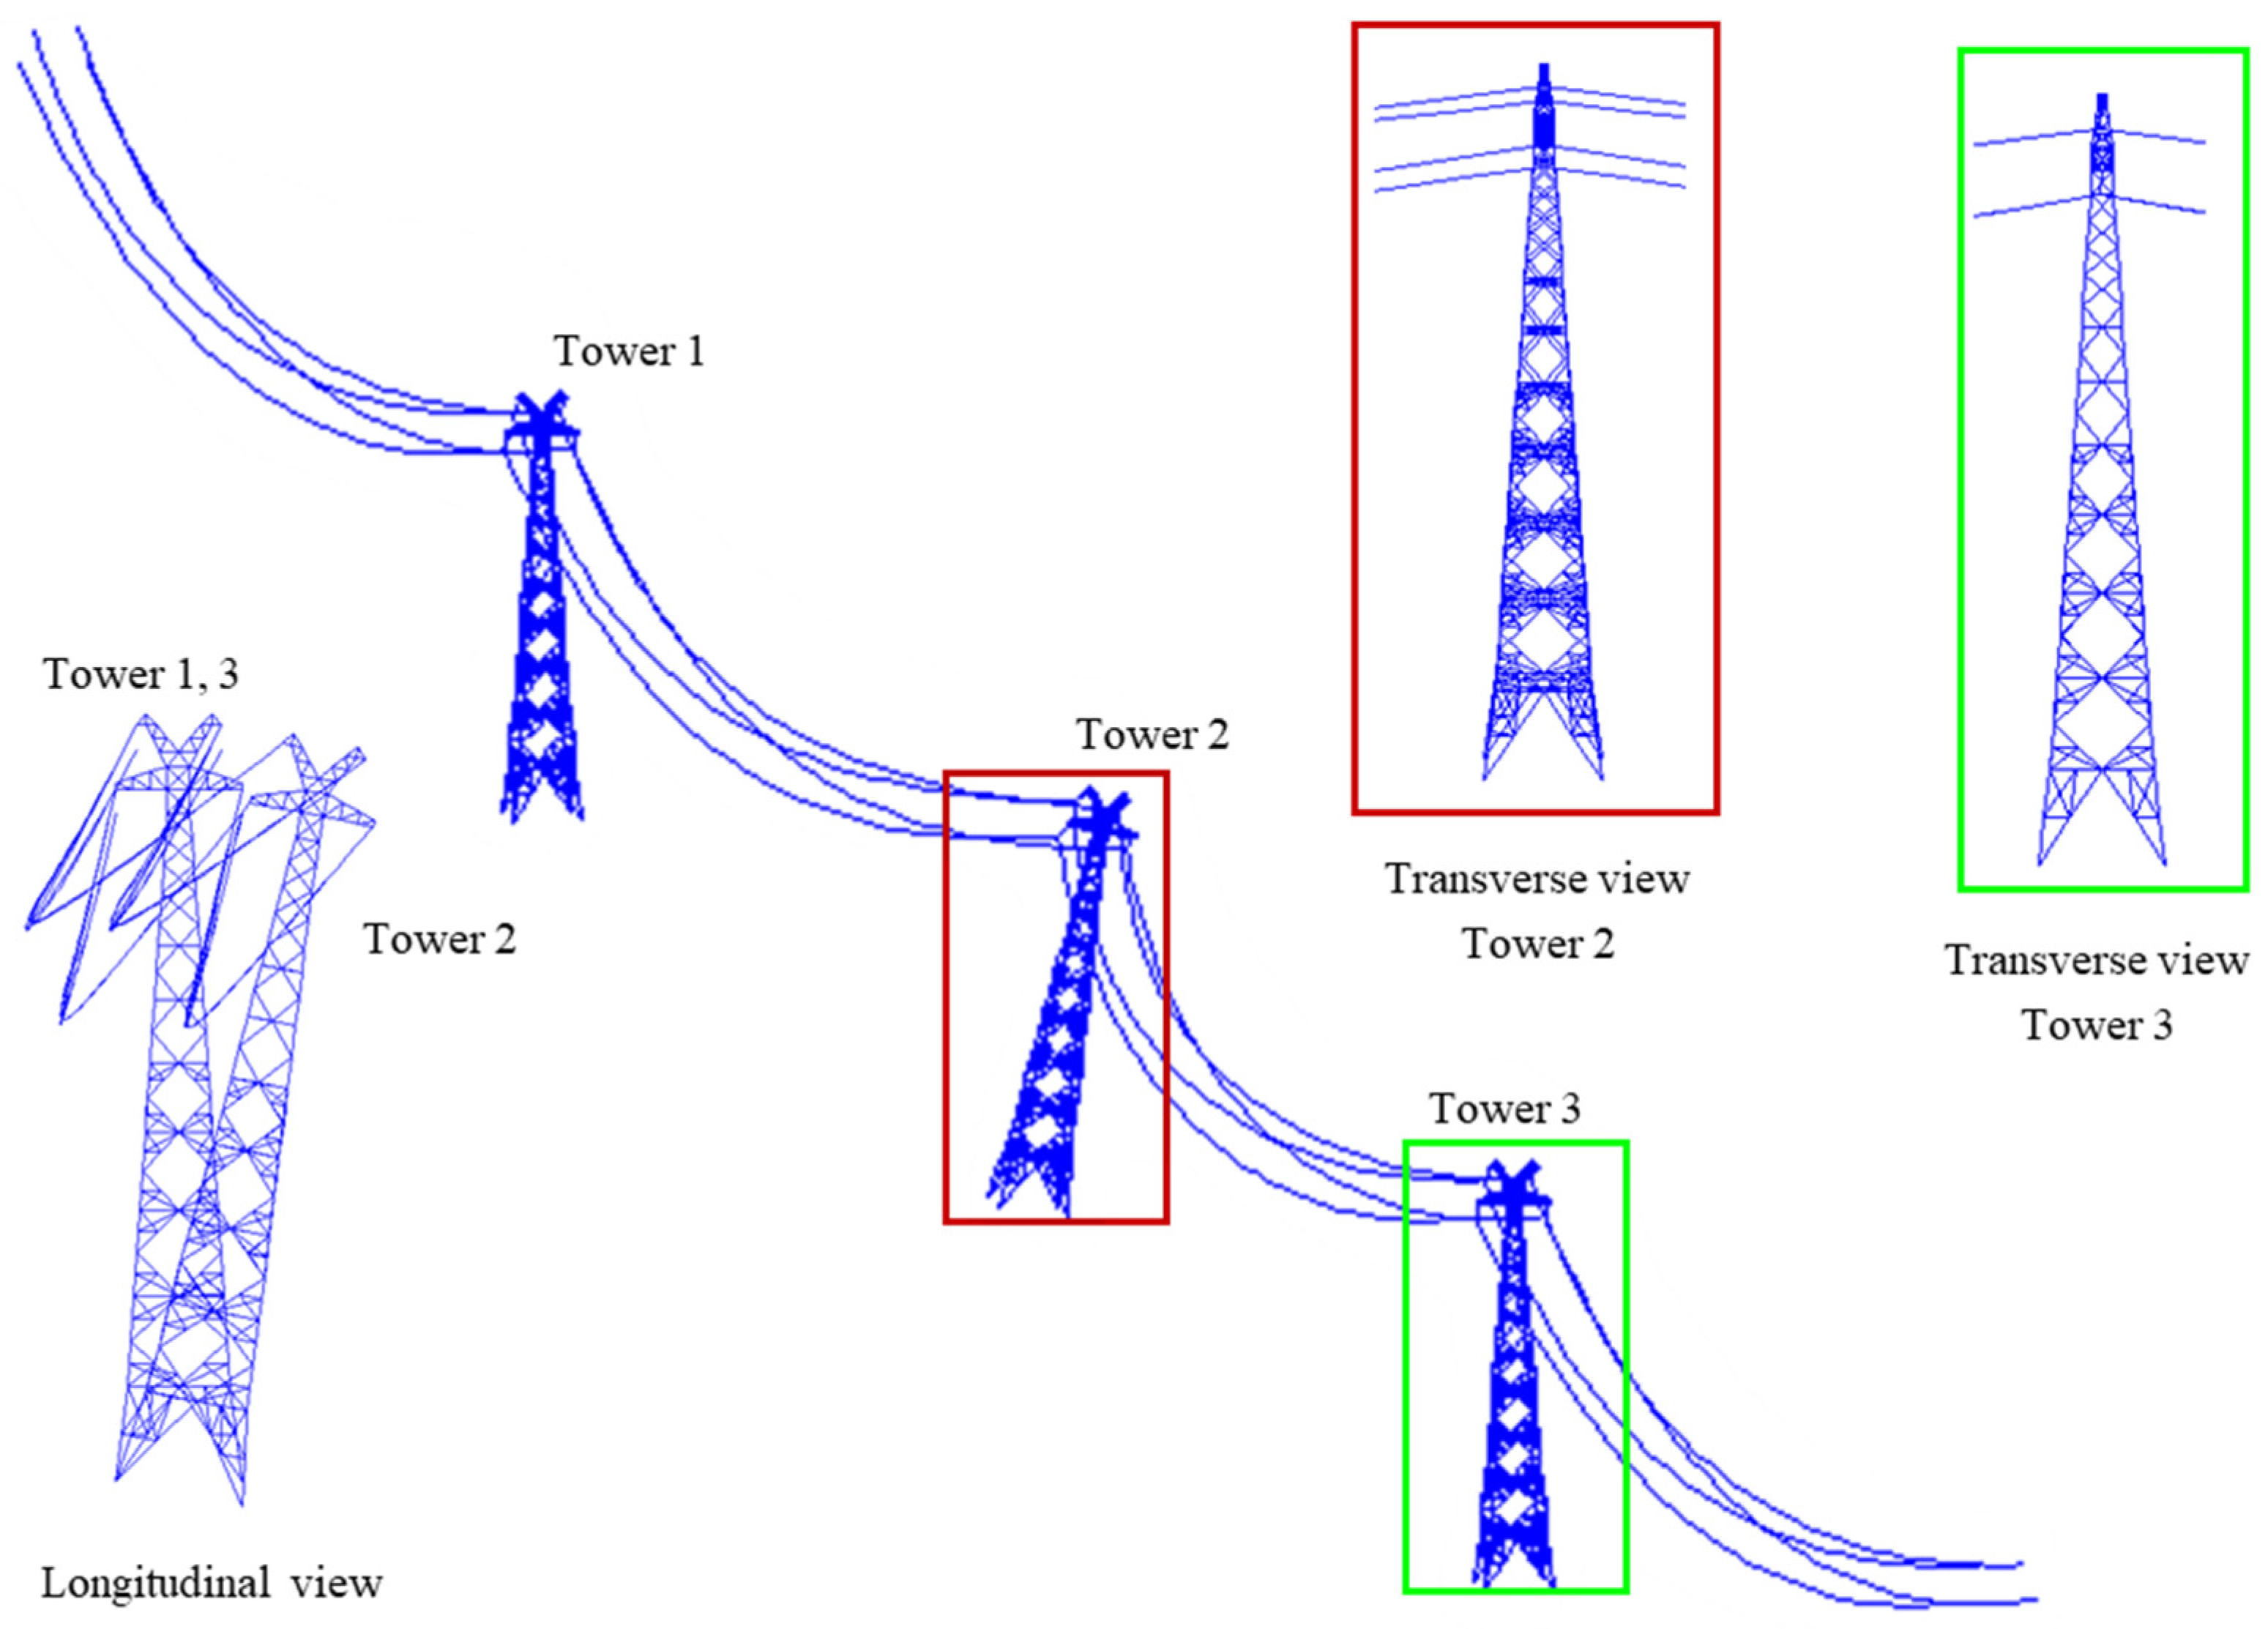
Figure 11.
Behavior of the transmission tower-line structure at t = 9 s under Case 1.
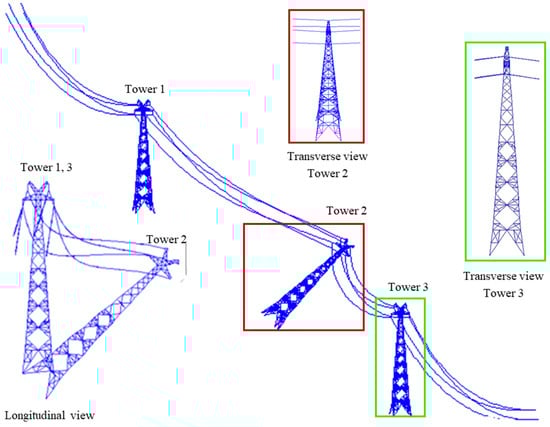
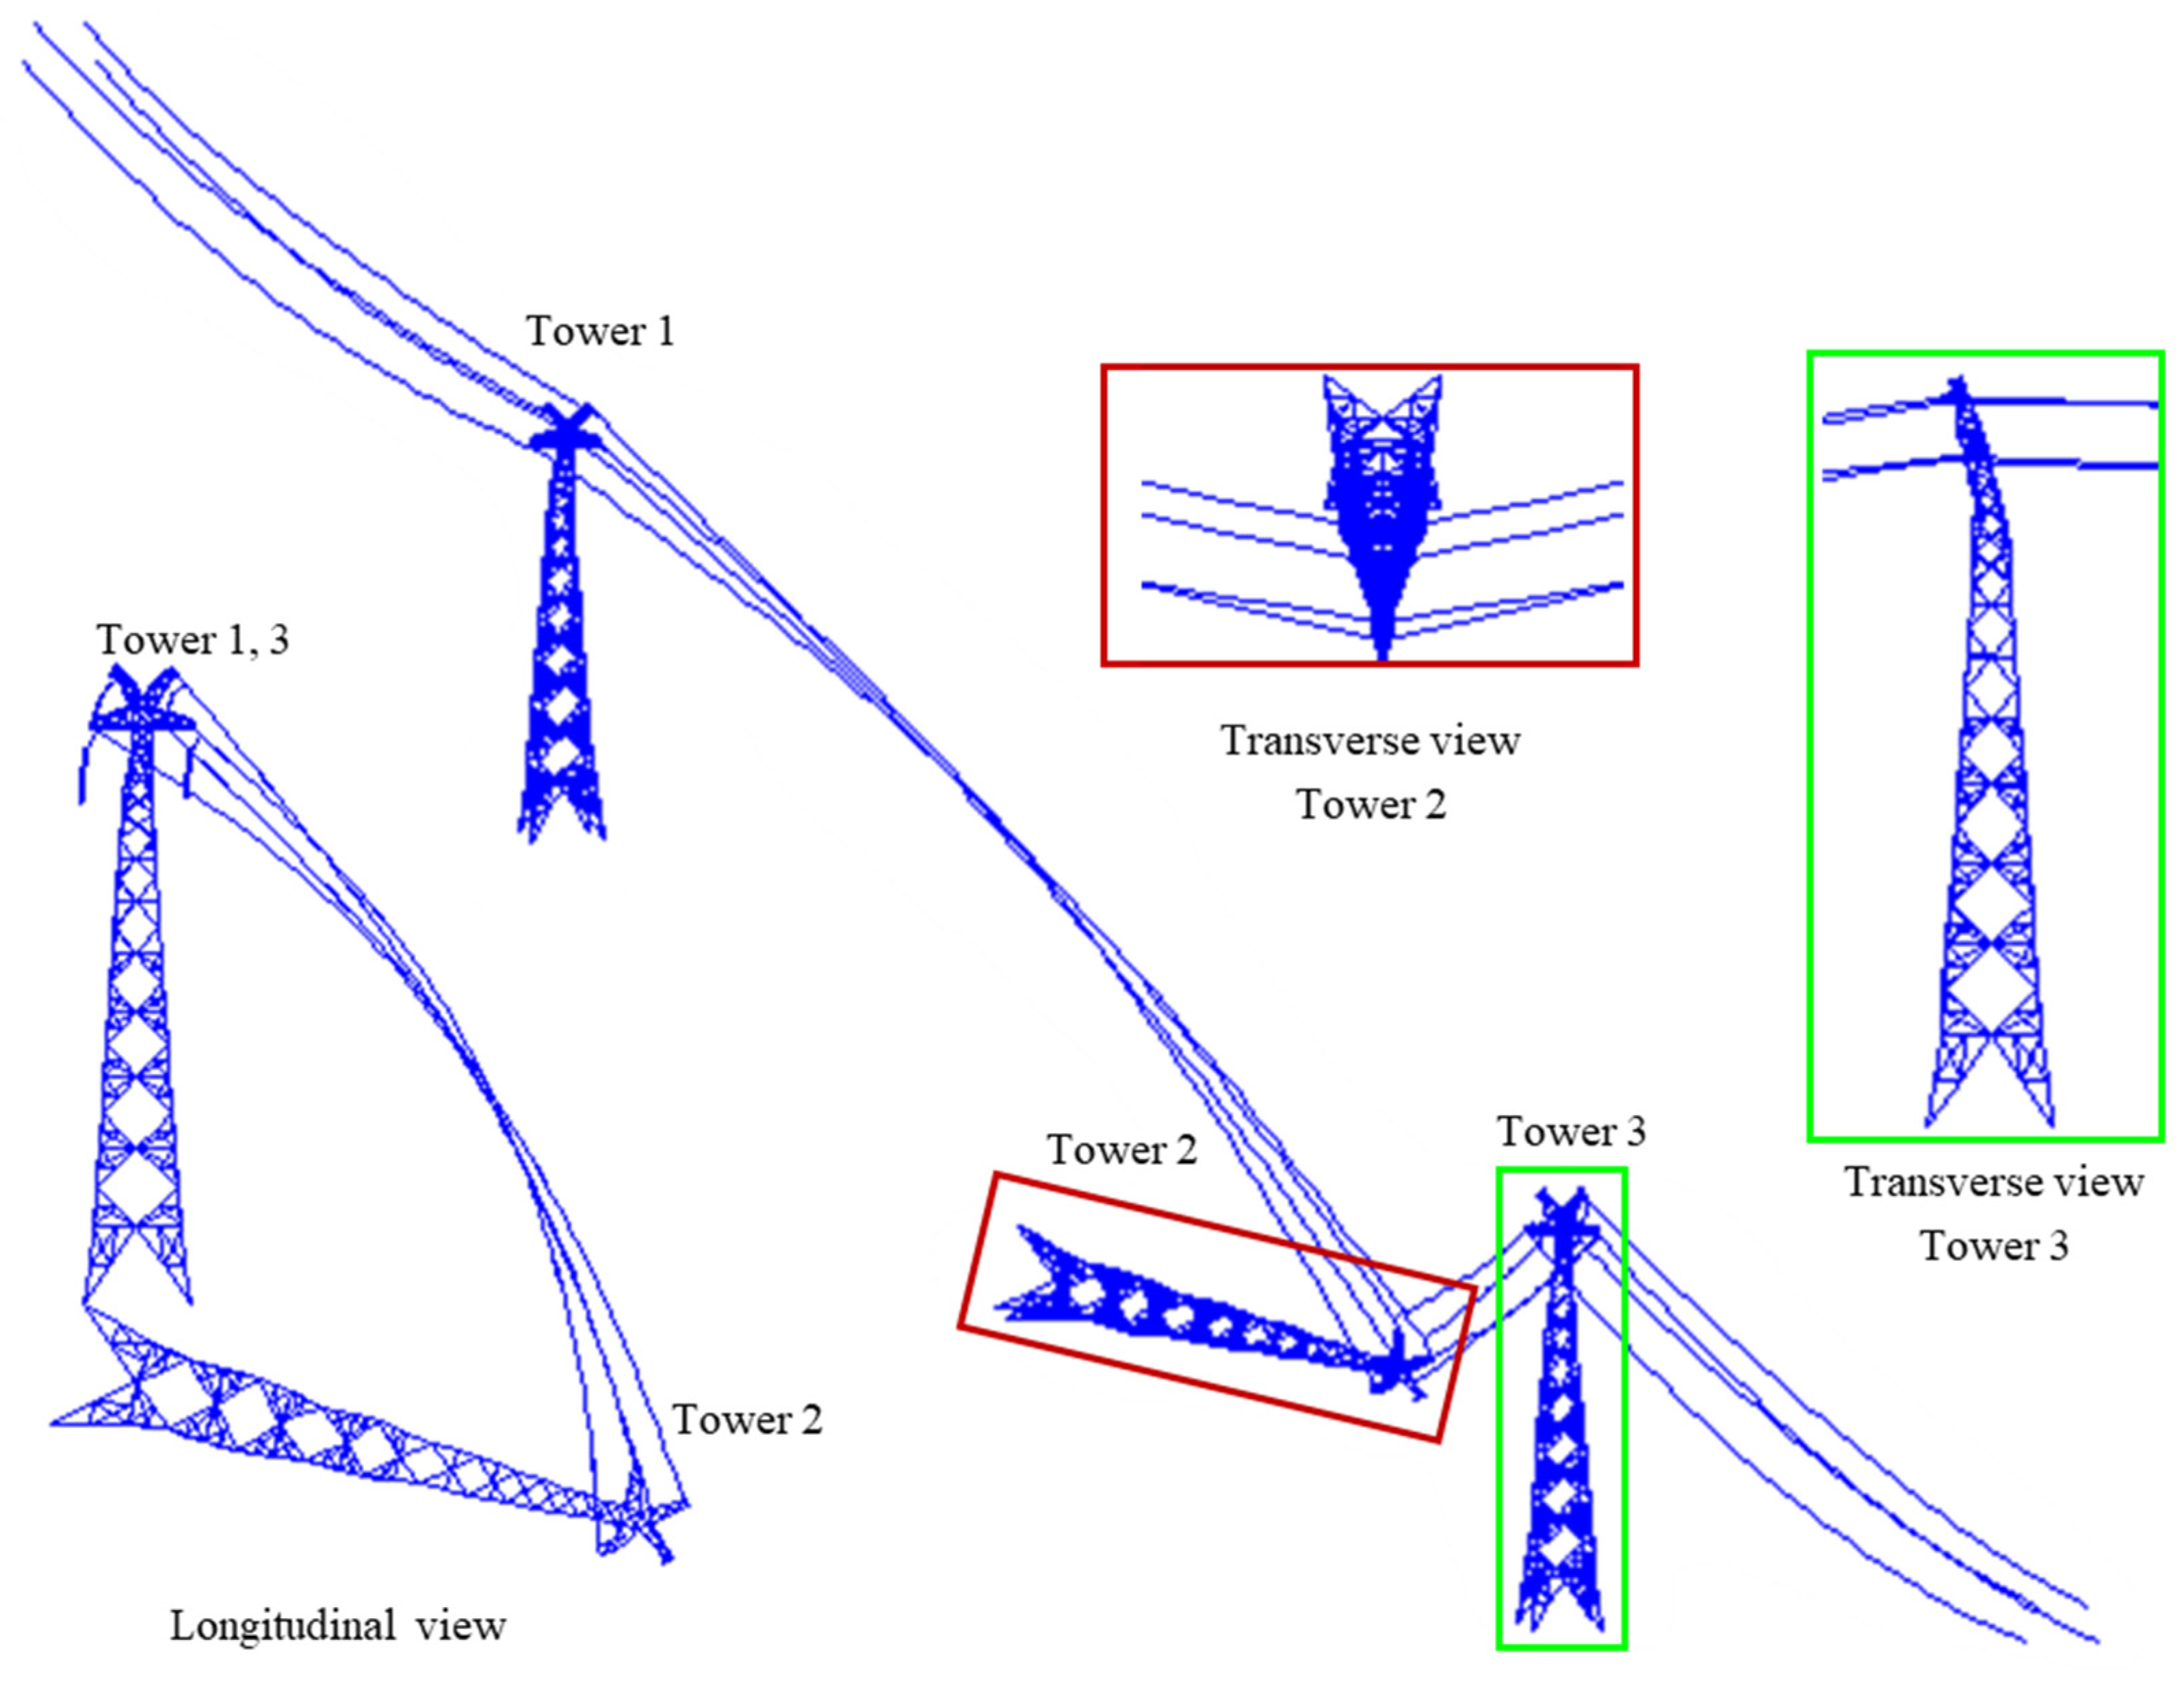
Figure 12.
Behavior of the transmission tower-line structure at t = 12 s under Case 1.
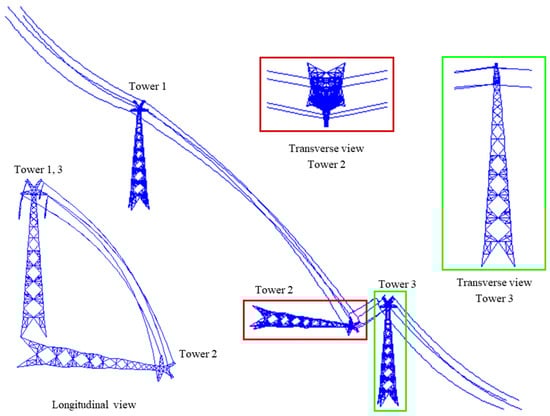
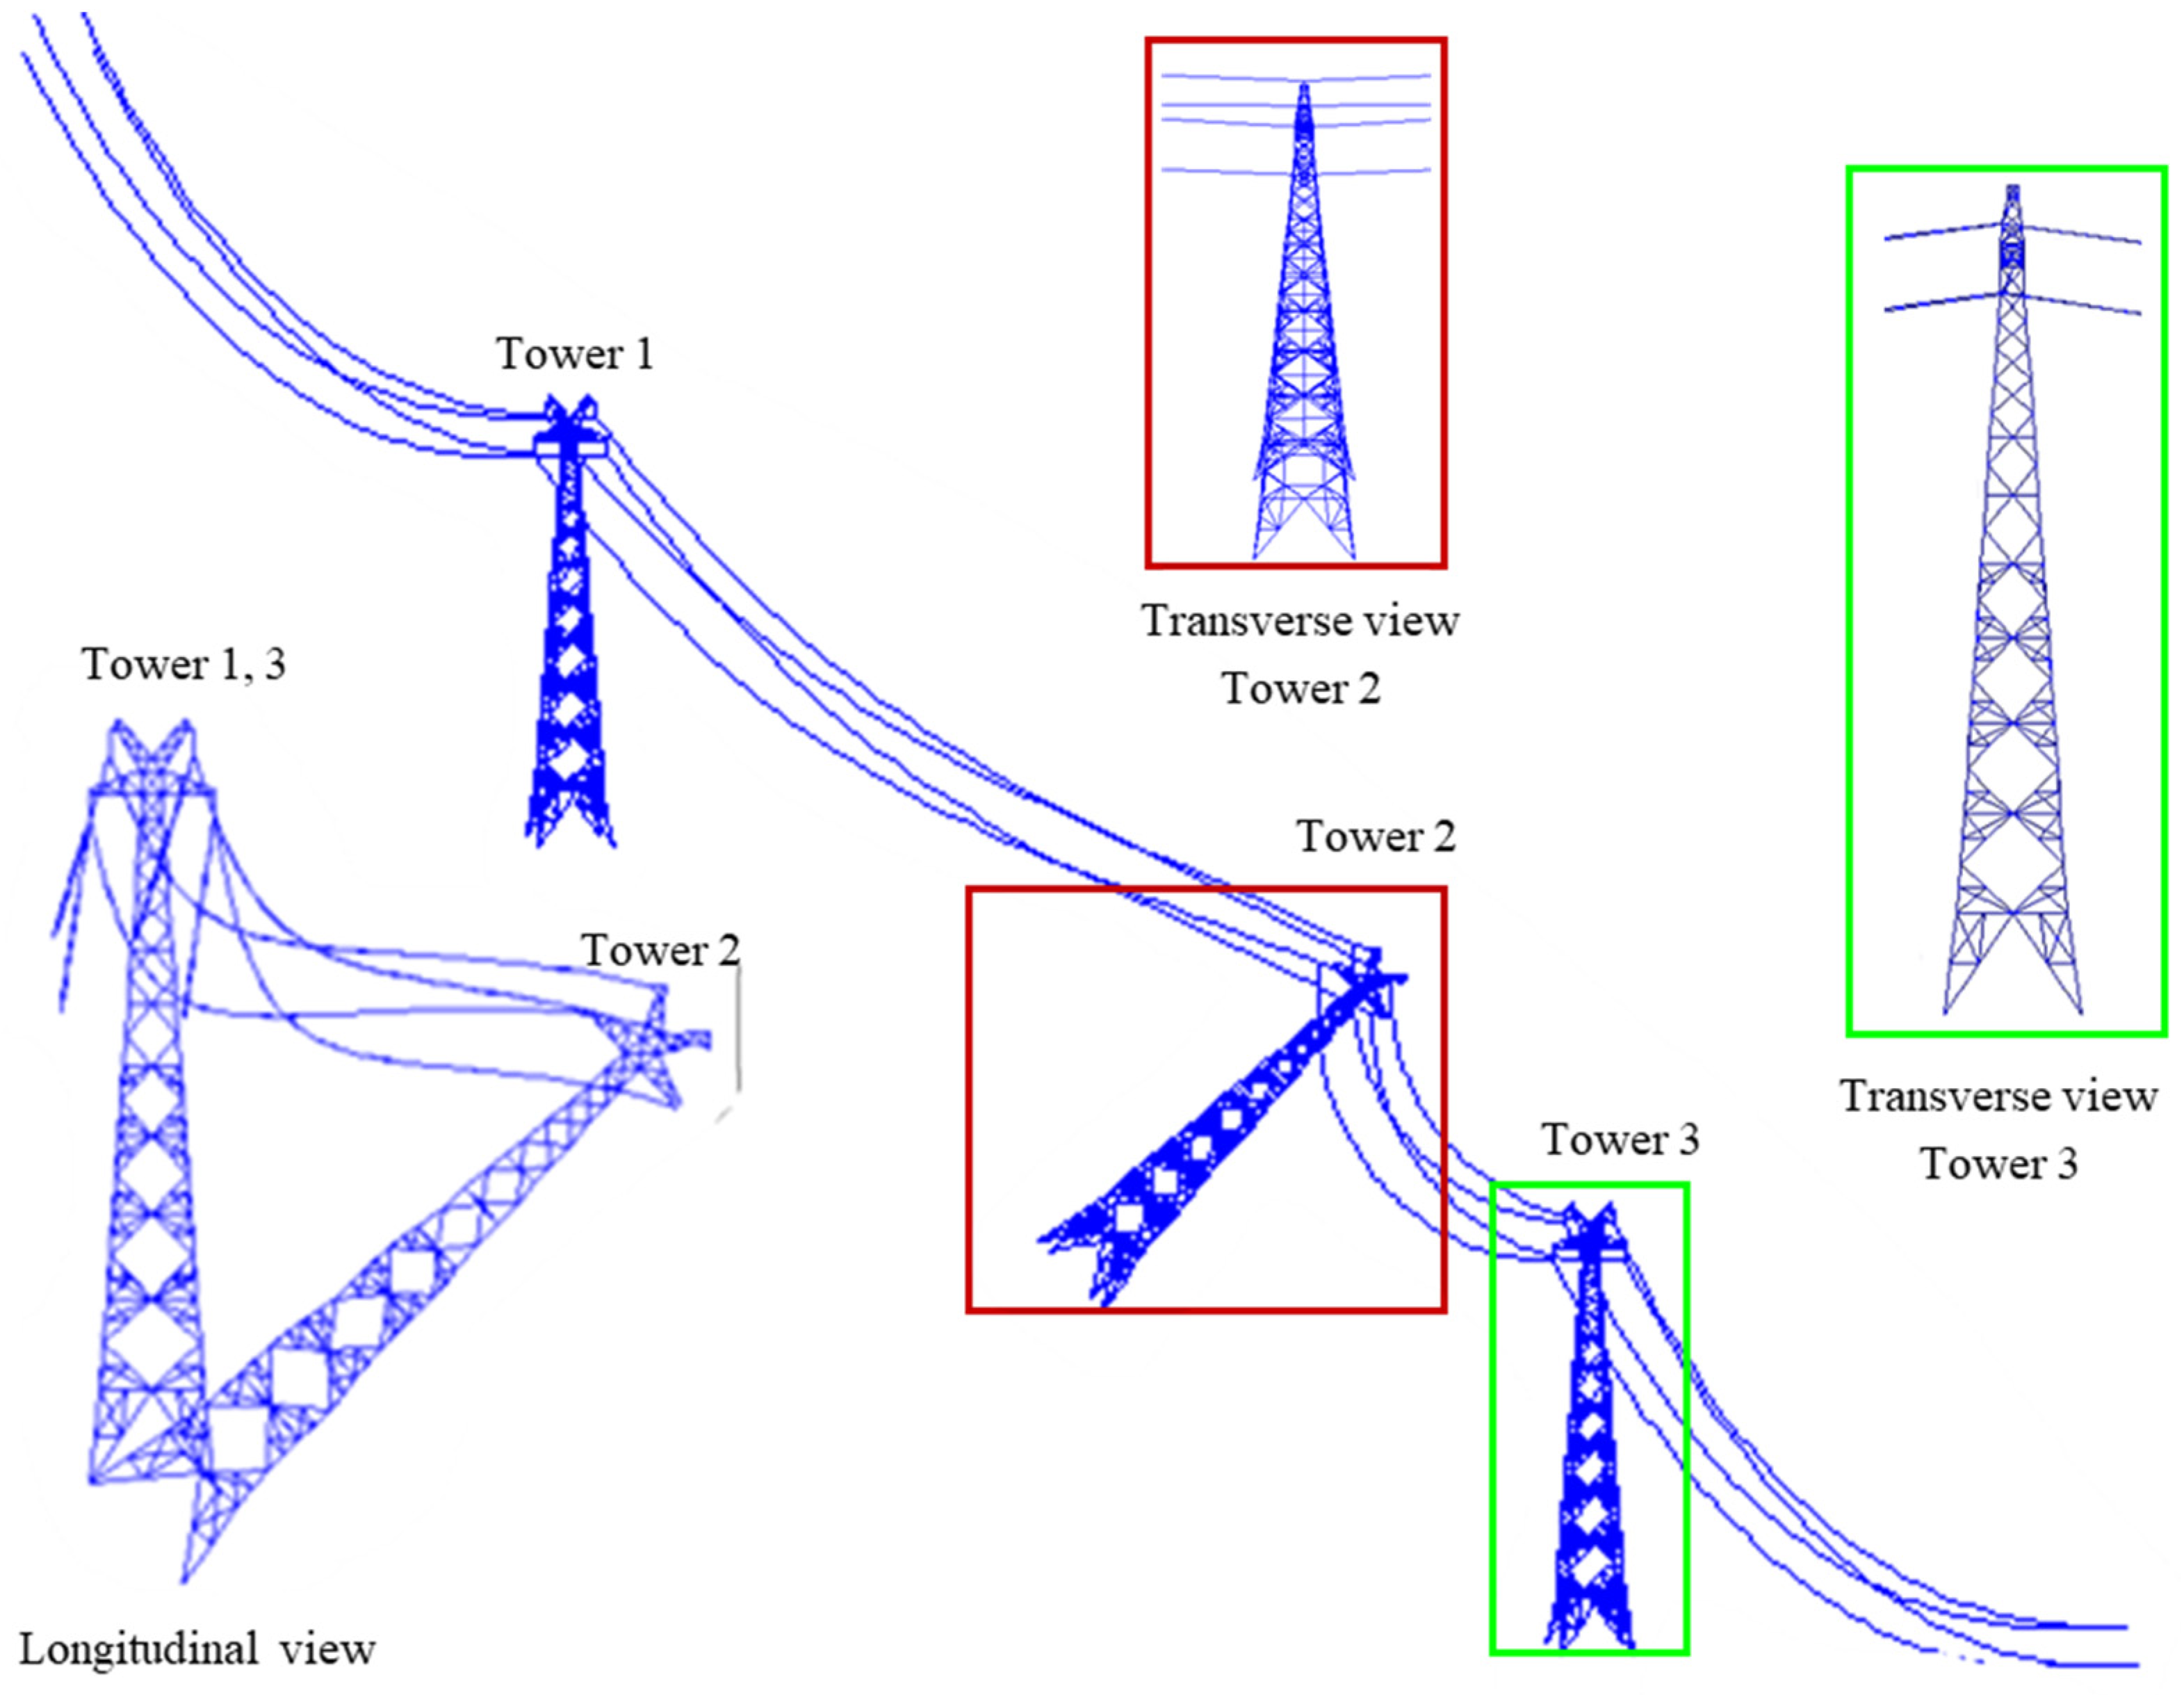
Figure 13.
Behavior of the transmission tower-line structure at t = 14 s under Case 1.
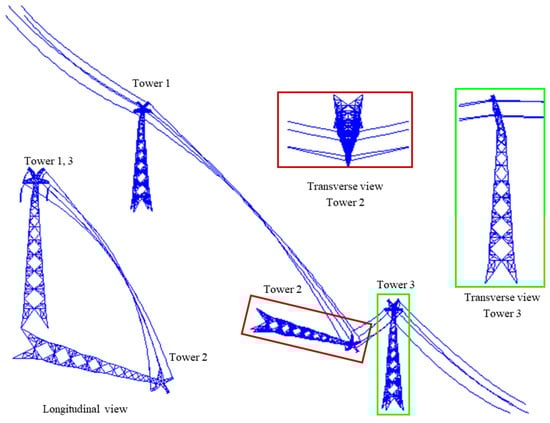
Figure 14.
Behavior of the transmission tower-line structure at t = 14.3 s under Case 1.
5.4. Progressive Collapse Simulation under Case 2
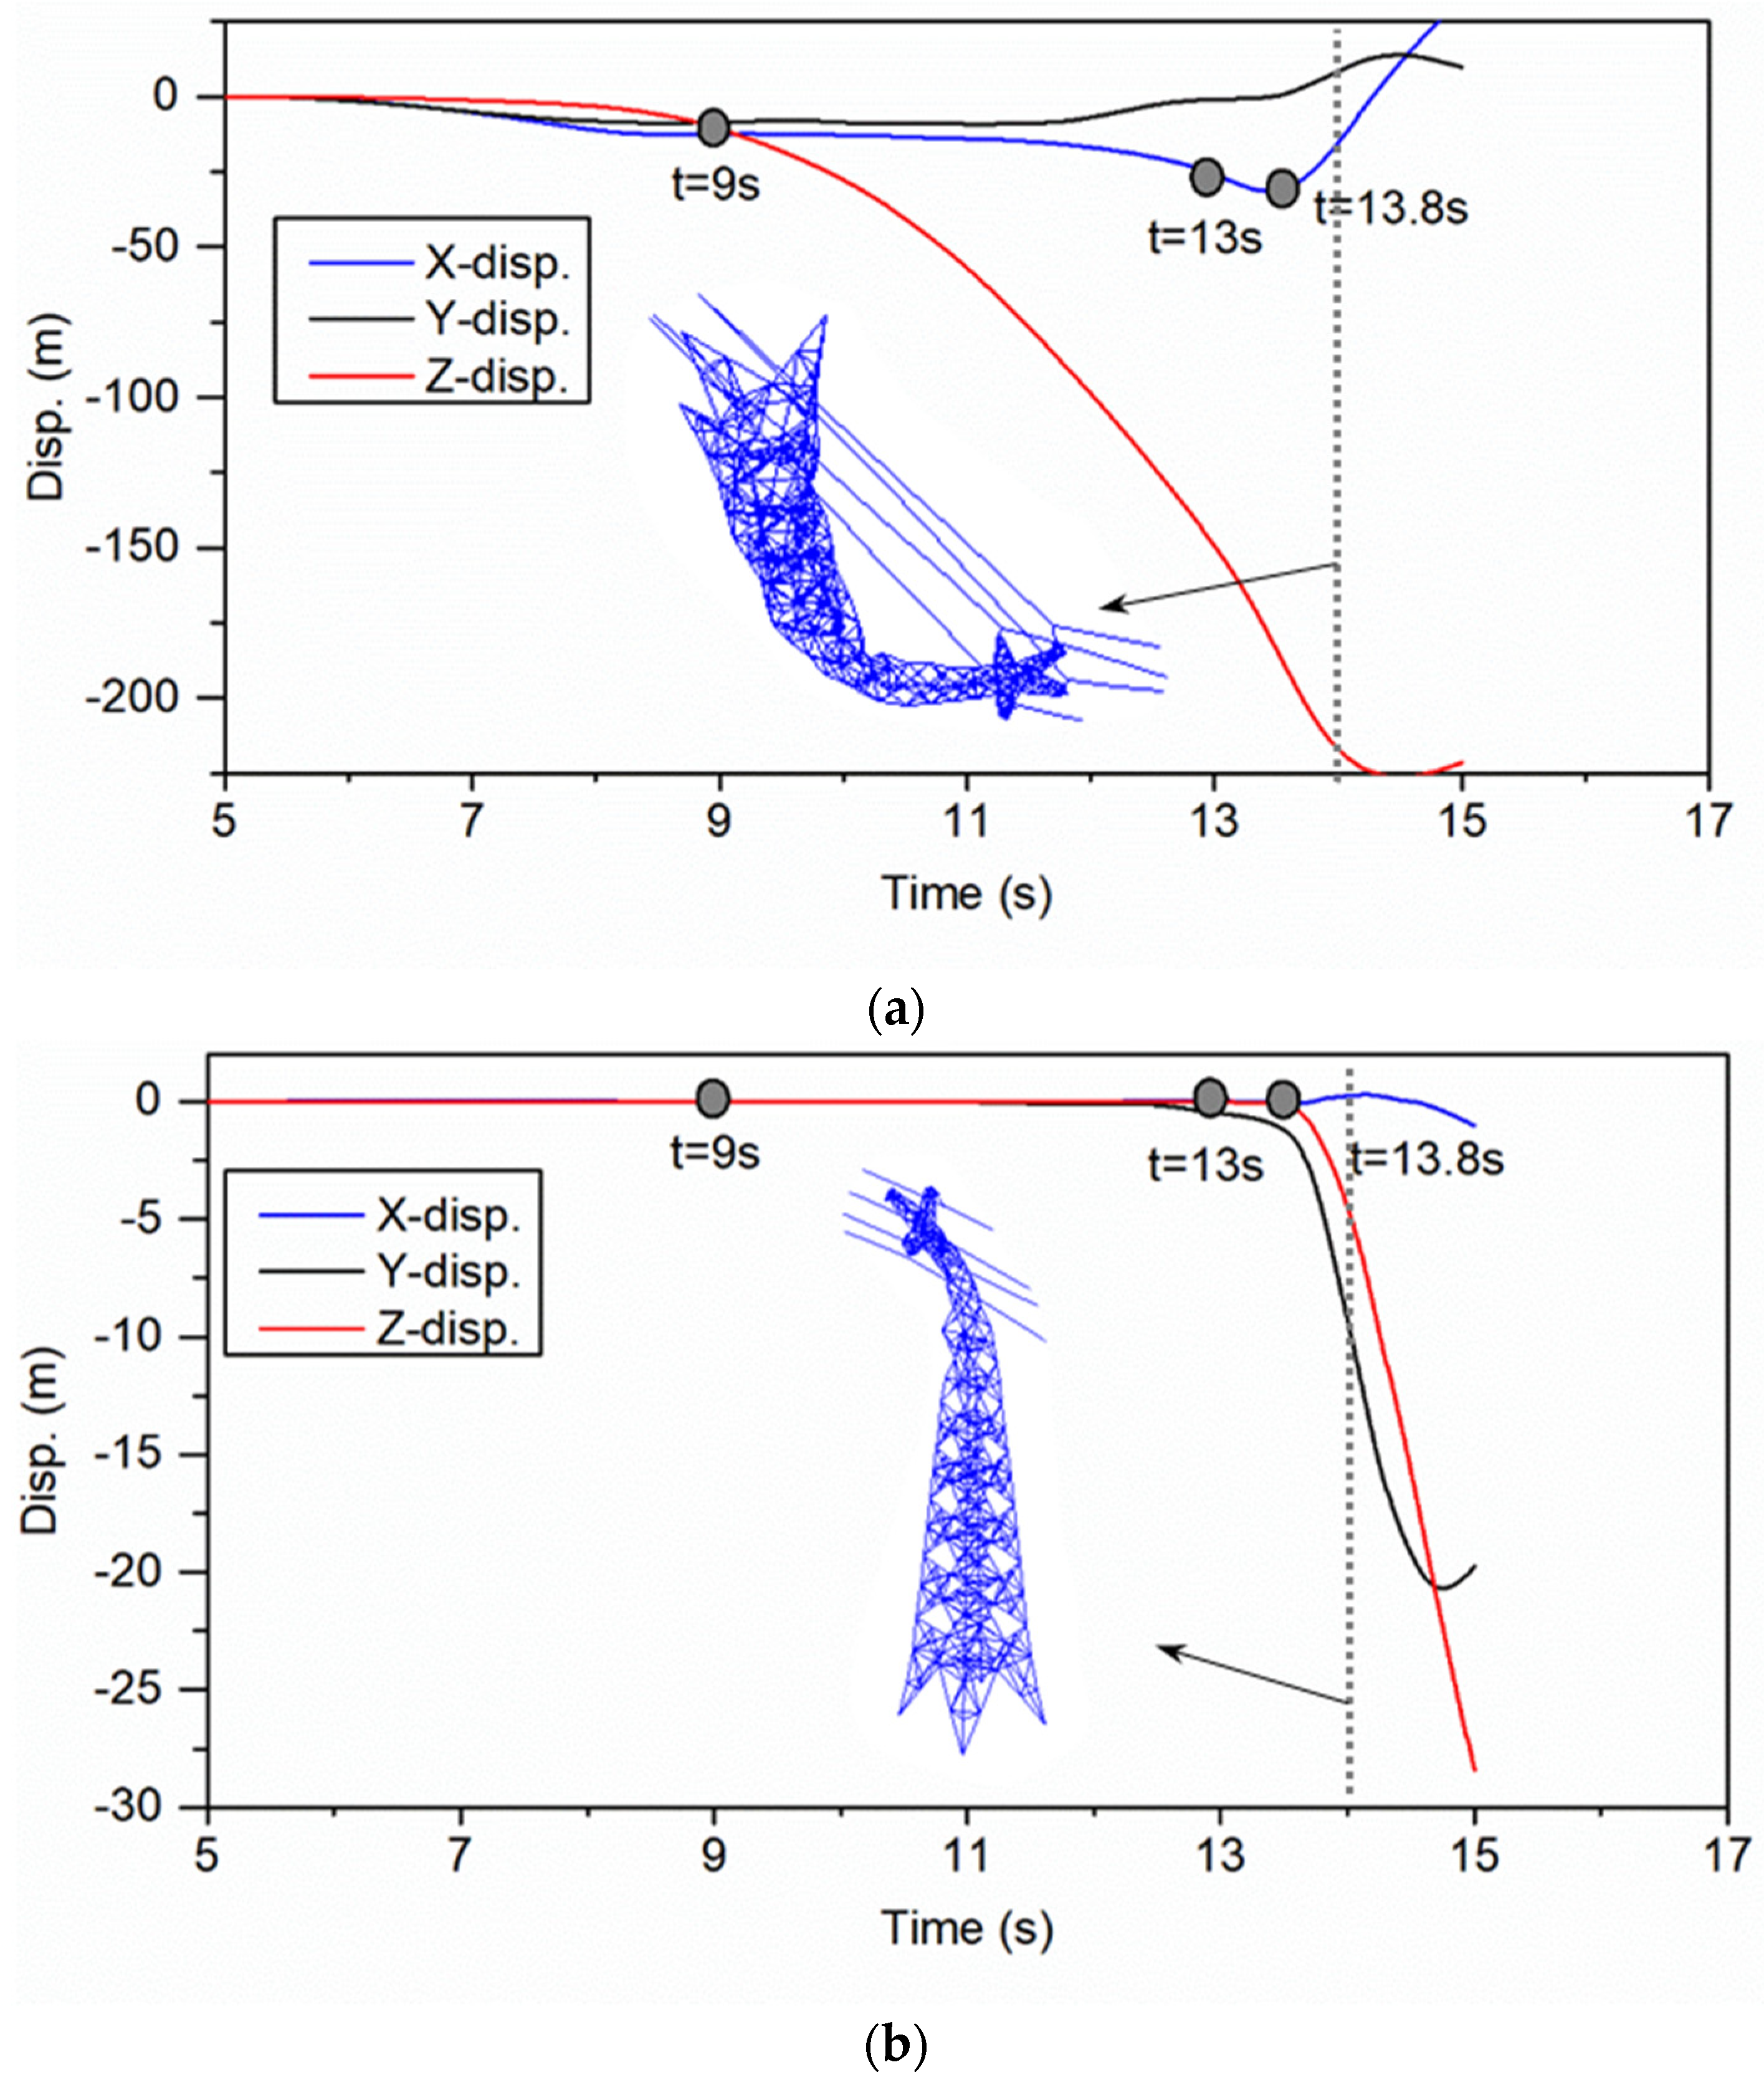
For Case 2, the displacement time histories at the tops of Towers 2 and 3 are shown in Figure 15. The collapse scenarios for the transmission tower-line system at the special moments are presented in Figure 16, Figure 17 and Figure 18. Similarly, the displacement response in the first 5 s is not obvious and therefore the curves are not plotted in Figure 15. Case 2 (Figure 9b) has one less support, namely P6, than Case 1 (Figure 9a), which means the feet of Tower 2 at P6, P7, and P8 would lose their support due to the landslide under Case 2. As illustrated in Figure 15a, the displacement response at the top of Tower 2 not only shows variations in the X- and Z-direction similar to these in Case 1 (Figure 10a), but also shows obvious changes in the Y-direction. At t = 9 s, it can be observed that the collapse pattern under Case 2 (Figure 16) is greatly different from that in Case 1, which presents great deformation along the tower body along with the tilting behavior in Case 1 (Figure 11). This can be explained by the fact that the cable tensions on both sides of Tower 2 are no longer equal when the displacement in the Y-direction occurs. As unbalanced tensions become larger and larger with the increment of the Y-displacement, a hinge forms in the middle of the tower at t = 13 s, as shown in Figure 17. After that, the head of Tower 2 drops greatly due to its own gravity and the displacement response curve in the Z-direction also sees an obvious decline (Figure 15a). In addition, as illustrated in Figure 18, a local failure also occurs in the upper part of the neighboring Tower 3, which is also due to the pulling of cables.
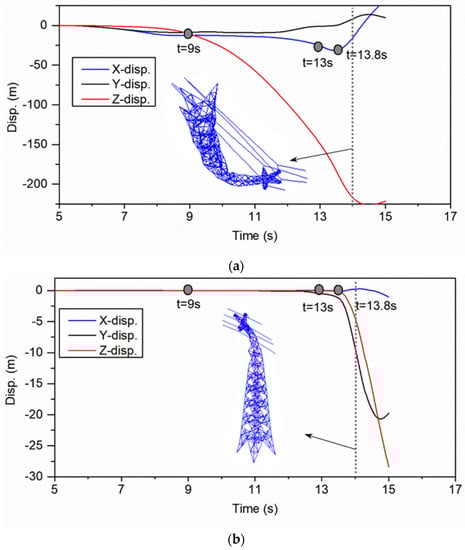
Figure 15.
Displacement response at tower tops under Case 2. (a) Tower 2; (b) Tower 3.
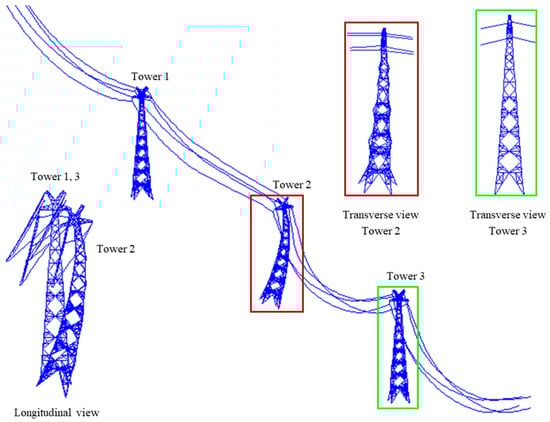
Figure 16.
Behavior of the transmission tower-line structure at t = 9 s under Case 2.
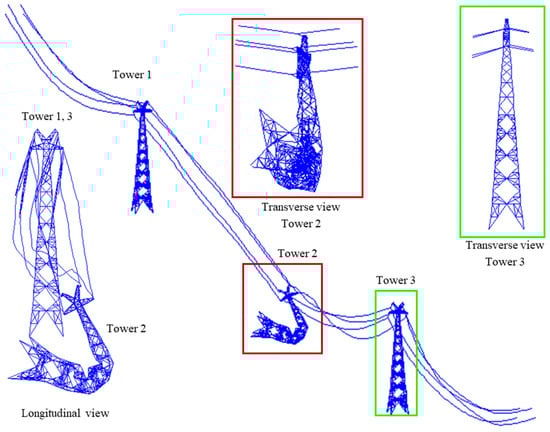
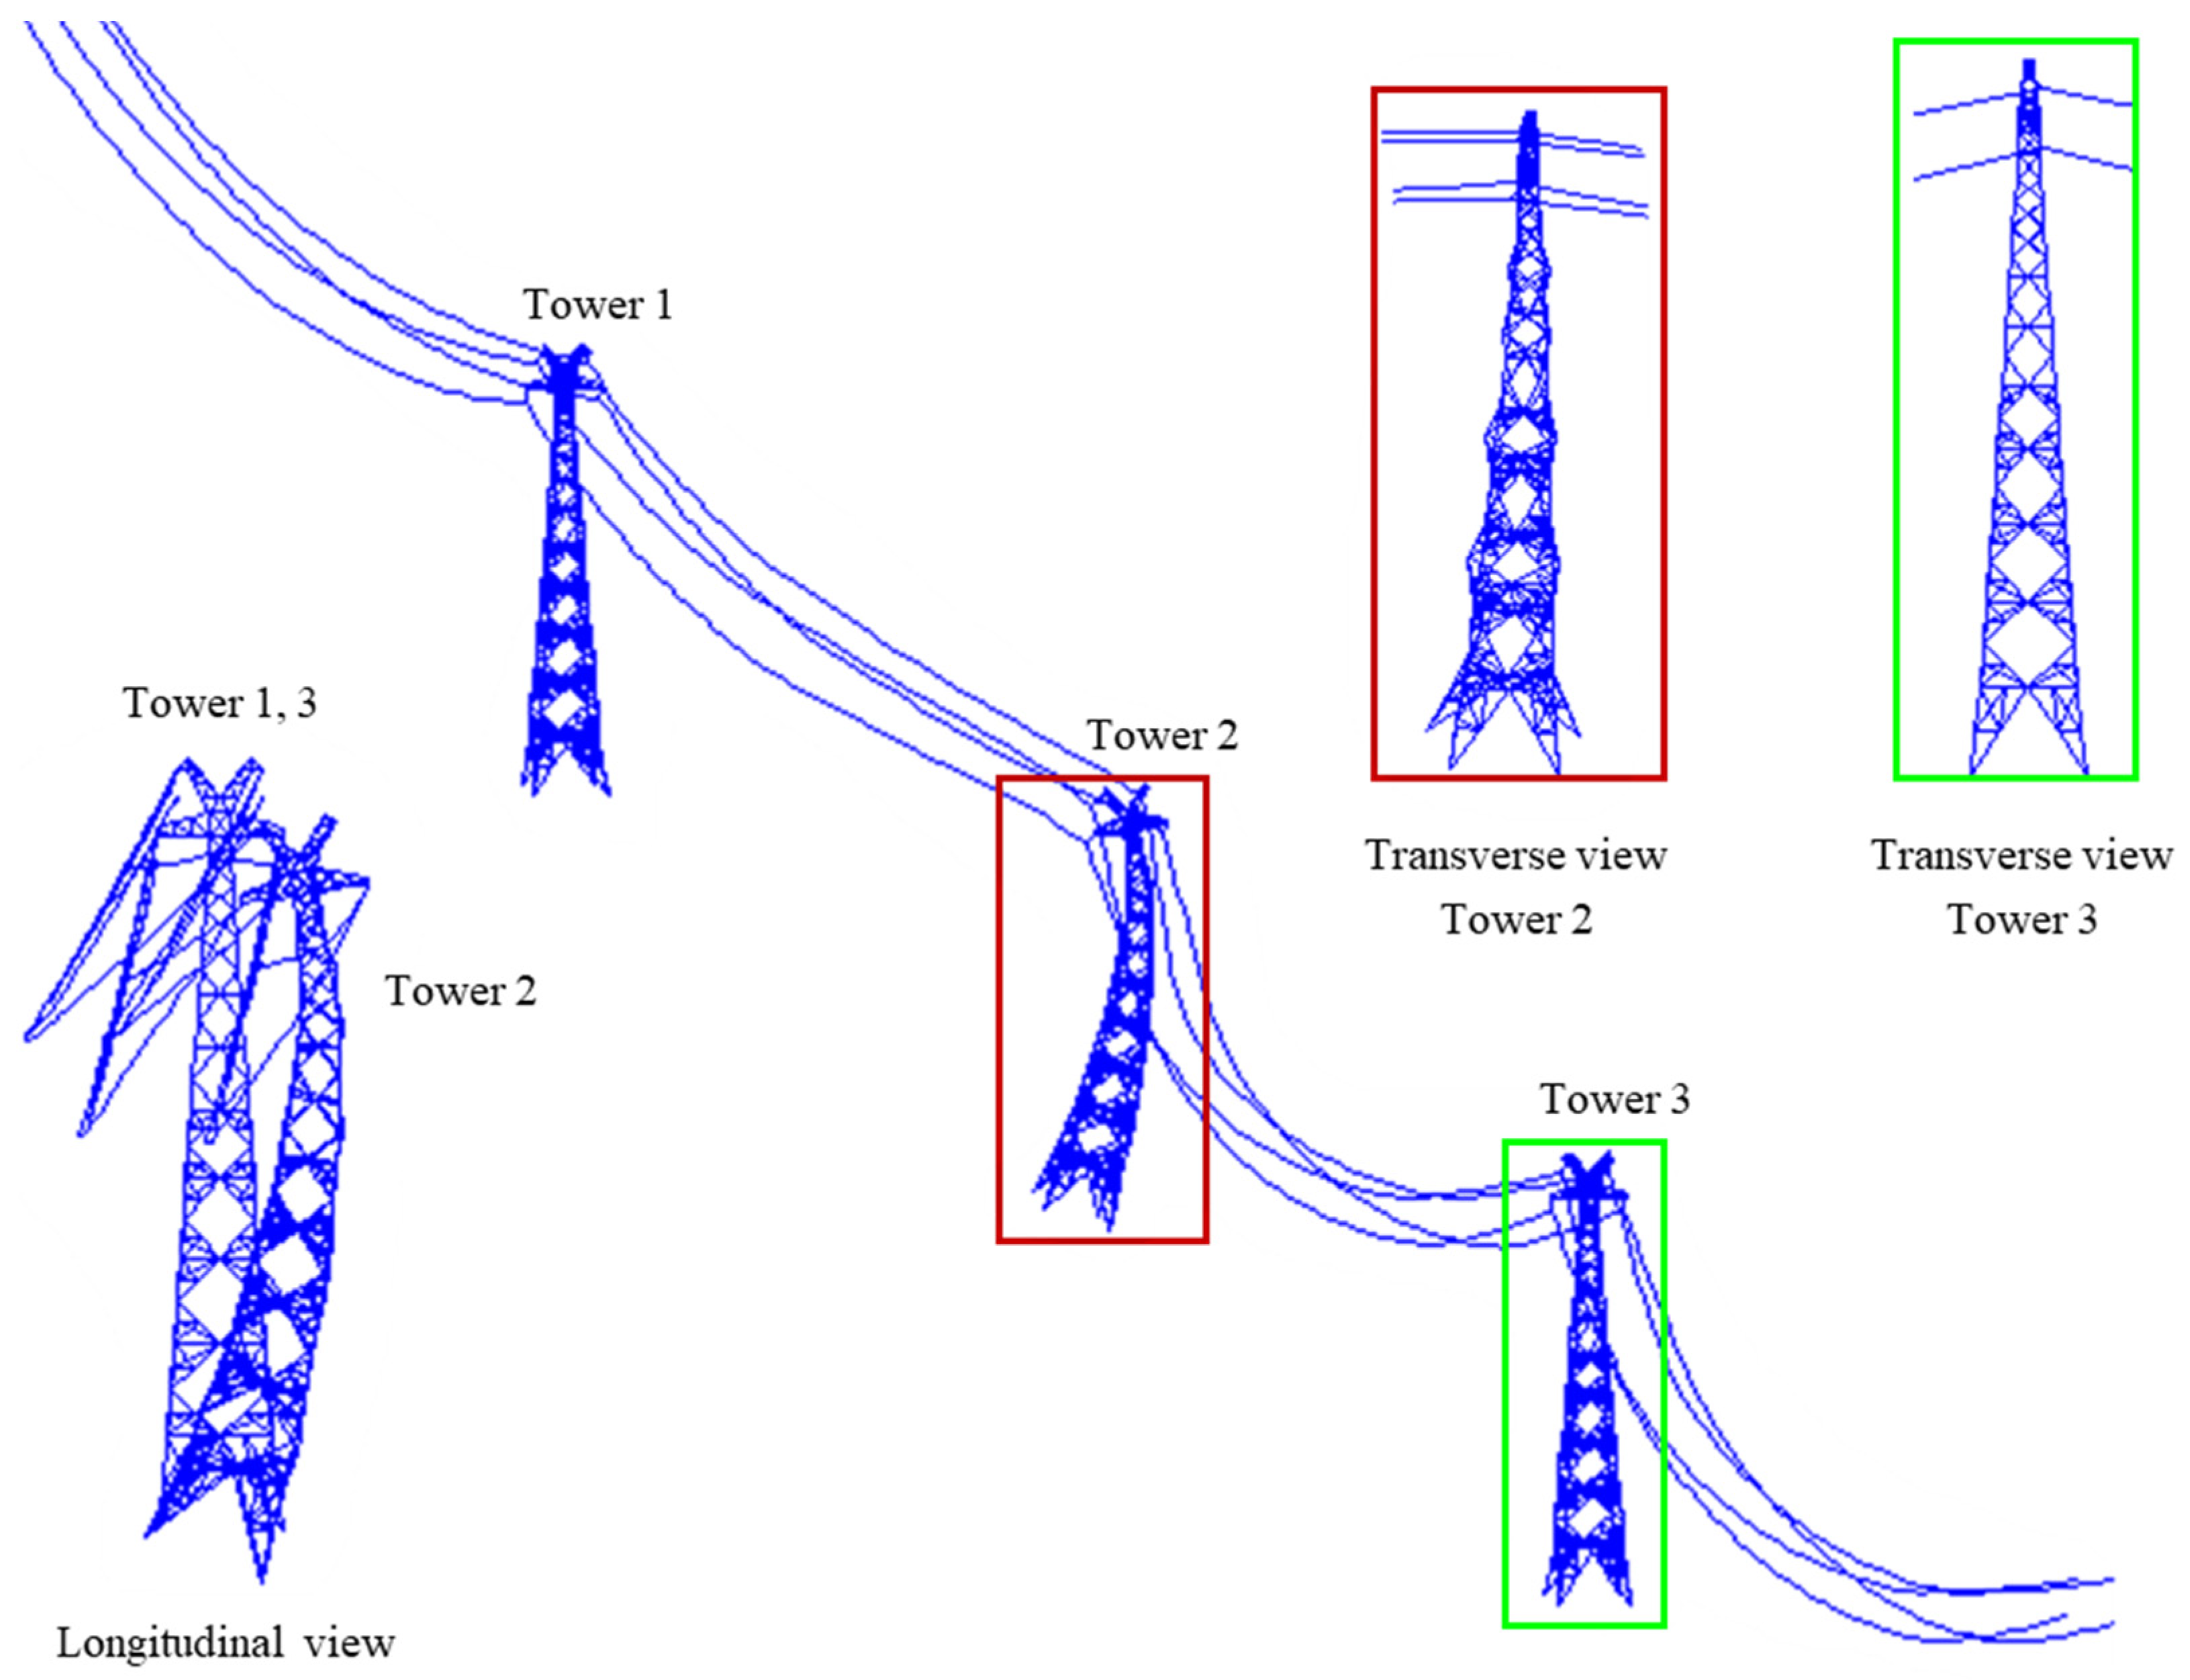
Figure 17.
Behavior of the transmission tower-line structure at t = 13 s under Case 2.
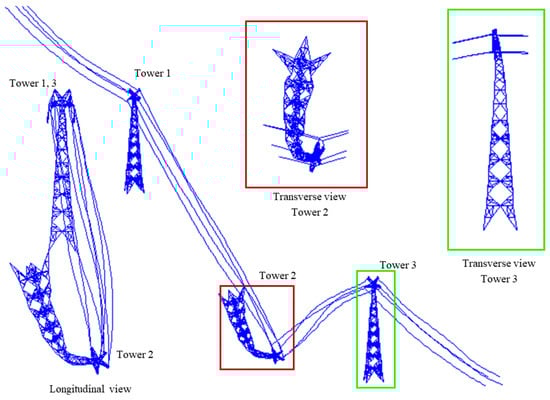
Figure 18.
Behavior of the transmission tower-line structure at t = 13.8 s under Case 2.
6. Discussion
The explicit central difference method was used to solve the dynamic response equation of the structure. It does not require the formation of a global stiffness and therefore it is convenient to process the strong geometry and material nonlinearities involved in the collapse of the tower-line structure caused by landslides. It should be noted that the explicit central difference method is conditionally convergent and the time step in Equations (12) and (13) should be carefully checked. For the finite element of the tower-line system, the time step should be smaller than the critical time step, ( is the minimum natural vibration period of tower members). Based on the method, the collapse simulations of the tower-line system subjected to landslides have been performed to illustrate that the collapse patterns are greatly affected by the failure modes of the tower foundation and the pulling of cables. On one hand, the tower foundation failure modes determine the number and the location of tower feet that lose the supports under landslides, which affects the azimuthal angle as the tower body tilts under landslides. On the other hand, the contribution of the cable pulling to the structural collapse varies with the azimuthal angles. For Case 1, the tilting azimuthal angle of Tower 2 with respect to the longitudinal direction is 90 degrees and the pulling of cables at both sides of Tower 2 counteracts; for case 2, the corresponding azimuthal angle is around 135 degrees, for which the pulling of cables between Towers 2 and Tower 3 is greatly different from that between Towers 1 and Tower 2. Therefore, the collapse scenarios under Case 1 are distinguished from those under Case 2. However, the above simulations do not consider the interactions between the tower foundation and soil during landslides, which possibly affect the failure patterns of the tower-line system. Future work will include the mentioned interactions to improve the accuracy of numerical results.
7. Conclusions
In this study, we analyzed the displacement response at tower tops and the structural collapse scenarios at special moments to investigate the failure mechanism of the tower-line system under landslides. The following conclusions were obtained:
The collapse failure patterns of the transmission tower-line structure vary with the tower foundation failure modes induced by landslides. For Case 1, two tower feet lose the supports under the landslide, and the overall tilting is the main collapse pattern for the tower on the landslide. For Case 2, three tower feet lose the supports under the landslide. The displacement response in the longitudinal direction is no longer zero, which leads to the different cable tensions on both sides of the tower. A hinge forming in the middle of the tower is the main collapse pattern in this case, which is very different from the collapse pattern in Case 1.
Considering that the tower-line system includes many towers that are connected by cables, the failure of one tower would cause the cascade collapse of the neighboring towers in the transmission line due to the pulling effect of cables. For Cases 1 and 2, the neighboring towers share similar collapse patterns, which are represented by the local failure close to the tower head.
Author Contributions
Conceptualization, H.Y. and H.-D.Z.; methodology, H.L. and H.-D.Z.; software, Z.-Q.Z., G.-F.Z. and H.-D.Z.; validation, H.Y., H.L., and D.-H.W.; formal analysis, H.Y.; investigation, H.L.; resources, D.-H.W.; data curation, Z.-Q.Z.; writing—original draft preparation, H.-D.Z.; writing—review and editing, H.Y.; visualization, G.-F.Z.; supervision, D.-H.W. and H.-D.Z.; funding acquisition, D.-H.W. All authors have read and agreed to the published version of the manuscript.
Funding
This research was funded by Yunnan Power Grid Technology Project (YNKJXM20210181) and Hainan Province Science and Technology Special Fund (ZDKJ2021024).
Data Availability Statement
Not applicable.
Conflicts of Interest
The authors declare no conflict of interest.
References
- Wu, D.; Zheng, X.; Xu, Y.; Olsen, D.; Xia, B.; Singh, C.; Xie, L. An open-source extendable model and corrective measure assessment of the 2021 texas power outage. Adv. Appl. Energy 2021, 4, 100056. [Google Scholar] [CrossRef]
- Ivanova, I. Texas Winter Storm Costs Could Top $200 Billion—More Than Hurricanes Harvey and Ike. 2021. Available online: https://www.cbsnews.com/news/texas-winter-storm-uri-costs (accessed on 1 August 2022).
- Tengle, J.; Renault, M. Suspected Hypothermia Deaths in Homes Mount in Texas. 2021. Available online: https://apnews.com/article/houston-hypothermia-weather-conroe-texas-8323ab5f5c1612e632f7f2e6c2c20358 (accessed on 1 August 2022).
- Chang, J. What Happened behind the Nationwide Power Cuts? 2021. Available online: https://m.bjnews.com.cn/detail/163266456914638.html (accessed on 1 August 2022).
- Liu, S.; Yin, K.; Zhou, C.; Gui, L.; Liang, X.; Lin, W.; Zhao, B. Susceptibility Assessment for Landslide Initiated along Power Transmission Lines. Remote Sens. 2021, 13, 5068. [Google Scholar] [CrossRef]
- State Grid Equipment Department and China Electric Power Research Institute. Investigation Report on Geological Hazards of Power Transmission Lines (Yearly Report), 2017–2021; State Grid Equipment Department and China Electric Power Research Institute: Beijing, China, 2021. [Google Scholar]
- Roering, J.J.; Kirchner, J.W.; Dietrich, W.E. Characterizing structural and lithologic controls on deep-seated landsliding: Implications for topographic relief and landscape evolution in the Oregon Coast Range, USA. Geol. Soc. Am. Bull. 2005, 117, 654–668. [Google Scholar] [CrossRef]
- Xu, C.; Dai, F.C.; Yao, X.; Chen, J.; Tu, X.B.; Sun, Y.; Wang, Z.Y. GIS-based landslide susceptibility assessment using analytical hierarchy process in Wenchuan earthquake region. Chin. J. Rock Mech. Eng. 2009, 28, 3978–3985. [Google Scholar]
- Chigira, M.; Wu, X.; Inokuchi, T.; Wang, G. Landslides induced by the 2008 Wenchuan earthquake, Sichuan, China. Geomorphology 2010, 118, 225–238. [Google Scholar] [CrossRef]
- Qi, S.; Xu, Q.; Lan, H.; Zhang, B.; Liu, J. Spatial distribution analysis of landslides triggered by 2008.5. 12 Wenchuan Earthquake, China. Eng. Geol. 2010, 116, 95–108. [Google Scholar] [CrossRef]
- Guo, D.; Hamada, M. Qualitative and quantitative analysis on landslide influential factors during Wenchuan earthquake: A case study in Wenchuan County. Eng. Geol. 2013, 152, 202–209. [Google Scholar] [CrossRef]
- TAKAHASHI, T. Estimation of potential debris flows and their hazardous zones: Soft countermeasures for a disaster. Nat. Disaster Sci. 1981, 3, 57–89. [Google Scholar]
- Rickenmann, D. Empirical relationships for debris flows. Nat. Hazards 1999, 19, 47–77. [Google Scholar] [CrossRef]
- Rickenmann, D. Runout prediction methods. In Debris-Flow Hazards and Related Phenomena; Springer: Berlin/Heidelberg, Germany, 2005; pp. 305–324. [Google Scholar]
- McDougall, S.D.; Hungr, O. Objectives for the development of an integrated three-dimensional continuum model for the analysis of landslide runout. In Debris-Flow Hazards Mitigation: Mechanics, Prediction, and Assessment, Proceedings of the 3rd International DFHM Conference, Davos, Switzerland, Millpress 10–12 September 2003; Rickenmann, D., Chen, C.L., Eds.; Ios Press Inc.: Amsterdam, The Netherlands, 2003; pp. 481–490. [Google Scholar]
- Guo, D.; Hamada, M.; He, C.; Wang, Y.; Zou, Y. An empirical model for landslide travel distance prediction in Wenchuan earthquake area. Landslides 2014, 11, 281–291. [Google Scholar] [CrossRef]
- Tian, L.; Bi, W.; Liu, J.; Dong, X.; Xin, A. Seismic and collapse analysis of a UHV transmission tower-line system under cross-fault ground motions. Earthq. Struct. 2020, 19, 445–457. [Google Scholar]
- Tian, L.; Pan, H.; Qiu, C.; Ma, R.; Yu, Q. Wind-induced collapse analysis of long-span transmission tower–line system considering the member buckling effect. Adv. Struct. Eng. 2019, 22, 30–41. [Google Scholar] [CrossRef]
- Zheng, H.D.; Fan, J. Progressive collapse analysis of a truss transmission tower-line system subjected to downburst loading. J. Constr. Steel Res. 2022, 188, 107044. [Google Scholar] [CrossRef]
- Kassem, M.M.; Beddu, S.; Qi Min, W.; Tan, C.G.; Mohamed Nazri, F. Quantification of the Seismic Behavior of a Steel Transmission Tower Subjected to Single and Repeated Seismic Excitations Using Vulnerability Function and Collapse Margin Ratio. Appl. Sci. 2022, 12, 1984. [Google Scholar] [CrossRef]
- Li, J.; Gao, F.; Wang, L.; Ren, Y.; Liu, C.; Yang, A.; Yan, Z.; Jiang, T.; Li, C. Collapse Mechanism of Transmission Tower Subjected to Strong Wind Load and Dynamic Response of Tower-Line System. Energies 2022, 15, 3925. [Google Scholar] [CrossRef]
- Fu, X.; Li, H.N.; Li, G.; Dong, Z.Q. Fragility analysis of a transmission tower under combined wind and rain loads. J. Wind. Eng. Ind. Aerodyn. 2020, 199, 104098. [Google Scholar] [CrossRef]
- Guan, R.; Xiang, C.; Jia, Z. Anti-Wind Experiments and Damage Prediction of Transmission Tower under Typhoon Conditions in Coastal Areas. Energies 2022, 15, 3372. [Google Scholar] [CrossRef]
- Zhou, Y.; Sheng, Q.; Chen, J.; Li, N.; Fu, X.; Zhou, Y. The failure mode of transmission tower foundation on the landslide under heavy rainfall: A case study on a 500-kV transmission tower foundation on the Yanzi landslide in Badong, China. Bull. Eng. Geol. Environ. 2022, 81, 125. [Google Scholar] [CrossRef]
- Wang, F.Y.; Xu, Y.L.; Qu, W.L. Multi-scale failure analysis of transmission towers under downburst loading. Int. J. Struct. Stab. Dyn. 2018, 18, 1850029. [Google Scholar] [CrossRef]
- Zheng, H.D.; Zhang, B.; Wang, S.B.; Zhou, G.Z. Effects of Blade Numbers on Wind-Induced Fatigue Lives of Straight-Bladed Vertical-Axis Wind-Turbine Tower Bases. Metals 2022, 12, 321. [Google Scholar] [CrossRef]
- International Electrotechnical Commission. Wind Turbines-Part 1: Design Requirements. IEC 614001 Ed. 3; International Electrotechnical Commission: Geneva, Switzerland, 2006. [Google Scholar]
- Higham, N.J. Analysis of the Cholesky Decomposition of a Semi-Definite Matrix; Oxford University Press: Oxford, UK, 1990. [Google Scholar]
- Zheng, H.D.; Fan, J.; Long, X.H. Analysis of the seismic collapse of a high-rise power transmission tower structure. J. Constr. Steel Res. 2017, 134, 180–193. [Google Scholar] [CrossRef]
- Zheng, H.D.; Fan, J. Phenomenological hysteretic model for steel braces including inelastic postbuckling and low-cycle fatigue prediction. J. Struct. Eng. 2019, 145, 04019037. [Google Scholar] [CrossRef]
- Yang, S.C.; Hong, H.P. Nonlinear inelastic responses of transmission tower-line system under downburst wind. Eng. Struct. 2016, 123, 490–500. [Google Scholar] [CrossRef]
- Long, X.; Wang, W.; Fan, J. Collapse analysis of transmission tower subjected to earthquake ground motion. Model. Simul. Eng. 2018, 2018, 2687561. [Google Scholar] [CrossRef]
- Zheng, H.D.; Fan, J. Analysis of the progressive collapse of space truss structures during earthquakes based on a physical theory hysteretic model. Thin-Walled Struct. 2018, 123, 70–81. [Google Scholar] [CrossRef]
- Lewis, W.J.; Jones, M.S.; Rushton, K.R. Dynamic relaxation analysis of the non-linear static response of pretensioned cable roofs. Comput. Struct. 1984, 18, 989–997. [Google Scholar] [CrossRef]
- Zheng, X.Y.; Zheng, H.D.; Lei, Y.; Chen, H. Nonlinear stochastic responses of a newly developed floating wind-solar-aquaculture system. Ocean. Eng. 2021, 241, 110055. [Google Scholar] [CrossRef]
- Zheng, H.D.; Zheng, X.Y.; Lei, Y.; Li, D.A.; Ci, X. Experimental validation on the dynamic response of a novel floater uniting a vertical-axis wind turbine with a steel fishing cage. Ocean. Eng. 2022, 243, 110257. [Google Scholar]
- Duan, Y.F.; Wang, S.M.; Yau, J.D. Vector form intrinsic finite element method for analysis of train–bridge interaction problems considering the coach-coupler effect. Int. J. Struct. Stab. Dyn. 2019, 19, 1950014. [Google Scholar] [CrossRef]
- Higham, D.J.; Higham, N.J. MATLAB Guide; Society for Industrial and Applied Mathematics: Philadelphia, PA, USA, 2016. [Google Scholar]
- Veletsos, A.S.; Darbre, G.R. Dynamic stiffness of parabolic cables. Earthq. Eng. Struct. Dyn. 1983, 11, 367–401. [Google Scholar] [CrossRef]
- Loredo-Souza, A.M.; Davenport, A.G. The effects of high winds on transmission lines. J. Wind. Eng. Ind. Aerodyn. 1998, 74, 987–994. [Google Scholar] [CrossRef]
- Takeuchi, M.; Maeda, J.; Ishida, N. Aerodynamic damping properties of two transmission towers estimated by combining several identification methods. J. Wind. Eng. Ind. Aerodyn. 2010, 98, 872–880. [Google Scholar] [CrossRef]


Publisher’s Note: MDPI stays neutral with regard to jurisdictional claims in published maps and institutional affiliations. |
© 2022 by the authors. Licensee MDPI, Basel, Switzerland. This article is an open access article distributed under the terms and conditions of the Creative Commons Attribution (CC BY) license (https://creativecommons.org/licenses/by/4.0/).