Article

Liquefied Natural Gas Cold Energy Utilization for Land-Based Cold Water Fish Aquaculture in South Korea

1
Graduate Program, Department of Energy & Mechanical Engineering, Gyeongsang National University, Tongyeong-si 53064, Korea
2
School of Mechanical Engineering, Ulsan National Institute of Science and Technology, Ulsan 44919, Korea
3
Department of Automobile, Korea Polytechnic VII, Changwon-si 51518, Korea
4
Department of Energy & Mechanical Engineering, Gyeongsang National University, Tongyeonghaean-ro 2, Tongyeong-si 53064, Korea
*
Author to whom correspondence should be addressed.
Energies 2022, 15(19), 7322; https://doi.org/10.3390/en15197322
Submission received: 23 August 2022 / Revised: 25 September 2022 / Accepted: 30 September 2022 / Published: 5 October 2022

Abstract

:
A new concept of land-based Atlantic salmon farming utilizing liquefied natural gas (LNG) cold energy is proposed. In this study, laboratory-scale experiments were conducted using liquid nitrogen as a cold energy source to confirm whether the water temperature of a fish farming tank can reach below 17 °C within an hour. In particular, the effects of the mass flow rates of liquid nitrogen (0.0075, 0.01, and 0.0125 kg/s) and water (0.05, 0.1, and 0.15 kg/s) on the cooling performances of water were investigated. The results showed that a higher mass flow rate of liquid nitrogen results in a better water cooling performance. In the case of varying the mass flow rate of liquid nitrogen, it was observed that the mass flow rate of 0.0125 kg/s showed the greatest water temperature difference of 9.10 °C/h, followed by that of 0.01 kg/s (5.88 °C/h), and 0.0075 kg/s (5.06 °C/h). In the case of varying the mass flow rate of water, it was observed that the mass flow rate of 0.05 kg/s showed the most significant water temperature difference of 7.92 °C/h, followed by that of 0.1 kg/s (6.26 °C/h), and 0.15 kg/s (5.53 °C/h). Based on the experimental results of this study and the water cooling heat source by an LNG mass flow rate of 220.5 kg/s, the estimated production capacity of Atlantic salmon was approximately 14,000 tons, which is 36.8% of that of imported salmon in South Korea.

1. Introduction

Natural gas (NG), the third primary energy source following petroleum and coal, has been increasingly utilized since 2010, and its utilization is expected to increase steadily by 2050. According to current energy demand trends, it will soon become the second primary energy source [1,2,3]. This is because it is more environmentally friendly and emits fewer greenhouse gases (GHGs) and other pollutant content fuel when compared to petroleum and coal. In other words, NG is a clean energy source compared to other fossil fuels; hence, it is currently the main energy source for the implementation of strict eco-environmental regulations. Significant amounts of pollutants are emitted from the combustion of oil and coal, owing to their chemical contents. The release of NG from CO2, particle emissions, sulfur oxides, and nitrogen oxides are approximately 56%, 0.3%, 0%, and 20%, respectively, of that of coal [4].
Trade is supplied to the global market via two primary routes. One is by transporting through gas transmission pipelines (GTPs) and the other is by using liquefied natural gas (LNG) carriers. The most optimal supply technology is selected based on the geographical location between the NG production site and the end user. The GTP is considered a more feasible and economical option than LNG carriers when the distance between the NG reservoir and the end user is less than 1000 km. However, when the distance exceeds 3500 km, the GTP is considered to be unprofitable and risky, whereas an LNG carrier is technically and economically feasible [5]. Hence, NG in cryogenic liquid form is the most suitable and preferred transportation method for cross-ocean and offshore NG production sites.
During the conversion from NG to LNG at atmospheric pressure and −162 °C, the volume of LNG is 625 times smaller than that of NG [6]. Owing to its considerably reduced volume, LNG is stored economically in a land-based LNG tank in the LNG receiving terminals of the import region and is then regasified before NG is supplied to the end users [7]. To vaporize LNG, several vaporizers such as open rack vaporizers (ORVs), submerged combustion vaporizers (SCVs), ambient air vaporizers, and intermediate fluid vaporizers are used, depending on their characteristics. In general, ORVs and SCVs are the most widely used vaporizers to vaporize LNG. During regasification in LNG vaporizers, a significant amount of LNG cold energy is released and can be recovered through various approaches. LNG cold energy should be recovered because it can increase energy and exergy efficiency and decrease GHG emissions. In addition, it can create new high-value-added industries, such as land-based aquaculture. According to He et al. [8], Japan, being the largest importer of LNG worldwide, possesses 5214 MW of available cold energy. Hence, Japan has been known as a pacemaker for utilizing cold energy, focusing particularly on power generation, since the 1970s [9]. By contrast, other countries, including South Korea (2645 MW of available cold energy), that possess a significant amount of available LNG cold energy are not practically utilizing LNG cold energy. Therefore, efforts to utilize LNG cold energy in various industrial fields are required.
Meanwhile, the consumption of food fish has increased at a rate of 3.1% on average from the 1960s to 2017. The abovementioned number is almost two-fold the annual world population growth (1.6%) for the same period. In addition, the per capita fish consumption increased by 1.5% per year from 1960 to 2018. To manage the increased fish consumption, the marine- and inland-based aquaculture production average per year has increased from 6.3 million tons in 1986 to 30.8 million tons in 2018, as well as 8.6 million tons in 1986 to 51.3 million tons in 2018 [10]. The difference in the growth rate of aquaculture production between marine and inland indicates some limitations in marine-based aquaculture due to government regulations and inevitable environmental problems. Consequently, land-based aquaculture has developed more rapidly than marine-based aquaculture. In particular, since the introduction of a recirculating aquaculture system (RAS), land-based salmon farming has emerged in some countries, particularly in Norway, which is the largest producer of marine-based aquaculture of salmon worldwide. This is because the RAS for salmon farming is cost-effective [11,12] and yields high numbers of salmon [13].
Atlantic salmon (Salmo salar), one of the major species produced in world aquaculture, is known to survive only at temperatures below 17 °C–19 °C [14,15,16,17,18]. As such, Atlantic salmon can only be bred in countries with low seawater temperatures for the entire season, such as Norway and Chile. In other words, to breed Atlantic salmon in areas where the seawater temperature exceeds 17 °C–19 °C for certain seasons, cold seawater must be supplied or generated constantly and economically, which is challenging. Consequently, some countries where Atlantic salmon is highly demanded but cannot be bred in conventional aquaculture methods (such as South Korea) have relied almost entirely on imports of Atlantic salmon. Figure 1 shows the monthly average seawater temperature near LNG receiving terminals in South Korea. As shown in Figure 1 [19], the seawater temperature exceeded 17 °C for 6 months from May to October in South Korea. This implies that conventional aquaculture methods cannot be utilized for farming cold water fish in South Korea.
However, the advancement of land-based aquaculture technology and the RAS renders economic farming of Atlantic salmon theoretically possible if cold seawater can be stably supplied. A solution is to utilize LNG cold energy for land-based aquaculture of cold water fish. For example, South Korea, one of the top three LNG importers worldwide, possesses a significant amount of available LNG cold energy, and all LNG receiving terminals in the country are located in the coastal region. In the Tongyeong LNG receiving terminal, 12 ORVs (180 ton/h each) are installed and can recover LNG cold energy as cold water. Hence, the recovered cold water can be a promising cold energy source for breeding cold water fish in land-based farming.
In this study, an experiment using liquid nitrogen as a cold energy source was conducted to investigate the effect of supplying LNG and seawater at a certain mass flow rate on Atlantic salmon farming. Furthermore, the production capacity of Atlantic salmon using LNG cold energy was estimated based on the experimental results.

2. LNG Cold Energy Utilization

LNG cold energy can be recovered and utilized in various forms, as mentioned in Section 1, thereby affording significant opportunities to increase the economic value and efficiency of using LNG, as well as to manage environmental issues. Unlike other fossil fuels such as coal and oil, LNG is advantageous, owing to it cryogenic properties. However, the application of LNG cold energy is typically directed toward cryogenic power generation cycles and air separation units. In this section, major systems applying LNG cold energy, as well as a potential application field, i.e., land-based cold water fish aquaculture, are reviewed.

2.1. LNG Cryogenic Utilization of Power Generation Cycle

The cryogenic power generation cycle is the most widely considered and preferred method for utilizing LNG cold energy. To supply NG to end users, LNG must be regasified. Hence, every LNG receiving terminal must be installed with LNG regasification units which have the appropriate capacity. Several concepts using LNG cold energy have been proposed to provide LNG regasification units as waste or low-grade heat sources to convert the phase of the LNG from liquid to gas [20,21,22]. Similarly, LNG regasification units are regarded as heat sinks in the LNG cryogenic power generation cycle. Basic types of cryogenic power generation cycles using LNG cold energy exist, such as gas, direct expansion, and organic Rankine cycles. In 1979, Osaka Gas Co. in Japan utilized LNG cold energy via an organic Rankine cycle with propane as the working fluid. It has been reported that an LNG terminal receiving 5 million tons of LNG per year can generate a power output of 240 MW [23].
The direct expansion cycle is generally combined with other types of cycles to increase the overall cycle efficiency because available LNG cold energy remains. Among the various forms of LNG exergy, pressure is only recovered during the direct expansion cycle [24]. As shown in Figure 2, the combined power generation cycle comprises two main aspects: the direct expansion of LNG and the organic Rankine cycle. LNG cold energy can serve as a heat sink for the organic Rankine cycle. As indicated in streams 1-2-3-4, LNG is transported to turbine 1 with a pressure higher than the atmospheric pressure by pump P1. Before reaching turbine 1, the LNG phase changes from liquid to gas by releasing cold energy to the LNG vaporizer. The transported NG expands in turbine 1, generating electricity. Meanwhile, for streams 5-6-7-8-9, the exhausted steam, which is the working fluid in the organic Rankine cycle, is saturated in the LNG vaporizer. The pressure of the liquefied working fluid increases after passing pump 2 or P2. Subsequently, the phase of the working fluid is changed from liquid to gas by the heat source through streams 7–8 and 9–10. Consequently, the working fluid expands in turbine 2, and electricity is generated.

2.2. LNG Cryogenic Utilization of Air Separation Process

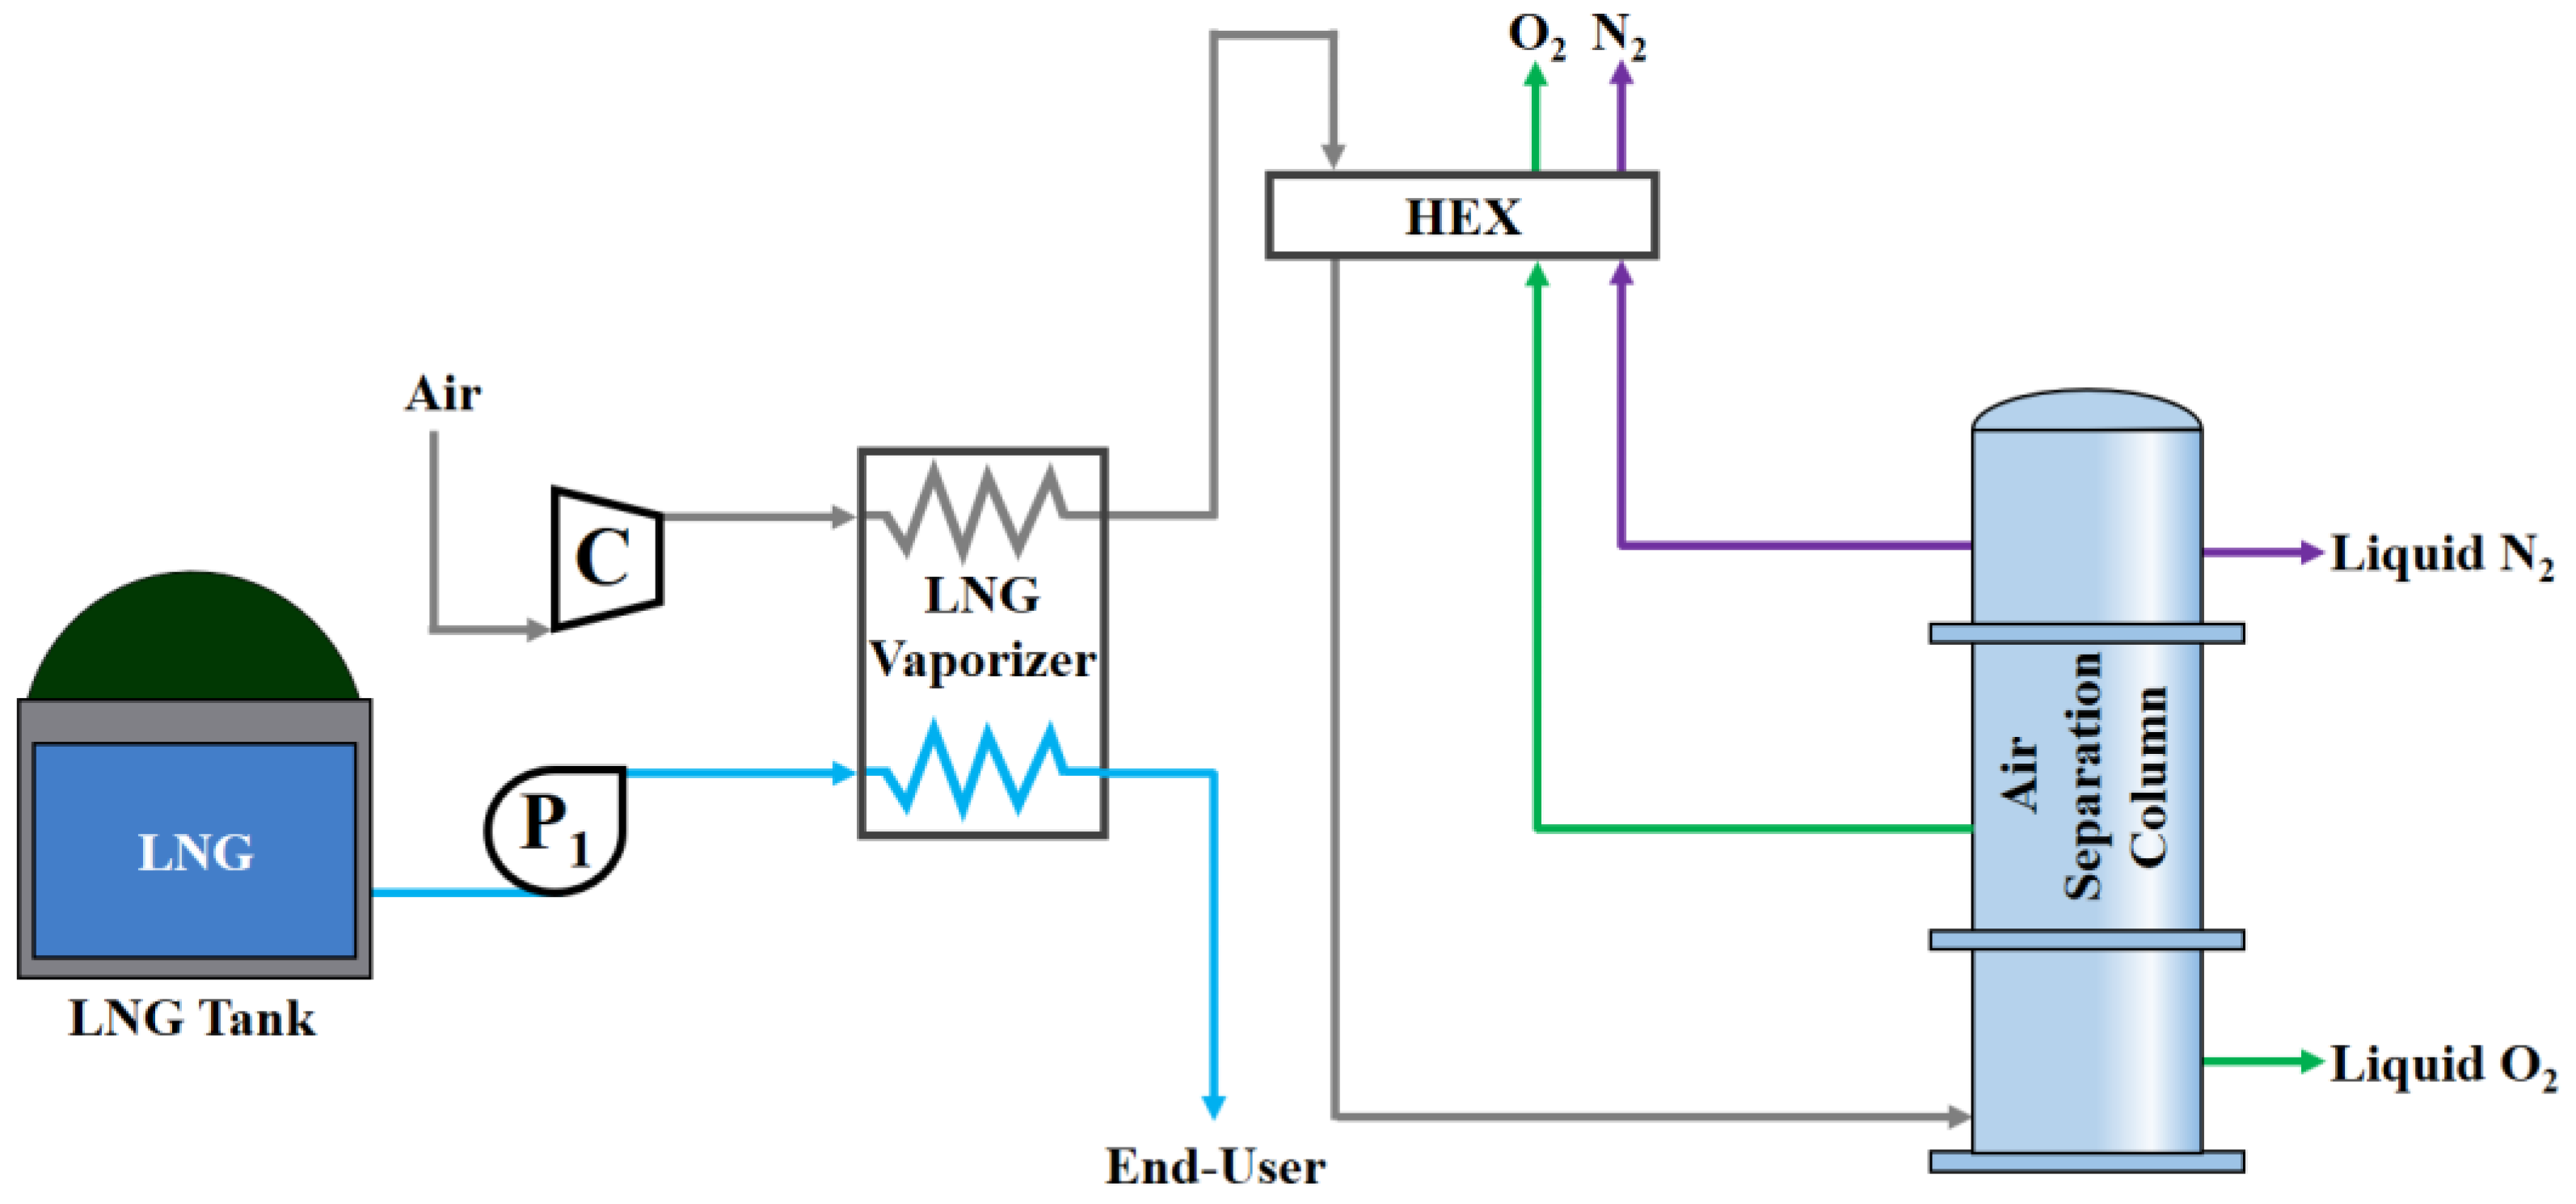
Many air separation processes depend on factors such as the temperature of the cold energy source and the operating pressure levels. These factors can significantly affect the product, purity, and pressure [25]. It is generally known that cryogenic air separation is preferred for producing high-purity products. The purity of liquid O2 and N2 produced at a liquefaction temperature of approximately −160 °C is approximately 100% [26]. However, these high-quality processes require significant amounts of power. To reduce the high amount of power required for the refrigeration cycle, LNG cold energy should be utilized, as it can both reduce the separation cost and LNG regasification simultaneously. A simple single-column cryogenic air separation process is shown in Figure 3.
During production, the pressure of the initial dustless air is increased when it enters the compressor, C. The compressed air is cooled down to a temperature below −170 °C in the LNG vaporizer, and then transported to the heat exchanger; subsequently, it enters the single-column cryogenic air separation unit. Consequently, gaseous and liquid N2 and O2 are produced. Meanwhile, the phase of LNG, which is pumped to the LNG heat exchanger, is changed from liquid to gas by dustless air.
Although the concept of air separation processes utilizing LNG cold energy has been developed steadily, it is generally not adopted, owing to the intricate configuration involved [8] and the estimated low economic efficiency. According to Kim and Hong [27], who examined the utilization of LNG cold energy on an air separation plant operated by Seoul Cold Air Products (production capacity: 9400 Nm3/H of oxygen, 9400 Nm3/H of nitrogen, and 387 Nm3/H of argon), the internal rate of the return, net present value, and the payback period were 11%, 0.6 million USD, and 14.6 years, respectively.

2.3. Cold water Fish Aquaculture

Atlantic salmon, which is one of the most preferred fishes in South Korea, is primarily bred in countries such as Norway and Chile, owing to its biological characteristics. Hence, to breed cold water fish in tropical or temperate climate countries, land-based aquaculture must be introduced, and methods for producing cold seawater fish cost-efficiently must be identified. Currently, submersible offshore fish farms (SOFFs) exposed to marine environments have been developed for cold water fish farming [28,29,30] and they are one of the representative deep-sea aquaculture methods. SOFFs support the sustainable growth of cold water fish regardless of the season because they can be installed at depths of approximately 300 m, where the seawater temperature is adequately low for the growth of cold water fish. Furthermore, utilizing SOFFs can reduce unpredictable environmental risks caused by typhoons and red tides. However, the main frame of the SOFF is typically made of high-density polyethylene (HDPE) pipes, which undergo structural deformation; therefore, the SOFF cannot submerge to the target depth. In addition, profitability decreases with the farming scale [31].
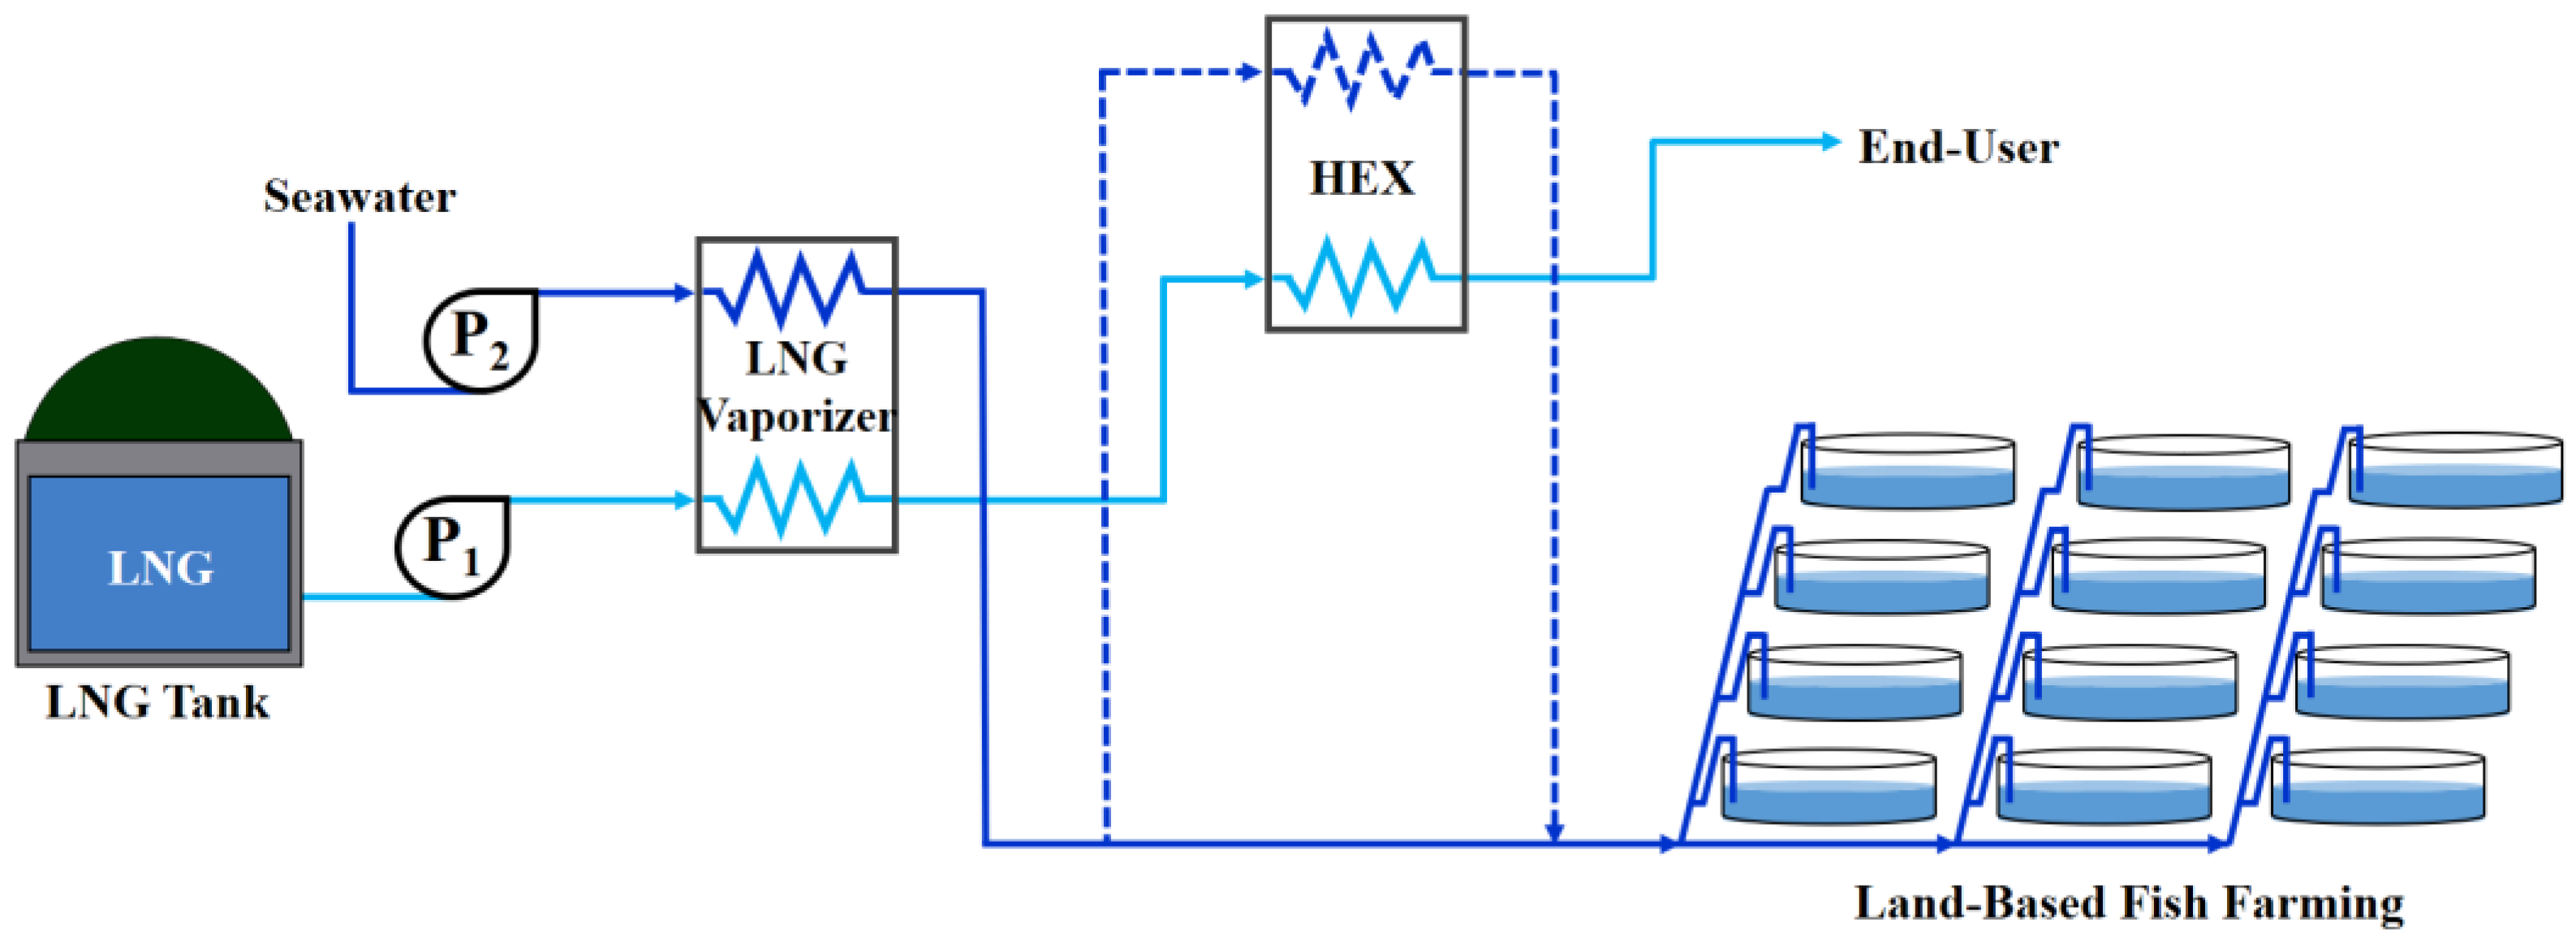
Cold seawater recovered near the sea of an LNG receiving terminal after LNG regasification in ORVs can be a cold seawater supply source for a land-based cold water fish aquaculture. This proposed concept not only presents the possibility of enabling land-based cold water fish farming but can also contribute to environmental problems caused by the release of cold seawater near an LNG receiving terminal. Furthermore, the elastic and plastic deformations of the HDPE pipe and the economic constraints of the SOFF are prevented. A conceptual flow diagram of this concept is shown in Figure 4. The LNG is regasified into NG in the LNG vaporizer via a heat exchange with seawater. Because LNG cold energy is released, the temperature of the seawater decreases in the LNG vaporizer. After the regasification process, NG is distributed to the end user, and cooled-down seawater is transported to the land-based cold water fish farm through a pipeline. If the cooled seawater does not exhibit a sufficiently low temperature, then it is resupplied to the land-based cold water fish farm, whose temperature is lower, via the heat exchanger, comprising NG.

3. Experimental Details

The laboratory-scale experiment aimed to confirm whether the water temperature of fish farming tanks can decrease sufficiently for the growth of Atlantic salmon, as well as determine the production capacity afforded by utilizing LNG cold energy. According to Boltaña et al. [32], increasing the water temperature imposes adverse effects on the metabolic characteristics of Atlantic salmon such as affecting their growth trajectories, microstructure, and muscles. In other words, Atlantic salmon cannot tolerate the increase in water temperature well. Therefore, the target time for reaching the water temperature of 17 °C in the farming tank was set to within an hour. Considering some limitations, such as the safety of the laboratories as well as the physical scale of the LNG supply process and laboratory, liquid nitrogen was used as a cold energy source to replace LNG in this experiment. According to Cheng et al. [33], who replaced LNG with liquid nitrogen to investigate heat transfer characteristics in a heated vertical tube, the physical properties between methane and supercritical nitrogen at different pressures are the same in the temperature range of 100–300 K. They confirmed that nitrogen can be used for the heat transfer of the NG flow. In addition to replacing the cold energy source, the volume of the water tank was scaled down by approximately 2900 times based on the Atlantic salmon production tank volume, and the mass flow rate of the water tank was determined based on the hydraulic retention time (HRT) of 22 min used in northern Norway [34,35]. A mass flow rate of 0.1 kg/s was set as the base mass flow rate of water in this experiment. A comparison of the specifications and operational conditions of both water tanks is shown in Table 1.
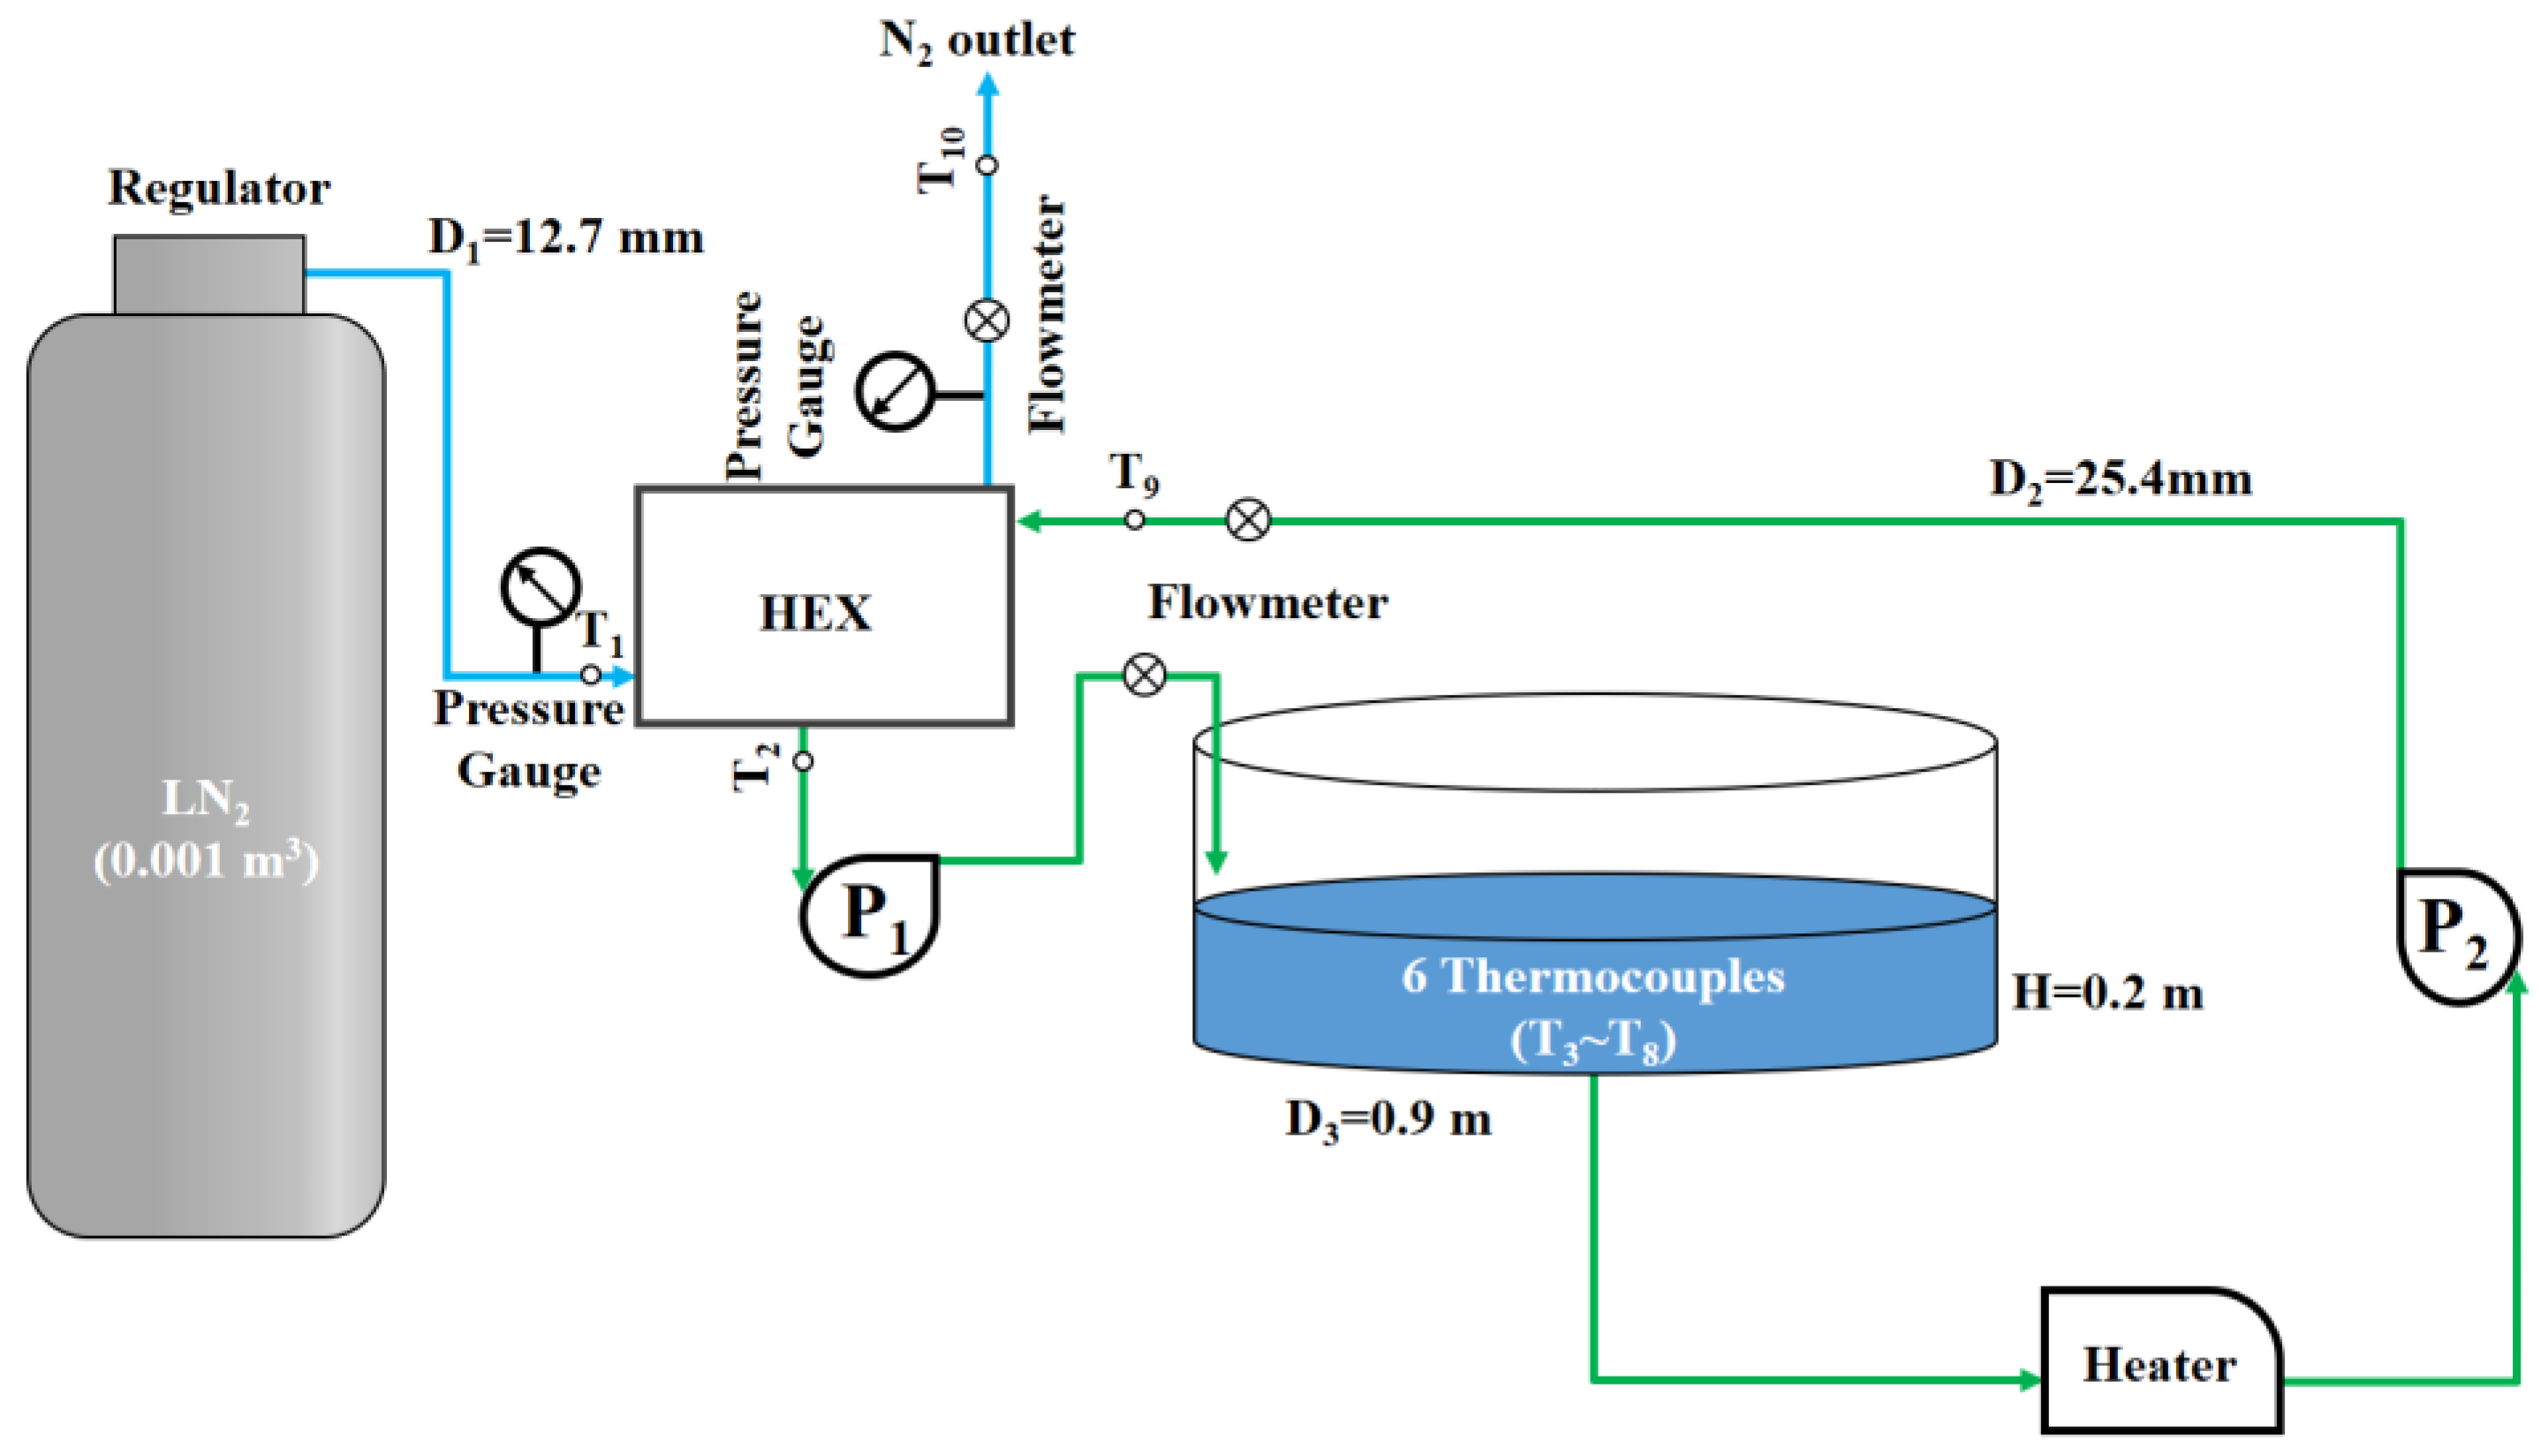
Figure 5 shows the experimental setup of the cold energy recovery and cold water supply system to the water tank used in this study. The equipment included centrifugal pumps, pressure gauges, mass flowmeters, T-type thermocouples (T1–T10, ± 0.1 K uncertainty), and a heater. The list of measurements, measuring range, accuracy, and uncertainty are shown in Table 2. Typically, all experiment processes create some uncertainty due to various reasons such as zero-stability, calibration, observation, the test environment, and sensor selection [36]. The overall uncertainty in this experiment can be derived from the following equation [37,38].
Overall experimental uncertainty = square root of [(uncertainty of temperature measurement)2 +
(uncertainty of pressure measurement)2 + (uncertainty of water flow measurement)2 + (uncertainty of nitrogen
flow measurement)2] = square root of [(0.75)2 + (1.5)2 + (1.0)2 + (0.25)2] = 1.969%
The height and initial temperature of the water column were 0.2 m and 298 K, respectively, based on the average seawater temperature near the Tongyeong LNG receiving terminal in South Korea in August (see Figure 1). The experimental system comprised an open liquid nitrogen gasification loop and a closed cold water supply loop. In terms of the open liquid nitrogen gasification loop, liquid nitrogen entered the heat exchanger at 5 MPa and 91 K. Subsequently, gaseous nitrogen flowed out of the heat exchanger and was exposed to atmospheric pressure at 266 K. In terms of the closed cold water supply loop, water at a temperature of 298 K entered the heat exchanger and was pumped to the water tank; the designed temperature of the cooled water at the outlet of the heat exchanger was 290 K. Hence, the temperature of the water in the tank decreased upon mixing with cold water. When the water column exceeded 0.2 m, water flowed to the heater. Subsequently, water was heated to 298 K using a heater and pumped to the heat exchanger.
A heat exchanger is a system that exchanges energy between liquid nitrogen and water. Therefore, the thermal energy of water is transferred to liquid nitrogen and the energy equation shown in Equation (1) applies.
Q ˙ n i t r o g e n = Q ˙ w a t e r
The mass flow of the liquid nitrogen can be determined using following relation:
m ˙ n i t r o g e n = m ˙ w a t e r ( Δ h w a t e r ) ( Δ h n i t r o g e n )
Considering the enthalpy difference of liquid nitrogen ( Δ h n i t r o g e n ) and water ( Δ h w a t e r ) of 383.56 and 33.81 kJ/kg based on CoolPack, respectively, a mass flow rate of 0.01 kg/s was determined as the base mass flow rate of the liquid nitrogen in this experiment.

4. Results and Discussion

4.1. Farming Tank Cooling Performance

The LNG consumption trend shows a distinct characteristic, i.e., low in the summer and high in the winter in South Korea, owing to seasonal energy demand. This trend can affect the temperature of the cold seawater produced from LNG vaporizers as well as the mass flow rate of the input seawater in the LNG vaporizers. These effects are reflected in the mass flow rate of liquid nitrogen in the experimental system. In this experiment, the effects of mass flow rates of liquid nitrogen and water on water cooling performances were investigated. After selecting the appropriate mass flow rate of the cold energy source based on the experimental results, the production capacity of Atlantic salmon was calculated for the case involving the use of LNG.

4.1.1. Effect of the Mass Flow Rate of Liquid Nitrogen

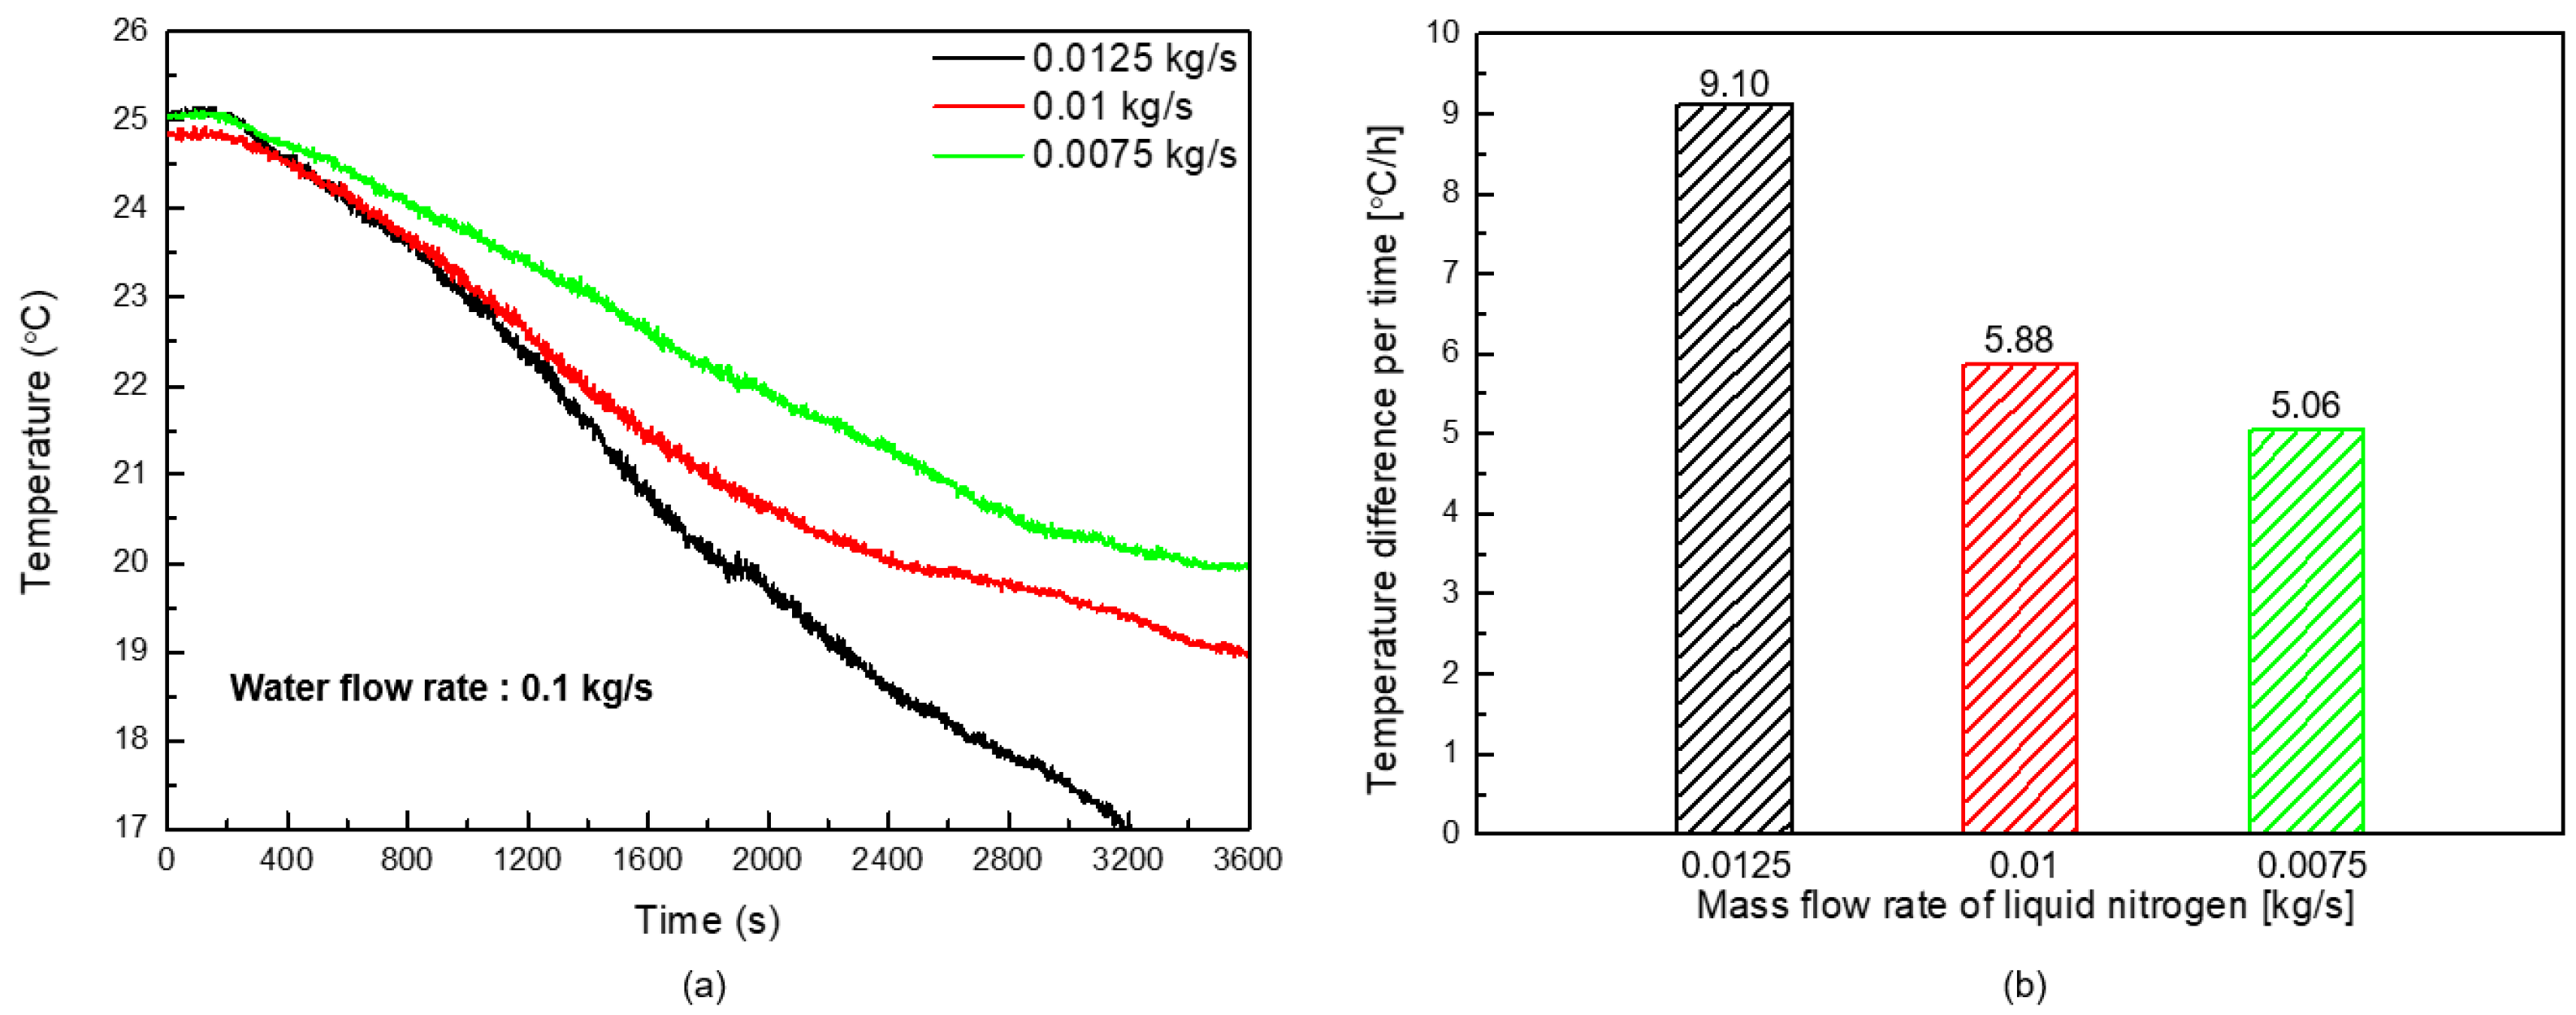
Figure 6a shows the changes in water temperature in the farming tank based on the mass flow rate of liquid nitrogen. As shown in Figure 6a, when the mass flow rate was 0.01 kg/s, the water temperature did not decrease to below 17.0 °C within an hour; in fact, the water temperature decreased from 24.83 °C to 18.95 °C within an hour. Similarly, when the mass flow rate was 0.0075 kg/s, which was 25% lower than the base mass flow rate of the liquid nitrogen, the water temperature did not decrease to below 17.0 °C within an hour. The water temperature decreased more slowly compared with the base mass flow rate, i.e., from 25.03 °C to 19.97 °C. Meanwhile, it was observed that the water temperature reached below 17 °C at approximately 3200 s at a mass flow rate of 0.0125 kg/s, which was 25% higher than the base mass flow rate of the liquid nitrogen. The water temperature decreased the most, significantly from 25.02 °C to 17.00 °C within 3173 s. However, the initial water temperature did not change significantly for approximately 200 s regardless of the mass flow rate of the liquid nitrogen. Because the flow rate of water was the same for all cases, the HRT of the heat exchanger did not change, and the time at which the water was supplied to the farming tank was the same.
Figure 6b shows the water temperature difference for 1 h. As shown in Figure 6b, the water cooling performance for 1 h was governed by the mass flow rate of liquid nitrogen. The higher the mass flow rate of liquid nitrogen, the greater the water temperature difference. It was confirmed that the mass flow rate of 0.0125 kg/s resulted in the greatest water temperature difference of 9.10 °C/h, followed by that of 0.01 kg/s (5.88 °C/h) and 0.0075 kg/s (5.06 °C/h). Based on the fact that Atlantic salmon have a low tolerance to increasing water temperature, cold seawater can be supplied into the farming tank to decrease the seawater temperature to a suitable temperature for growing Atlantic salmon at a 25% higher mass flow rate than the base mass flow rate under the experimental conditions.

4.1.2. Effect of the Mass Flow Rate of Water

Figure 7a shows the water temperature changes in the farming tank based on the mass flow rate of water. In contrast to the result shown in Figure 6a, the result presented in Figure 7a shows a short-flat temperature period at the beginning of the experiment. It was confirmed that the flat-temperature period decreased as the mass flow rate of water increased. When the mass flow rate increased from 0.05 to 0.15 kg/s, the flat-temperature period decreased from 380 to 80 s. This phenomenon was caused by the different HRTs arising from the mass flow rate of water. The higher the mass flow rate of water, the lower the HRT. Therefore, as the mass flow rate of water increased, the water temperature in the farming tank decreased faster in the initial operating period. However, after a certain duration, the temperature of the water tank could reach under 17.0 °C at the water mass flow rate of 0.05 kg/s. It is because the lowest mass flow rate of the water afforded more time for a heat exchange with liquid nitrogen as compared with a higher mass flow rate. Consequently, the temperature of the water at the outlet of the heat exchanger decreased more significantly, resulting in a better water cooling performance in the farming tank.
As shown in Figure 7a, the water temperature did not reach below 17.0 °C, except for the case where the mass flow rate was 0.05 kg/s. In other words, the mass flow rate of 0.05 kg/s, which was 50% lower than the base mass flow rate, only afforded a temperature of 17.0 °C at approximately 3500 s. The water temperature increased from 24.92 °C to 17.0 °C, 24.63 °C to 18.37 °C, and 24.48 °C to 18.95 °C, as the mass flow rate of water increased. This implies that the slope of the temperature based on a mass flow rate of 0.05 kg/s was the steepest. Figure 7b shows the water temperature difference for 1 h. The water cooling performance in the farming tank was affected by the mass flow rate of the water. The lowest mass flow rate of water afforded a better water cooling performance. The mass flow rate of 0.05 kg/s resulted in the most significant water temperature difference of 7.92 °C/h, followed by that of 0.1 kg/s (6.26 °C/h) and 0.15 kg/s (5.53 °C/h).

4.2. Estimating Atlantic Salmon Production Capacity

To estimate the production capacity of Atlantic salmon afforded by utilizing LNG cold energy, the appropriate mass flow rate of LNG was selected based on experiments using liquid nitrogen. The base mass flow rate of LNG was determined via Equations (1) and (2) using an enthalpy difference of 900.36 kJ/kg [39]. The calculated base mass flow rate of LNG was 0.0038 kg/s. The experimental results show that a mass flow rate that is 25% higher than the base mass flow rate is required to cool the water to below 17 °C within an hour in the tank and that the required mass flow rate of LNG was 0.0048 kg/s. This mass flow rate corresponded to 125% of the base mass flow rate.
To assume a real-scale land-based aquaculture environment, it is essential to consider a tank size scale factor of approximately 2900 between the original [34] and experimental tanks. Hence, it was determined that the required mass flow rate of LNG to supply cold seawater to land-based Atlantic salmon farming and to maintain the seawater temperature within an hour was 13.92 kg/s. In other words, this mass flow rate is sufficient for 24 farming tanks daily, corresponding to a total Atlantic salmon production capacity of 883.2 tons.
According to data from the Korea Gas Corporation shown in 2019 (Table 3), the mass flow rate of LNG supply was 6,953,727 tons/year in the Tongyeong LNG receiving terminal, which corresponds to 220.5 kg/s. Because an LNG mass flow rate of 13.92 kg/s is required to achieve a production capacity of 883.2 tons of land-based Atlantic salmon farming, an LNG supplying mass flow rate of 220.5 kg/s was set in the receiving terminal, which was about 15.8 times higher than 13.92 kg/s. Hence, the estimated production capacity of Atlantic salmon was approximately 14,000 tons. According to data from the Korea Agro-Fisheries & Food Trade Corporation in 2019, as shown in Table 4, salmon imports to South Korea were 38,003 tons in 2019, which would afford significant opportunities for breeding cold water fish in tropical or temperate climate countries. The estimated production capacity of 14,000 tons is equivalent to 36.8% of salmon imports in 2019. This implies that utilizing LNG cold energy for land-based cold water fish aquaculture affords considerable economic benefits as well as energy recovery.

5. Conclusions

In this study, the idea that utilizing LNG cold energy in land-based cold water fish aquaculture is proposed. An experiment was performed to determine the applicability of utilizing LNG cold energy in land-based Atlantic salmon farming using liquid nitrogen as a cold energy source. In addition, the production capacity of Atlantic salmon was estimated based on the experimental results and the real LNG supply mass flow rate of the Tongyeong LNG receiving terminal.
The experimental results showed that a liquid N2 mass flow rate of 0.0125 kg/s could decrease the water temperature of the farming tank to below 17.0 °C within an hour, and the water cooling rate was 9.10 °C/h. For the variation in water mass flow rates, the water mass flow rate of 0.1 kg/s decreased the water temperature of the farming tank from 24.28 °C to 18.33 °C for an hour, corresponding to 6.50 °C/h. Meanwhile, the water temperature decreased from 24.92 °C to 17.0 °C at a mass flow rate of 0.05 kg/s within an hour, and the water cooling rate was 8.20 °C/h. Considering the LNG supply mass flow rate of 220.5 kg/s at the Tongyeong LNG receiving terminal and the actual tank size for Atlantic salmon farming, the estimated production capacity was approximately 14,000 tons. This is equivalent to 36.8% of the salmon imports to South Korea in 2019.
In light of this experimental study, it can provide an opportunity for the region where cold water fish cannot be bred in conventional aquaculture techniques due to their biological characteristics if it is applied commercially. In this work, however, due to limitations such as handling and controlling LNG and the scale of real land-based fish farming, the experiments were conducted on a laboratory scale; liquid nitrogen was used as a cold energy source and a scaled-down volume of the water tank was used. Thus, introducing this concept into the land-based aquaculture industry is needed to conduct many future works, including economic analysis and optimizing farming conditions on a real scale.

Author Contributions

Conceptualization, S.B.; methodology, W.C.; software, S.L.; validation, G.K.; formal analysis, J.S.; investigation, J.S.; resources, S.L.; data curation, W.C.; writing—original draft preparation, S.B.; writing—review and editing, Y.S.; visualization, H.J.; supervision, Y.S.; project administration, Y.S.; funding acquisition, Y.S. All authors have read and agreed to the published version of the manuscript.

Funding

This study was supported by the Korea Gas Corporation (KOGAS) in 2020 as a research project titled “Utilization of LNG cold energy in coldwater fish farming industry”.

Conflicts of Interest

The authors declare no conflict of interest.

References

  1. Energy Information Administration (EIA). International Energy Outlook 2021; EIA: Wadhington, DC, USA, 2021. [Google Scholar]
  2. ExxonMobil. Outlook for Energy: A Perspective to 2040; ExxonMobil Corporation: Irving, TX, USA, 2019. [Google Scholar]
  3. British Petrol (BP). Energy Outlook, 2020th ed.; BP p.l.c.: London, UK, 2020. [Google Scholar]
  4. Kanbur, B.B.; Xiang, L.; Dubey, S.; Choo, F.H.; Duan, F. Cold utilization systems of LNG: A review. Renew. Sustain. Energy Rev. 2017, 79, 1171–1188. [Google Scholar] [CrossRef]
  5. Mokhatab, S.; Mak, J.Y.; Valappil, K.V.; Wood, D.A. Handbook of Liquefied Natural Gas; Elsvier Science: Burlington, ON, Canada, 2013. [Google Scholar]
  6. Ouyang, T.; Xie, S.; Wu, W.; Tan, J. A novel design of cold energy cascade utilization with advanced peak-shaving strategy integrated liquid air energy storage. J. Clean. Prod. 2021, 324, 129493. [Google Scholar] [CrossRef]
  7. Pospíšil, J.; Charvát, P.; Arsenyeva, O.; Klimeš, L.; Špiláček, M.; Klemeš, J.J. Energy demand of liquefaction and regasification of natural gas and the potential of LNG for operative thermal energy storage. Renew. Sustain. Energy Rev. 2019, 99, 1–15. [Google Scholar]
  8. He, T.; Chong, Z.R.; Zheng, J.; Ju, Y.; Linga, P. LNG cold energy utilization: Prospects and challenges. Energy 2019, 170, 557–568. [Google Scholar] [CrossRef]
  9. Hirakawa, S.; Kosugi, K. Utilization of LNG cold. Int. J. Refrig. 1981, 4, 17–21. [Google Scholar] [CrossRef]
  10. Food & Agriculture Organization (FAO). The State of World Fisheries and Aquaculture 2020; FAO: Rome, Italy, 2020. [Google Scholar]
  11. Asche, F.; Sikveland, M.; Zhang, D. Profitability in Norwegian salmon farming: The impact of firm size and price variability. Aquac. Econ. Manag. 2018, 21, 306–317. [Google Scholar] [CrossRef]
  12. Misund, B.; Nygård, R. Big fish: Valuation of the world’s largest salmon farming companies. Mar. Resour. Econ. 2018, 33, 245–261. [Google Scholar] [CrossRef] [Green Version]
  13. Brækkan, E.H.; Thyholdt, S.B.; Asche, F.; Myrland, Ø. The demands they are a-changin’. Eur. Rev. Agric. Econ. 2018, 45, 531–552. [Google Scholar] [CrossRef]
  14. Duston, J.; Saunders, R.L.; Knox, D.E. Effects of increases in freshwater temperature on loss of smolt characteristics in Atlantic salmon (Salmo salar). Can. J. Fish. Aquat. Sci. 1991, 48, 164–169. [Google Scholar] [CrossRef]
  15. Gamperl, A.K.; Ajiboye, O.O.; Zanuzzo, F.S.; Sandrelli, R.M.; Peroni, E.D.F.C.; Beemelmanns, A. The impacts of increasing temperature and moderate hypoxia on the production characteristics, cardiac morphology and haematology of Atlantic Salmon (Salmo salar). Aquaculture 2020, 519, 734874. [Google Scholar] [CrossRef]
  16. Jonsson, B.; Ruud-Hansen, J. Water temperature as the primary influence on timing of seaward migrations of Atlantic salmon (Salmo salar) smolts. Can. J. Fish. Aquat. Sci. 1985, 42, 593–595. [Google Scholar] [CrossRef]
  17. Nisembaum, L.G.; Martin, P.; Fuentes, M.; Besseau, L.; Magnanou, E.; McCormick, S.D.; Falcón, J. Effects of a temperature rise on melatonin and thyroid hormones during smoltification of Atlantic salmon, Salmo salar. J. Comp. Physiol. B 2020, 190, 731–748. [Google Scholar] [CrossRef] [PubMed]
  18. Sambraus, F.; Fjelldal, P.G.; Remø, S.C.; Hevrøy, E.M.; Nilsen, T.O.; Thorsen, A.; Hansen, T.J.; Waagbø, R. Water temperature and dietary histidine affect cataract formation in Atlantic salmon (Salmo salar L.) diploid and triploid yearling smolt. J. Fish Dis. 2017, 40, 1195–1212. [Google Scholar] [CrossRef] [PubMed] [Green Version]
  19. Ministry of the Interior and Safety. Seawater Temperature near LNG Production Sites. Korea Gas Corporation. Available online: https://www.data.go.kr/data/15040984/fileData.do#layer_data_infomation (accessed on 3 August 2020).
  20. Crespi, F.; Gavagnin, G.; Sánchez, D.; Martínez, G.S. Supercritical carbon dioxide cycles for power generation: A review. Appl. Energy 2017, 195, 152–183. [Google Scholar] [CrossRef]
  21. He, T.; Nair, S.K.; Babu, P.; Linga, P.; Karimi, I.A. A novel conceptual design of hydrate based desalination (HyDesal) process by utilizing LNG cold energy. Appl. Energy 2018, 222, 13–24. [Google Scholar] [CrossRef]
  22. Naseri, A.; Bidi, M.; Ahmadi, M.H.; Saidur, R. Exergy analysis of a hydrogen and water production process by a solar-driven transcritical CO2 power cycle with Stirling engine. J. Clean. Prod. 2017, 158, 165–181. [Google Scholar] [CrossRef] [Green Version]
  23. Hisazumi, Y.; Yamasaki, Y.; Sugiyama, S. Proposal for a high efficiency LNG power generation system utilizing waste heat from the combined cycle. Appl. Energy 1998, 60, 169–182. [Google Scholar] [CrossRef]
  24. Lee, S. Multi-parameter optimization of cold energy recovery in cascade Rankine cycle for LNG regasification using genetic algorithm. Energy 2017, 118, 776–782. [Google Scholar] [CrossRef]
  25. Kim, D.; Giametta, R.E.H.; Gundersen, T. Optimal use of liquefied natural gas (LNG) cold energy in air separation units. Ind. Eng. Chem. Res. 2018, 57, 5914–5923. [Google Scholar] [CrossRef]
  26. Ebrahimi, A.; Ziabasharhagh, M. Optimal design and integration of a cryogenic air separation unit (ASU) with liquefied natural gas (LNG) as heat sink, thermodynamic and economic analyses. Energy 2017, 126, 868–885. [Google Scholar] [CrossRef]
  27. Kim, H.; Hong, S. Review on economical efficiency of LNG cold energy use in South Korea. In Proceedings of the 23rd World Gas Conference, Amsterdam, The Netherlands, 5–9 June 2006. [Google Scholar]
  28. Liu, H.F.; Bi, C.W.; Zhao, Y.P. Experimental and numerical study of the hydrodynamic characteristics of a semisubmersible aquaculture facility in waves. Ocean Eng. 2020, 214, 107714. [Google Scholar] [CrossRef]
  29. Miao, Y.J.; Ding, J.; Tian, C.; Chen, X.J.; Fan, Y.L. Experimental and numerical study of a semi-submersible offshore fish farm under waves. Ocean Eng. 2021, 225, 108794. [Google Scholar] [CrossRef]
  30. Zhang, J.; Shimizu, H.; Nakashima, H.; Mizukami, Y.; Yoshida, T.; Liu, L.; Kitazawa, D. Water-tank experiment and static numerical analysis of the mooring system of a controllable depth cage. Aquac. Eng. 2020, 91, 102118. [Google Scholar] [CrossRef]
  31. Kitazawa, D.; Mizukami, Y.; Kanehira, M.; Takeuchi, Y.; Ito, S. Water tank and field tests on the performance of a submergible fish cage for farming silver salmon. In Proceedings of the 36th International Conference on Offshore Mechanics and Arctic Engineering, Rondheim, Norway, 25–30 June 2017. [Google Scholar]
  32. Boltaña, S.; Sanhueza, N.; Aguilar, A.; Gallardo-Escarate, C.; Arriagada, G.; Valdes, J.A.; Soto, D.; Quiñones, R.A. Influences of thermal environment on fish growth. Ecol. Evol. 2017, 7, 6814–6825. [Google Scholar] [CrossRef] [PubMed]
  33. Cheng, H.; Yin, L.; Ju, Y.; Fu, Y. Experimental investigation on heat transfer characteristics of supercritical nitrogen in a heated vertical tube. I. J. Therm. Sci. 2020, 152, 106327. [Google Scholar] [CrossRef]
  34. Gorle, J.M.R.; Terjesen, B.F.; Mota, V.C.; Summerfelt, S. Water velocity in commercial RAS culture tanks for Atlantic salmon smolt production. Aquac. Eng. 2018, 81, 89–100. [Google Scholar] [CrossRef]
  35. Summerfelt, S.T.; Mathisen, F.; Holan, A.B.; Terjesen, B.F. Survey of large circular and octagonal tanks operated at Norwegian commercial smolt and post-smolt sites. Aquac. Eng. 2016, 74, 105–110. [Google Scholar] [CrossRef] [Green Version]
  36. Zhang, Z.E.J.; Chen, J.; Zhao, X.; Zhang, B.; Deng, Y.; Peng, Q.; Yin, X. Effects of boiling heat transfer on the performance enhancement of a medium speed diesel engine fueled with diesel and rapeseed methyl ester. Appl. Therm. Eng. 2020, 169, 114984. [Google Scholar] [CrossRef]
  37. Zhang, Z.; Li, J.; Tian, J.; Dong, R.; Zou, Z.; Gao, S.; Tan, D. Performance, combustion and emission characteristics investigations on a diesel engine fueled with diesel/ethanol/n-butanol blends. Energy 2022, 249, 123733. [Google Scholar] [CrossRef]
  38. Baek, S.; Shin, D.; Noh, J.; Choi, B.; Huh, S.; Jeong, H.; Sung, Y. Influence of surfactants on thermal performance of Al2O3/water nanofluids in a two-phase closed thermosyphon. Case Stud. Therm. Eng. 2021, 28, 101586. [Google Scholar] [CrossRef]
  39. Afrianto, H.; Tanshen, M.R.; Munkhbayar, B.; Tony Suryo, U.T.; Chung, H.; Jeong, H. A numerical investigation on LNG flow and heat transfer characteristic in heat exchanger. Int. J. Heat Mass Transf. 2014, 68, 110–118. [Google Scholar] [CrossRef]
  40. Korea Agro-Fisheries & Food Trade Corporation. Agriculture, Forestry and Fisheries Import & Export & Statics. Available online: https://www.kati.net/board/pubilshedMaterialsView.do?board_seq=91265&menu_dept2=48&dateSearch=all (accessed on 20 October 2020).
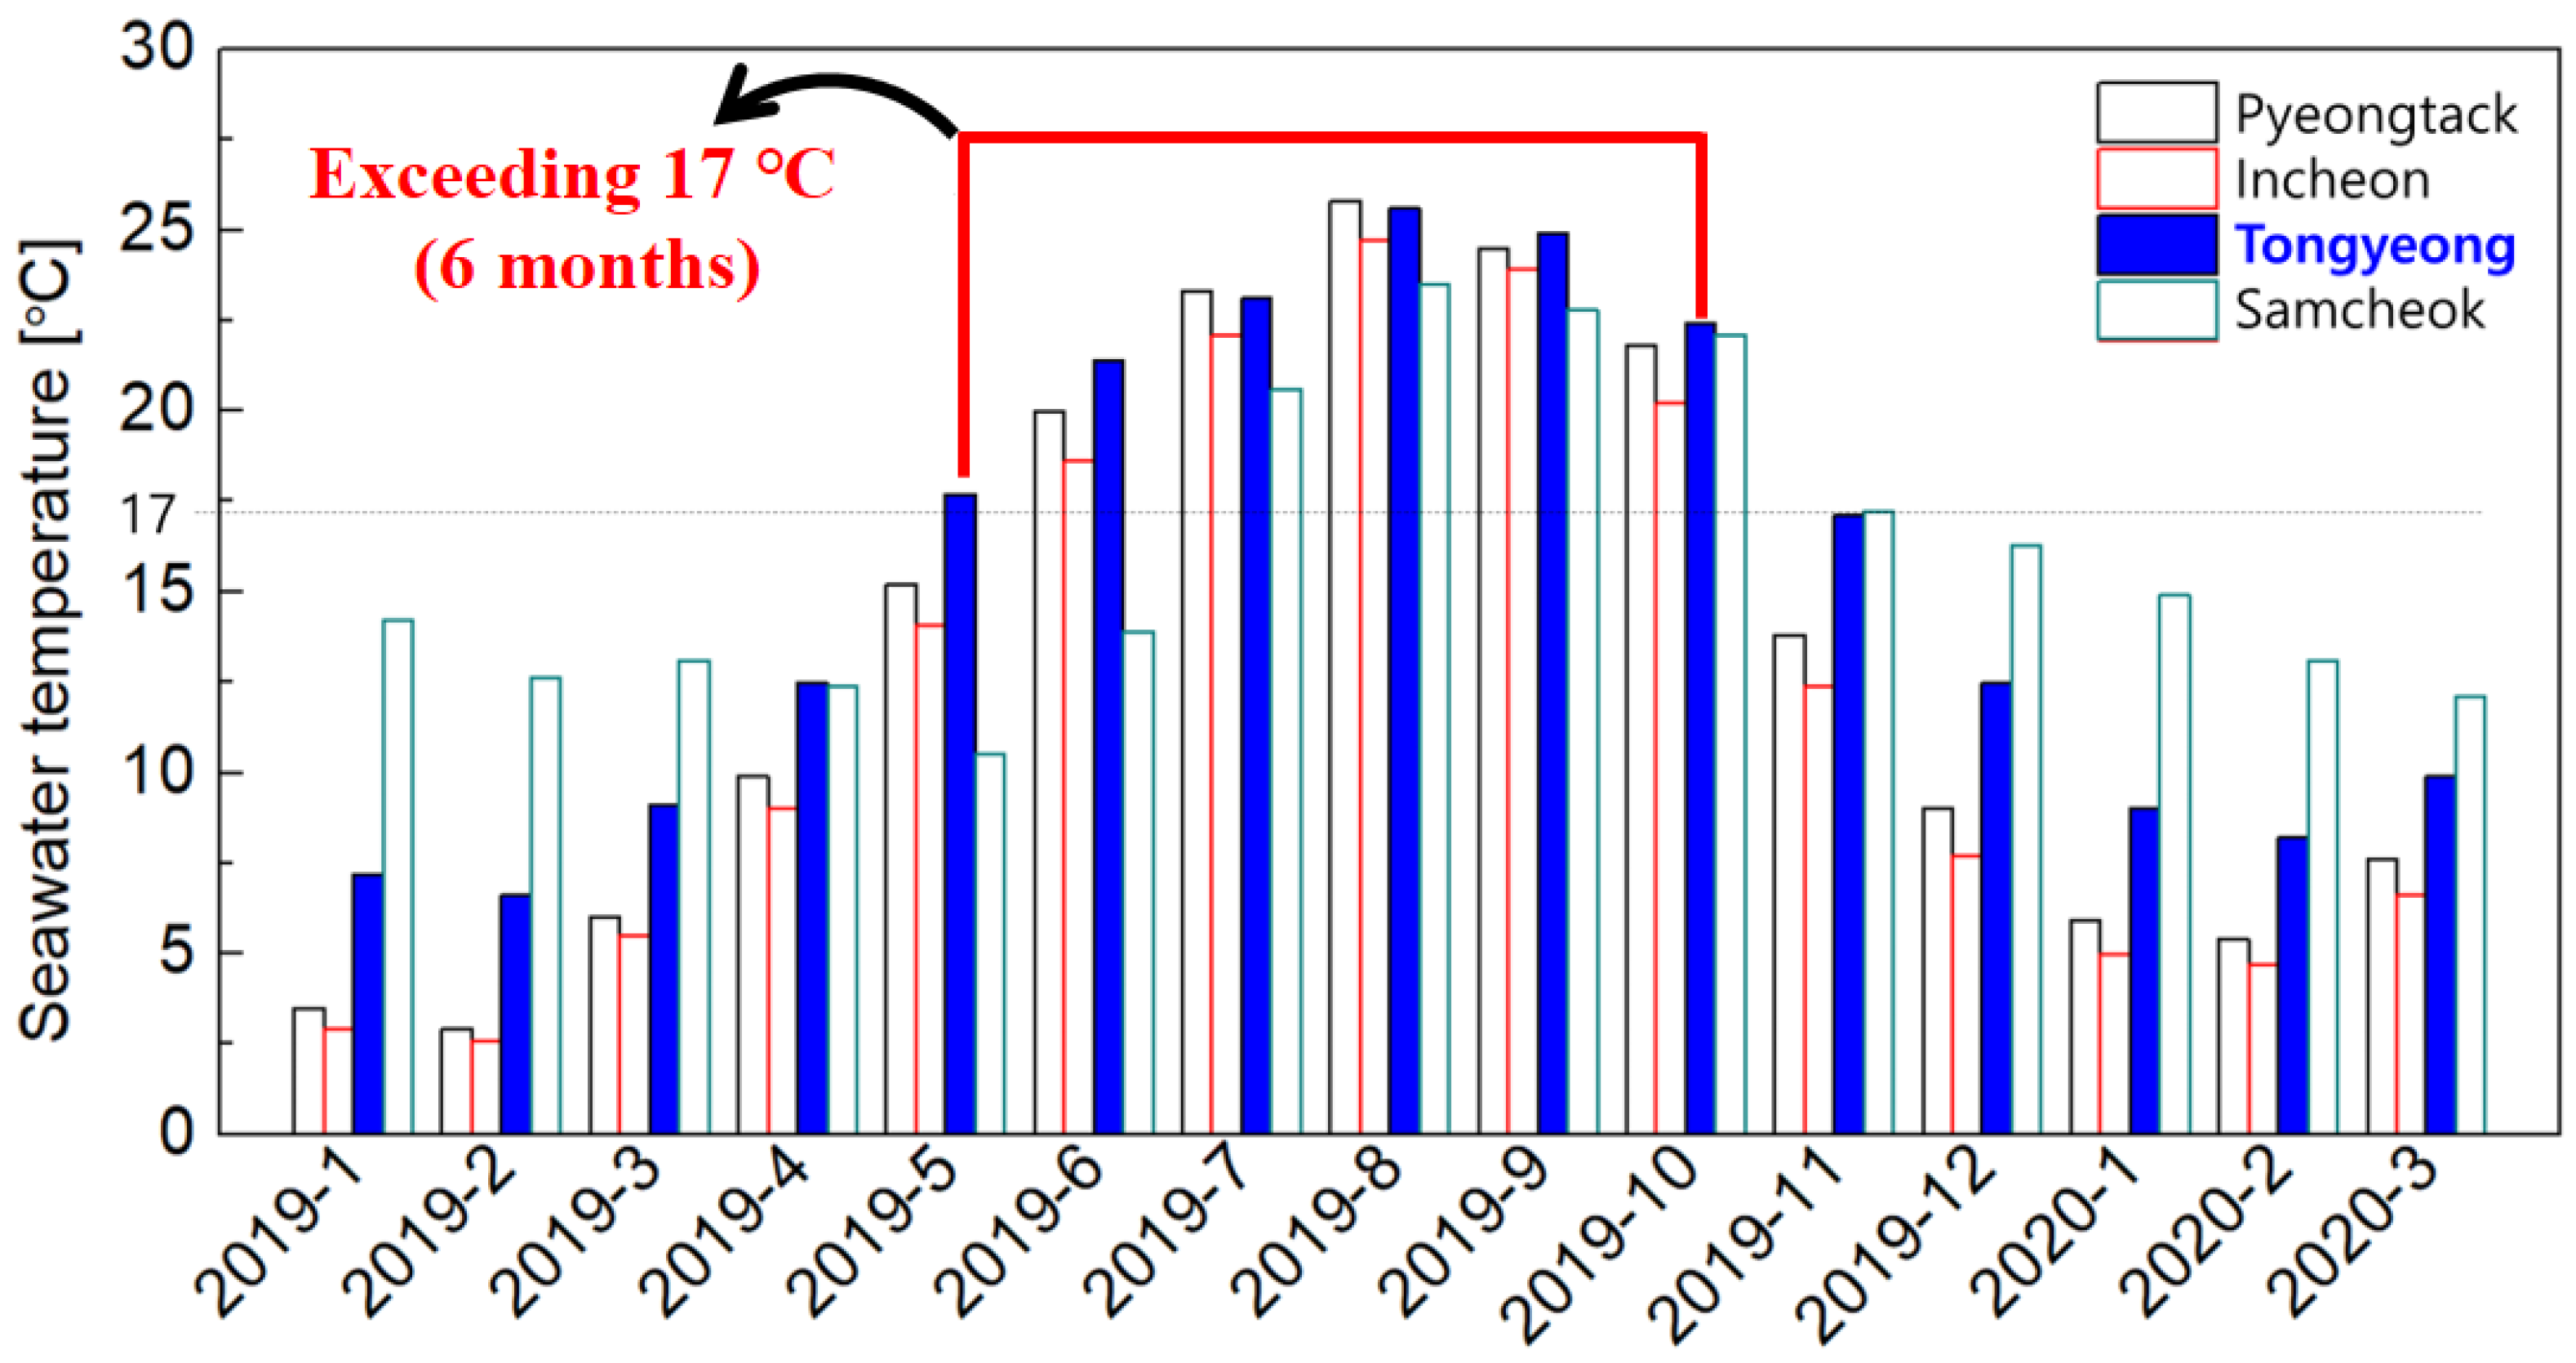
Figure 1. Temperature of seawater near LNG receiving terminals in South Korea from 2019 to 2020 [19].
Energies 15 07322 g001
Figure 2. Schematic illustration of organic Rankine and direct expansion cycle in LNG cold energy power generation.
Energies 15 07322 g002
Figure 3. Schematic illustration of single column cryogenic air separation process using LNG cold energy.
Energies 15 07322 g003
Figure 4. Flow diagram showing the concept of cold seawater supply for land-based cold water fish aquaculture utilizing LNG cold energy.
Energies 15 07322 g004
Figure 5. Schematic diagram of the experimental setup for cold water supply using liquid nitrogen as a cold energy source.
Energies 15 07322 g005
Figure 6. Results of water temperatures (a) and water cooling performance in the farming tank at different liquid nitrogen mass flow rates (b).
Energies 15 07322 g006
Figure 7. Results of water temperatures (a) and water cooling performance in the farming tank at different water mass flow rates (b).
Energies 15 07322 g007
Table 1. Comparison and specifications of circular water tanks used in this experiment and northern Norway for Atlantic salmon production.
ParametersReferenceExperiment
Tank shapeCircularCircular
Volume (m3)3680.127
Flow rate (kg/s)2820.1
HRT (min)2222
* Production capacity (ton)36.80.0127
* Production capacity was determined by assuming an Atlantic salmon density of 0.1 ton/m3 in this study.
Table 2. List of measurements, measuring range, accuracy, and uncertainty.
MeasurementsMeasuring RangeAccuracyUncertainty
Temperature measurement23–623 [K]±0.1 [K]±0.75%
Pressure measurement0–7.0 [MPa]±0.1 [MPa]±1.5%
Water flow measurement0.3–10 [LPM]±0.01 [LPM]±1.0%
Gas flow measurement0–12 [kg/min]±0.01 [kg/min]±0.25%
Table 3. Annual LNG supply at Tongyeong LNG receiving terminal from 2015 to 2019 [19].
LNG Terminal20152016201720182019
Tongyeong5,921,544
[ton]
6,537,572
[ton]
6,149,512
[ton]
7,460,843
[ton]
6,953,727
[ton]
Table 4. Annual import of fish from 2017 to 2019 in South Korea [40].
Species201720182019
Weight
[ton]
Cost
(1000 USD)
Weight
[ton]
Cost
(1000 USD)
Weight
[ton]
Cost
(1000 USD)
1Pollack259,252420,285253,952428,736180,354371,560
2Salmon30,272295,43338,318375,15538,003362,469
3Tuna24,954229,35214,845256,31023,871245,647
4Yellow croaker23,198109,43027,798128,29127,450122,677
5Brown croaker23,74396,50125,807113,80123,816100,764
Publisher’s Note: MDPI stays neutral with regard to jurisdictional claims in published maps and institutional affiliations.