1. Introduction
Storing CO
2 in geological formations, such as saline aquifers or depleted petroleum reservoirs, is an important component of reducing greenhouse gas emissions. Geological storage of CO
2 is, currently, the only technology available that can safely store volumes produced by emitting industries such as steel and cement as well as power production. As the Carbon Capture and Storage (CCS) industry continues to grow around the world, massive storage volumes would be needed [
1,
2,
3]. It will hence be important to utilize each storage site to its maximum, complying with safety and environmental constraints. At the same time, different injection and storage scenarios may be needed to fit the emitters requirements.
The aim of a CCS project is to make the best use of the available space in the reservoir by flooding it with the largest possible volume of CO2 while ensuring safety and maintaining proper resource management during injection operations and after. Appropriate reservoir pressure and storage capacity management is critical to ensure the long-term functionality of such projects.
Underground CO
2 storage in a CCS project always depends on CO
2 supply or volumes available to be injected into a storage site. Beyond seasonal variations, there could be many reasons for periodic or intermittent CO
2 supply, such as scheduled or un-scheduled maintenance of CCS infrastructure, intermittent transport such as shiploads to offshore injection facilities etc. Even with increase in renewals there may still be need for disposal of CO
2 generated by power plants in periods with shortages of renewable electricity supply or high demand peaks [
4]. Operational reasons such as well tests, workovers and treatments as well as maintenance of injection facilities always exist, also causing periodic injection [
5].
CO
2 storage capacity and pressure management are widely discussed in the literature [
1], whereas we concentrate exclusively on a historical review of cyclic or periodic CO
2 injection as the scope of this paper. Cyclic injection of CO
2 has been used in the oil industry for many decades as a means to enhance oil recovery (EOR), mainly through two alternative processes. Huff ’n’ puff includes the cyclic injection of CO
2 into the reservoir, which after a “soaking” period is put back into production. This low cost technique was widely investigated and showed great potential for EOR both in laboratory and field tests [
6,
7,
8,
9,
10]. The other approach, called CO
2-WAG (Water Alternating Gas), uses periods of CO
2 injection followed by water, displacing remaining oil and supporting reservoir pressure. There are several publications available covering CO
2-WAG, ranging from the following general to more specific aspects: gas cap contamination [
11]; combination of CO
2-WAG with Soft Micro Gel (SMG) [
12]; and rock wettability under CO
2 flooding [
13]. Nevertheless, neither of these processes are designed for maximizing permanent storage of CO
2.
In this work, we focus on CO
2 storage in saline aquifers, considering risks and advantages of periodic injection, which will be the target for larger-scale projects [
14]. Several authors have proposed solutions for this scenario, e.g., Buscheck et al. [
15] developed the Active CO
2 Reservoir Management (ACRM) process that aimed to control pressure buildup and brine migration. This was achieved by using brine-producing wells in a CO
2 injection reservoir, as it was identified that such production in EOR processes helped to increase the volume of CO
2 injected and to control pressure buildups [
15]. Agarwal and Zhang [
16] developed a genetic-algorithm optimization (GA-TOUGH2) which among many benefits, aimed to optimize the injection pressure management and reduce CO
2 accumulation under the caprock. Jazayeri Noushabadi et al. [
17] used the ACRM [
15] approach but combined WAG-CO
2 injectors and brine producing wells (two wells for each type) in the same reservoir. The study proposed that alternating injection between two wells (not constant injection) increased the overall storage efficiency. Other scenarios presented in this study showed that combining CO
2-WAG injection wells with continuous water extraction from the brine producers led to acceleration of solubility trapping, thus reducing the risk of leakage due to mechanical trapping failure, which is particularly relevant in the early years of a CO
2 injection project. Edlmann et al. [
18] presented an interesting development showing that, during cyclic injection of water and supercritical CO
2, the water cycle rendered a steady pressure increase while during CO
2 cycles it remained almost unchanged. Nazarian et al. [
19,
20] introduced another approach using Composition Swing Injection (CSI) technology [
21]. CSI uses two CO
2-rich fluids (with different CO
2 mole percentages) which are injected cyclically into the reservoir; one has gas-like properties and the other behaves as a liquid. This is done to manage the CO
2 plume and counteract pressure buildup [
17,
18,
19,
20]. Singh [
22] investigated the spatial and temporal pressure and CO
2 saturation distributions under four different injection schemes: constant; stepwise incremental; stepwise decremental; and cyclic. The study concluded that a cyclic injection scheme, due to CO
2 compressibility, tends to reduce the pressure build up. At the same time, it is not clear from the CO
2 saturation perspective whether the results show any benefit from this approach as the final plume saturation seems similar in all cases.
Even though some of the mentioned WAG studies showed that the reservoir pressure increases more slowly during CO
2 injection than when injecting water [
18,
19,
20,
22], a comprehensive research of this effect was not found in the literature. This study aims to cover the periodic (a generalized form of cyclic) injection from the reservoir pressure management and storage capacity points of view by focusing on positive effects of such periodic injection including both pressure and CO
2 plume dynamics.
Although many studies indicated positive effects from cyclic CO
2 injection, certain risks may also be associated with introducing the cycles. Thus, geochemistry may play a role during periodic injection inducing changes in the compositions and properties of fluids and reservoir rocks. This can give reduction in permeability, e.g., due to precipitation of salts and minerals, hydrate formation, and growth of bacteria [
5,
23,
24,
25]. The risk and extent of these formation damages will depend on original conditions, how much the temperature and pressure vary during the CO
2-injection periods and the amount of CO
2 injected in each period. Variation in temperature and pressure may also affect the integrity of wells [
26]. In the presented study it is assumed that the properties of the reservoir rocks are not changed during the periodical CO
2-injection, however the risks associated with their possible changes described above may be addressed in further studies.
The study starts from analyzing an actual CO
2 injection case [
5] highlighting reasons for occasional periods of injection and well shut-ins and typical constraints applied in any CO
2 injection process. Then, we introduce the periodic injection concept defined in the context of current CO
2-injection common practices. Since one of the limiting factors during any CCS project is the maximum reservoir pressure governed by formation integrity constraints, we continue with studying the effects of periodic injection in both mechanistic and full-field reservoir simulations assuming injection at this maximum pressure. The paper concludes with analysing overall effect from the periodic injection studied in the context of a real field-case environment including other benefits from periods in injection like improved permanent reservoir monitoring.
2. Periodic Injection in Previous CCS Projects
Analysis of actual CCS projects with CO
2 injection in saline aquifers shows that well injection history is always a combination of sequential injection and shut-in periods related to well tests, treatments, workovers and stimulations. The Snøhvit CO
2 injection may be considered as an example [
5,
27]. In this CCS project, CO
2 produced together with hydrocarbon gas from the offshore Snøhvit gas field is separated on-shore and injected in a saline aquifer adjacent to the gas field reservoirs. Although stable CO
2 supply is provided in this case, periodic injection is taking place by operational reasons as described below.
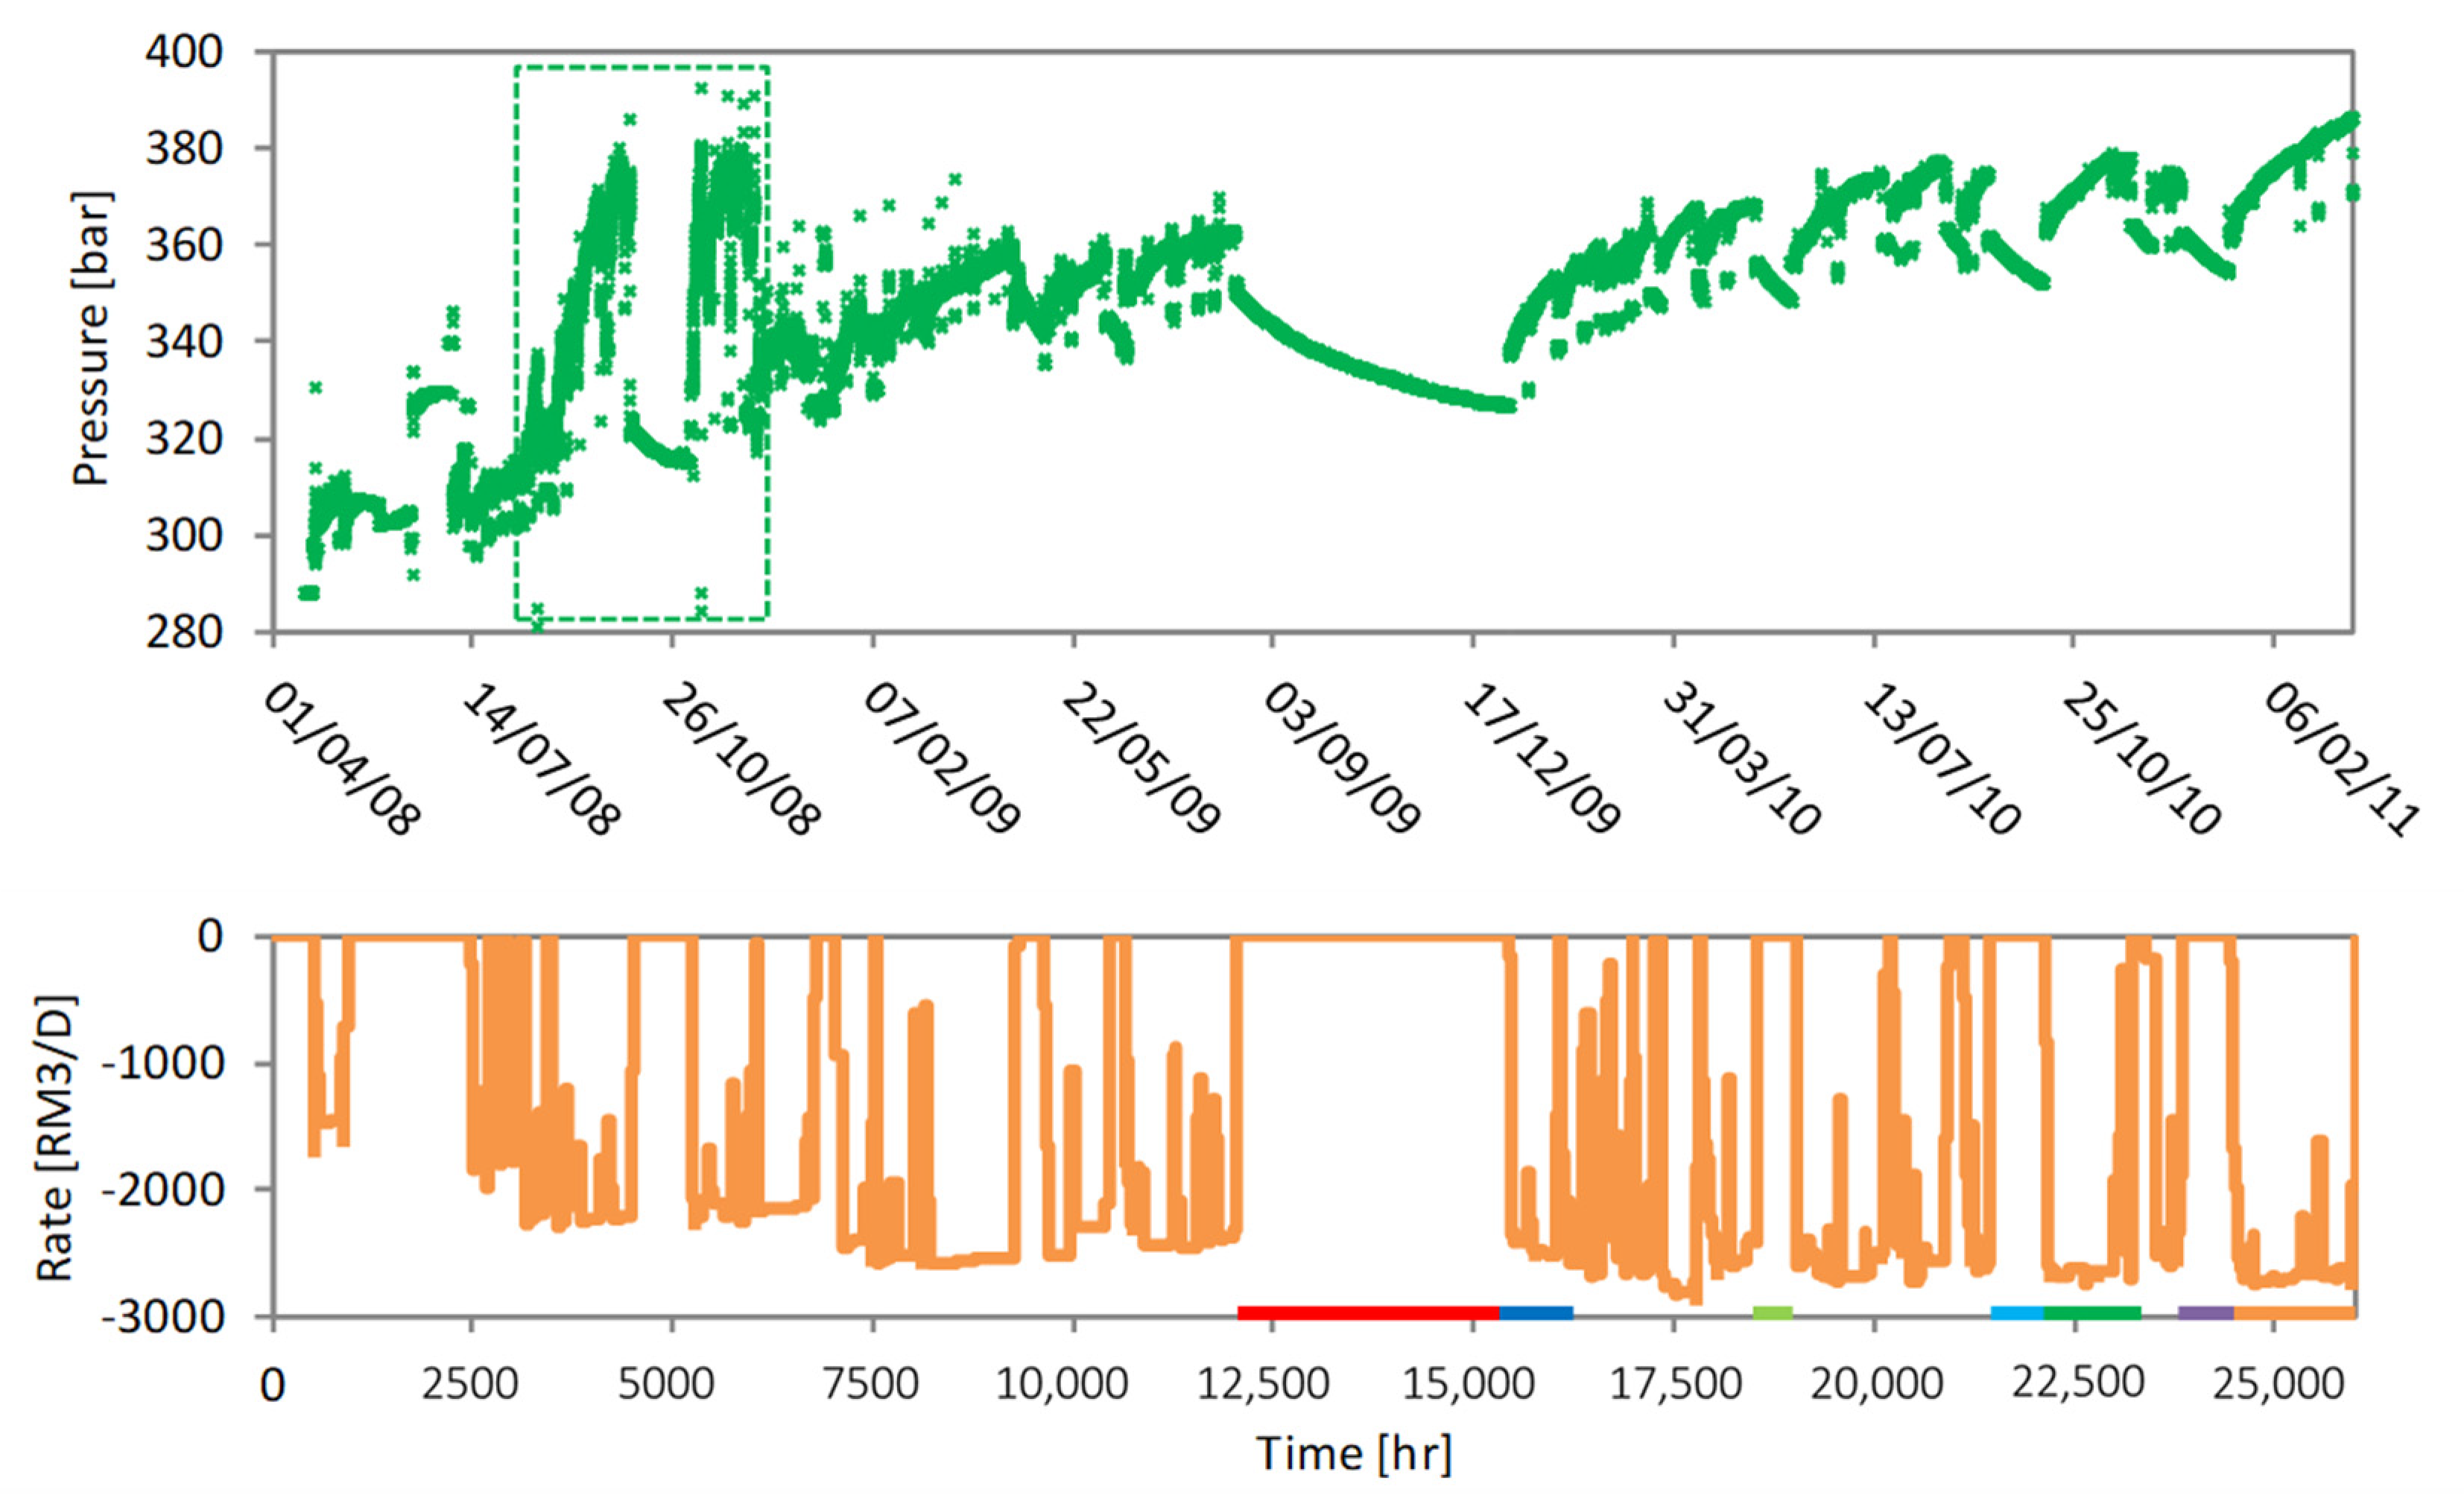
The three-year history of CO
2 injection into the Tubåen formation (
Figure 1) contains a series of injection and shut-in periods. The major well shut-ins (
Figure 1) were related to the well treatment in October 2008 and the major plant maintenance during autumn 2009 [
5]. At the same time, a variety of well shut-ins and rate variations are observed over time. The injection timeline is therefore actually represented by irregular periodic injections of different duration. Fracturing pressure for the Tubåen formation was estimated to approximately 390 bar [
5] which stopped the CO
2 injection as the pressure build-up reached the threshold value as may be seen in
Figure 1.
This short overview demonstrates that even with stable CO2 supply, operational conditions may dictate periodicity of injection. This provides additional argumentation for investigating the impact of periodic injection on efficiency of underground storage.
3. Concept of Periodic Injection
Intermittency of CO2 supply may happen due to different reasons such as:
Transport with ships, tank-trucks, trains.
Seasonal variations of summer and winter electricity demands and production.
Sources with variable rates like coal- or gas-fired power plants.
Planned and accidental shutdown of different facilities.
The concept of periodic injection considered in this paper is similar to the concept of cyclic injection, with regular, scheduled and repeated cycles, widely used in IOR/EOR applications discussed above, but it has several distinctive features:
Injection may happen with alternating well shut-in and injection periods, but also with variable injection rate without shut-ins.
Shut-in and injection durations and rate changes may vary on a irregular basis due to intermittent supply and operational reasons.
In this paper we denote all the cases as periodic injection in comparison with continuous injection for consistency, while these ‘periodic’ cases also include cyclic injection as a particular case.
The main effects to play a role in periodic CO2 injection are assumed to be: fluid compressibility, gravity and fluid segregation, and CO2 dissolution in water. In this paper we study all these effects, step by step. The main focus in mechanistic simulations was on fluid compressibility, while gravity and dissolution were studies in the field scale simulations. Other CO2 trapping mechanisms such as rock-fluid interactions and microbial reactions are beyond the scope of the study.
4. Feasibility Study of Periodic CO2 Injection
As a first step, a feasibility study was carried out on a 2D model of one-well CO
2 injection in a saline aquifer assembled in the Saphir simulator, following the study and the reservoir and fluid parameters discussed in [
28,
29] and previous studies of petroleum reservoirs [
30]. The reservoir segment simulated in this study has a size of 10 km with 25% porosity and 19 mD permeability, with PEBI-type simulation grid and grid-block sizes varying from 0.05 m near the wellbore to a 400 m distance from the reservoir. In this paper, we concentrate on pressure management and injection capacity evaluations using this model, while CO
2 injection combining injection and shut-in periods was also studied with similar models in the context of permanent reservoir monitoring as discussed in [
27,
31].
Figure 2 shows a 2D square-shape saline aquifer reservoir simulation model with no-flow outer boundaries used for the initial investigations. The size of the model was, however, set large enough to avoid impact of the boundaries, thus making the aquifer close to infinite acting (within the time frame of the simulations). Single-phase flow was simulated for water injection, while two-phase water-CO
2 flow without CO
2 dissolution in brine was simulated for the CO
2 injection scenarios.
The well bottom hole pressure results of two initial cases are as follows: continuous injection of water and CO
2, respectively, are shown in
Figure 3, demonstrating monotonic pressure buildup in both cases (we should note that injection volumes were not the same in these cases). Introducing cycles into the injection schedule changes the picture significantly (
Figure 4). While the pressure in each next injection period builds up to a higher level compared to the previous one (as expected) for water injection, the maximum buildup for the similar CO
2 case actually declines from period to period. This effect may be useful for pressure management and for increasing injection capacity under maximum injection pressure limitations as shown further in this section. Understanding of the mechanics behind this effect is also important, that is elaborated in 1D radial simulations presented later in the article.
In CCS projects, maximum well injection pressure is always limited, most often by formation integrity constraints ensuring safe injection and storage as discussed above, therefore governing maximum storage capacity. A representative injection case with the well operating at maximum bottom hole pressure, that was assumed to be 200 bar, was studied on the same model (
Figure 5) to see potential of periodic injection for increasing storage capacity. The declining pressure drop observed at periodic injection of similar CO
2 volumes in each injection period (
Figure 4) argued for the possibility to increase injected volume at each next cycle, keeping well pressure below the maximum pressure limit. Simulations of continuous and periodic CO
2 injection (
Figure 5) showed that an additional amount of CO
2 may be injected at each next injection period, and this amount increases from period to period (
Figure 6). Comparison of cumulative volumes injected for these two cases gives increase of CO
2 injected by 22% for the same ‘effective injection time’.
5. Reservoir Pressure and CO2 Plume Dynamics
The feasibility study described above called for a need to understand CO
2 plume and reservoir pressure dynamics under periodic injection. This helps in optimizing injection schedule and well locations in field-scale studies. A simplified 1D radial model, similar to the 2D model described above, was assembled in the Eclipse reservoir simulator to study these dynamics (
Figure 7). Two sequential periods of injection and shut-in were simulated, with CO
2 rate specified in reservoir volumes (in contrast to volumes at standard conditions and specified bottom hole pressure used as the well control in the Saphir runs above). The same effect of declining pressure buildup in each next injection period were observed in the Eclipse runs (
Figure 8).
Radial pressure distributions after the sequential injection periods illustrate the decline in pressure buildups (
Figure 9) caused by a growing CO
2 plume (
Figure 10). Inside the plume, viscosity of the fluid system (brine and CO
2) is lower than brine viscosity, while compressibility of the system is higher than brine compressibility. The growing plume resulted in the pressure buildup decline (
Figure 8 and
Figure 9).
The radial saturation distributions (
Figure 10) shed light on the complementary effect: CO
2 saturation front moves not only during injection, but also during well shut-in periods. This growth of plume volume is governed by CO
2 expansion due to pressure equilibration during shut-in periods. The growth becomes more visible, when the saturation profile is transformed into pore volumes occupied by CO
2 (
Figure 11). The observed initial increase of the pore volumes is governed by radial grid with growing grid block volume with radius. The plume volume grows at about 10% during the first shut-in and more than 20% at the second one.
The simulations above have shown that the plume was growing during well shut-in periods, that will be called ‘CO2 expansion squeeze’ further in the paper. In order words, pressure cycles can govern CO2 plume growth even during well shut-ins without active viscous water displacement, improving injection potential. This effect may give an advantage when planning injection schedule and can be employed to increase injected volumes at given maximum injection pressure constraints as illustrated in the next section.
6. Actual Field Case Simulations
Reservoir model. Based on the inspiring results from the feasibility and detailed CO
2 plume studies above, it was decided to investigate the effects of periodic CO
2 injection in an actual geological setting. For this purpose we used the model of the LBr-1 reservoir (in the Czech Republic), available from earlier studies [
28,
29]. This reservoir consists of four zones with limited communication between zones, pinching out in the east, and connected to a significant aquifer to the west. The aquifer is believed to be closed, with an active volume in the order of 1 to 2 Gm
3. The model reservoir pore volume is around 40 Mm
3. The reservoir rock is sandstone with approximately 20% porosity and permeability in the 100 to 500 mD range. Reservoir depth is around 1100 m below ground level, with temperature of 43 °C and current pressure estimated to be about 115 bars.
The model was assembled in an oil-industry standard reservoir simulation tool (Eclipse100) with three phases, respectively, representing water (brine), CO
2 (in supercritical state), and CO
2 dissolved in water. CO
2 solubility in brine for the different temperature and pressure was taken from [
32], while the corresponding variation in brine density was obtained from [
33]. Relative permeabilities were based on actual measurements done in connection with the earlier studies. Capillary pressure between brine and CO
2 as well as capillary trapping of CO
2 were set to zero in this study. Hysteresis effects were therefore not included. These issues should probably be a subject for further investigations. As the sole purpose of this study was CO
2 storage, the reservoir was assumed 100% brine filled initially.
Figure 12 pictures the structural framework of the model.
The CO
2 injection was set to be controlled by a fixed bottom hole pressure (
Figure 13), thus accounting for injectivity variation related to CO
2 saturation in the wellbore area.
Four principal sensitivities were investigated:
Period (cycle) half-length: 1-month (i.e., 1 month injection and 1 month shut-in) vs. 3-months.
Placement of injection well: up-flank vs. mid-reservoir.
CO2 dissolution in water: dissolution vs. no dissolution.
Aquifer size: limited (but large) vs. unlimited.
Random variation in injection/shut-in periods length (between 1 and 3 months).
Up-flank injection. Sensitivities 1 and 2 were run in combination, comparing 10 years of periodic injection with 5 years continuous (equal net injection time). The complete results for the up-flank injection with 1-month cycles are shown in
Figure 14.
Figure 15 illustrates spatial distribution of CO
2 plume for the cases of continuous and periodic CO
2 injection with half-period of 1 month discussed above. The plume form and size are different in these cases: periodic injection governs large plume extent due to the CO
2 expansion squeeze effect revealed in the mechanistic simulations described above.
Comparison of one-month vs. three-month periods is shown in
Figure 16, with the up-flank injector position. The periodic injection allows for pressure decline after each cycle and partial fluid equilibration in the area of CO
2 plume, leading to repetitive improvement of the injection performance with increased rate in each injection following a shut-in period. This effect is illustrated in
Figure 17 where the rates for the three injection scenarios are shown vs. net injection time. Related to the quality of this reservoir, the equilibration seems to be completed within the one-month shut-in, giving the full opportunity of this improvement. Longer shut-in, therefore, does not lead to any further injection enhancement.
Mid-reservoir injection.
Figure 18 and
Figure 19 exhibit the equivalent results, indicating lesser rate benefits of periodic injection in this case, particularly for the three-month half-cycles. The reason seems to be the gravitational effects, stimulated by the formation dip and thicker reservoir zones. While the up-flank injection rapidly establishes a stable CO
2 cap around the injector, the mid-reservoir injection allows for CO
2 to migrate vertically within each layer as well as up-dip during shut-ins due to density differences, leaving water to re-occupy the well surroundings.
Figure 20 shows the fluctuation of CO
2 saturation in a simulation grid cell close to the injector, with further illustration in
Figure 21—underpinning this assumption. This adverse injectivity impact appears to largely outweigh the positive effect of pressure equilibration. Beware that the mid-reservoir well generally has higher injection rates due to better reservoir exposure.
This repeated flow-back of brine into the near-well region may also have other adverse effects, such as augmented precipitation of salt. This and other potential negative effects are discussed in the ‘Discussion’ section below.
CO2 dissolution in brine. The effect of letting CO
2 dissolve in water, depicted in
Figure 22, is based on the optimum scenario of up-flank injection and one-month half-cycles. As expected, the cumulative injected volumes are lifted both for continuous and intermittent injection (CO
2 dissolved in water occupies less reservoir volume than supercritical CO
2 in free form), however, the impact relative to periodic injection seem inconsequential.
Aquifer size. The aquifer of the LBr-1 reservoir is believed to be closed. However, the initial pressure was very close to hydrostatic, so the possibility of an open aquifer may not be ruled out. In order to investigate the consequences of an open (infinite acting) aquifer, the up-flank, one-month half-cycle case was re-run with a down-flank relief well, set to limit reservoir pressure to a few bars above the original.
Figure 23 presents the result of this case, suggesting that the size and dynamic response of the aquifer can be an important parameter as to the benefit of periodic injection.
In this study, the simplest case of periodic injection with equal flowing and shut-in durations and the same well operating condition (specified bottom hole pressure) was mainly used, since it provides clear understanding of the positive effect counted in additional volume or in mass stored. In reality, a periodic injection may include injection and shut-in periods of different lengths and injection at different rates or simply periods of varying injection rates. The case of the different lengths may be studied using the same criterion of efficiency (additional volume stored), while evaluating effects from varying injection rates requires different criteria also accounting for pressure management. The latter case is a subject for separate study, while the effect of different lengths was evaluated in this study.
Random variation in injection/shut-in periods length. One additional case was simulated to study this effect. We ran the up-flank injection case controlled by maximum BHP (140 bar) described above (
Figure 16,
Figure 17 and
Figure 18), but with injection and shut-in periods varying between 30 and 90 days. As anticipated, the results showed addition injection potential somewhere between the 30-day and 90-day half-cycles presented above. The findings are shown in
Figure 24 and
Figure 25 below.
7. Discussion
In this paper, we concentrated only on the case of injection at a specified bottom hole pressure, since it may be easily linked to maximum injection pressure restriction and it allows for simple criteria of efficiency—additional CO2 volume or mass stored. The case of periodic injection with variable rate is a matter for future studies, since evaluation of efficiency of such a process requires more complicated criteria including pressure management efficiency.
The cases simulated in this study have shown strong potential of periodic CO2 injection to improve pressure management and storage capacity. However, the simulations did not account for potential geochemistry effects such as salt precipitation, mineral dissolution and formation, and hydrate formation. These effects may create risks for field applications of the periodic CO2 injection and should be evaluated specifically for each reservoir in focus.
Reduction of the permeability of the rock in the near-well region during CO
2-injection can be a showstopper for CO
2-storage. Pressure buildup and uncontrolled fracturing in the near-well region can cause severe injectivity problems. If dry CO
2 is injected to the reservoir, the water around the injector will evaporate into the gas phase and this can give salt precipitation [
23]. Periodical injection of CO
2 can cause back-flow of the brine phase during shut-in periods which can affect the salt accumulation in the near-well region as shown by the case of mid-reservoir injection studied in this paper. The salt precipitation will depend on several parameters, e.g., water-phase composition, residual water saturation, flow rate, pressure and temperature. Dissolution of injected CO
2 into the water-phase in the near-well region will vary with temperature and pressure and will therefore affect the solubility of minerals in the reservoir rock [
34]. The solubility of carbonate minerals is rather fast and especially sensitive to temperature and pressure. High pressure and low temperature during CO
2-injection will give high solubility of carbonate minerals, and this may increase the permeability and porosity of the rock. During the shut-in period with pressure reduction and temperature increase, precipitation of carbonate minerals may cause permeability reduction. Geochemical reactions can also change rock mechanic properties [
35].
When cold CO
2 is mixed with the water in the near-well region, cooling of the near-well region at high injection pressure can cause hydrate formation and thereby permeability reduction. The potential for hydrate formation will depend on the ionic composition of the water [
36] and thereby on the brine composition in the near-well region. During the shut-in period, the hydrate can dissociate depending on temperature and pressure during this period. Variation in the conditions can also affect the well integrity [
26].
The risk for formation damage during periodical CO2 injection will depend on the composition of the reservoir fluids and the reservoir conditions, i.e., it will be field-specific. In addition, it will depend on the injection procedure that is used, e.g., variation in reservoir pressure and temperature. For a specific reservoir, the procedure for periodic injection should be optimized to reduce the risk for formation damage and maintain well and reservoir integrity. Procedure for mitigations should also be established.
The paper did not consider reservoir monitoring capabilities provided by periodic injection. This is another important aspect making periodic injection a very attractive option to improve underground CO
2 storage. Shchipanov et al. [
27] have studied application of reservoir monitoring technology based on time-lapse pressure transient analysis to the Snøhvit CO
2 injection case early discussed in the
Section 2. It was shown that the periodic injection provides favorable conditions for improved reservoir monitoring including early detection of leakage out of the formation as it was particularly shown in [
31] for the geological formation studied in this paper. Here the sequence of injection and shut-in periods populates the time-lapse survey of pressure transients. Therefore, a combination of improved storage capacity, pressure management and reservoir monitoring makes periodic injection a very attractive option to apply in CO
2 storage projects.
8. Conclusions
Results and conclusions from these studies may be separated in two different groups: first, addressing the CO2 expansion squeeze effect; and second, studying this effect in the context of field-scale simulations, including gravity, dissolution and reservoir size effects.
The CO2 expansion squeeze effect governed by fluid compressibility has been studied in the mechanistic reservoir simulations resulting in the following conclusions:
During a well shut-in after an injection period, CO2 plume continues to grow, displacing water due to reservoir pressure equilibration and CO2 expansion.
This effect, in a combination with pressure decline inside the plume during the shut-in period, leads to forming a high compressibility and low viscosity area near the well.
As a result, following injection of the same mass of CO2 will provide a lower pressure buildup than in the previous injection period.
This effect may be employed for improving efficiency of CO2 injection via increasing volume injected with pressure management utilizing periodic injection.
The field-scale reservoir simulations have confirmed increased storage capacity and ability to manage reservoir pressure under periodic injection revealed by the mechanistic simulations with the following, particular conclusions:
The CO2 expansion squeeze effect play a dominant role in the positive effect of periodic injection, increasing injection capacity up to 9% for the same net-time up-flank injection for formation in focus.
Gravity and vertical migration of CO2 plume may significantly reduce the positive effect as it was shown on the comparison of the up-flank and mid-reservoir injection with reduction of the effect to 2% in the latter case.
Random variation of the length of injection/shut-in periods may lead to a minor decline in the effect from periodic injection, but keeping similar overall efficiency if compared to the same length of injection/shut-in periods.
CO2 dissolution in water provided three to four percent of additional CO2 stored in our runs, but this increase was the same in both cases on continuous and periodic injection. This argued that the dissolution does not play an important role in the effect of periodic injection.
In contrast, aquifer size seems to play a major role in increasing storage capacity. Thus, sensitivity of periodic injection to the aquifer size has shown almost double the increase of the capacity in the case of the larger aquifer.
Summarizing the conclusions on field-scale simulations, we can conclude that the periodic injection has significant potential for improving pressure measurement and storage capacity. Analysis of the risks described in the discussion section above and mitigating measures should also be integrated in injection site evaluations.
We therefore suggest to include assessments of periodic injection in storage site evaluations. Such assessments should address structure of the formation in focus and different well locations, while understanding boundary conditions for the site (e.g., size of the aquifer and faults) may play a major role in the assessments.
Further development of the presented technology of periodic CO2 injection into saline aquifers may include studies of the geochemistry and thermal effects highlighted in the discussion section above.


 and
and 