Article

AC Loss Characteristics of HTS Novel Twisted Cables Composed of Soldered-Stacked-Square (3S) Wires

1
Department of Electrical Engineering, Shanghai Jiao Tong University, Shanghai 200240, China
2
Chaoyang Electric Power Company, State Grid Corporation of China, Beijing 122000, China
3
Chengnan Power Supply Company, State Grid Tianjin Electric Power Company, Tianjin 300201, China
4
Department of Electrical Engineering, Chonnam National University, Gwangju 500-757, Korea
*
Author to whom correspondence should be addressed.
Energies 2022, 15(20), 7454; https://doi.org/10.3390/en15207454
Submission received: 14 September 2022 / Revised: 30 September 2022 / Accepted: 1 October 2022 / Published: 11 October 2022
(This article belongs to the Special Issue Smart Materials and Devices for Energy Saving and Harvesting)

Abstract

:
Compared with traditional cables, superconducting multi-stage cables have the natural advantages of greater transmission power and less energy loss, which have gradually attracted attention. However, conventional multi-stage cables are based on low temperature superconducting (LTS) technology and there is considerable scope for improvement in their performance. In this paper, a novel structure of the multi-stage high temperature superconducting (HTS) twisted cable prepared by the soldered-stacked-square (3S) wire is proposed. The AC loss characteristics of the twisted cable are deeply studied by experiments and simulation. Through the experiment, the influence of the voltage-leads on the AC loss measurement accuracy is eliminated, and frequency dependent is shown in the AC loss of the twisted cable. Besides, the simulated value of AC loss is consistent with the experimental value, which verifies the accuracy of the simulation. The AC loss of twisted cable is only 20% of that of the thin strip model, which reveals its outstanding advantages in AC loss.

1. Introduction

Due to the significant features of high critical current density and high irreversible field, REBCO tapes are gradually applied in high temperature superconducting (HTS) cables [1,2]. Researchers have been working to further improve the current-carrying capacity of REBCO tapes by twisting or stacking, such as twisted stacked-tapes cable (TSTC) [3], conductor on round core cables (CORC) [4], Roebel coated conductor cables [5], HTS cross conductor (HTS-CroCo) [6], quasi-isotropic strand (QIS) [7,8], soldered-stacked-square (3S) wire [9], highly flexible REBCO cable (HFRC) [10], and so on. They also promote possible wide applications, such as electrical machine [11] and fault current-limiting superconducting cable [12].
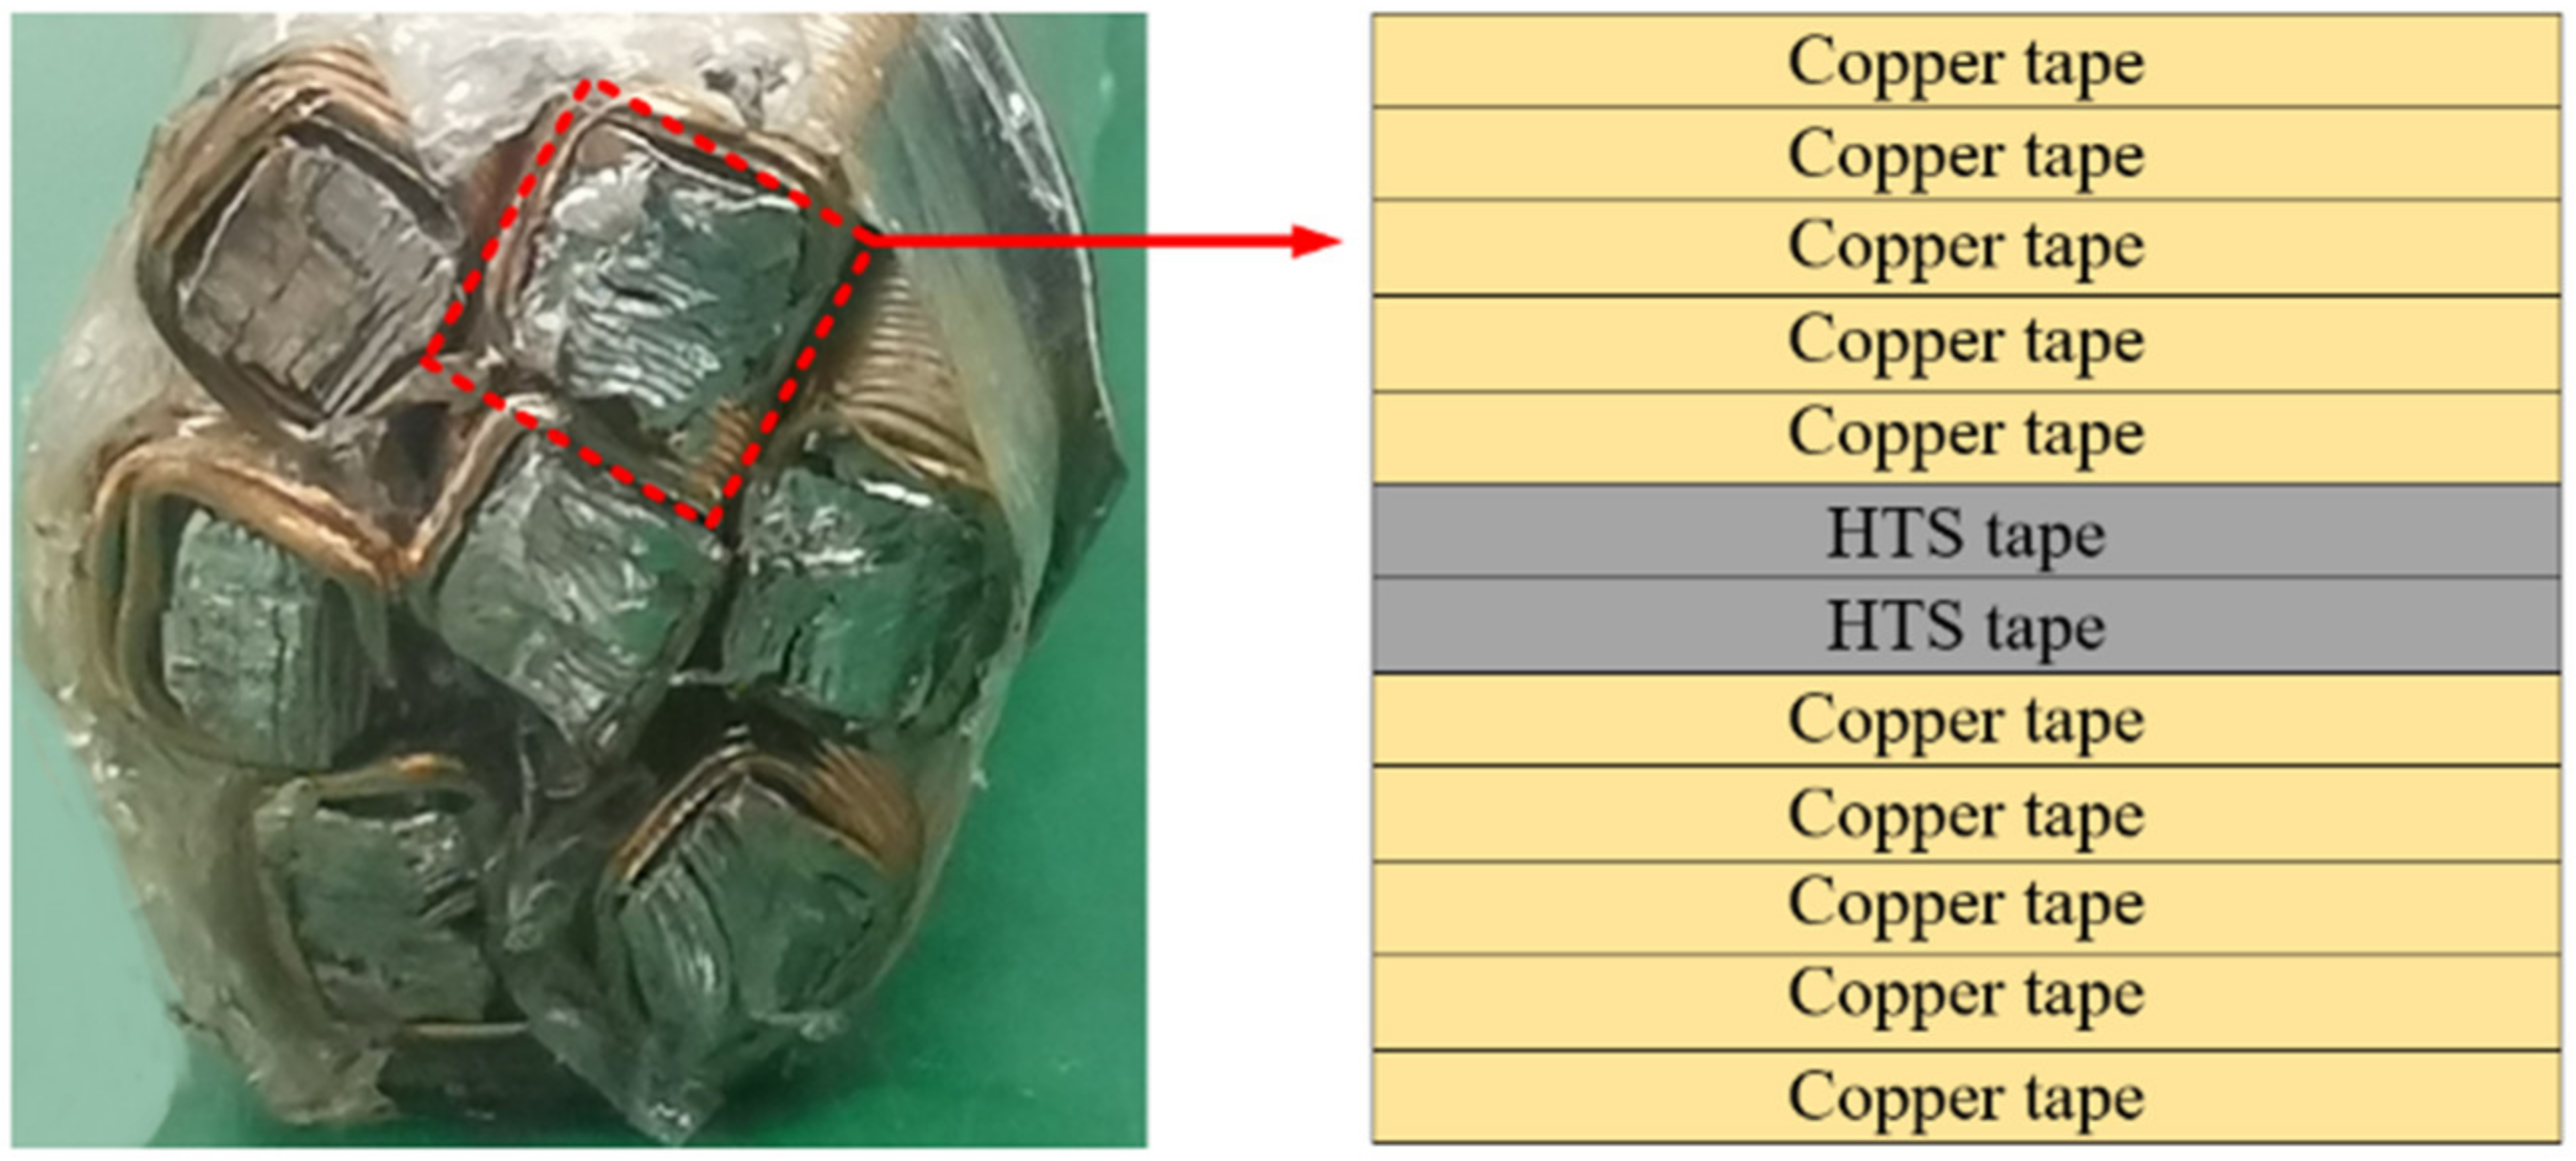
Based on the design of multistage twisted CICC cable used in the superconducting fusion magnet of ITER and other projects, an HTS twisted cable composed of soldered-stacked-square (3S) wires is designed. Compared with the low temperature superconducting (LTS) wires utilized in traditional CICC design, HTS 3S wires effectively makes up for its deficiencies in current-carrying capacity, mechanical strength, AC loss, and cooling cost. The structure of the HTS twisted cable is shown in Figure 1. First, several 2-mm-wide HTS narrow tapes and copper tapes are stacked in a certain order and packaged into an HTS 3S wire. Then, seven 3S wires are twisted to form the first-stage cable, which is named 2 mm-7-cable. Six first-stage cables can be further twisted into the second-stage cable. As shown in Figure 2, the 3S wire indicated by the red rectangle is made up of two HTS tapes and ten copper tapes with 2 mm width, so we named it 3S (2s + 10c)-wire. The HTS tapes used in this paper are the YBCO materials without artificial pinning centers, manufactured by Shanghai Superconducting Technology Company (SSTC). Specifications of the used HTS tapes, 3S (2 + 10c)-wire and 2 mm-7-cable are listed in Table 1. The fabrication and critical current evaluation of the twisted cable have been studied specifically in our previous work [13]. In this study, copper tapes are used instead of the HTS tapes to reduce experimental costs while realizing the cable structures. Meanwhile, copper tapes can also enhance the mechanical strength and provide a certain overcurrent protection.
For superconducting cables that carry large current, AC loss is another important characteristic to be investigated. AC loss will lead to heating and increase the burden on the cooling system, and in serious cases, it may also decrease the critical current of the cable, affecting the stability of the system. Therefore, we focus on the AC loss of the 2 mm-7-cable in this paper. The measuring method of the AC loss is firstly introduced, and the influences of different voltage leads arrangement and different voltage-lead heights on AC loss are discussed. Then, the frequency dependence of AC loss of the twisted cable is tested. Finally, the finite element method (FEM) is used to calculate AC loss of the 2 mm-7-cable and the simulation and experimental results are contrasted in detail.

2. AC Loss Measurement

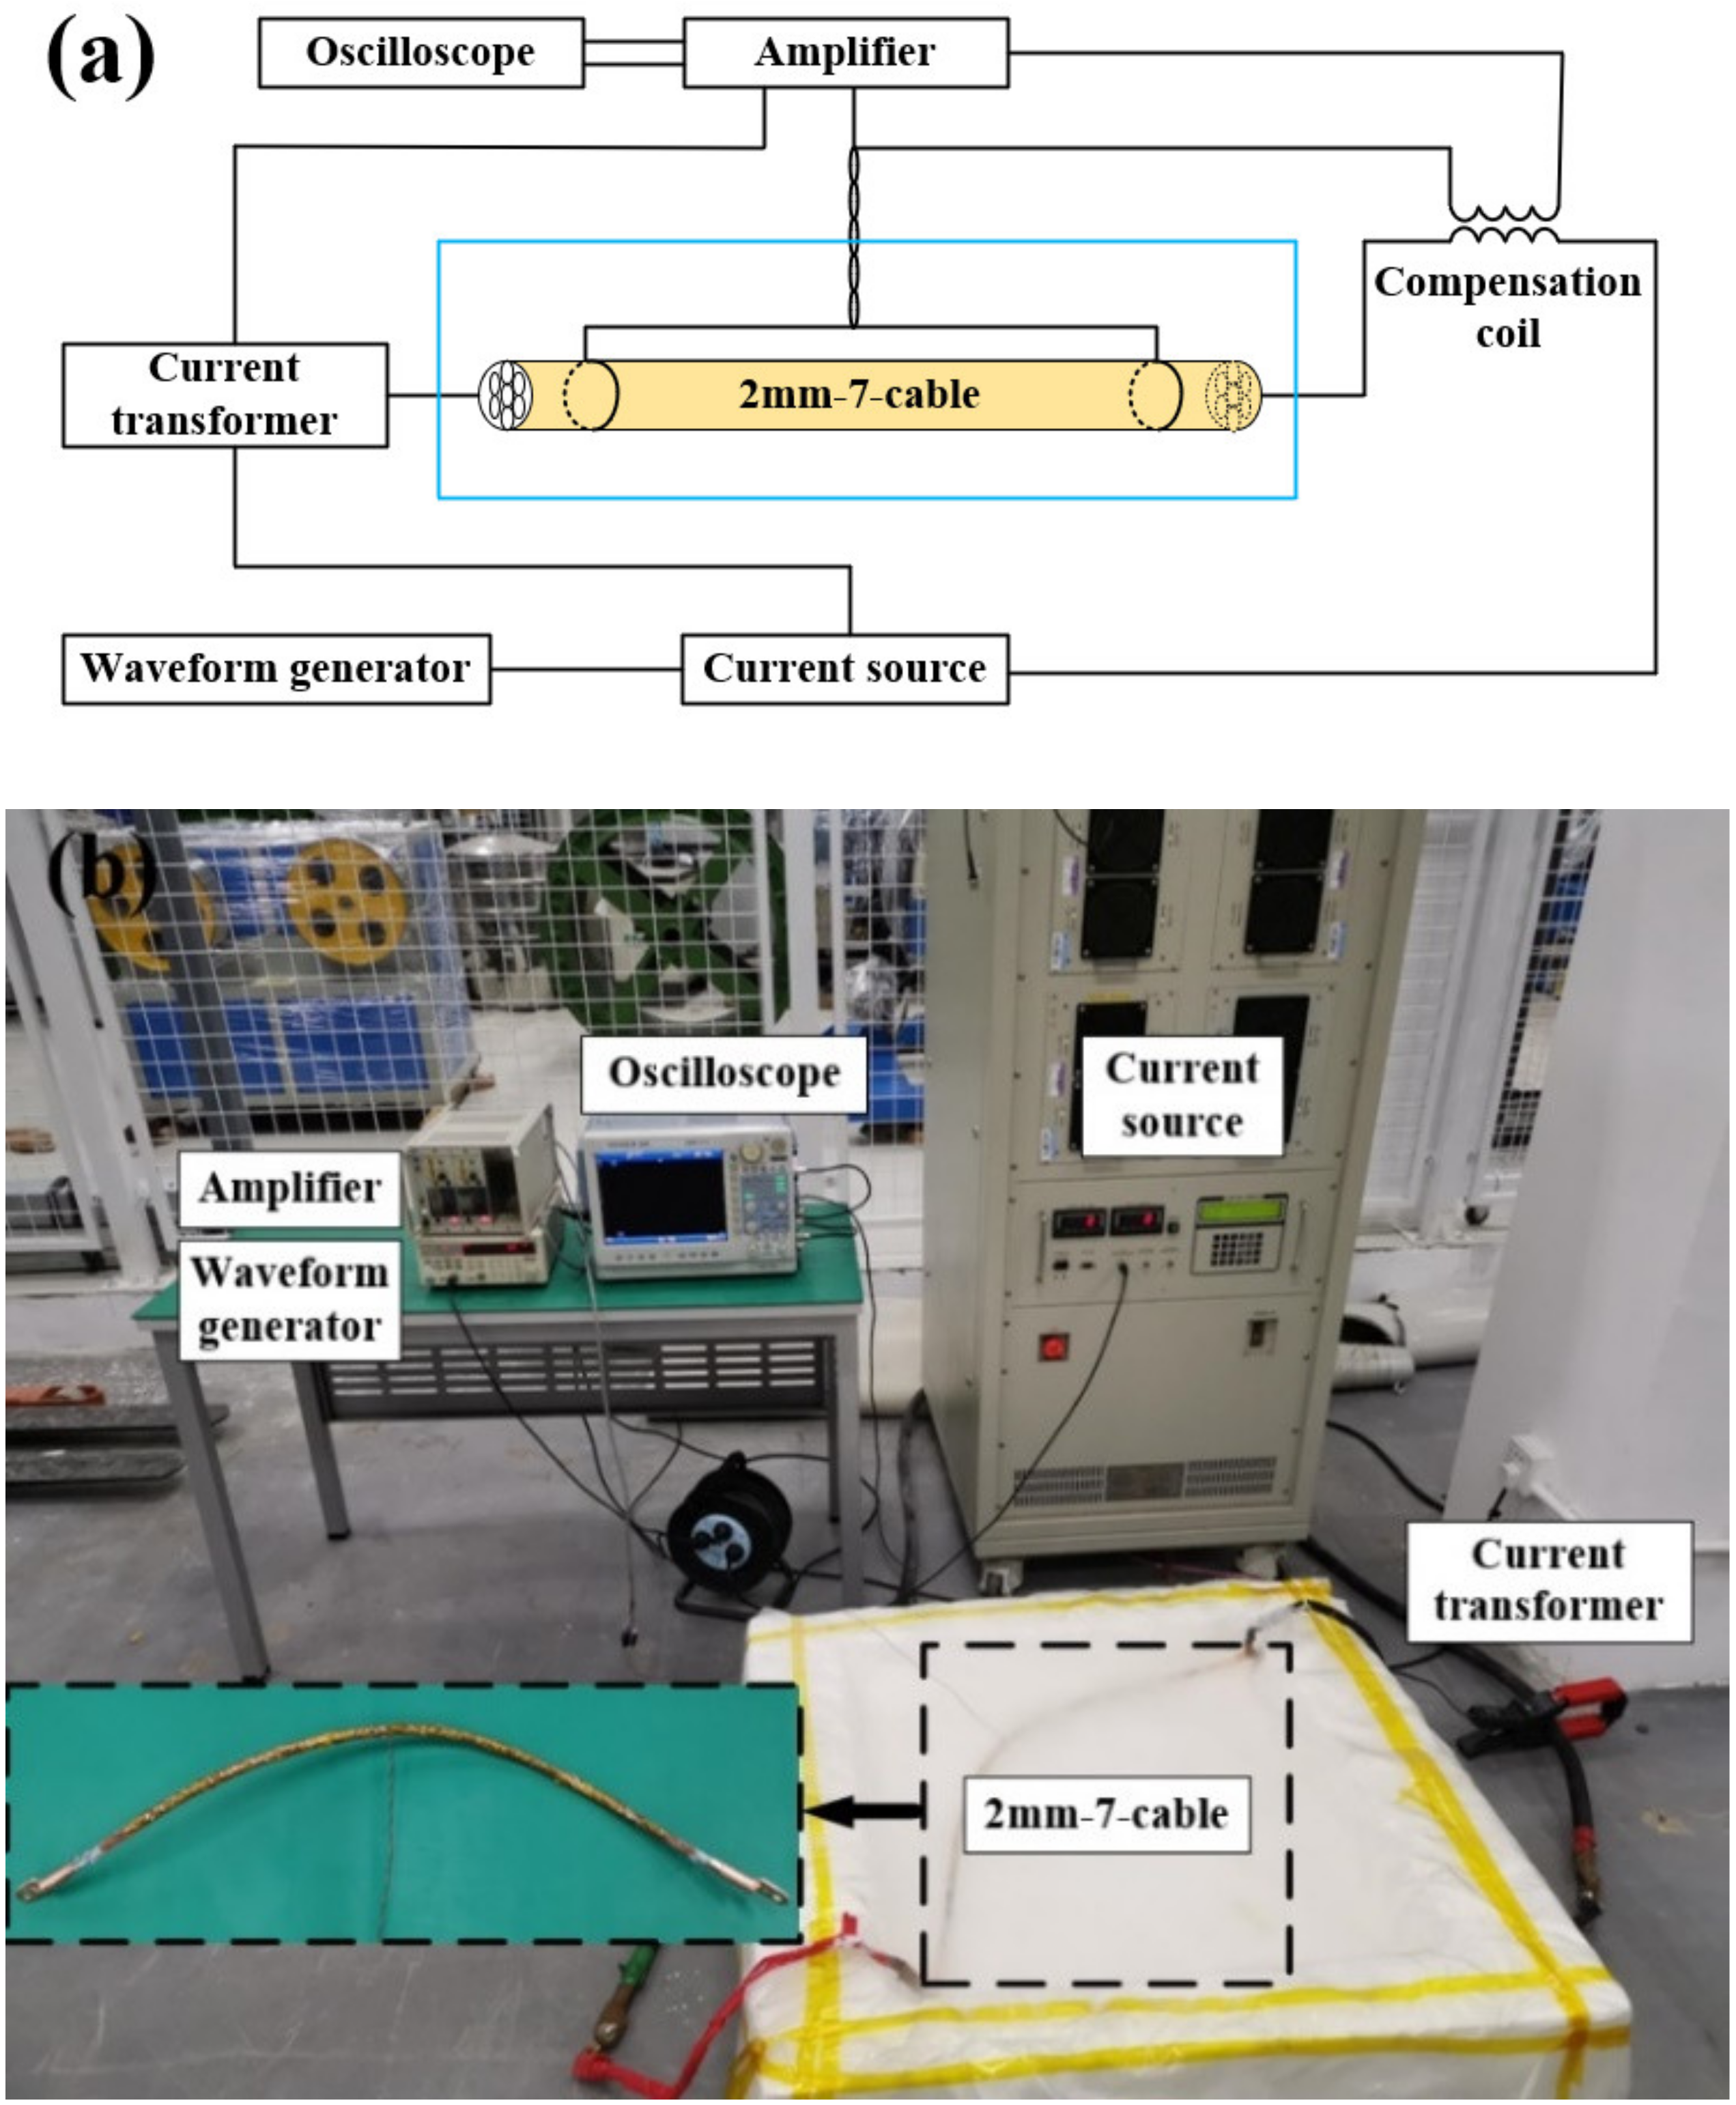
The AC loss measurement system used in this paper is mainly composed of a waveform generator, a current source, a current transformer, an amplifier, an oscilloscope, and a compensation coil. The schematic diagram of the whole measurement system is shown in Figure 3a, and the actual picture is shown in Figure 3b. The experimental steps are as follows: Controlled by the waveform generator, the current source sends out AC current signals with specified cycle, frequency and amplitude. The transformed current signal is collected by the oscilloscope through the filter amplifier by adjusting the relative position of the compensation coil. The voltage signal in the same phase as the current signal is also collected by the oscilloscope after being filtered and amplified. The experimental value of AC loss can be obtained by integrating the compensated voltage and current data. In this study, all the AC loss measurements were carried out in 77 K liquid nitrogen.
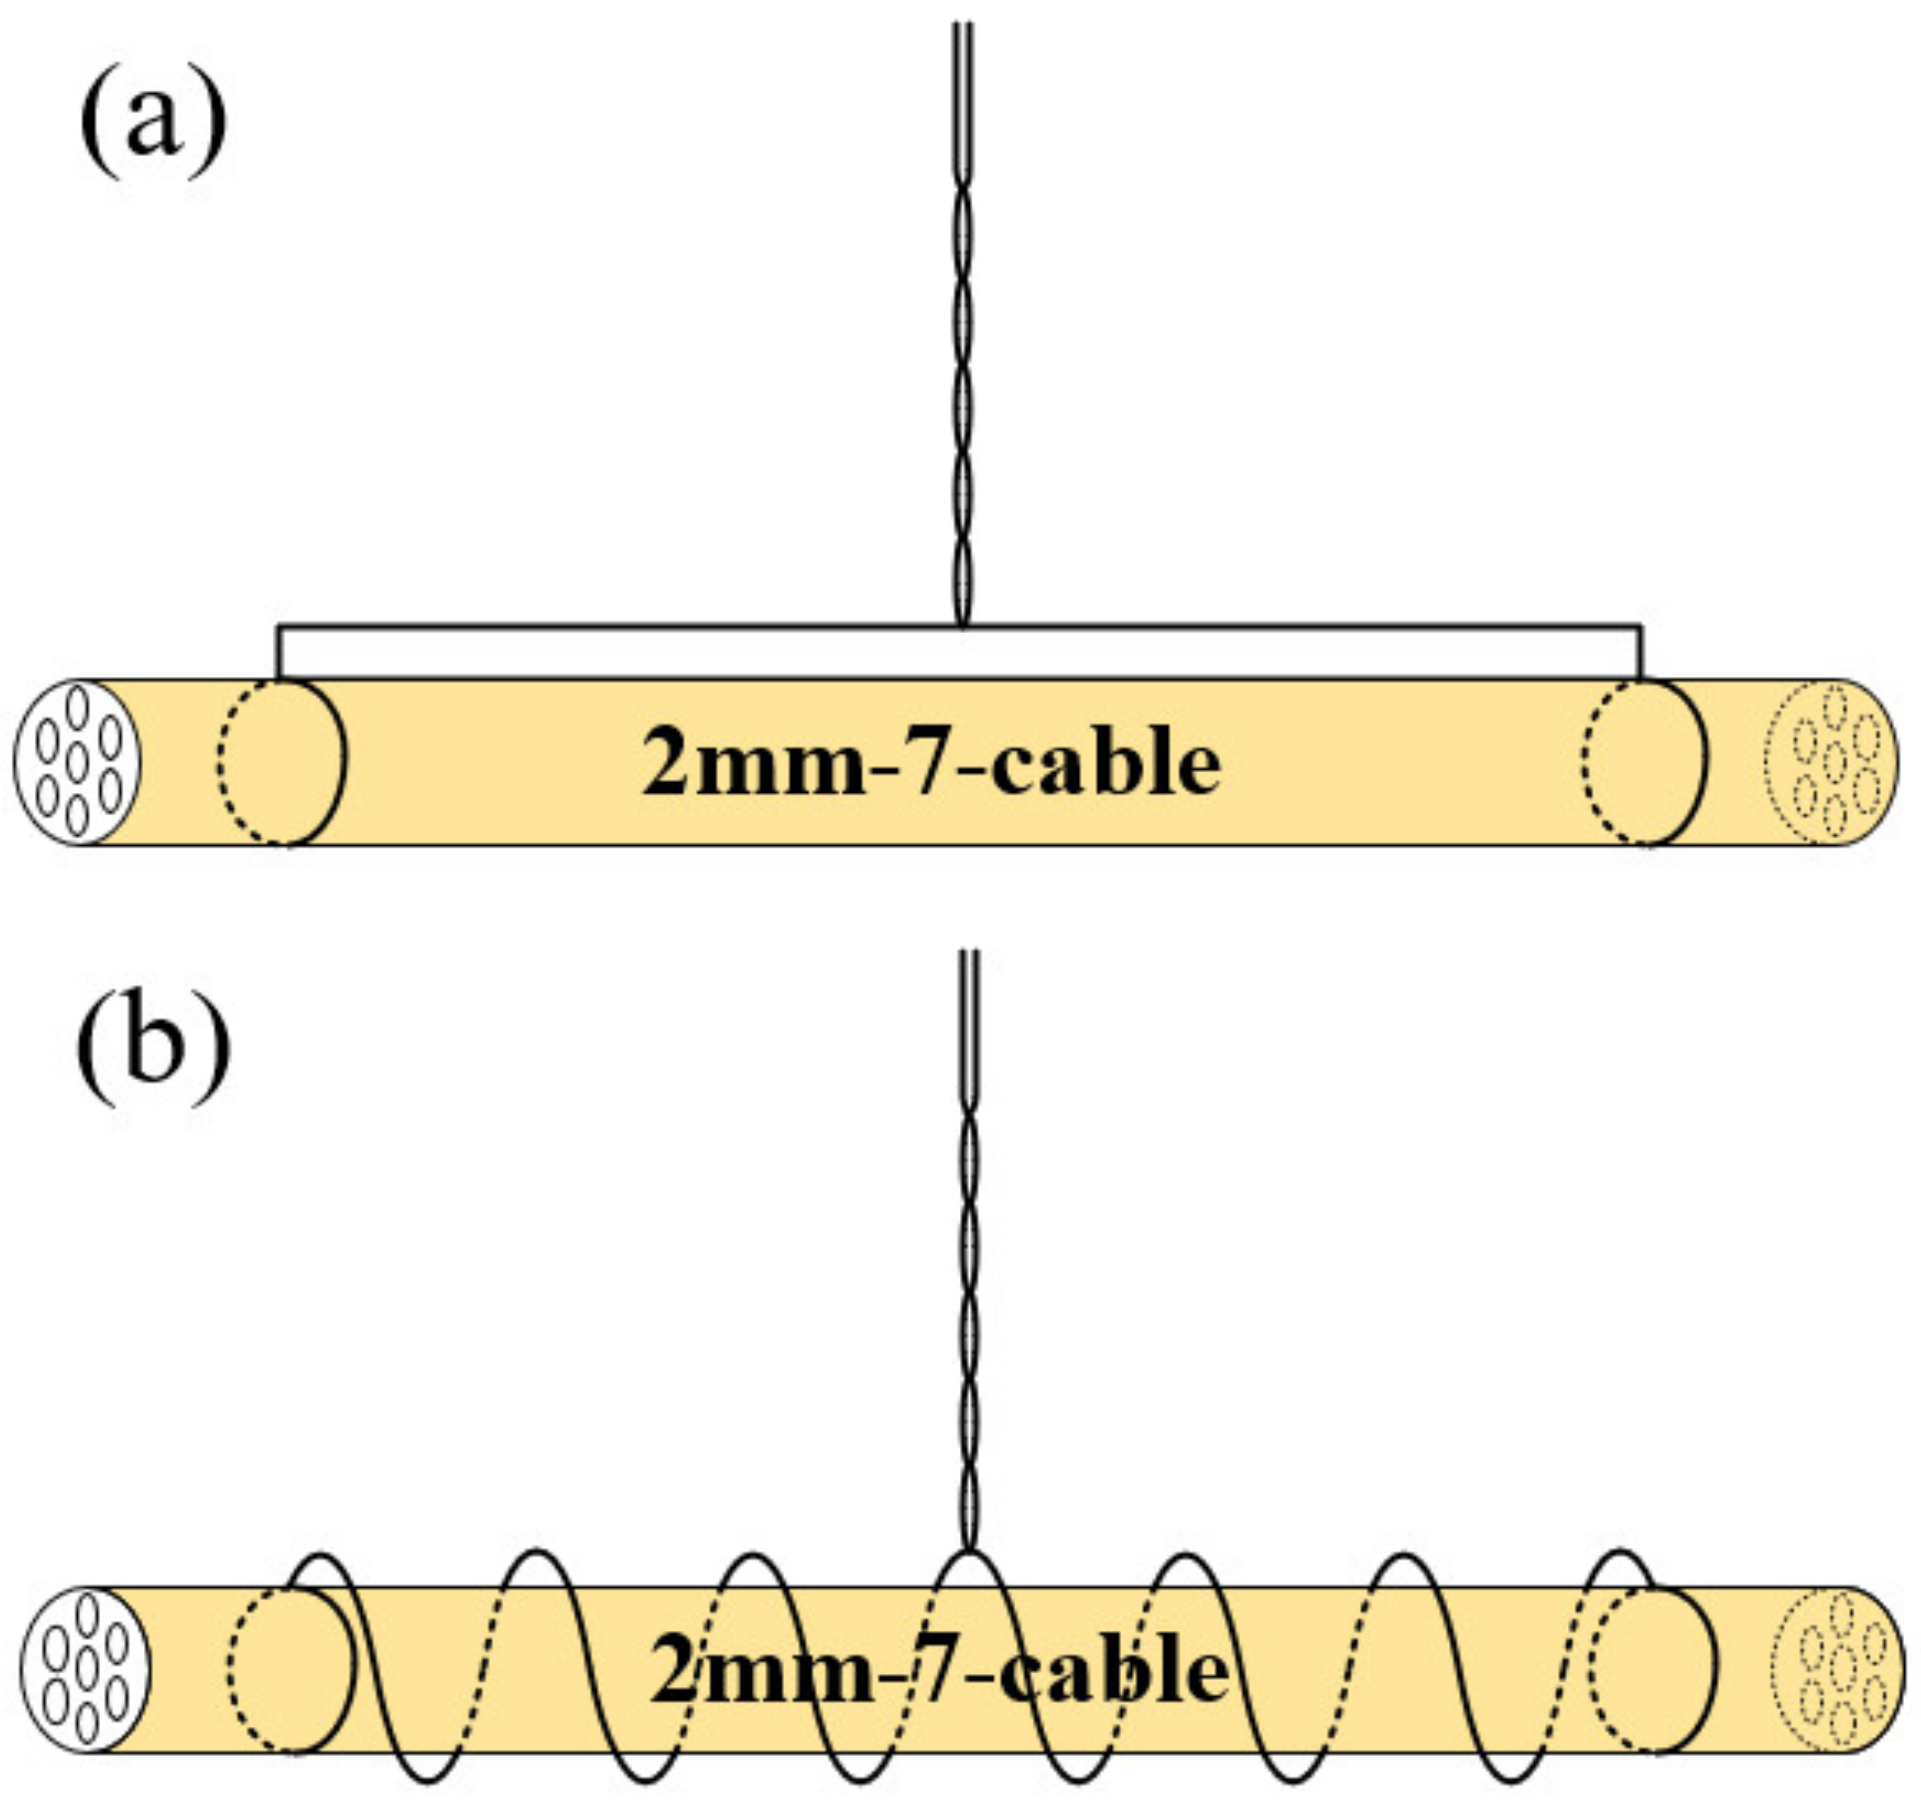
Four-point method is adopted for AC loss measurement. The two ends of 2 mm-7-cable are inserted into copper terminals which is slightly larger than the cable, and solder is poured to fill the gap between 2 mm-7-cable and copper terminals for fixation and electric conduction. The current-leads are connected to the copper terminals of 2 mm-7-cable. For voltage-leads, as there is no precedent to measure the AC loss of this twisted cable structure, two connection methods are designed. The first connection method is the same as the traditional voltage-lead connection. Keep the voltage-leads parallel to the surface of 2 mm-7-cable and wind them into one at the place where the voltage-leads meet, as shown in Figure 4a. A rectangular gap is formed between the voltage-leads and the surface of 2 mm-7-cable. This voltage-lead arrangement is named as square-lead arrangement. Another method is to keep the voltage-leads parallel to the surface of the 3S wires and let it spirally wrap on the 2 mm-7-cable, as shown in Figure 4b. The voltage-leads also meet in the middle. The second connection method is named spiral-lead arrangement. Only when the voltage-lead is high enough and the rectangular area is large enough can the complete loss voltage induced by saturated magnetic flux be collected on the voltage-lead.
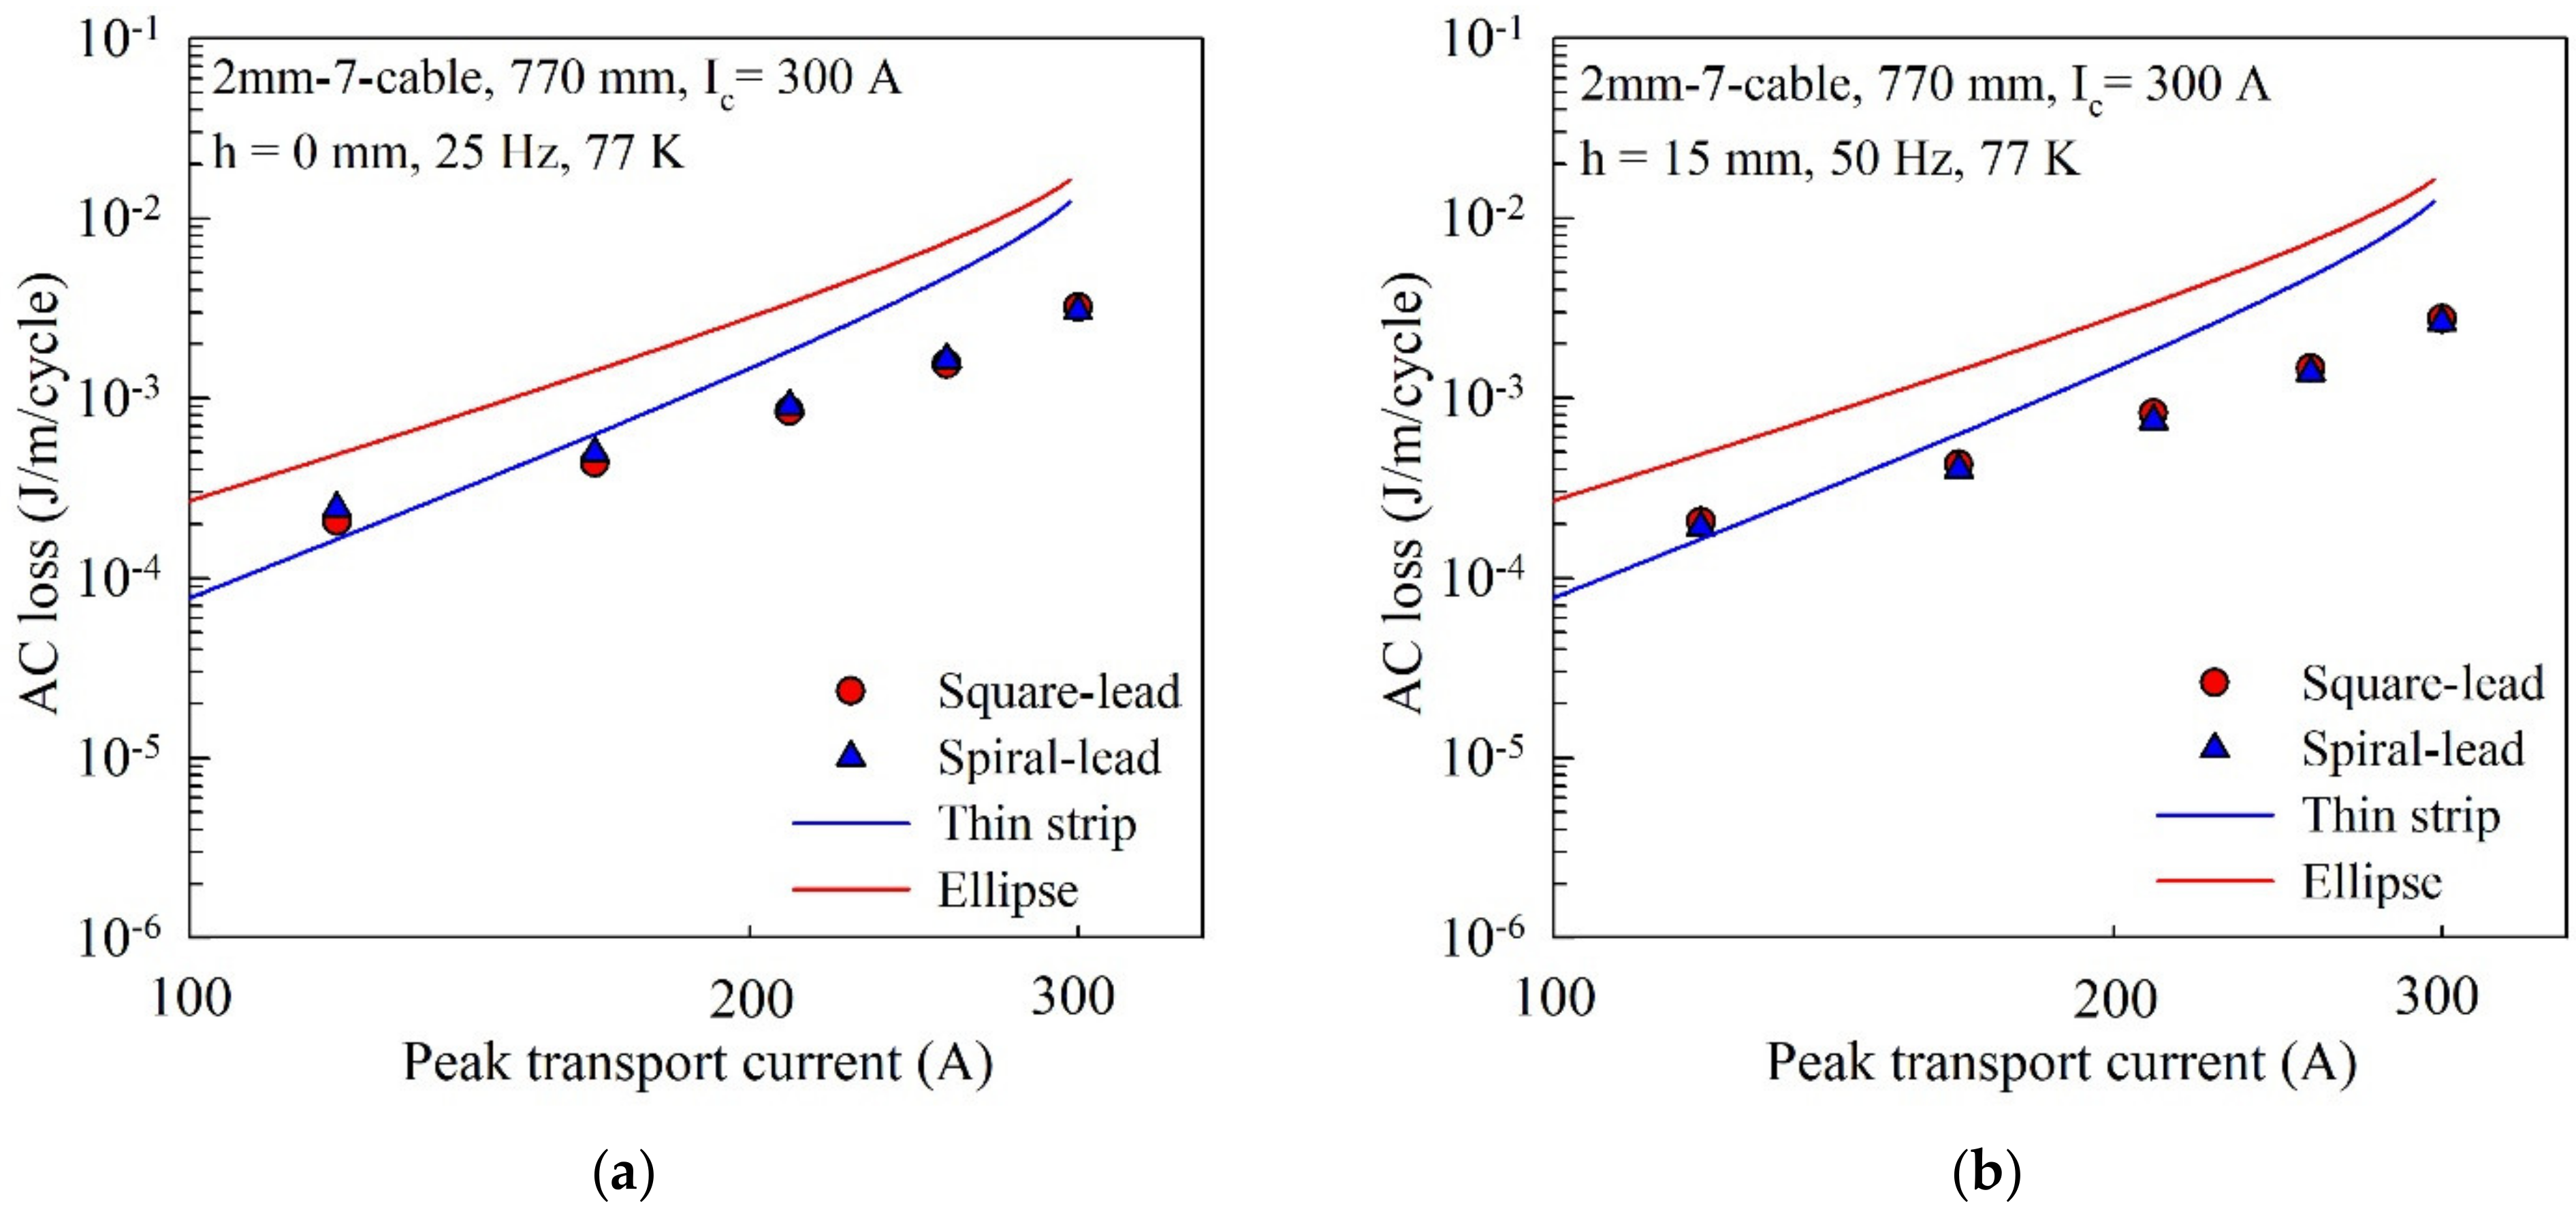
Comparative experiments are carried out on these two connection methods. The AC loss is measured and compared under the condition of keeping the same distance between the voltage-leads and surface of the 2 mm-7-cable and the same frequency. The distance between the voltage-leads and surface of the 2 mm-7-cable ranges from 0 mm to 5 mm, 10 mm, and 15 mm. The measured frequencies include 25 Hz, 50 Hz, 100 Hz, and 200 Hz. In sixteen groups of comparative tests, all the results show that the AC loss is almost the same under the two voltage-leads arrangements. Figure 5 shows the AC loss measurement results of two groups of comparative experiments. Therefore, it can be seen that these two arrangements of voltage-leads have no effect on AC loss measurement.
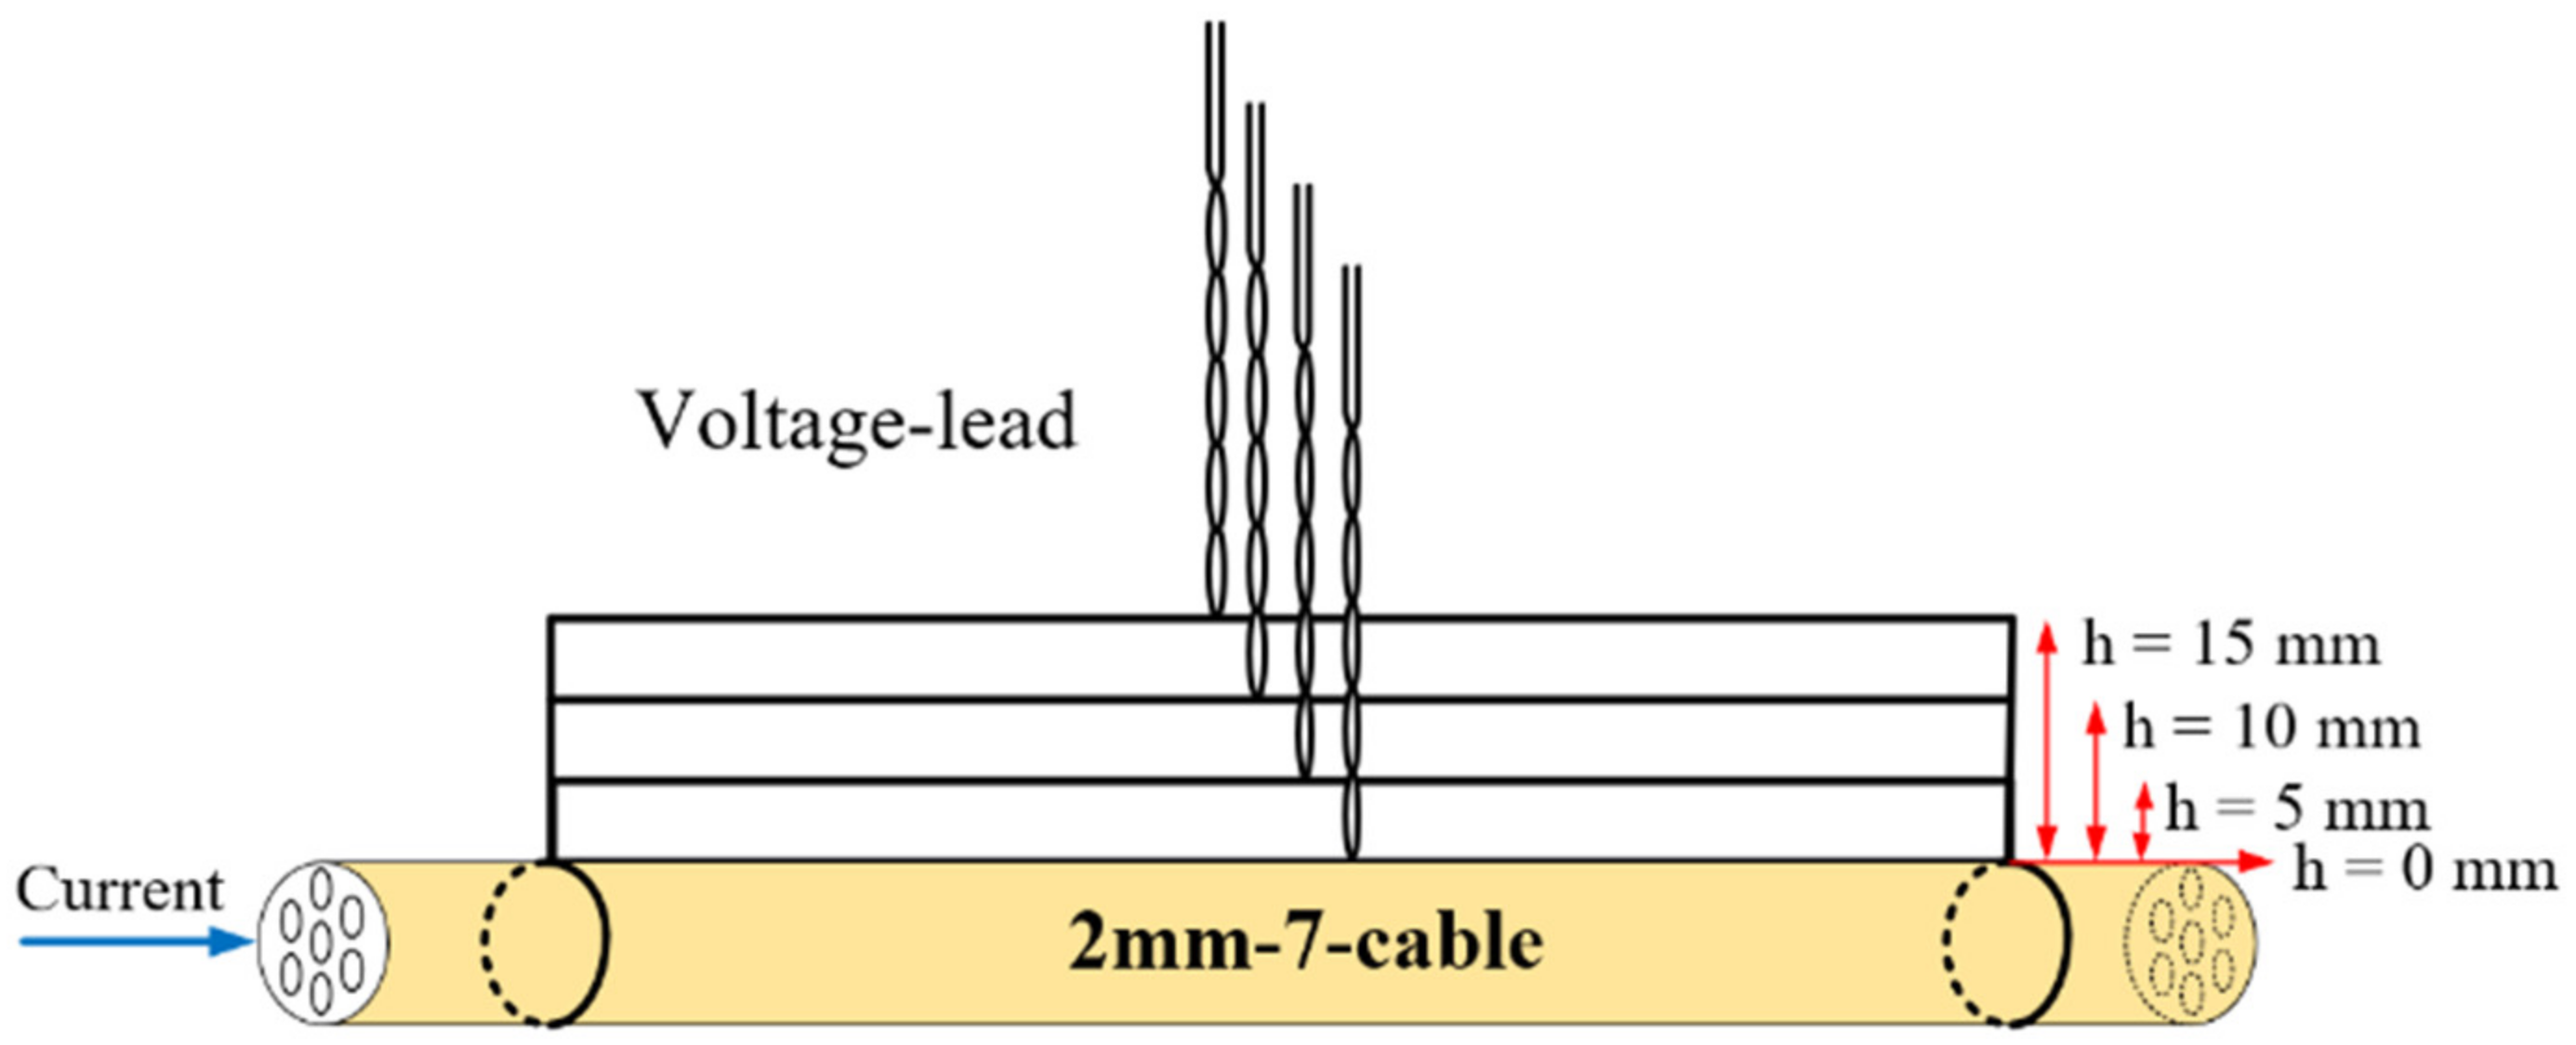
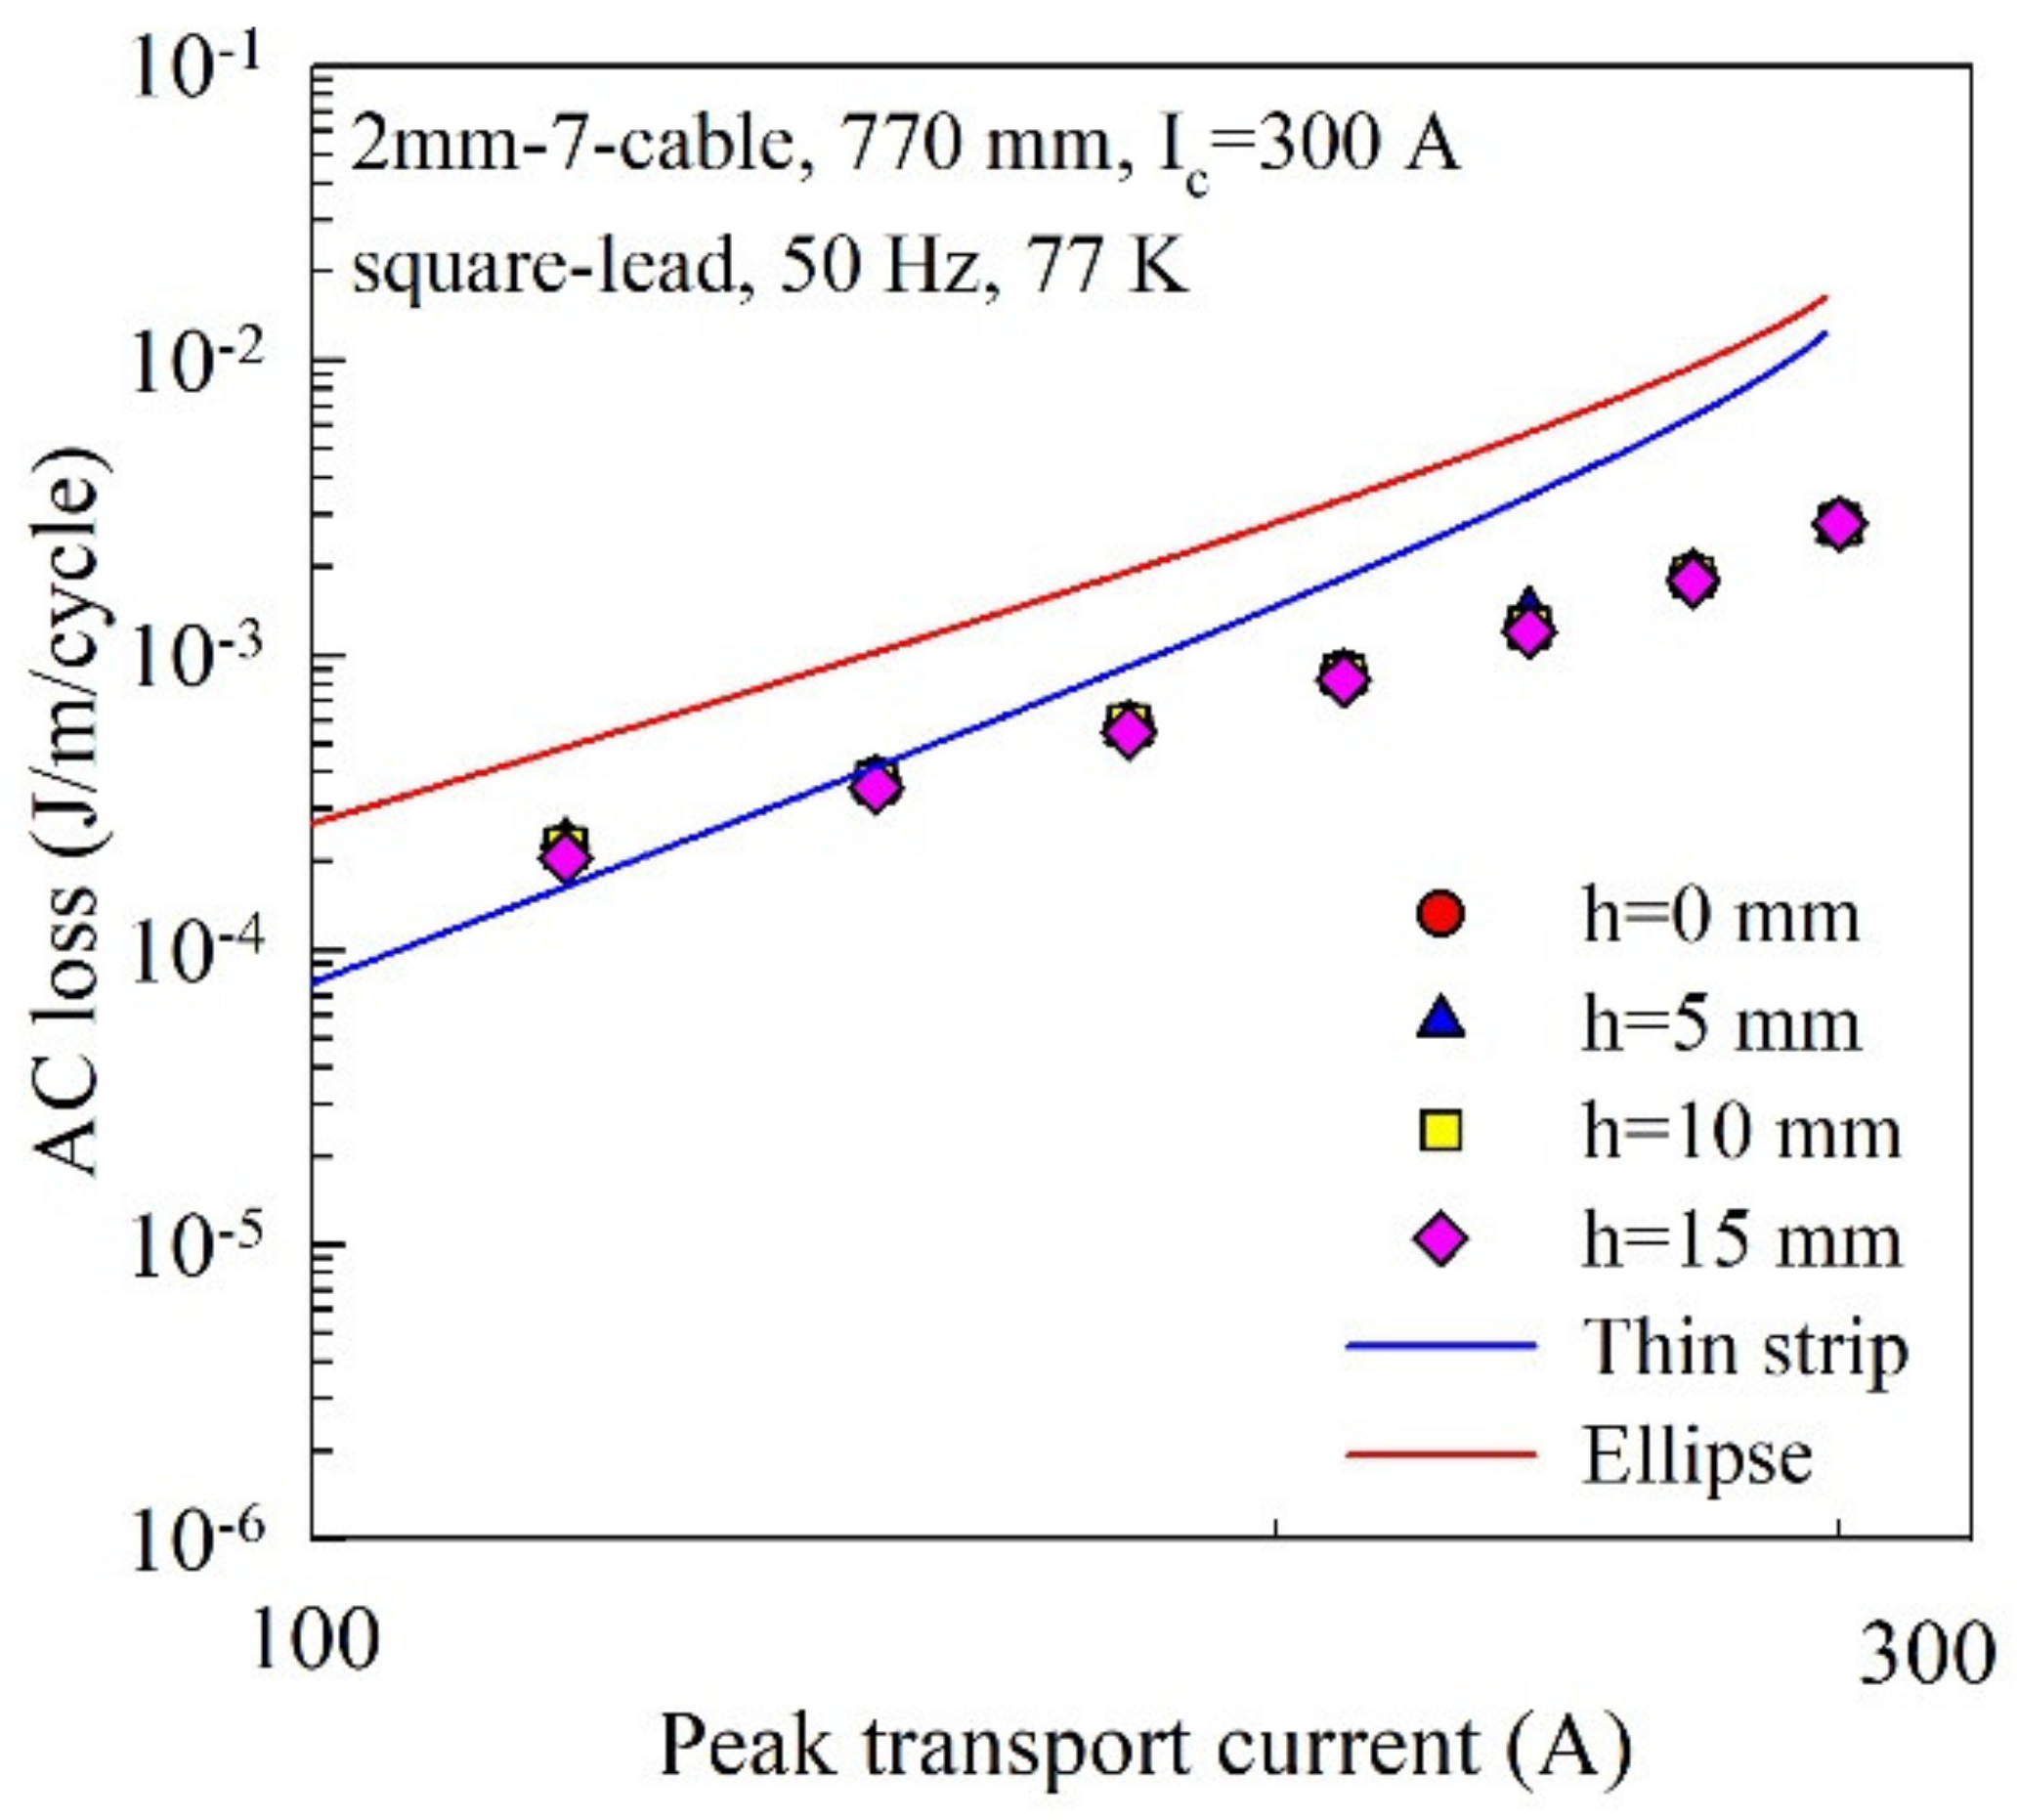
In addition, the influence of voltage-lead height on AC loss measurement is studied. For a single HTS tape, in order to measure the loss voltage correctly, the distance between the sample surface and the voltage lead should be kept at the distance about three times the tape half-width [14]. However, for the twisted cable structure in this study, the influence of voltage-lead height on AC loss is not clear, so we design an experiment to evaluate the influence of voltage-lead height to guide the application of high current HTS twisted cable in the future. As shown in Figure 6, four voltage-leads with different heights are welded on the same 2 mm-7-cable at the same time, and the two ends of the voltage lead are fixed on the same solder joint. The voltage leads are kept parallel to the surface of the 2 mm-7-cable. The distance between the voltage-taps is 770 mm. As we can see in Figure 7, when the height of voltage-leads increases from 0 mm to 5 mm, 10 mm, and 15 mm, the value of AC loss does not change significantly.
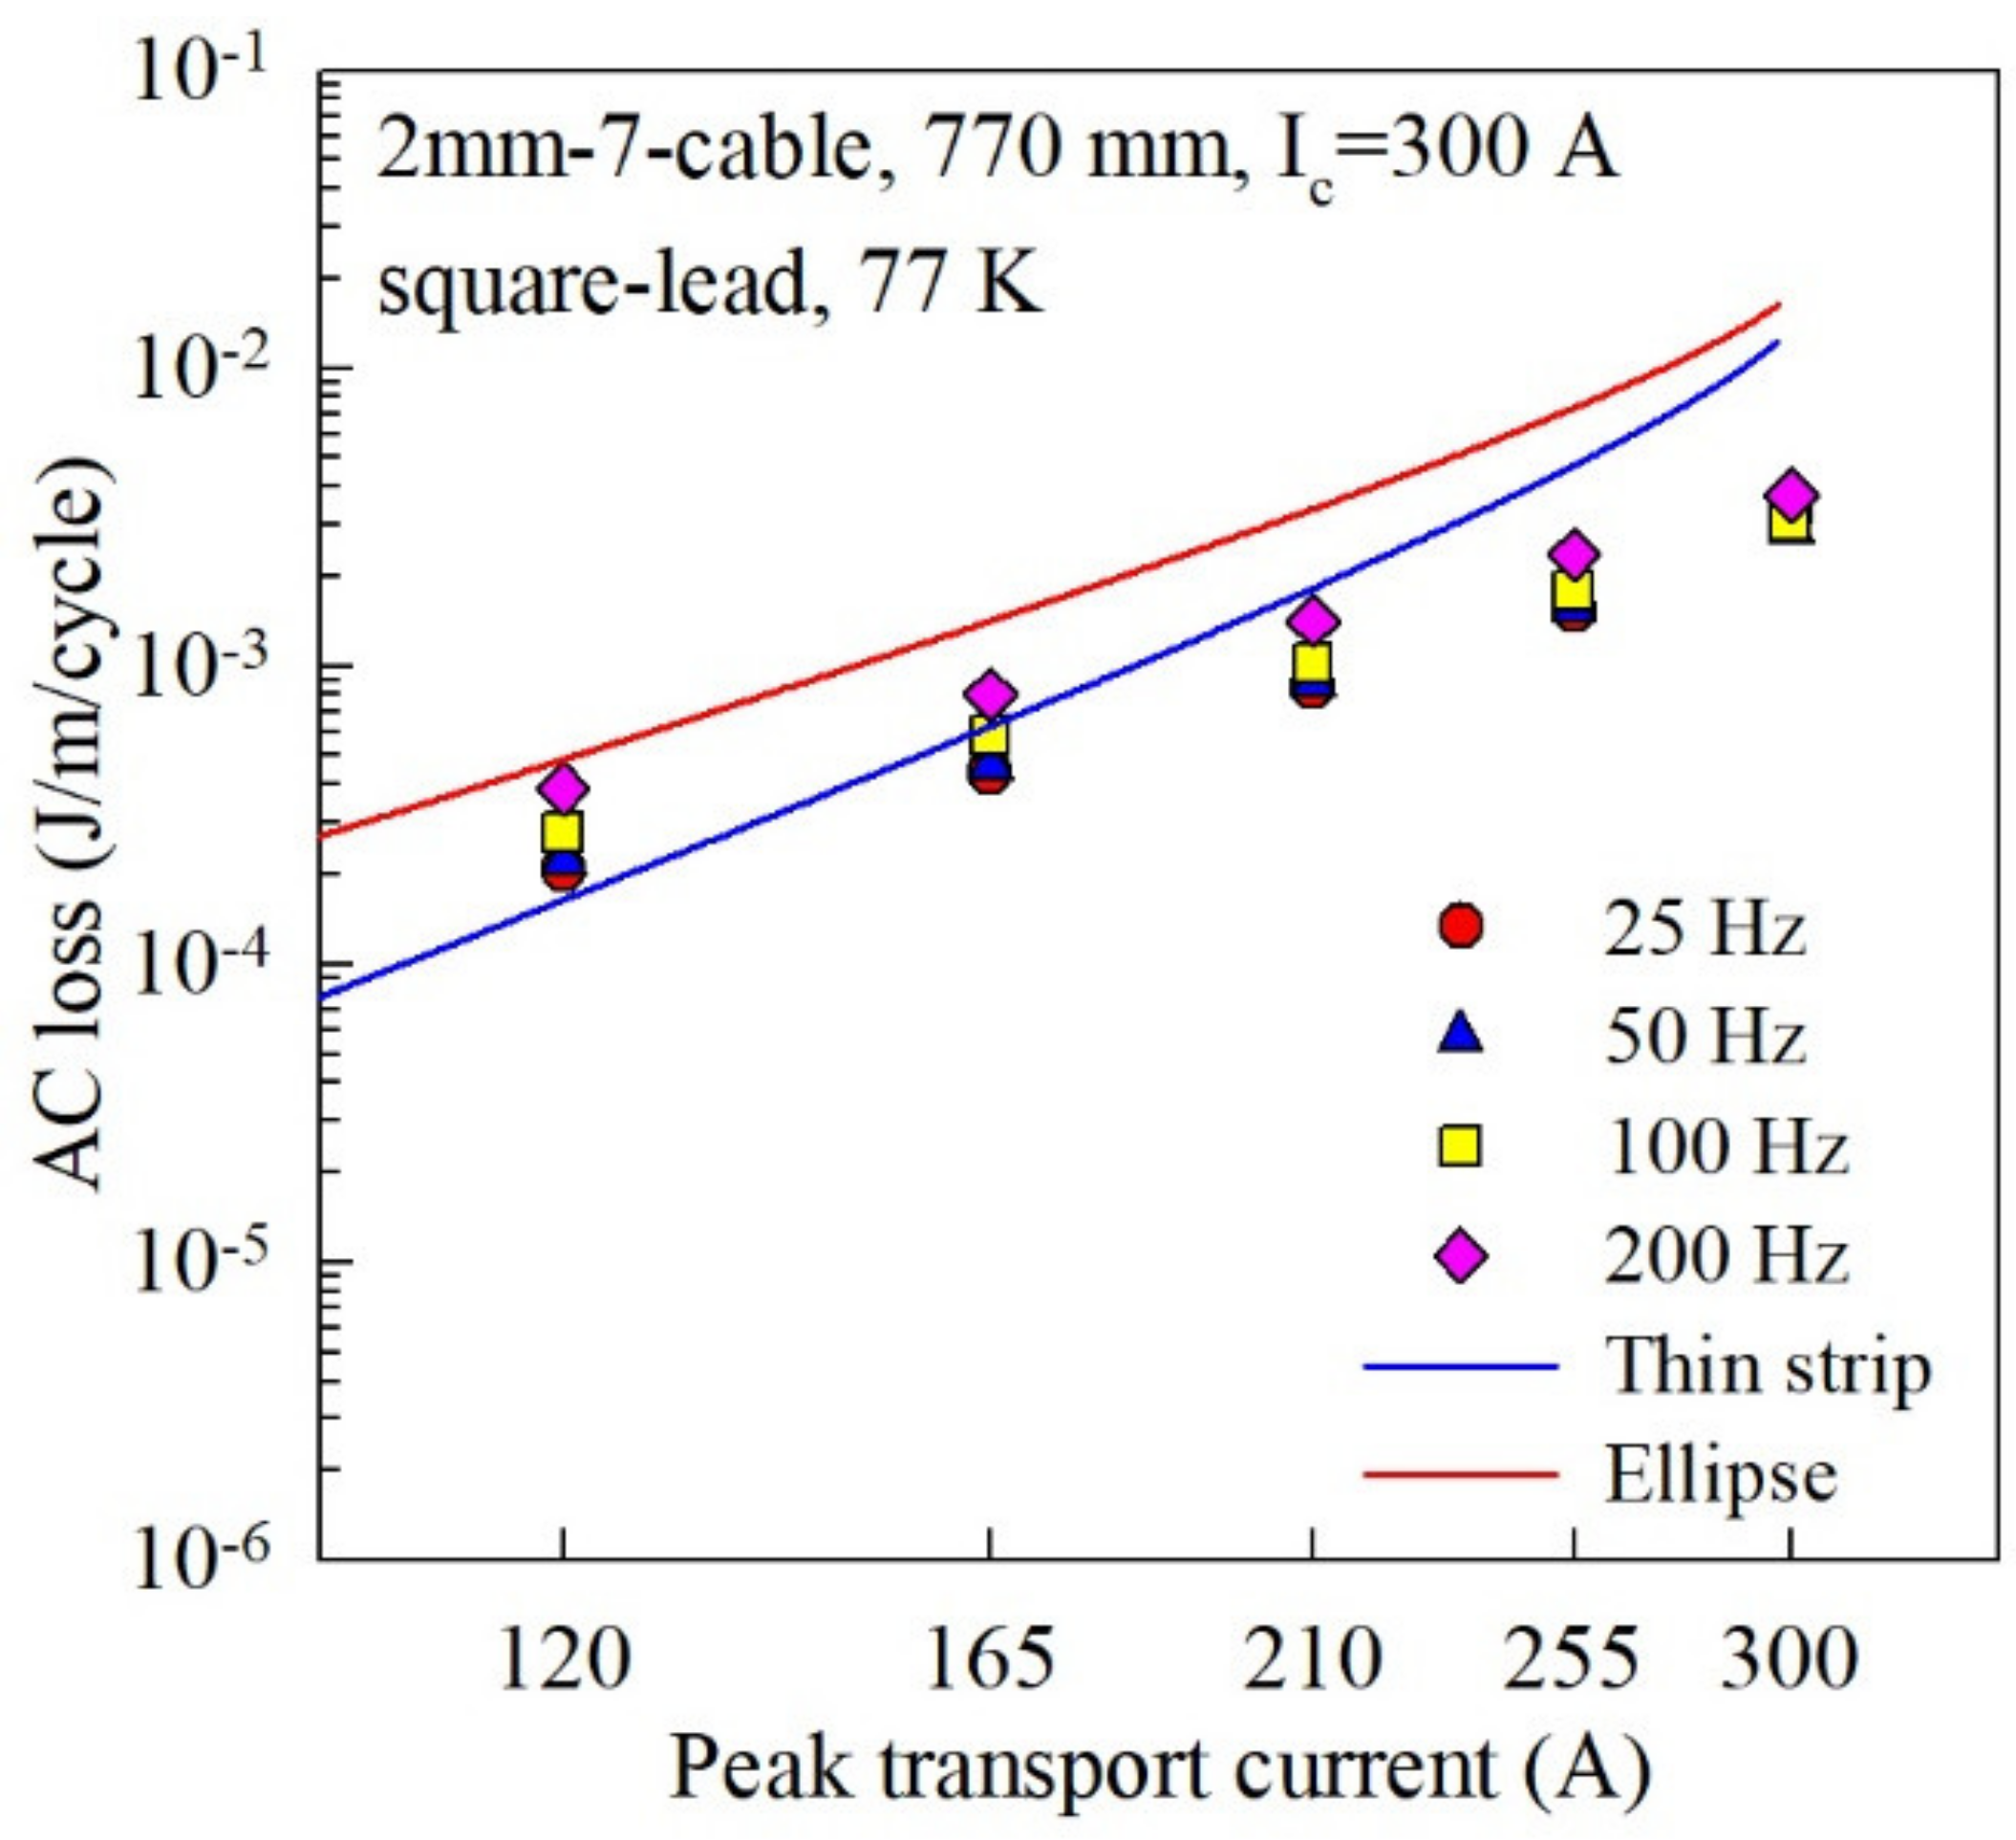
Next, the frequency dependence of the AC loss of the twisted cable was tested, and the measurement results are shown in Figure 8. It can be seen that the AC loss of the cable has obvious frequency dependence, and the value is approximately proportional to the current frequency, indicating that the eddy current loss accounts for a large proportion of the AC loss of the cable.

3. AC Loss Simulation

The electromagnetic field distribution inside the superconductor under the complex geometric model is often solved by the finite element method (FEM) [15]. FEM modeling can separate the different components of AC loss in HTS cables, which helps to judge the hysteresis loss in superconducting layers and eddy current loss in copper layers and further analyze the AC loss characteristics. The FEM modeling normally has three numerical methods, all named after the variables used in the partial differential formulations: one is the A-V formulation based on the magnetic vector potential, the second is the T-Ω formulation based on the current vector potential, and the third is the H-formulation based on the magnetic field. Considering the transition process of superconductors from the superconducting state to the normal conducting state, the nonlinear E-J relationship is often used concurrently with these formulations [16]. For the simulation of superconducting cables, the H-formulation is selected as the mathematical basis of the three-dimensional model, and its outstanding advantages are as follows:
(1)
For the A-V formulation and the T-Ω formulation, four variables are required for5three-dimensional problems, while the H-formulation has only three variables, namely Hx, Hy, and Hz. Fewer variables and no second derivative make the H-formulation less computationally intensive and faster than the other two formulations.
(2)
In many scenarios, the model needs to consider both the transport current and the background field. The H-formulation is most used in integral boundary conditions. The background field can be achieved by setting the boundary conditions of the H-formulation, while the transport current can be injected into the model by Ampere’s law. Furthermore, there is no need to distinguish vector potentials that could lead to computational errors.
(3)
The A-V formulation uses the electric field E to calculate the current density J, a small change in E will cause a dramatic change in J, which makes the formulation very unstable. The H-formulation is just the opposite, using the current density J to calculate the electric field E, successfully avoiding the non-convergence problem that may occur in the A-V formulation.
The H-formulation is essentially another representation of Maxwell’s formulations, which is equivalent to a quasi-static process for HTS. The specific formula is shown as follow:
× E = μ 0 μ r H t J = × H E n o r m = ρ Ω · J n o r m
In this model, the Cartesian three-dimensional coordinate system is used, and the magnetic field strength H is regarded as an independent variable, defined as H = H x , H y , H z T ; the current density J is defined as J = J x , J y , J z T , current density modulus value J n o r m = J x 2 + J y 2 + J z 2 T ; electric field intensity E is defined as E = E x , E y , E z T , the electric field strength modulus E n o r m = E x 2 + E y 2 + E z 2 . According to Ampere’s law, the relationship between J and H can be obtained as:
  J x = H z y H y z J y = H x z H z x J z = H y x H x y
For the second-generation HTS tapes used in this study, the nonlinear relationship between current and voltage can be described by the E-J characteristic:
E = E 0 J J c n
According to Faraday’s law, the relationship between E and H can be described as:
E z y H E y z = μ 0 μ r H x t E x z E z x = μ 0 μ r H y t E y x E x y = μ 0 μ r H y t
The entire model is divided into three subdomains: HTS domain, copper domain, and air domain. Different subdomains are assigned different resistivities:
ρ H T S = E c J c · J n o r m J c n 1 ρ C u = 1.97 × 10 9   Ω · m ρ A i r = 1   Ω · m
The influence of the external magnetic field and the pinning centers is important for the critical current [17,18]. In the complex HTS cables, each HTS tape is affected by the magnetic field produced by other tapes in the same cable. To simplify the calculation, the critical current in FEM model is set as the measured value of the cable instead of the initial value of the HTS tape. Therefore, the overall critical current of the HTS cable is considered here, and the measured value of the critical current has represented the self-field influence caused by the interaction of the HTS tapes.
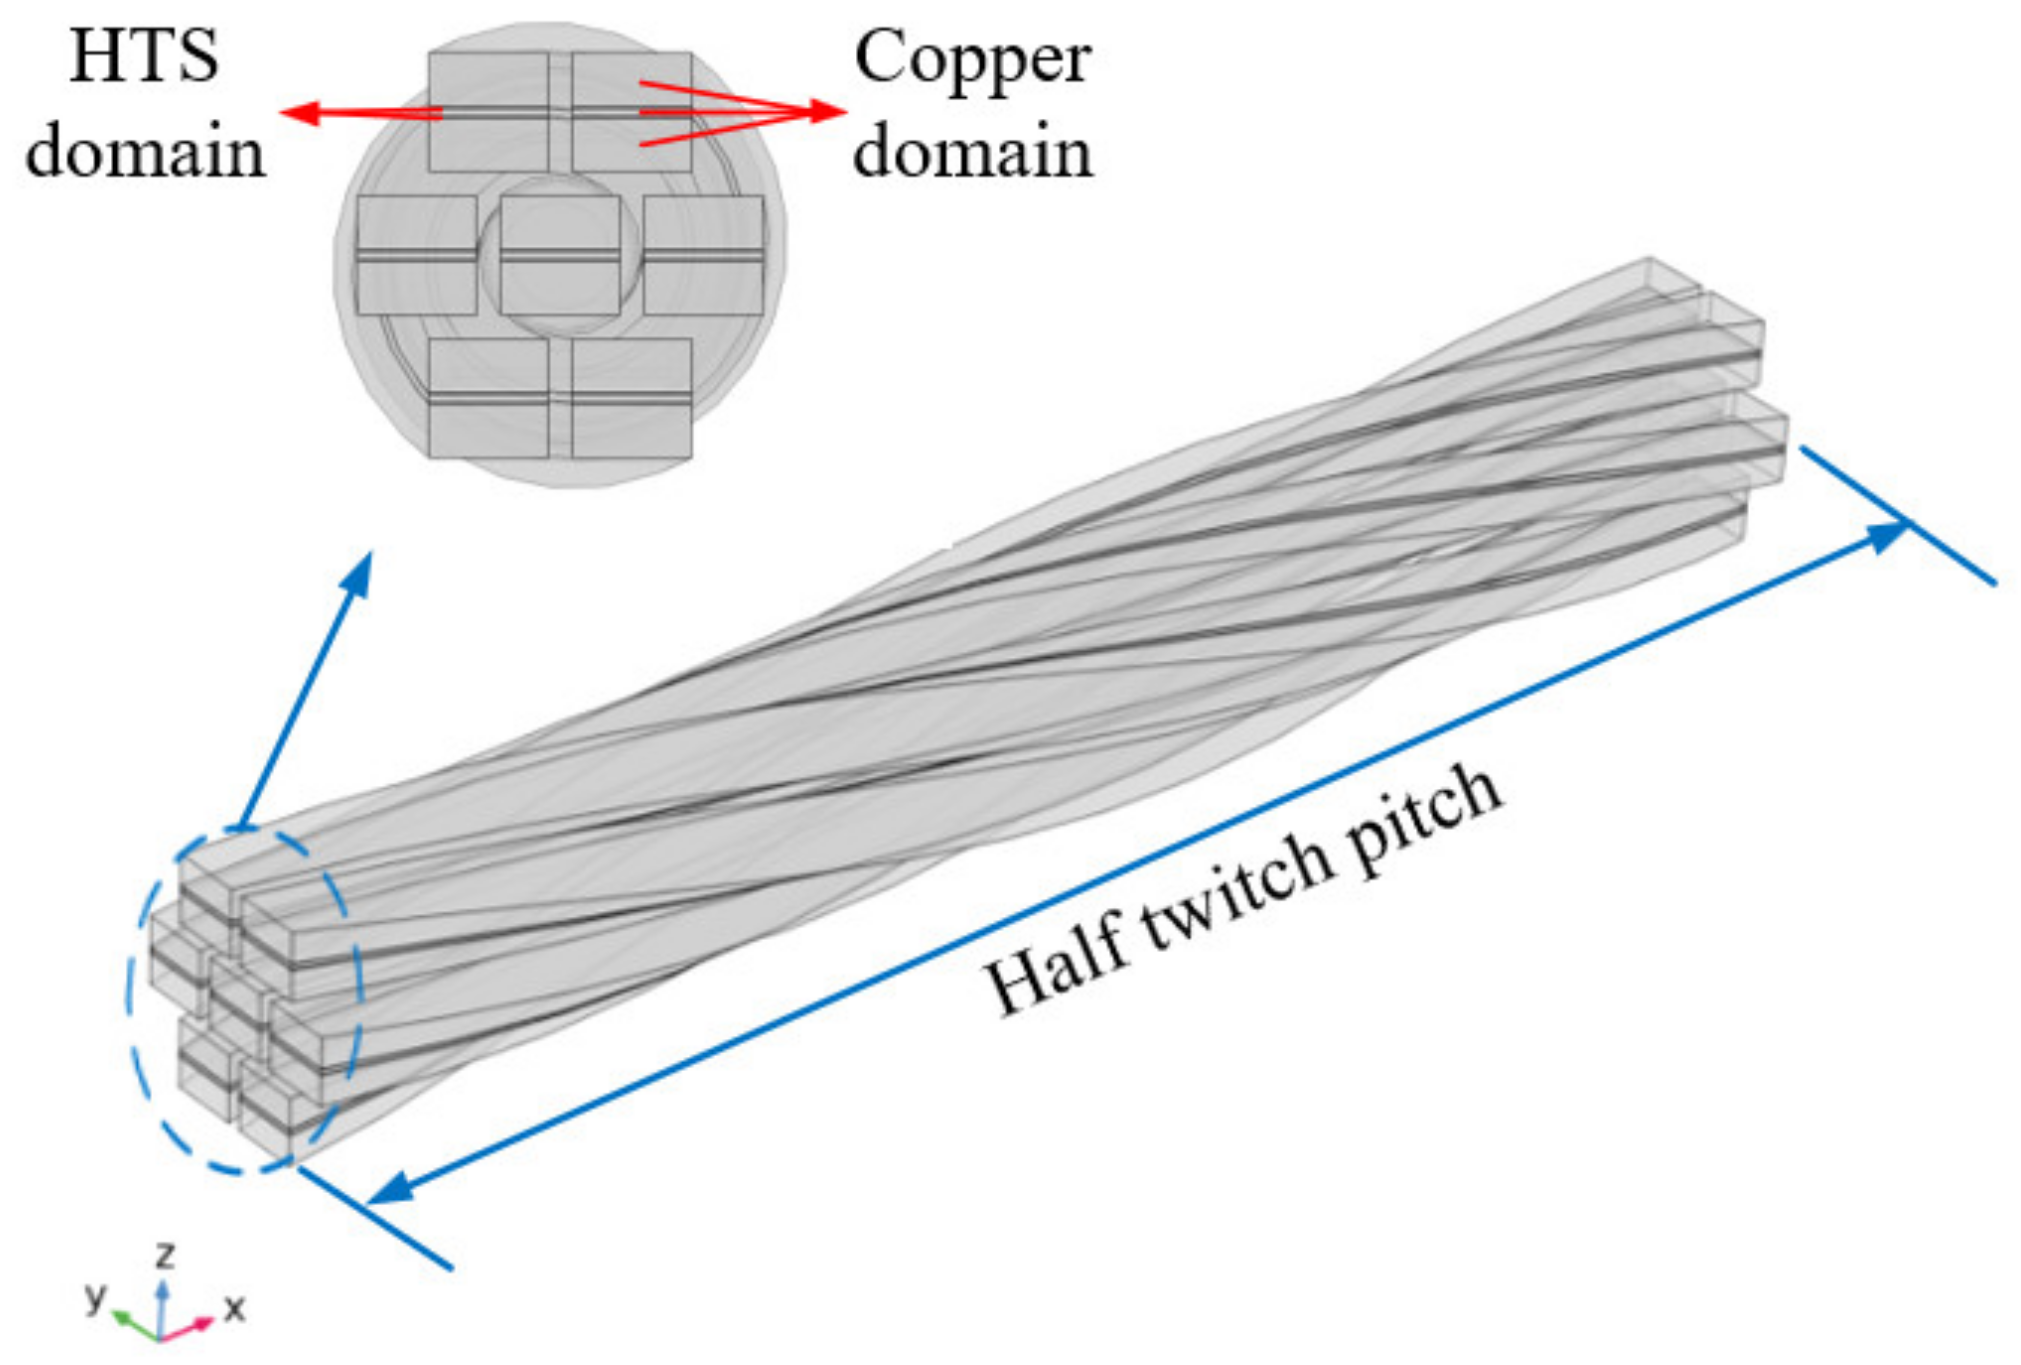
The geometric dimensions and parameters of 2 mm-7-cable are set as shown in Table 1 so as to correctly compare the difference between the experimental value and the simulation value. In order to speed up the calculation speed, some parameters have been optimized: the width of the HTS layer in the REBCO tape is 2 mm, while the thickness is only 1 μm. In COMSOL, such a large width-to-thickness ratio will lead to a surge in the number of meshes, increasing the calculation convergence difficulty. Thus, in this model, the thickness of the superconducting layer is increased by 10 times to 10 μm, which will not affect the accuracy of the calculation results and greatly speed up the calculation speed [19]. In addition, the cable length is set as the half-twist pitch, which also greatly reduces the degree of freedom and speed up the calculation. The substrate layer, copper layer, and other parts of the HTS tape except the superconducting layer are regarded as the copper domain, and the distance between the two superconducting layers is 150 μm. The 3D view and side view of the geometric model are shown in Figure 9.
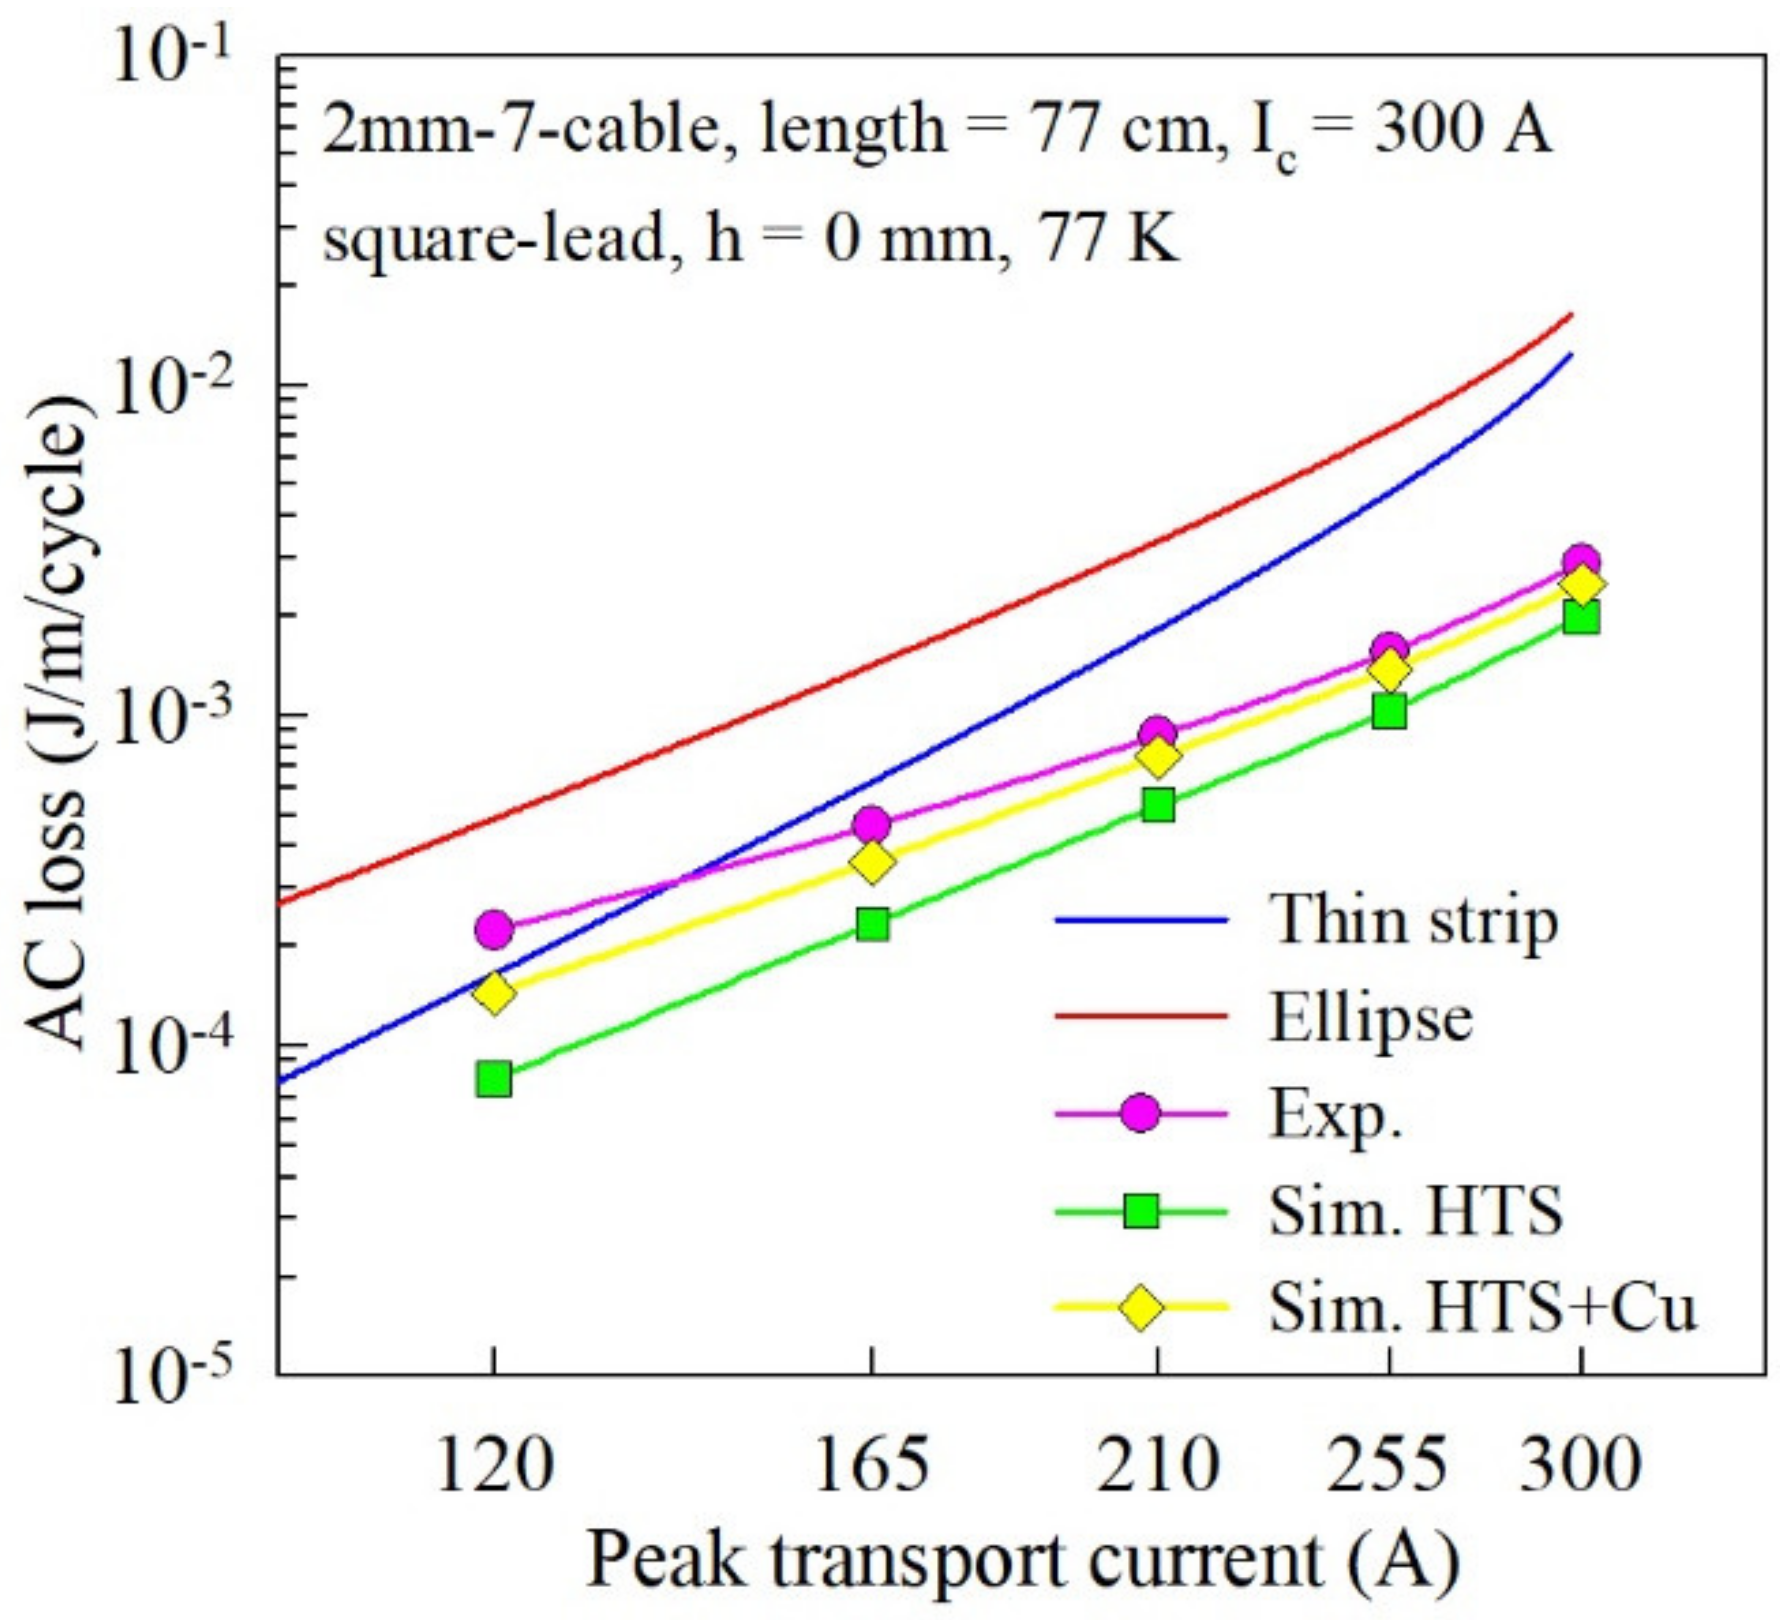
The solution adopts parametric sweep, and five groups of 50 Hz sinusoidal alternating currents pass through the cable, ranging from 0.4 times the critical current to one time the critical current, respectively 120 A, 165 A, 210 A, 255 A, and 300 A. The formula for calculating the AC loss is as follow:
Q A C   l o s s = 2 T / 2 T V   E · J   d V / L d t
Next, the simulated and experimental values of AC loss are compared, and the results are shown in Figure 10. The experimental value is a set of data with the voltage leads arranged in parallel, with a height of 0 mm and a current of 300 A. The parameters of the simulation are kept consistent with the experimental values. From the figure, we can see that the overall simulation value of AC loss is very close to the experimental value, which verifies the accuracy of the simulation. Since there are many copper layers in this cable, although there is almost no current flow in the copper layers, the loss of the copper layers also accounts for about 20% to 30% of the total loss. In future designs, as the overall proportion of the superconducting layer in the cable increases, the AC loss of the copper layers can be ignored. In addition, when the transport current of the twisted cable is greater than 0.4 times the critical current, compared with the theoretical value of the thin strip of the Norris model, the twisted structure significantly reduces the AC loss. The larger the transport current value, the greater the decrease in AC loss. When the current increases to the critical current, the AC loss is only 20% of the thin tape, which indicates the unique advantages of twisted cables in reducing AC loss.

4. Conclusions

In this paper, the AC loss characteristics of the HTS novel twisted cables are studied by both experimental and simulation methods. Firstly, the devices and steps of AC loss experimental measurement are introduced. Then, the experimental results are analyzed, and the following important conclusions are drawn: The parallel arrangement of the voltage leads and the spiral arrangement have little effect on the experimental measurement results of AC loss. The voltage-leads are close to the surface of the cable to measure the saturated magnetic flux of the sample is obtained. The AC loss of the cable has a certain frequency dependence, indicating that the eddy current loss accounts for a large proportion of the AC loss of the cable. The simulation value of AC loss is highly consistent with the experimental value, which proves the effectiveness and accuracy of the simulation. Compared with the thin strip model, the twisted structure can reduce the AC loss by up to 80%, highlighting the outstanding advantages of the twist structure in terms of AC loss. This paper successfully combined the CICC structure and 3S wire to form a second-stage HTS cable. The AC loss reduction is also confirmed as a promising result, which enhances the application potential of this cable design.

Author Contributions

Conceptualization, Z.L. and M.W.; methodology, Z.L. and M.W.; software, M.W.; validation, Z.L., M.W., and Z.Z.; formal analysis, Z.L. and M.W.; investigation, Z.L.; resources, Z.L.; data curation, Z.L.; writing—original draft preparation, M.W.; writing—review and editing, Y.L.; visualization, M.W.; supervision, Z.L. and K.R.; project administration, Z.L.; funding acquisition, Z.L. All authors have read and agreed to the published version of the manuscript.

Funding

This work was supported by the National Nature Science Foundation of China under grant No. 52077134.

Data Availability Statement

Not applicable.

Conflicts of Interest

The authors declare no conflict of interest.

References

  1. Martucciello, N.; Giubileo, F.; Grimaldi, G.; Corato, V. Introduction to the focus on superconductivity for energy. Supercond. Sci. Technol. 2015, 28, 070201. [Google Scholar] [CrossRef]
  2. Wu, Y.; Zhao, Y.; Han, X.; Jiang, G.; Shi, J.; Liu, P.; Khan, M.Z.; Huhtinen, H.; Zhu, J.; Jin, Z.; et al. Ultra-fast growth of cuprate superconducting films: Dual-phase liquid assisted epitaxy and strong flux pinning. Mater. Today Phys. 2015, 18, 100400. [Google Scholar] [CrossRef]
  3. Takayasu, M.; Chiesa, L.; Bromberg, L.; Minervini, J.V. HTS twisted stacked-tape cable conductor. Supercond. Sci. Technol. 2012, 25, 014011. [Google Scholar] [CrossRef]
  4. Van der Laan, D.C.; Lu, X.F.; Goodrich, L.F. Compact GdBa2Cu3O7−δ coated conductor cables for electric power transmission and magnet applications. Supercond. Sci. Technol. 2011, 24, 042001. [Google Scholar] [CrossRef]
  5. Goldacker, W.; Frank, A.; Heller, R.; Schlachter, S.I.; Ringsdorf, B.; Weiss, K.-P.; Schmidt, C.; Schuller, S. ROEBEL assembled coated conductors (RACC): Preparation, properties and progress. IEEE Trans. Appl. Supercond. 2007, 17, 3398–3401. [Google Scholar] [CrossRef]
  6. Wolf, M.J.; Fietz, W.H.; Bayer, C.M.; Schlachter, S.I.; Heller, R.; Weiss, K.-P. HTS CroCo: A stacked HTS conductor optimized for high currents and long-length production. IEEE Trans. Appl. Supecond. 2016, 26, 6400106. [Google Scholar] [CrossRef]
  7. Li, Y.; Wang, Y.; Miao, J.; Shi, C.; Ju, P.; Huang, P.; Xue, J.; Hasegawa, T. Investigation on critical current properties of quasi-isotropic strand made from coated conductor. IEEE Trans. Appl. Supercond. 2015, 25, 6600805. [Google Scholar] [CrossRef]
  8. Pi, W.; Ma, S.; Kang, Q.; Liu, Z.; Meng, Y.; Wang, Y. Study on Mechanical Properties of Quasi-Isotropic Superconducting Strand Stacked by 2-mm-Wide REBCO and Copper Tapes. IEEE Trans. Appl. Supecond. 2020, 30, 6600105. [Google Scholar] [CrossRef]
  9. Li, Z.; Hu, D.; Zhang, L.; Xie, Z.; Sun, L.; Liu, B.; Hong, Z.; Jin, Z.; Ryu, K. Development of a Novel Soldered-Stacked-Square (3S) HTS Wire Using 2G Narrow Tapes with 1 mm Width. IEEE Trans. Appl. Supercond. 2017, 27, 6600904. [Google Scholar] [CrossRef]
  10. Guo, Z.; Qin, J.; Lubkemann, R.; Wang, K.; Jin, H.; Xiao, G.; Li, J.; Zhou, C.; Nijhuis, A. AC loss and contact resistance in highly flexible rebco cable for fusion applications. Superconductivity 2022, 2, 100013. [Google Scholar] [CrossRef]
  11. Bruno, D.; Berger, K.; Ivanov, N. Characterization of High-Temperature Superconductor Bulks for Electrical Machine Application. Materials 2021, 14, 1636. [Google Scholar] [CrossRef]
  12. Xia, Y.; Song, Y.; Ma, T.; Zheng, J.; Liu, H.; Liu, F.; Song, M. Design and Performance Tests of a Fault Current-Limiting-Type Tri-Axial HTS Cable Prototype. Electronics 2022, 11, 1242. [Google Scholar] [CrossRef]
  13. Wang, M.; Qi, H.; She, M.; Zhang, L.; Ryu, K.; Li, Z.; Hong, Z.; Jin, Z. Fabrication and Critical Current Evaluation for HTS Twisted Cables Consisting of Soldered-Stacked-Square (3S) Wires. IEEE Trans. Appl. Supercond. 2021, 31, 4804004. [Google Scholar] [CrossRef]
  14. Ciszek, M.; Ashworth, S.P.; James, M.P.; Glowacki, B.A.; Campbell, A.M.; Garre, R.; Conti, S. Self-field AC losses and critical currents in multi-tube Ag-Bi-2223 conductors. Supercond. Sci. Technol. 1996, 9, 379–384. [Google Scholar] [CrossRef]
  15. Krzysztof, K.; Kampik, M.; Stȩpień, M. Characterization of high-temperature superconducting tapes. IEEE Trans. Instrum. Meas. 2019, 69, 2959–2965. [Google Scholar] [CrossRef]
  16. Zhang, M.; Coombs, T.A. 3D modeling of high-Tc superconductors by finite element software. Supercond. Sci. Technol. 2011, 25, 015009. [Google Scholar] [CrossRef]
  17. Patrick, P.; Sieger, M.; Ottolinger, R.; Lao, M.L.; Eisterer, M.; Meledin, A.; Van Tendeloo, G.; Haenisch, J.; Holzapfel, B.; Schultz, L.; et al. Influence of artificial pinning centers on structural and superconducting properties of thick YBCO films on ABAD-YSZ templates. Supercond. Sci. Technol. 2018, 31, 044007. [Google Scholar] [CrossRef]
  18. Krzysztof, K.; Grilli, F.; Kario, A.; Godfrin, A.; Zermeno, V.M.R.; Stepien, M.; Kampik, M. Length Uniformity of the Angular Dependences of I c and n of Commercial REBCO Tapes with Artificial Pinning at 77 K. IEEE Trans. Appl. Supercond. 2018, 29, 8000309. [Google Scholar] [CrossRef]
  19. Wang, M.; Li, Z.; Zhang, Y.; Sun, C.; Dong, F.; Pan, Y.; Yao, L.; Hong, Z.; Jin, Z. Three-Dimensional Numerical Study on Transport AC Loss of Soldered-Stacked-Square-Twisted (3S-T) Wire. IEEE Trans. Appl. Supercond. 2019, 29, 5900105. [Google Scholar] [CrossRef]
Figure 1. Conceptual illustration of multistage cable structure using 3S wires.
Energies 15 07454 g001
Figure 2. Cross-section view of 2 mm-7-cable and structure of 3S (2s + 10c)-wire with 2 mm width.
Energies 15 07454 g002
Figure 3. AC loss measurement system. (a) Schematic diagram; (b) Actual picture.
Energies 15 07454 g003
Figure 4. Schematic diagram of two voltage lead arrangements. (a) Square-lead arrangement; (b) Spiral-lead arrangement.
Energies 15 07454 g004
Figure 5. Comparison of AC loss of 2 mm cable under two voltage−lead arrangements. (a) AC loss values when the distance between the voltage−leads and the cable sample is 0 mm and the frequency is 25 Hz; (b) AC loss values when the distance between the voltage−leads and the cable sample is 15 mm and the frequency is 50 Hz.
Energies 15 07454 g005
Figure 6. Schematic diagram of voltage-lead height of 2 mm-7-cable.
Energies 15 07454 g006
Figure 7. Dependence of height of voltage-lead configuration on AC loss for 2 mm−7−cable.
Energies 15 07454 g007
Figure 8. Effect of frequency on AC loss of 2 mm−7−cable.
Energies 15 07454 g008
Figure 9. Three-dimensional geometric model of 2 mm-7-cable.
Energies 15 07454 g009
Figure 10. Comparison between experimental and simulation values of AC loss of 2 mm−7−cable.
Energies 15 07454 g010
Table 1. Specifications of HTS tape, 3S (2s + 10c)-wire, and 2 mm-7-cable.
HTS tapeWidth and thickness2.0 mm × 70 μm
Thickness of superconducting layer~1.3 μm
Thickness of silver layers~1 μm
Thickness of substrate layer (plus buffer)~10 μm
Thickness of copper plating layer, each side90 A @ 77 K
Critical current of HTS tapes30 A ± 5 A
3S (2 + 10c)-wireWidth and thickness2.09 mm × 1.85 mm
Number of HTS tapes2
Number of copper tapes10
Width and thickness of copper tape2.00 mm × 150 μm
2mm-7-cableDiameter9.7 mm
Critical current, self-field, average300 A @ 77 K
Twist pitch100 mm
Number of 3S wires7
Publisher’s Note: MDPI stays neutral with regard to jurisdictional claims in published maps and institutional affiliations.