Article

Numerical Simulation of Tail Over-Fire Air Supply of a Grate Biomass Boiler

1
Shandong Electric Power Engineering Consulting Institute Co., Ltd., Jinan 250061, China
2
School of Energy and Power Engineering, Shandong University, Jinan 250061, China
*
Authors to whom correspondence should be addressed.
Energies 2022, 15(20), 7664; https://doi.org/10.3390/en15207664
Submission received: 26 July 2022 / Revised: 6 October 2022 / Accepted: 11 October 2022 / Published: 17 October 2022
(This article belongs to the Special Issue Advances in Energy Infrastructure Construction Technology)

Abstract

:
By taking a 130 t/h water-cooled grate biomass boiler as the research object, the ANSYS software is applied to simulate the effects of the tail burnout air’s incidence angle, wind speed, and pipe diameter on flow field distribution in the furnace, the movement of unburned carbon particles at the tail of the grate under cold operation. The influence rules of the incidence angle, pipe diameter, and wind speed of the tail burnout air on the combustion in the furnace and the movement of the tail particles were obtained. The results show that the setting of burnout air at the tail of the grate can better organize the air flow field at the grate tail, change the particle distribution, prevent small density particles from directly falling into the ash hopper, and prolong the residence time of particles on the grate. Under the study conditions, with an increase in the outlet velocity and the pipe diameter of the tail burnout air, as the movement degree and the burnout degree of grate particles increase, the boiler efficiency increases. With an increase in the incidence angle of the tail burnout air, the flow field in the furnace and the reduction ratio of the tail particles increases at first and then decreases, and the optimal incidence angle is 11–13°.

1. Introduction

Under the press of greenhouse gas emission effects and the escalating global energy demand, the study of biomass energy is currently receiving increased interest. Biomass is a kind of renewable energy with low pollution, a wide distribution, and a rich amount. It is regarded as one of the most potential and reliable renewable energy sources for future energy development [1]. Due to the adjustment of the global power structure, the proportion of renewable energy in new energy will increase from 25% to 40% by 2040 [2]. Biomass fuel is diversified, and can be converted into solid, liquid, and gas fuels. So far, the proportion of biomass energy has reached to 10–14% of the total global energy supply [3]. Meanwhile, due to the diversification of the biomass’s composition, the combustion stability and combustion efficiency of biomass still need to be improved [4].
Currently, the most widely used biomass direct combustion technology in China is mainly fluidized bed combustion and grate furnace combustion [5]. The grate-fired boiler has the best adaptability, the least preparation requirements, and the highest efficiency; therefore, it has become the most popular technology among industrial boilers, and an effective process for the large-scale and efficient utilization of biomass fuel [6].
In recent years, numerical simulation has played an important role in the study of combustion characteristics and optimization design for industrial boilers. Zhang Jinhui [7] obtained flow field distribution on the grate through numerical simulation, and found that the moisture content, temperature, and density of particles on the grate had obvious faults at the junction of the drying zone and the combustion zone. Sun [8,9] and others have explored the change of bed combustion when the fuel particle diameter changes, by comparing the changes in temperature and gas emissions. Gómez [10] explored a transient model combining the CFD method and a set of Eulerian variables to simulate the biomass combustion through particle drop. The result found that the model can predict numerous processes that occur during the combustion of the solid phase, and the accuracy of the model is verified by experimental data. Kær [11] employed CFD (computational fluid dynamics) analysis in a straw burning grate furnace and found that grate combustion plays a key role in the whole process. The uneven mixing of gas components in the furnace will lead to a high concentration of CO in biomass combustion, and the unburned carbon content in fly ash is relatively high. Zhou Anqi [12] built a three-dimensional CFD furnace model according to industrial scale grate boilers. Different ratios of air supply were simulated and analyzed in this model. The results found that boiler thermal efficiency is proportional to the proportion of primary air when the primary air’s ratio of the total air supply is between 43% and 50%. Meanwhile, the conversion rate of fuel has a relationship with the changing primary air volume. Shang Yuwei [13] et al. studied the influence of the primary air rate of a biomass grate furnace on bed combustion, and found that increasing the air supply in the fixed carbon combustion section is beneficial for shortening the combustion time and reducing the carbon content of ash. Liu Ruimei [14] et al. optimized and analyzed the factors of the grate furnace biomass, which are the lower secondary air operation and shutdown form, upper secondary air layout form, velocity, and others. It was found that increasing lower secondary air is beneficial for improving the slagging of the furnace arch. Adopting the opposed arrangement of the upper secondary air or increasing the secondary air speed can promote the flue gas mixing and improve the flue gas residence time, so as to improve the combustion efficiency. Lu Yanning [15] et al. studied the combustion of secondary air and recycled flue gas under the front and rear walls under different mixing ratios, and found that the flue gas recirculation air distribution mode can improve the combustion uniformity and burnout rate, and can effectively reduce the generation of nitrogen oxides.
At present, the research on the air distribution optimization of the biomass grate boiler mostly focuses on the relevant influencing factors of primary and secondary air. However, the new burnout air at the tail of the grate has not been involved. This study is motivated to employ the numerical model for evaluating the effect of adding grate tail burnout air for cold flow field on a grate boiler. The effect of different tail over-fired air supply parameters, including outlet velocity, pipe diameter, and incidence angle are investigate and optimized. Based on the comprehensive simulation results, the optimal operation angle of the over-fired tail air is recommended for the boiler under study. This study can provide theoretical guidance for the engineering transformation and efficient operation of a biomass boiler.

2. Methodology

2.1. Physical Properties of the Grate Boiler

This paper takes a 130 t/h grate biomass boiler as the research object. The furnace section size (Width × Depth) is 6.480 m × 9.2 mm. The drum center line is 23.9 mm. The primary air enters the furnace through a small hole on the furnace drainage wall through the primary air chamber below the grate. The secondary air is arranged on the front and back walls of the furnace throat. The secondary air on the front wall is divided into upper, middle, and lower levels. The biomass fuel is mainly Chinese fir leftovers, and the auxiliary fuels include pine bark, sawdust, bamboo, and other agricultural and forestry wastes. The design biomass fuel characteristics are in Table 1. The main design parameters of the grate boiler are in Table 2.
Figure 1 shows the three-dimensional physical model of the furnace according to the actual size of the boiler structure. The overall grid division of the furnace adopts the structured grid division method, and the secondary air at the front and rear walls and the exhaust air nozzle at the tail of the grate are locally densified. This paper simulates the flow field under the original working condition, establishes 2.1 million, 2.99 million, and 4.11 million grid models, respectively, for simulation, and compares them with the actual operation data of the boiler. Finally, the number of grids is determined to be 2.99 million.

2.2. Numerical Model

The description of gas flow in the whole furnace is based on the solution of mass conservation equation and momentum conservation equation. The mass conservation equation and momentum conservation equation are separately presented in equations as the following:
ρ t + ρ v = 0
t ρ v + ρ v v = p + τ = + ρ g + F
where, p is static pressure, ρ g is gravitational volume, F is external volume force, and τ = are stress tensors.
This is because the simulation area of the furnace is large, and the internal fluid flow is very strong. So, the standard k-epsilon model is selected for calculation.
t ρ k + x i ρ k u i = x j μ + μ t σ k k x j + G k + G b ρ ε
t ρ ε + x i ρ ε u i = x j μ + μ t σ ε ε x j + C 1 ε ε k G k + C 3 ε G b C 2 ε ρ ε 2 k
where, C2, C1z, and C3z are constants, σκ and σε are turbulent Prandtl numbers of k and ε , and Gk and Gb are turbulent kinetic energy due to average velocity gradient and buoyancy.
In this paper, the gas phase combustion reaction in the furnace adopts the dense discrete phase model. The tracking of solid particles adopts the Lagrangian discrete phase model regarding the gas phase as a continuous medium. The contact force between the particles and grate is solved by the Hertz-Mindlin non-sliding model, and the interphase drag model adopts the Gidaspow model. The turbulence model in the furnace adopts standard K-ε Model. In the model, the second-order discrete format is used for the calculation of each physical quantity, and the standard wall function is used for each wall.

2.3. Assumptions and Boundaries

In this paper, the finite volume method is used for discretization. The simple algorithm is used for the pressure velocity coupling algorithm. The second-order discrete format is used for the calculation of each physical quantity. Each solid wall was analyzed using the method of the standard wall function. The other assumptions and boundaries of the model are as the following:
(1)
In the original air distribution system working condition (0), the primary air ratio is 30%; the front wall upper, middle, and lower secondary air speeds are, separately, 32 m/s, 50 m/s, and 36 m/s.
(2)
The back wall secondary air speed is 57 m/s.
(3)
Model port setting: The flow inlet: the lower primary air outlet of the grate.
(4)
The speed inlet: each secondary air outlet of the furnace; the pressure outlet: furnace outlet.
(5)
The total air volume of the air distribution system is constant.
(6)
The maximum ratio of burnout air is limited at 7.3%.
In order to reduce the carbon content in the slag and to improve the combustion efficiency of the boiler, an exhaust air distribution system is installed at the tail of the furnace row. The air distribution system in this paper consists of the primary air system, secondary air system, and tail burnout air system. The tail burnout air is exhausted from the secondary air and is under the condition of a certain total air volume. When the number of burnout air pipes is fixed, the outlet velocity and the pipe diameter of the burnout air will affect its proportion in the total air volume. At the same time, the changes of these two factors will also affect the flow field in the furnace and the movement of unburned carbon particles on the grate tail. Therefore, the original and the air distribution system with trail burnout air of different proportions are separately simulated and compared in this paper. The specific air distribution proportion is shown in Table 3.

3. Analysis and Discussion

In order to investigate the influence of outlet velocity, pipe diameter, and incident angle of the exhaust air at the tail of the furnace on the cold flow field in the furnace; and the movement of unburned carbon particles on the grate tail, the cold flow field distribution in the furnace and the position distribution of unburned carbon particles on the tail grate were simulated and analyzed by changing these three factors.

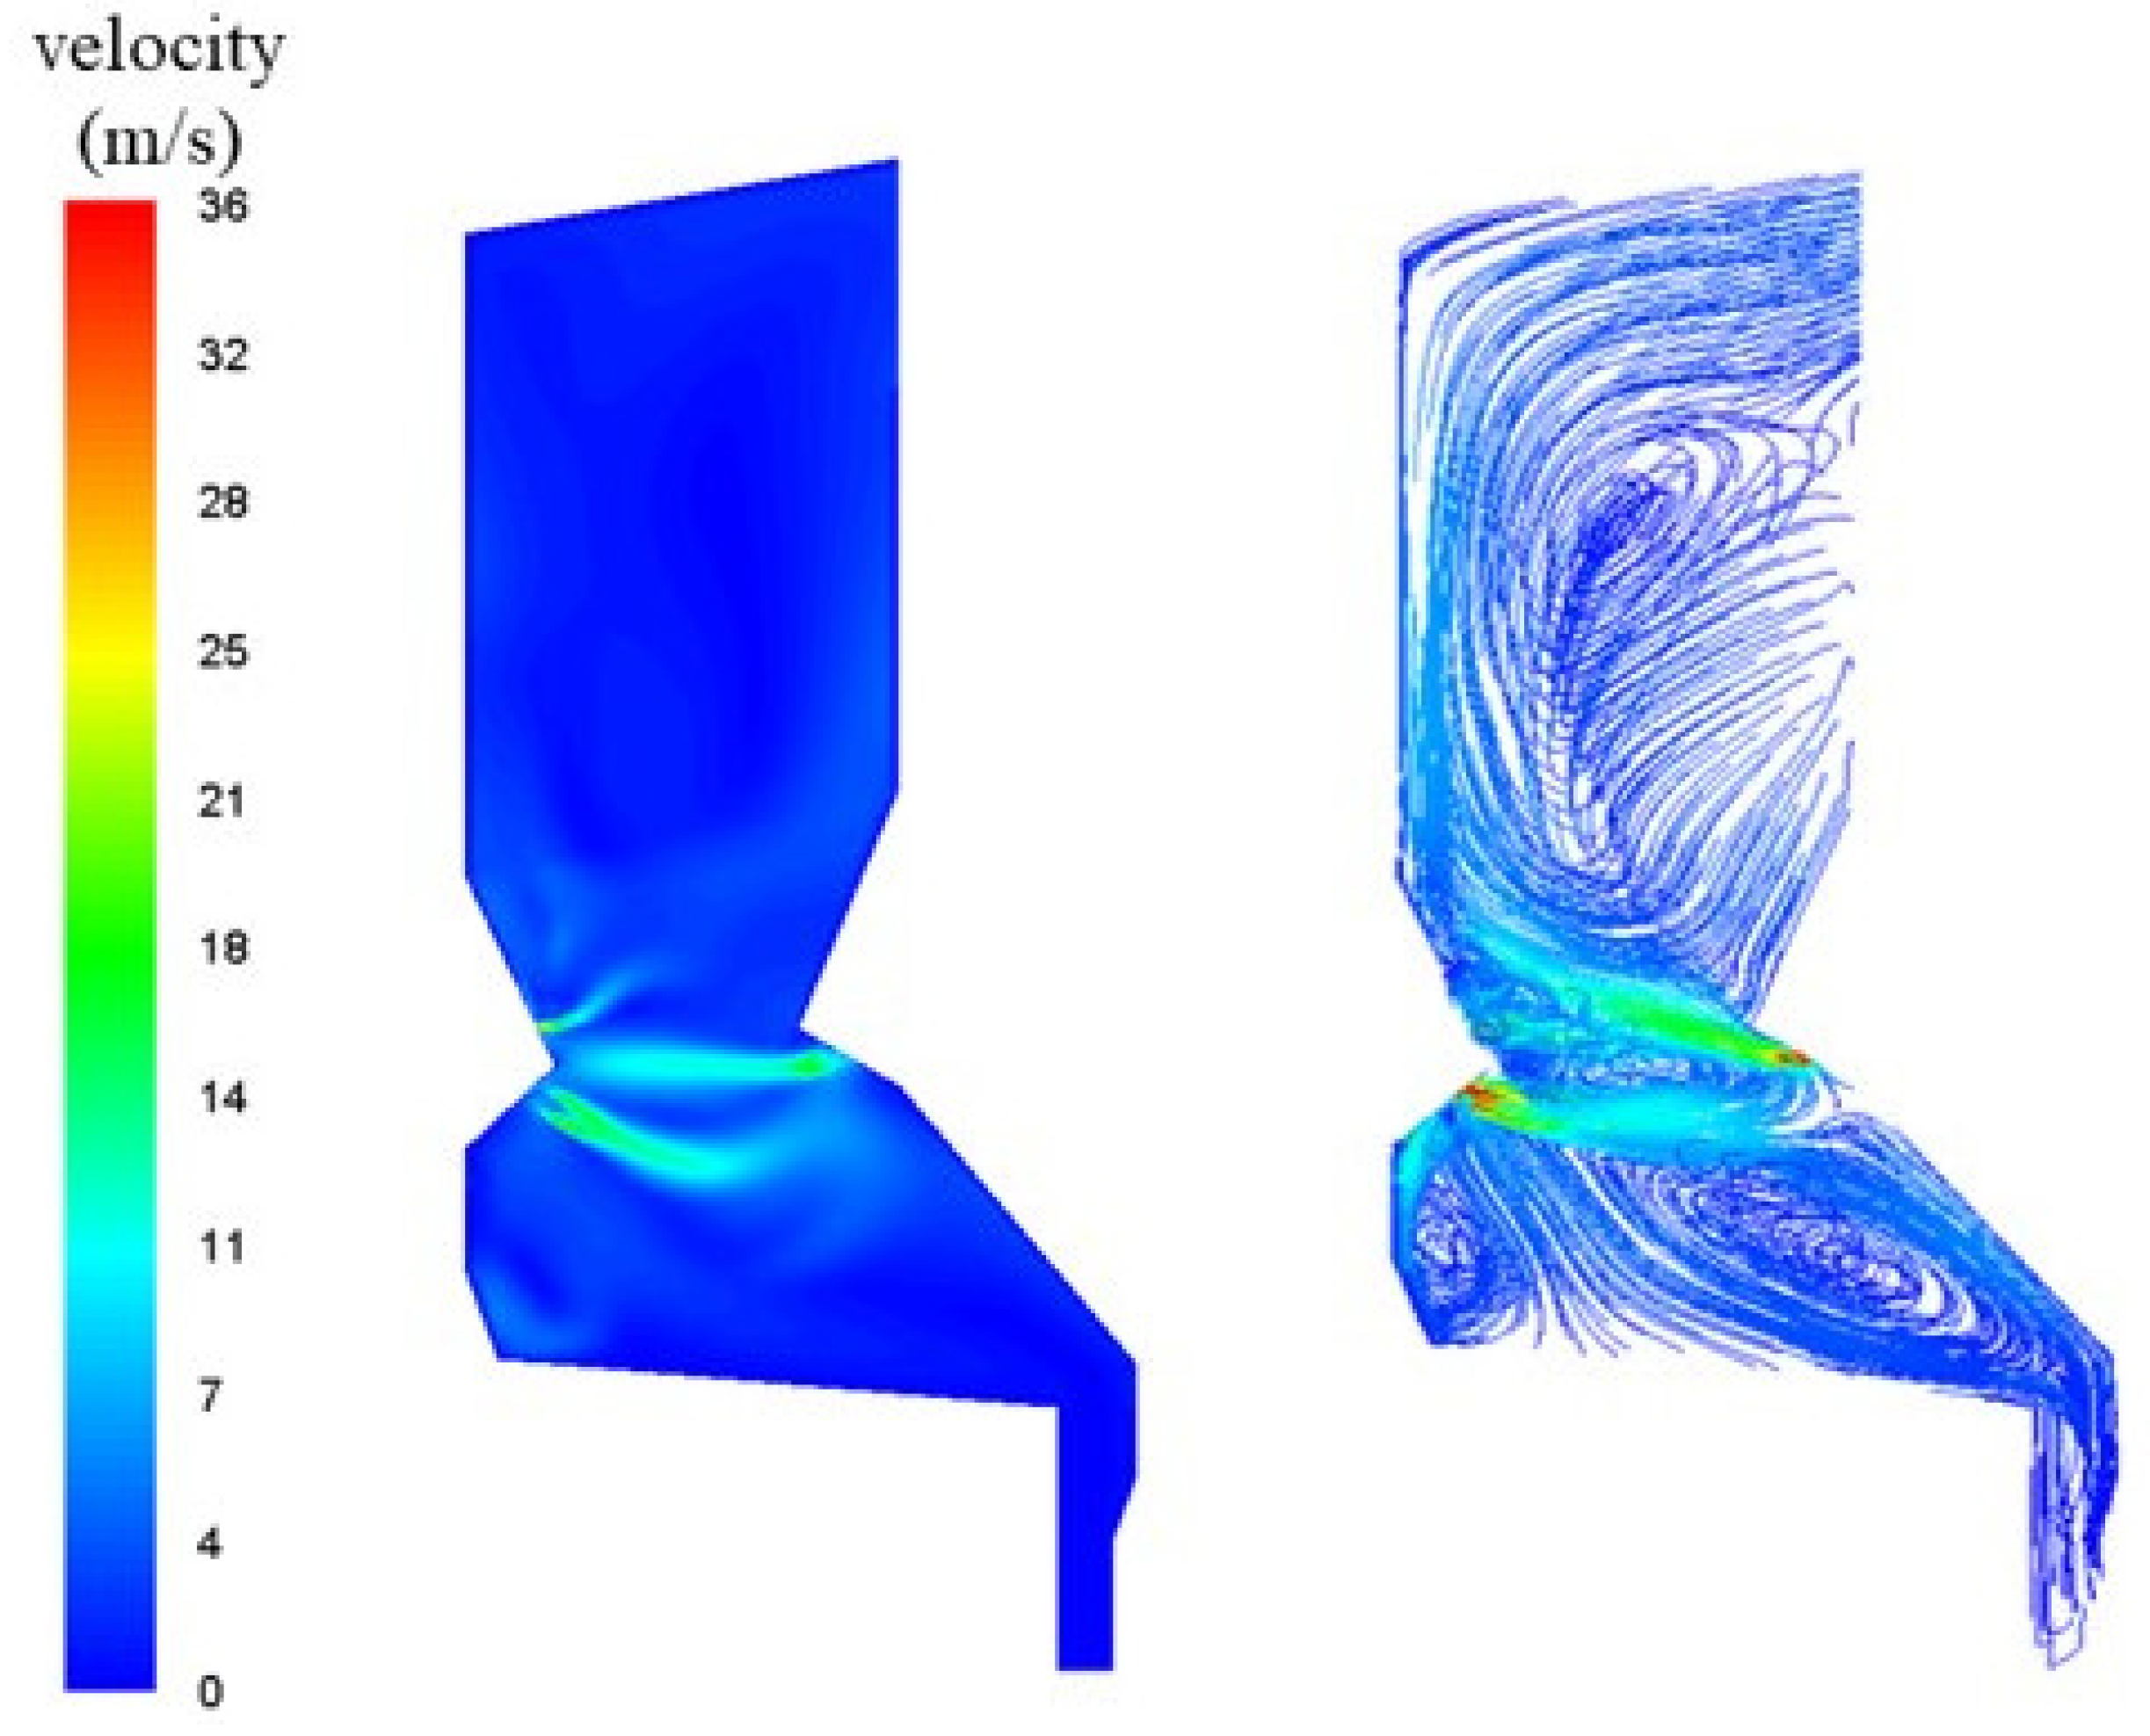
3.1. The Air Distribution System without Tail Burnout Air

Figure 2 and Figure 3 show the velocity distribution of the furnace center section and the grate tail section in the 0 working condition. It can be seen from the Figure 2 and Figure 3 that the high-speed secondary air jet from the front and back walls does not change significantly within a certain distance after entering the furnace. After the flow field in the furnace is stable, an obvious vortex is formed near the throat. On the lower right side of the furnace, the air velocity at the grate tail is very slow; the turbulence degree and the turbulence intensity is very small, which is not conducive to the combustion of unburned carbon at the grate tail. This is the main reason for the high carbon content in the slag.

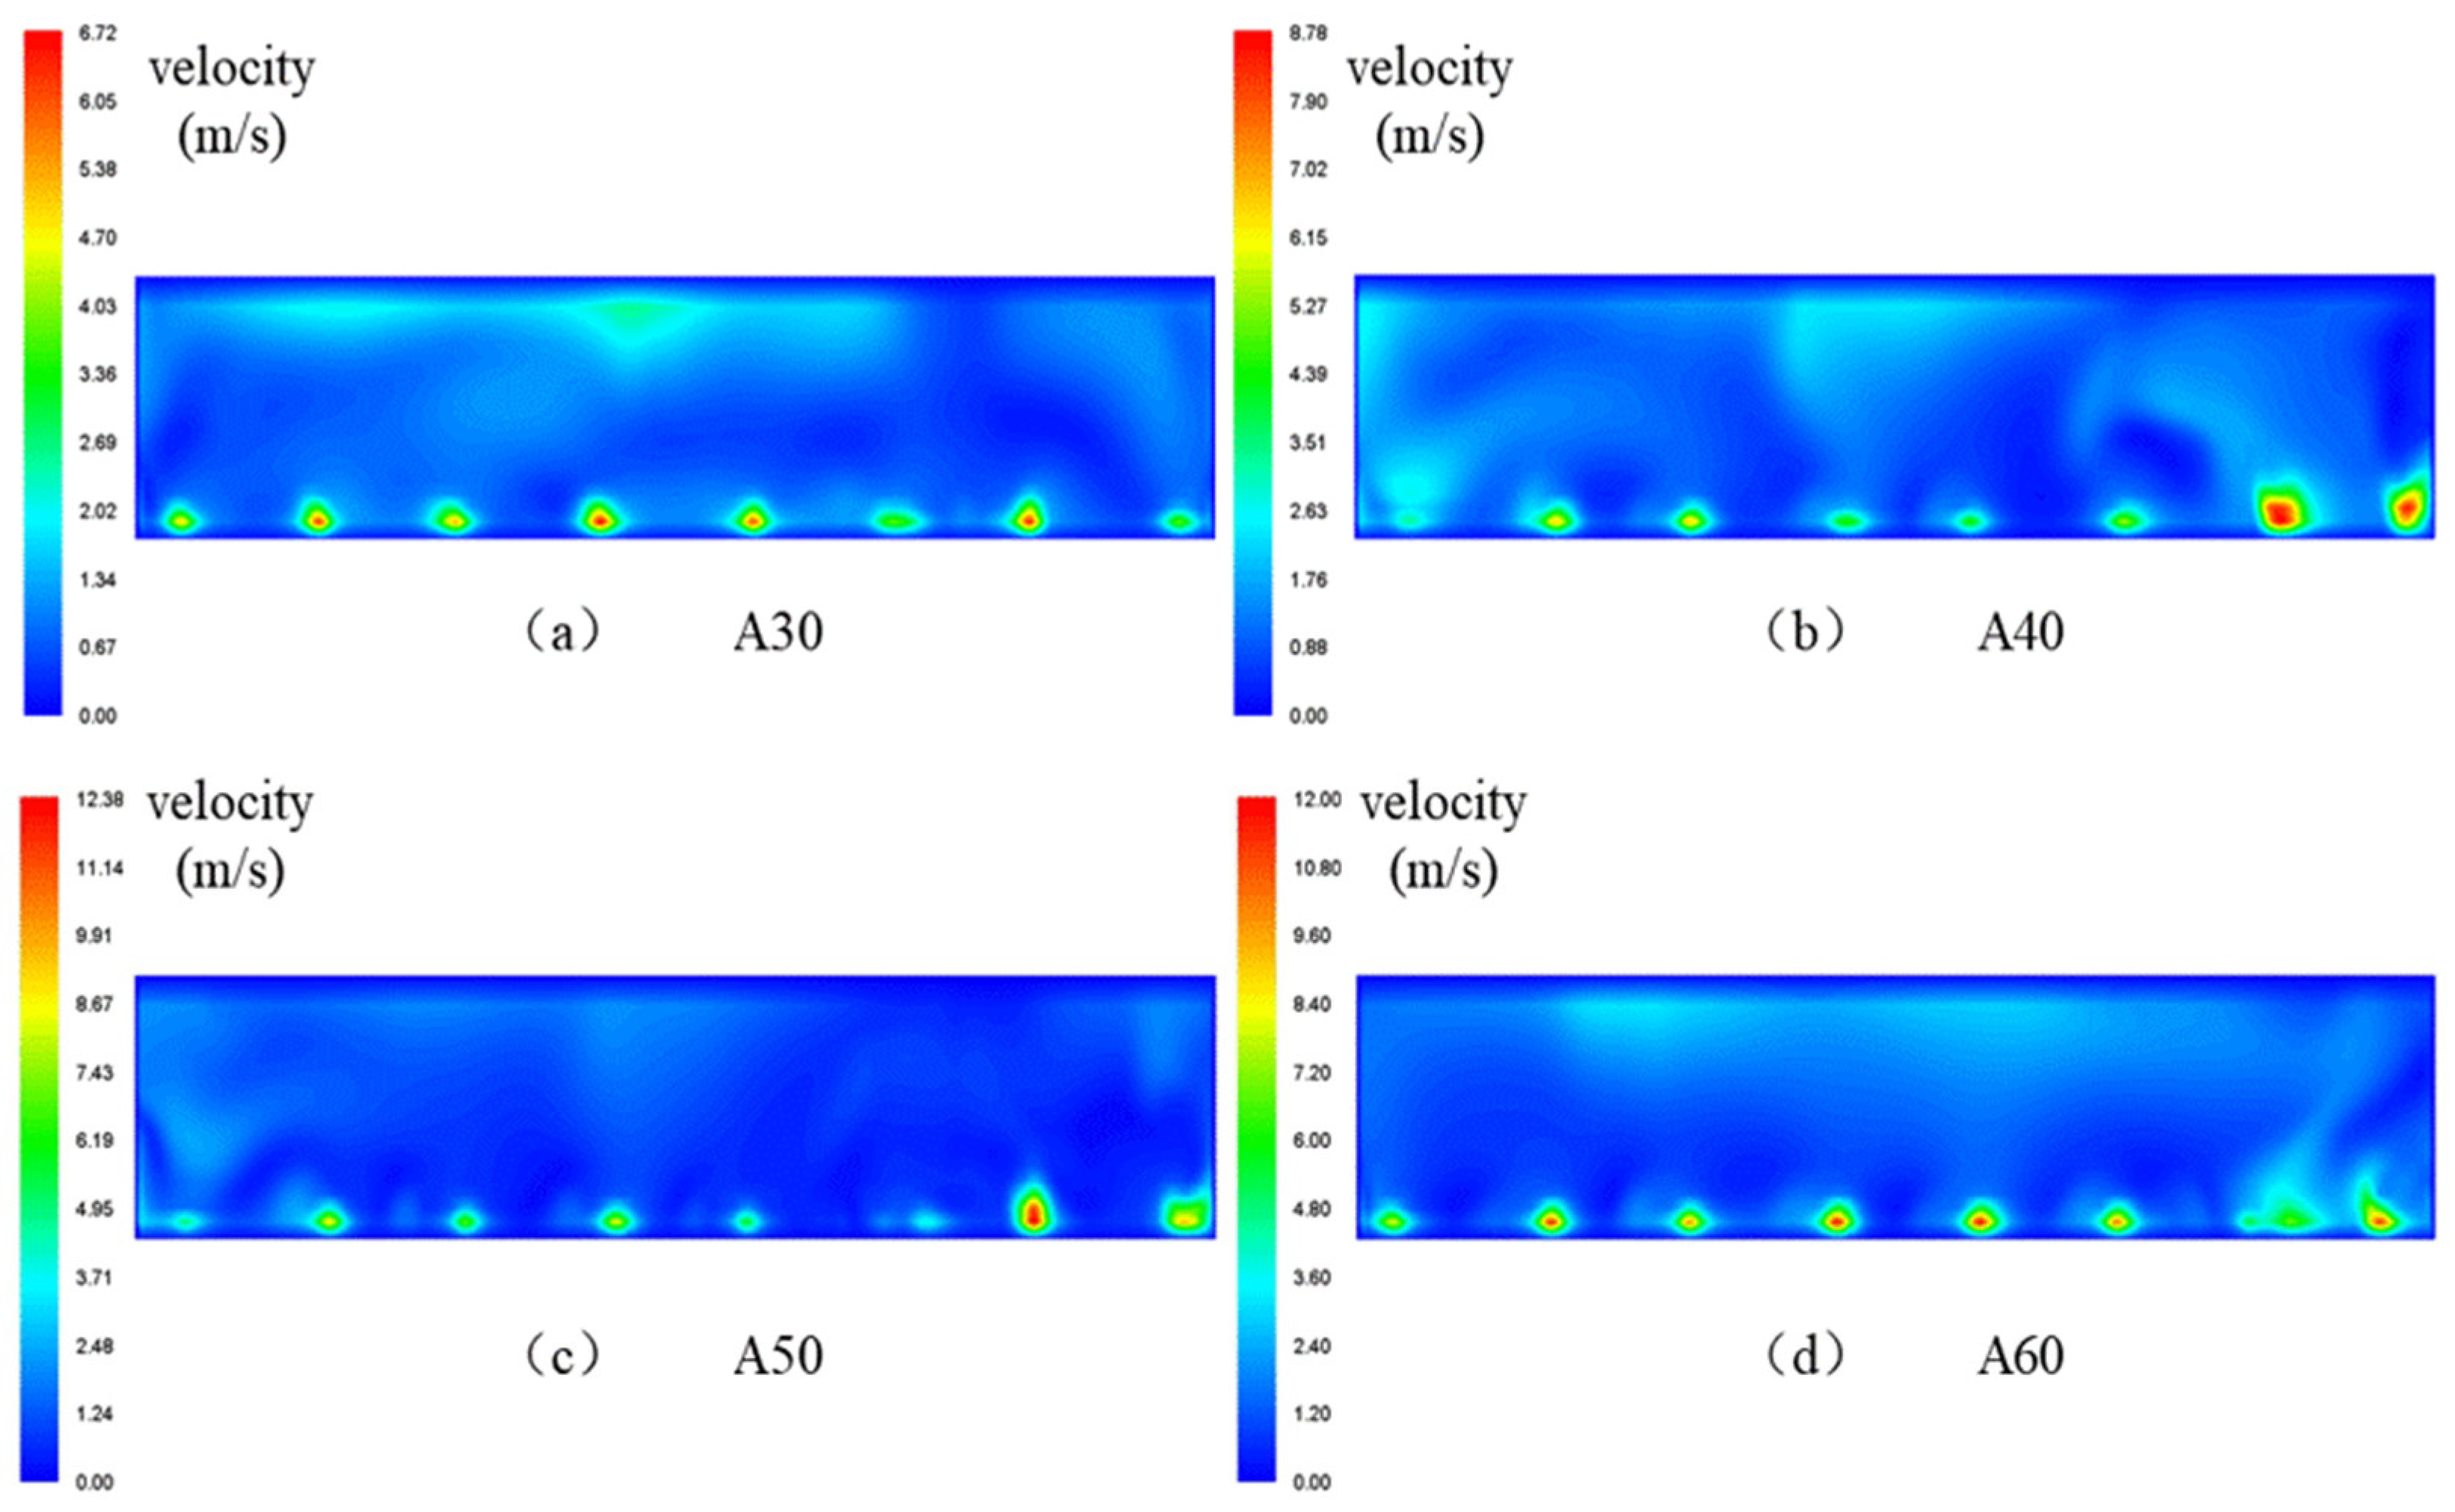
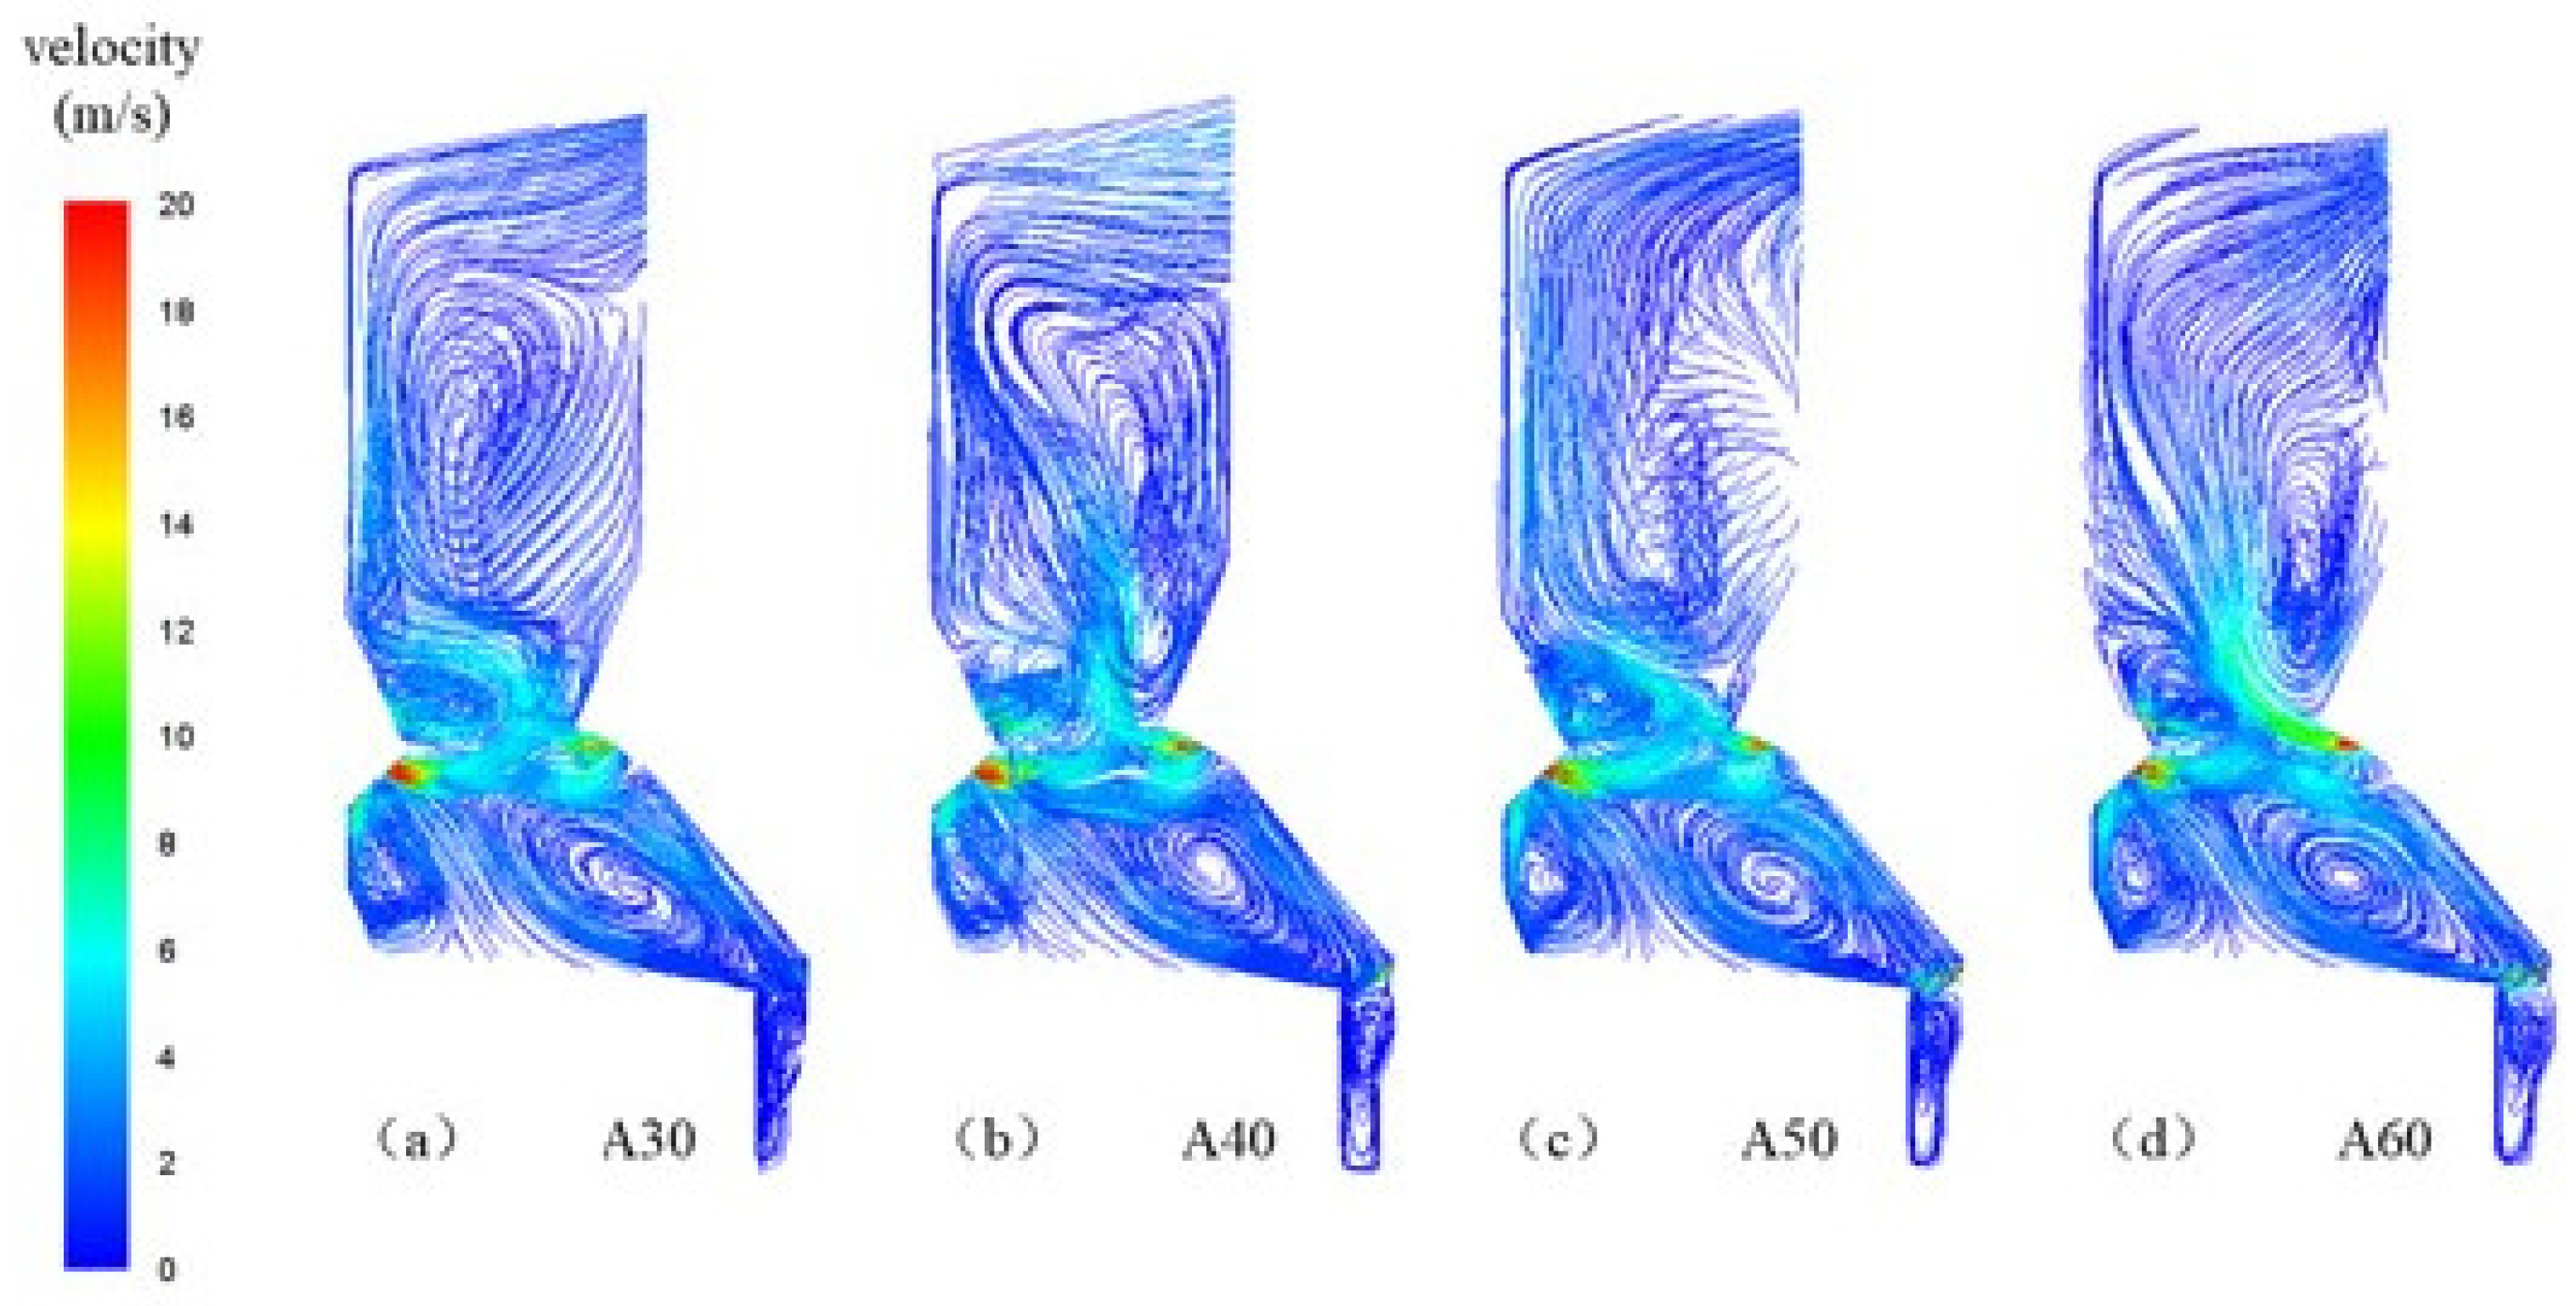
3.2. Different Outlet Velocities of Grate Burnout Air

In order to explore the influence of outlet velocity of burnout air on the cold flow field in the furnace, the flow field distributions of different outlet velocities (30 m/s, 40 m/s, 50 m/s, and 60 m/s) of burnout air with pipe diameters of ϕ 76 mm are numerically simulated, and the following results are obtained.
Figure 4 and Figure 5 show the changes of the flow field inside the furnace and the flow field at the tail of the furnace row when the velocity of the tail burnout air changes. When the pipe diameter is fixed, the turbulence degree of the flow field in the grate tail, and the radiant heat transfer and convective heat transfer in the furnace improve with the increase of the wind speed. In Figure 5d, when the outlet speed of the burnout air at the grate tail reaches 60 m/s, the secondary air on the rear wall deflects, and the front and back wall above begin to form vortices. This phenomenon can avoid air brushing of the wall. Moreover, it is beneficial to reduce the corrosion and slagging of the water-cooled wall, and improve the thermal efficiency of the boiler. The average velocity of the gas flow at the grate tail (an average velocity at 120 mm above the end of the grate along the boiler depth direction) is shown in Table 4. Under the same pipe diameter of the burnout air, the gas velocity at the tail of the furnace row changes in direct proportion to the velocity of the burnout air. When the outlet velocity of the burnout air increases from 30 m/s to 60 m/s, the average velocity of the gas flow at the tail of the furnace row increases by 91%.

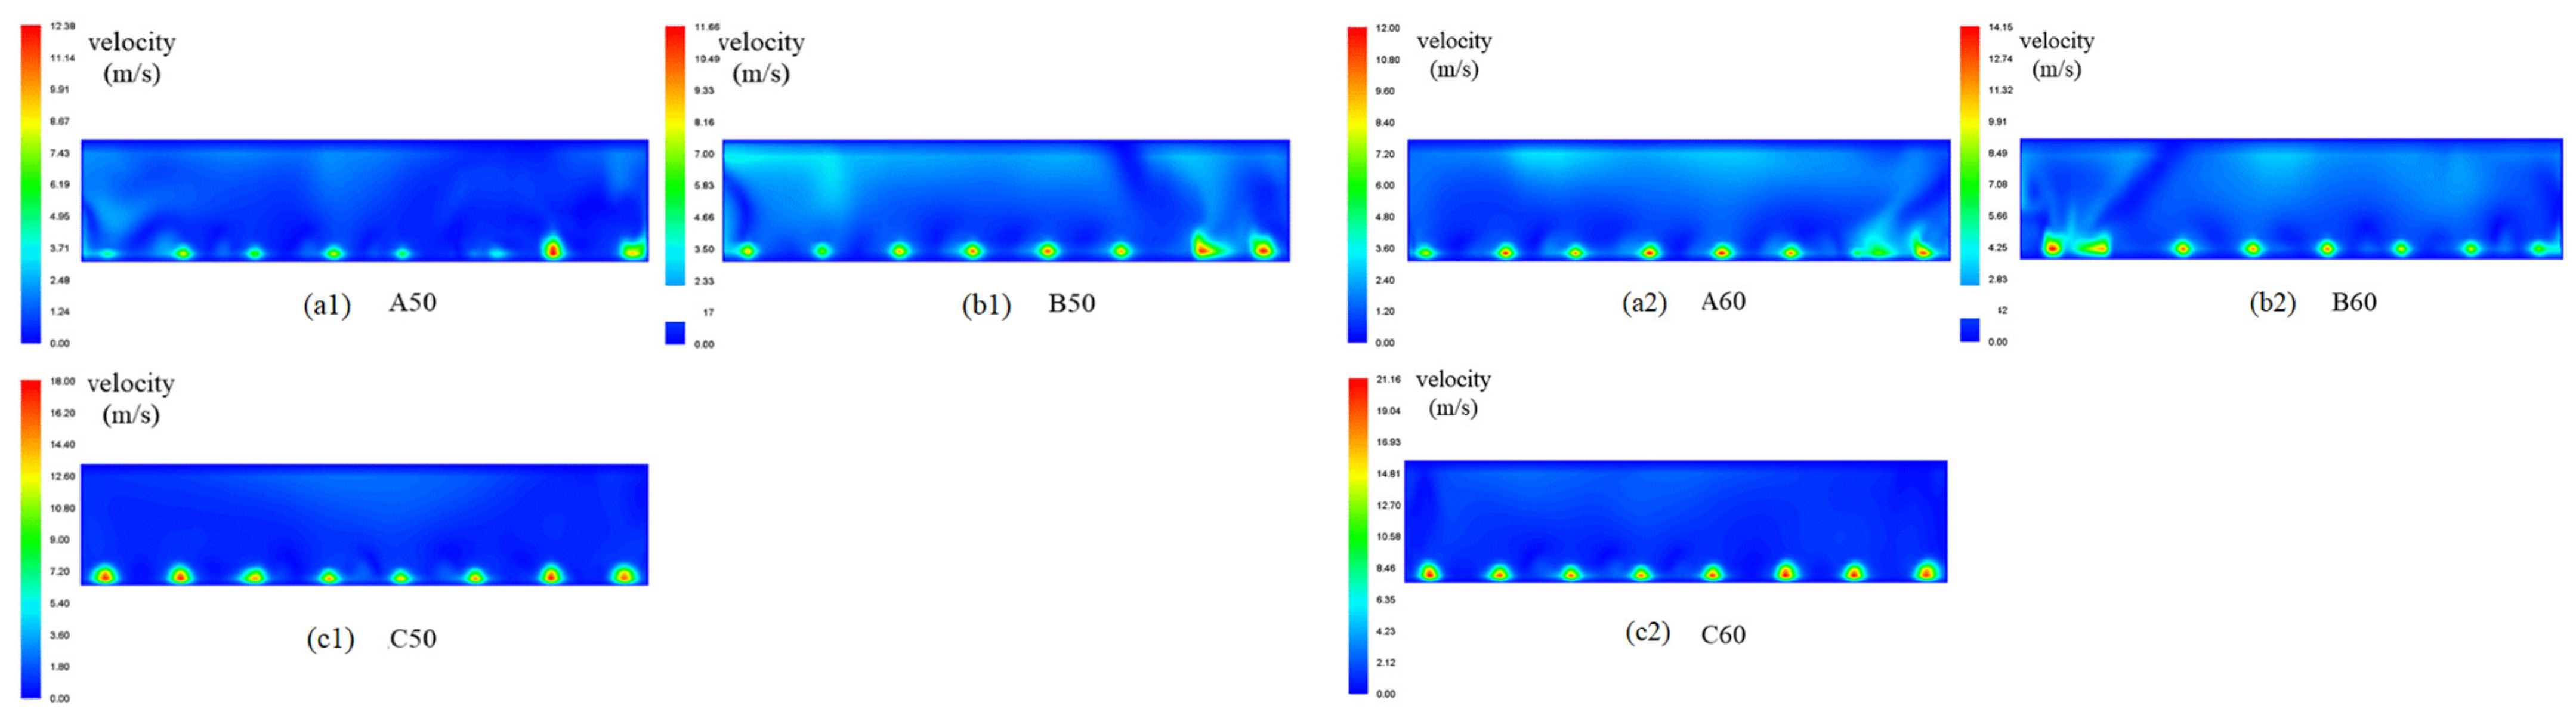
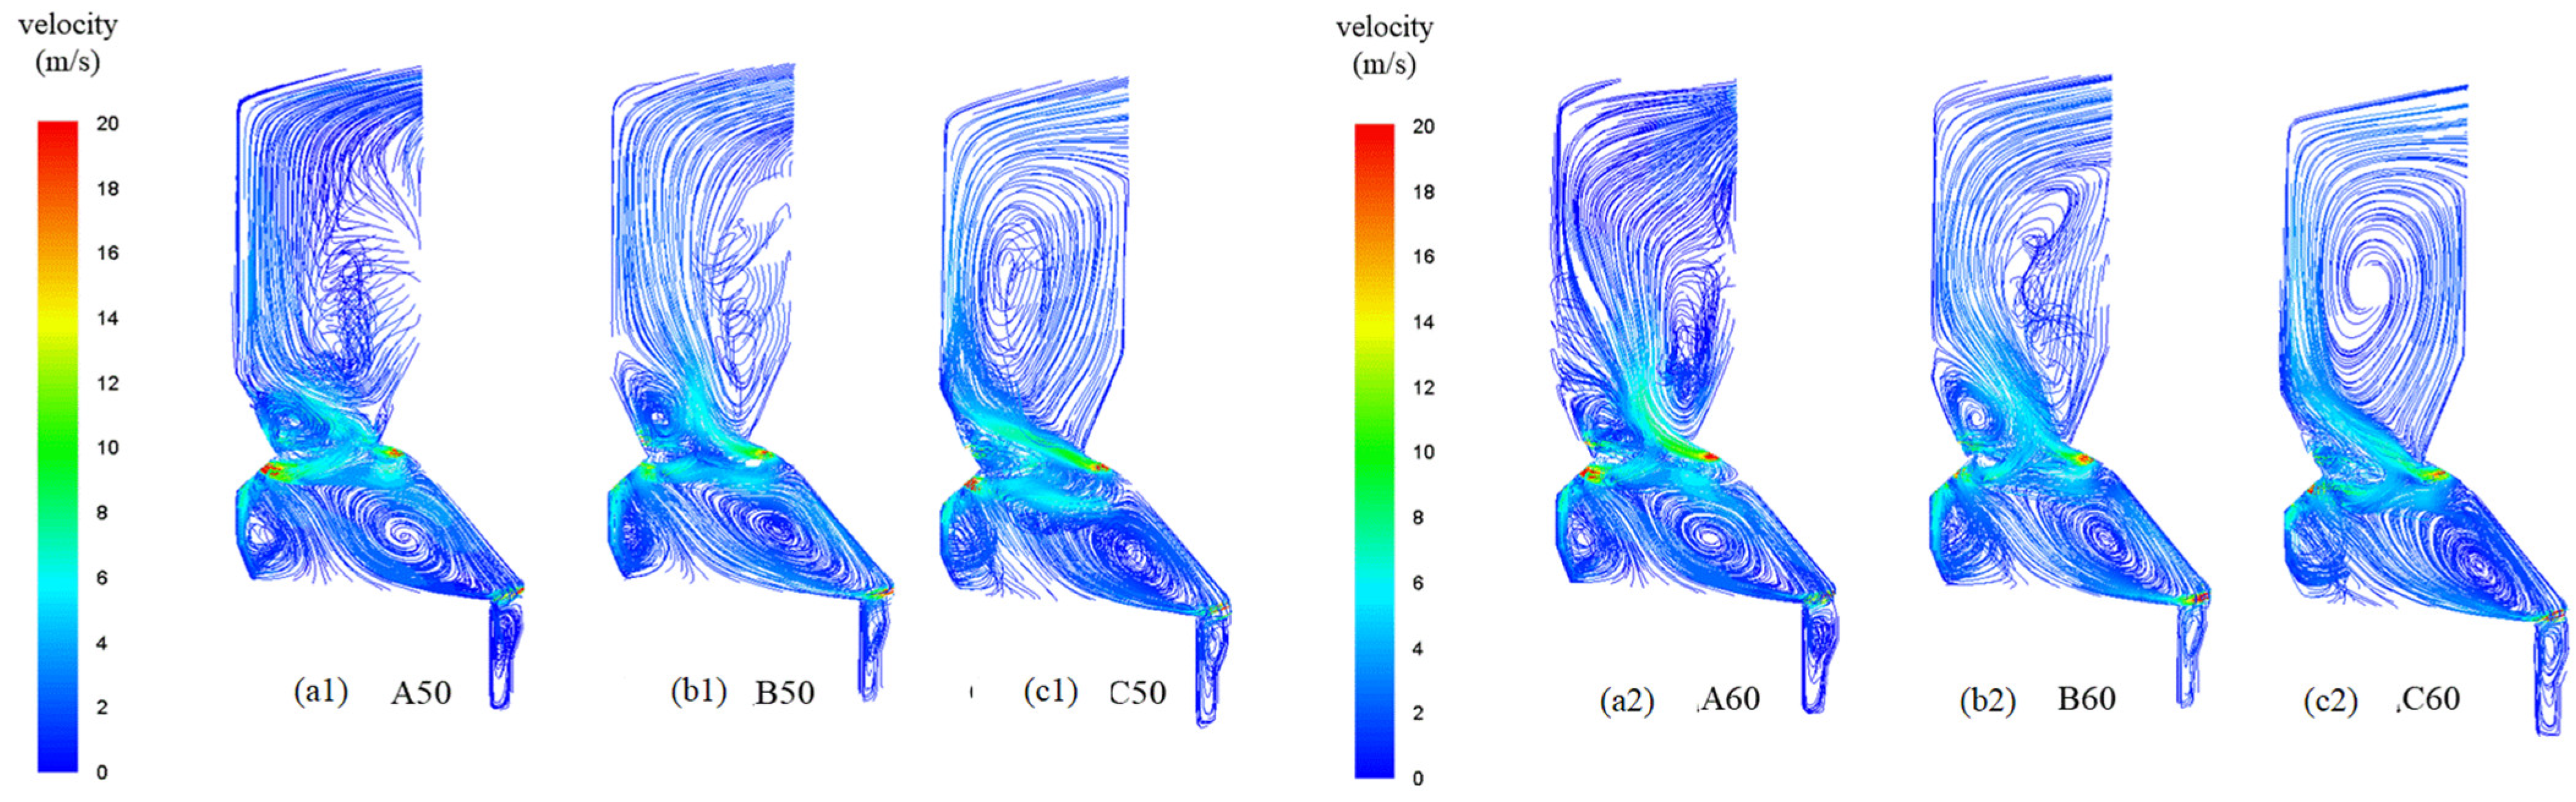
3.3. Different Pipe Diameters of Grate Burnout Air

Furthermore, the influence of pipe diameter change on the flow field distribution in the furnace is simulated and analyzed when the wind speed of the burnout air is 50 m/s and 60 m/s. Figure 6 and Figure 7 show the velocity cloud diagram and flow field diagram in the furnace at the longitudinal section of the grate tail under the conditions of fixed wind speed and diameter, changing from ϕ 76– ϕ 108 mm. The average speed of the gas flow at the tail of the furnace row and the speed increase ratio are given in Table 5.
It can be seen from Figure 6 and Figure 7 and Table 4 that the gas flow velocity at the tail of the furnace row improves with an increase in the pipe diameter of the burnout air. At the same burnout air speed, the larger the pipe diameter, the higher the increase proportion of the tail air velocity is. At the same pipe diameter, the proportion of the increase of the tail gas flow velocity is larger when the burnout air flow velocity is 50 m/s, compared to 60 m/s. This shows that it is not the higher the velocity of the burnout air, but rather, the better the velocity of the tail flow. In a certain flow rate range, increasing the diameter of the burnout air can better accelerate the flow rate of the tail gas, improve the combustion efficiency in the furnace, and reduce the unburned particles at the tail of the furnace row.
From Table 5, it can be seen that when the outlet speed of the burnout air is constant, increasing the diameter of the air duct can effectively improve the average speed of the gas flow at the tail of the furnace row. The disturbance degree of the flow field in this area increases with the increasing of the average velocity of the gas flow at the grate tail, which leads to enhancement of the combustion of unburned carbon on the grate tail. Meanwhile, the reduction in the number of particles on the tail grate decreases significantly, indicating that more particles are far away from the end of the grate and they enter the high-temperature zone of the furnace for combustion, while the residence time of particles on the grate increases. With the increase of air duct diameter, the particle density on the tail grate also decreases significantly. The oxygen content of unburned carbon in the slag increases, and the combustion intensity is enhanced. Finally, the carbon content in the slag decreases and the boiler efficiency improves.

3.4. Different Jet Angles of Grate Burnout Air

The change of the injection angle of the burnout air at grate tail will change the movement path of the air jet after entering the furnace, and affect the flow field distribution in the furnace. Therefore, under the conditions of C60, six working conditions with the incident angle of burnout air changing from 10° to 15° are simulated in this paper. The flow line distribution in the furnace is shown in Figure 8.
As can be seen from Figure 8, with the increase of the incident angle of the burnout wind, the upper half and the lower half of the furnace form vortices, respectively. The turbulence in the upper half enhances the radiation and convection heat transfer between the high-temperature flue gas and the water wall, improves the boiler efficiency, and reduces the possibility of slagging and corrosion of the water wall. The vortex under the rear arch increases the temperature of the rear arch, promotes the combustion at the tail of the furnace row, and reduces the carbon content in the slag. When the incident angle is in the range of 10–12° to 13–15°, the streamline distribution in the furnace is basically similar. Therefore, under the condition of C60, setting the incidence angle of burnout air between 12–14° is conducive to strengthening the tail flow speed and improving the combustion efficiency in the furnace.
It can be seen from Table 6 that when the incidence angle of the burnout wind changes in the range of 10–15°, taking the value at the incidence angle of 15° as the initial quantity, the average speed of the gas flow at the tail of the furnace row and the proportion of the reduction of the number of particles basically increase to a certain extent. Therefore, when the outlet speed of the burnout air is 60 m/s and the pipe diameter is 108 mm, in order to simultaneously improve the airflow speed at the tail of the furnace row and the number of particles moving to the higher temperature of the furnace, the incident angle of the burnout air can be set between 11–13°.

4. Conclusions

In this paper, the influence of the exhaust air on the flow field at the tail of the furnace is deeply studied through numerical simulation, which establishes the foundation for further thermal simulation and provides a reference for the design and optimization of air distribution in actual operation. The following conclusions can be drawn from the above simulation of the boiler cold flow field:
(1)
Adding burnout air at the tail of the grate can improve the airflow velocity at the tail of the grate, strengthen the disturbance of the flow field, and enhance the radiation and convection heat transfer in the furnace. It can create a good combustion condition for the unburned carbon on the grate tail. The high-speed burnout air can blow some particles back to the high-temperature combustion zone and prolong the residence time of particles on the grate. This phenomenon is due to the improvement of the combustion efficiency in the furnace and the reduction of carbon content in the slag.
(2)
When the number of burnout air ducts at the tail of the furnace row is certain, increasing the wind speed of burnout air or expanding the diameter of burnout air can effectively improve the airflow velocity at the tail of the furnace row, increase the disturbance degree of the flow field in this area, and increase the proportion of particle reduction on the grate tail. Therefore, under the assumption of the maximum proportion of burnout air volume, the outlet velocity and the pipe diameter of burnout air should be increased as much as possible under the boundary conditions.
(3)
When the down dip angle of the burnout wind changes, the air velocity at the tail of the furnace row increases within 1 m/s, but the upper flow field is improved to a certain extent. In order to obtain a greater air velocity and to increase the turbulence degree of the flow field at the grate tail, the down dip angle of the burnout wind can be set at between 11–13°.
The model presented in this work can contribute to previous works through accurate three-dimensional predictions in particle movement and the furnace cold flow field of the biomass boiler with the tail burnout air system. The simulation of a particle trajectory is complicated. In this paper, only single-sized unburned carbon particles are simulated. Further studies are necessary for investigating the operation of multi-sized particles. Furthermore, relevant experiments should be carried out to verify the results of the numerical simulations in this paper, and the tail burnout air system should be improved accordingly.

Author Contributions

Conceptualization, T.L., Z.H.; methodology, S.C., W.C.; software, W.C.; validation, Y.L., Z.H.; formal analysis, W.C.; investigation, Y.L.; resources, T.L., Z.H.; data curation, S.C., W.C.; writing—original draft preparation, S.C.; writing—review and editing, S.C., T.L.; visualization, Z.H.; supervision, T.L., Z.H.; project administration, Z.H. All authors have read and agreed to the published version of the manuscript.

Funding

The authors acknowledge financial support from the China Postdoctoral Science Foundation (2020M671983) and the Shandong Postdoctoral Innovation Project (202103077).

Conflicts of Interest

The authors declare no conflict of interest. The funders (company, etc.) had no role in the design of the study; in the collection, analyses, or interpretation of data; in the writing of the manuscript, or in the decision to publish the results.

References

  1. Wang, F.; Liu, X.; Chen, L.G. Research status and development prospect of energy and high value utilization of biomass resources. Trans. Chin. Soc. Agric. Eng. 2021, 37, 219–231. [Google Scholar]
  2. International Energy Agency. World Energy Outlook 2018. 2018. Available online: https://www.iea.org/weo2018/ (accessed on 13 November 2018).
  3. Sánchez, J.; Curt, M.D.; Robert, N.; Fernández, J. Chapter two biomass resources. In The Role of Bioenergy in the Emerging Bioeconomy, Resources, Technologies, Sustainability and Policy; Lago, C., Caldes, N., Lechon, Y., Eds.; Academic Press: Cambridge, MA, USA, 2019; pp. 2–111. [Google Scholar] [CrossRef]
  4. Ismail, T.M.; Abd El-Salam, M.; El-Kady, M.A.; El-Haggar, S.M. Three dimensional model of transport and chemical late phenomena on a MSW incinerator. Int. J. Therm. Sci. 2014, 77, 139–157. [Google Scholar] [CrossRef]
  5. Demirbas, A. Potential applications of renewable energy sources, biomass combustion problems in boiler power systems and combustion related environmental issues. Prog. Energy Combust. Sci. 2005, 31, 171–192. [Google Scholar]
  6. Lv, Y.; Jiang, D.L.; Zhao, W.J.; Liu, J.Z. Technology of Biomass Direct Combustion Power Generation and Combustion Analysis. Power Syst. Eng. 2011, 27, 4–7. [Google Scholar]
  7. Zhang, J.H. Numerical Simulation of Combustion Characteristics and NOx Emission of Biomass Grate Furnace. Master’s Thesis, South China University of Science and Engineering, Guangzhou, China, 2020. [Google Scholar]
  8. Sun, R.; Ismail, T.M.; Ren, X.H.; El-Salam, M.A. Numerical and experimental studies on effects of moisture content on combustion characteristics of simulated municipal solid wastes in a fixed bed. Waste Manag. 2015, 39, 166–178. [Google Scholar] [CrossRef] [PubMed]
  9. Sun, R.; Ismail, T.M.; Ren, X.H.; El-Salam, M.A. Influence of simulated MSW sizes on the combustion process in a fixed bed: CFD and experimental approaches. Waste Manag. 2016, 49, 272–286. [Google Scholar] [CrossRef] [PubMed]
  10. Gómez, M.A.; Porteiro, J.; de la Cuesta, D.; Patiño, D.; Míguez, J.L. Numerical simulation of the combustion process of a pellet-drop-feed boiler. Fuel 2016, 184, 987–999. [Google Scholar] [CrossRef]
  11. Kaer, S.K. Numerical modeling of a straw-fired grate boiler. Fuel 2004, 83, 1183–1190. [Google Scholar] [CrossRef]
  12. Zhou, A.; Xu, H.; Tu, Y.; Zhao, F.; Zheng, Z.; Yang, W. Numerical investigation of the effect of air supply and oxygen enrichment on the biomass combustion in the grate boiler. Appl. Therm. Eng. 2019, 156, 550–561. [Google Scholar] [CrossRef]
  13. Hu, Y.M.; Wu, C.B.; Zhu, X.C.; Shao, Y. Optimization and numerical simulation of secondary air induction into refuse incinerator. J. Environ. Eng. 2009, 3, 951–955. [Google Scholar]
  14. Liu, R.M.; Liu, Y.K.; Wang, Z.H.; Liu, Y.-Z. CFD simulation and optimization of secondary air distribution for waste combustion in grate furnace. J. Zhejiang Univ. (Eng. Sci.) 2017, 51, 500–507. [Google Scholar]
  15. Lu, Y.; Zhang, H.; Xu, Y.; Zhu, Y.; Wan, K.; Shao, Z.; Wang, Z. Numerical simulation of effects of flue gas recirculation on biomass combustion in grate boiler. J. Zhejiang Univ. (Eng. Sci.) 2019, 53, 1898–1906. [Google Scholar]
Figure 1. The sketch of the grate boiler with a steam generation rate of 130 t/h.
Energies 15 07664 g001
Figure 2. The velocity distribution of the furnace center section in 0 working condition.
Energies 15 07664 g002
Figure 3. The velocity distribution of the grate tail section in 0 working condition. (a) Lower secondary air on front wall; (b) Middle secondary air on front wall; (c) Secondary air on back wall; (d) Upper secondary air on front wall.
Energies 15 07664 g003
Figure 4. Velocity nephogram of vertical section at the grate tail of A30–A60.
Energies 15 07664 g004
Figure 5. Flow line distribution in furnace of A30–A60.
Energies 15 07664 g005
Figure 6. Velocity nephogram of vertical section at the grate tail.
Energies 15 07664 g006
Figure 7. Flow line distribution in furnace.
Energies 15 07664 g007
Figure 8. Flow line distribution in furnace with burnout air incident angle from 10–15°.
Energies 15 07664 g008
Table 1. The designed biomass fuel characteristics.
%Q (kJ/kg)
CHONS
36.256.1628.970.380.1310,332
Table 2. The main design parameters of grate boiler.
Design Parameters
Main steam flow (t/h)130
Main steam pressure (MPa)9.18
Main steam temperature (°C)538
Feed water temperature (°C)220
The primary air temperature (°C)200
The secondary air temperature (°C)200
The ratio of the primary and secondary air3:7
Table 3. Air distribution condition of boiler cold flow field.
NumbersPrimary Air (%)Lower Secondary Air on Front Wall (%)Middle Secondary Air on Front Wall (%)Upper Secondary Air on Front Wall (%)Secondary Air on Back Wall (%)Tail Burnout Air on Grate (%)Outlet Velocity of Grate Burnout Air (M/S)
0308251423--
A30308251421.351.6530
A40308251420.82.240
A50308251420.252.7550
A60308251419.73.360
B60308231420560
C60308221319.77.360
Notes: 1. A/B/C refers to the air distribution system with tail burnout air and the pipe diameter, which is ϕ 76 mm/ ϕ 89 mm/ ϕ 108 mm. 2. A30 is defined as trail burnout air pipe diameter, and is ϕ 76 mm, and outlet velocity is 30 m/s.
Table 4. Variation of flow field at the grate tail at different flow velocities.
NumbersBurnout Air Pipe Diameter (mm)Average Velocity of Gas Flow at the Grate Tail (m/s)
A30762.50
A40762.78
A50763.40
A60764.79
Table 5. Variation average speed of the gas flow at the tail of the furnace at different pipe diameters.
NumbersBurnout Air Pipe Diameter
(mm)
Average Velocity of Gas Flow at the Grate Tail (m/s)Ratio (%)Ratio of Particle Quantity Reduction (%)
A50763.404.76
B50894.53335.36
C501085.08497.53
A60764.8507.74
B60895.45128.33
C601086.002410.42
Table 6. Variation incident angle of the gas flow at the tail of the furnace under C60.
Incident Angle (°)Average Velocity of Gas Flow at the Grate Tail (M/S)
106.96
117.03
126.60
136.86
145.87
156.00
Publisher’s Note: MDPI stays neutral with regard to jurisdictional claims in published maps and institutional affiliations.

