Article

Law and Mechanism Study on Salt Resistance of Nonionic Surfactant (Alkyl Glycoside) Foam

1
School of Chemistry and Chemical Engineering, Southwest Petroleum University, Chengdu 610500, China
2
The Key Laboratory of Well Stability and Fluid & Rock Mechanics in Oil and Gas Reservoir of Shaanxi Province, Xi’an 710065, China
3
Oil & Gas Field Applied Chemistry Key Laboratory of Sichuan Province, Chengdu 610500, China
4
Sichuan Ruidong Technology Co., Ltd., Chengdu 610500, China
*
Authors to whom correspondence should be addressed.
Energies 2022, 15(20), 7684; https://doi.org/10.3390/en15207684
Submission received: 7 September 2022 / Revised: 12 October 2022 / Accepted: 13 October 2022 / Published: 18 October 2022

Abstract

:
In this paper, the effects of three cations, Ca2+, Mg2+, and Na+, on the stability of APG foams were investigated experimentally. The results show that cations can slow down the process of liquid drainage and coarsening of APG foam, which is beneficial to the stability of the foam. The salt resistance mechanism of nonionic surfactant (APG) was investigated by molecular dynamics simulation and compared with that of anionic surfactant (SDS) foam. Firstly, the distribution characteristics of cations in APG foam and SDS foam were explored. It was found that the cations in the APG foam were mainly distributed in the water layer away from the head groups, and the cations in the SDS foam were more likely to appear near the head groups. Then, the hydration of the head groups and the cation was investigated. The results show that cations have little effect on the number of water molecules in the hydration layer of APG head groups but will reduce the diffusion capacity of water molecules and increase the water retention capacity of the foam film, thereby enhancing the foam stability. The addition of cations will reduce the water retention capacity of the SDS foam film. In addition, the behavior of surfactant head and tail groups was also analyzed. It was found that the cations made the head groups of APG more inclined to be aligned perpendicular to the liquid interface, and the tail groups were more inclined to realize a cross-arrangement and cover the gas–liquid interface. This can not only slow down the gas phase mass transfer process of the adjacent foam and slow down the coarsening process of the foam but also increase the viscoelasticity and anti-disturbance ability of the foam film. The cations will weaken the staggered arrangement of the SDS molecular tail groups, and at the same time, will cause the SDS molecules to aggregate, which greatly reduces the stability of the foam.

1. Introduction

Foam is a dispersion system in which the dispersed phase is gas and the continuous phase is liquid [1]. It has the characteristics of low density and large specific surface area, so it is widely used in daily life and industrial production: food industry [2], cosmetics, cleaning and washing, wastewater treatment, heavy metal recovery [3], crude oil extraction [4,5] froth flotation [6], and so on. From a thermodynamic and kinetic point of view, foam is not a stable system. Surfactant is widely used in foam fields because it can make foam more stable. The hydrophilic head groups are located in the water phase, and the hydrophobic tail groups tend to be adsorbed on the gas–liquid interface to maintain the stability of the foam [7]. However, many external conditions will affect the stability of the foam, and metal cations are a very important factor. Especially in foams formed by anionic surfactants, cations can affect the structure and properties of the surfactant layer [8]. Some surfactants even form insoluble salts with cations, which greatly reduces the stability of the foam [9]. Therefore, it is very meaningful and important to study the salt tolerance of foam, which provides a theoretical basis for us to synthesize and use surfactants.
Many researchers have studied foam stability from macroscopic, mesoscopic, and microscopic scales and established related methods to evaluate foam stability. Macroscopically, studies have been mainly in foam drainage, foam volume change, and foam interface viscoelasticity, and they quantitatively described the stability of foam by means of half-life, foam liquid holding capacity, and drainage kinetics of foam [10,11]. At the same time, the characterization methods that can be combined include Raman spectroscopy [12], small angle neutron and X-ray scattering [13,14], X-ray tomography [15,16], terahertz spectroscopy [17], and so on. On the mesoscopic scale, we can amplify the foam with some equipment and describe the stability of the foam by studying the change of the average particle size of the foam, the thickness of the foam film, and the pseudo-emulsion film between the foam [18,19]. In recent years, molecular dynamics (MD) simulation has gradually become an important way to study foam stability at the molecular scale [20]. In previous MD studies, the stability of foam was studied mainly through the following aspects: the structural characteristics of surfactant monolayer [21], the distribution characteristics of molecules [22,23], the interactions between groups (molecules) and other groups (molecules) [24,25], and the interaction energy between different molecules [26,27]. Many researchers have studied the interfacial formation energy (IFE) [23,28] of foam, the potential of mean force (PMF) [29], diffusion coefficient (d) [28], and so on [30], hoping to introduce quantitative parameters for research.
Although the widely used surfactants such as sodium dodecyl sulfate (SDS) and sodium dodecylbenzene sulfonate (SDBS) are effective and inexpensive, they have the disadvantages of poor salt resistance, irritation, and refractory degradation. Whether it is for water or soil, the use of a large number of surfactants has caused pollution. Alkyl glycoside (APG) surfactants have excellent properties such as good performance, non-toxicity, and being harmless and easy to degrade [31], and they are ideal green surfactants. In terms of oil recovery, APG has been used to explore its ability to enhance oil recovery. Additionally, it was found that it has a synergistic effect with alcohol co-solvent, which can generate ultra-low interfacial tension of 0.001 mN/m, which can greatly improve oil recovery [32,33]. Adding APG can also improve the biodegradation rate during bioremediation, and the combination of bioaugmentation and APG is an effective method to remediate petroleum hydrocarbon contaminated soil [34,35]. Studies have shown that the addition of APG is beneficial for improving the activity of hydrolase in waste sludge, which can effectively promote the hydrolysis of pretreated waste sludge, and the effect is also significant in high-concentration brine [36,37]. In addition, the phase behavior of APG [38], the formation of microemulsion [39], and the interaction between APG and other surfactants and additives [40] have been studied. Alkyl glycoside surfactant have been extensively studied in other fields, but their application in foam is very small. The existing applications of APG foam include mine dust control [41], enhanced oil recovery [42,43], and research on APG and other surfactant compound foam systems [44,45]. So far, there are only a few researchers studying APG by molecular dynamics, for example, those studying the wetting and adsorption mechanism of APG on coal [46]. Few or no researchers used molecular dynamics simulations to study the effect of cations on the stability of APG foam.
In this work, we selected NaCl, MgCl2, and CaCl2, three common inorganic salts and green surfactant APG, as research objects. The salt-resistant ability and mechanism of APG foam were investigated by experiments and molecular dynamics simulations. There are two main research objectives: one is to explore the stability law of APG foam in the presence of different types and concentrations of salt and to provide reference value for the application of green surfactant APG in foam. Another is to explain, at the molecular level, how APG foams are salt resistant and to explore the difference in the effect of cations on the stability of nonionic and anionic surfactant foams.

2. Experimental Section

2.1. Materials and Instruments

(1)
Foaming agents: APG-10; the effective content of the APG used in this study is 50%, produced by Beijing Baiaolaibo Technology Co., Ltd., Beijing, China.
(2)
Inorganic salts: NaCl, CaCl2, and MgCl2, chemically pure, produced by Chengdu Kelong Chemical Co., Ltd., Chengdu, China.
(3)
Foam performance evaluation instrument. The foaming method of the device is stirring and foaming, and the lower part is a stirrer. The upper part is composed of a high-strength transparent glass sleeve and a sealing head; there is a scale on it, which can be used to observe changes in foam volume and foam drainage. Produced by Beijing Coriolis Scientific Instrument Co., Ltd., Beijing, China.
(4)
Microscopic observation unit. BS-200SS microscope, which can magnify the foam with a maximum magnification of 500 times. Produced by Suzhou 3b Scientific Co., Ltd., Suzhou, China.
(5)
Image recording device. Used to record the image of foam. Its model is: FDR-AX700. Produced by SONY, Beijing, China.
All reagents in the experiment are industrial products, and no further refining is required.

2.2. Test Method for Foam Stability

2.2.1. Drainage Behavior of Foam

A surfactant solution was prepared, and the concentration of the foaming agent was 6 g/L. NaCl, CaCl2, and MgCl2 were added to the surfactant solution, respectively, and the concentration gradients of the three salts were 10 g/L, 50 g/L, and 100 g/L. Then, we poured the solution into the foaming device, turned on the stirrer, and stirred for 2 min. We observed the volume change and the drainage process of the foam and recorded the data through the scale. The experiments were carried out at atmospheric pressure and 25 °C, and the surfactant solution with a concentration of 6 g/L was used as a blank control.

2.2.2. Coarsening Behavior of Foam

A surfactant solution was prepared, and the concentration of the foaming agent was 6 g/L. NaCl, CaCl2, and MgCl2 were added to the surfactant solution, respectively, and the concentration gradients of the three salts were 10 g/L, 50 g/L, and 100 g/L. Then, we pour the prepared surfactant solution into the foaming device and stirred to foam. The formed foam was quickly expelled into a viewing device, while a video camera recorded the changes in the foam. The experiments were carried out at atmospheric pressure and 25 °C, and the surfactant solution with a concentration of 6 g/L was used as a blank control.

2.3. Details of Molecular Dynamics Simulation

2.3.1. Force Field and Parameters

We conducted all-atom molecular dynamics simulations using Materials Studio software 8.0, and the force field selected for the simulation process was COMPASS [47]. The force field covers the most common organics, inorganic small molecules, and polymers. For these molecular systems, force fields have been parameterized to predict various properties of separated and condensed phase molecules. Parameter combinations of organic and inorganic substances can be used to study interfacial and mixed systems. The total potential energy includes valence energy and non-bonding energy [48]. Valence energy consists of stretching energy, angular bending energy, torsional energy, out-of-plane energy, and cross energy. The non-bonding energy consists of two parts, van der Waals energy and electrostatic interaction energy [21].
E = E b o n d + E a n g l e + E t o r s i o n + E i n v e r s i o n + E C r o s s + E n o n - b o n d
E n o n - b o n d = E v d w + E e l e c + ε i j [ 2 ( σ i j r i j ) 9 3 ( σ i j r i j ) 6 ] + q i q i r i j
The ionic and semi-ionic models in the COMPASS force field consist of coulomb terms and van der Waals (vdW) terms. The ionic bond is represented by a strong attractive force between opposite charged atoms and vdW terms whose repulsion part keeps the opposite charged atoms at a certain distance. Its model is described below [49].
E p o t = i > j q i q j r i j + i > j E i j [ 2 ( r i j 0 r i j ) 9 3 ( r i j 0 r i j ) 6
r i j 0 = ( ( r 0 ) 6 + ( r i 0 ) 6 2 ) 1 / 6
The charges q i and q j are formal charges which, in most cases, are equivalent to oxidation states. A modified Bond Increment charging scheme is used:
q i = δ i + j δ i j
For ionic materials, δ i is set to the formal charge, otherwise it is zero, and δ i j is zero for ionic materials.
Generally speaking, these parameters were optimized to fit the lattice energies and cell parameters based on energy minimization calculations. Good agreements between the calculated and experimental data of unit cell parameters and lattice energies for alkali halides are obtained.
E i j = e { e x p [ 2 α ( r i j r i j 0 ) ] 2 e x p [ α ( r i j r i j 0 ) ] } f s + 1 + f s C 6 r i j 6 + q i q j r i j
f s = 1 1 + e x p 20 · r i j r c
In calculating non-bonding energies, electrostatic interactions were calculated using the Ewald summation method and vdW interactions were calculated using an atom-based simulation method [22] with a cutoff distance of 12.5 Å. After geometry optimization calculations using the smart algorithm, all kinetic simulations were performed under the NVT ensemble. The Andersen thermostat was used to control the simulated temperature at 298 K.

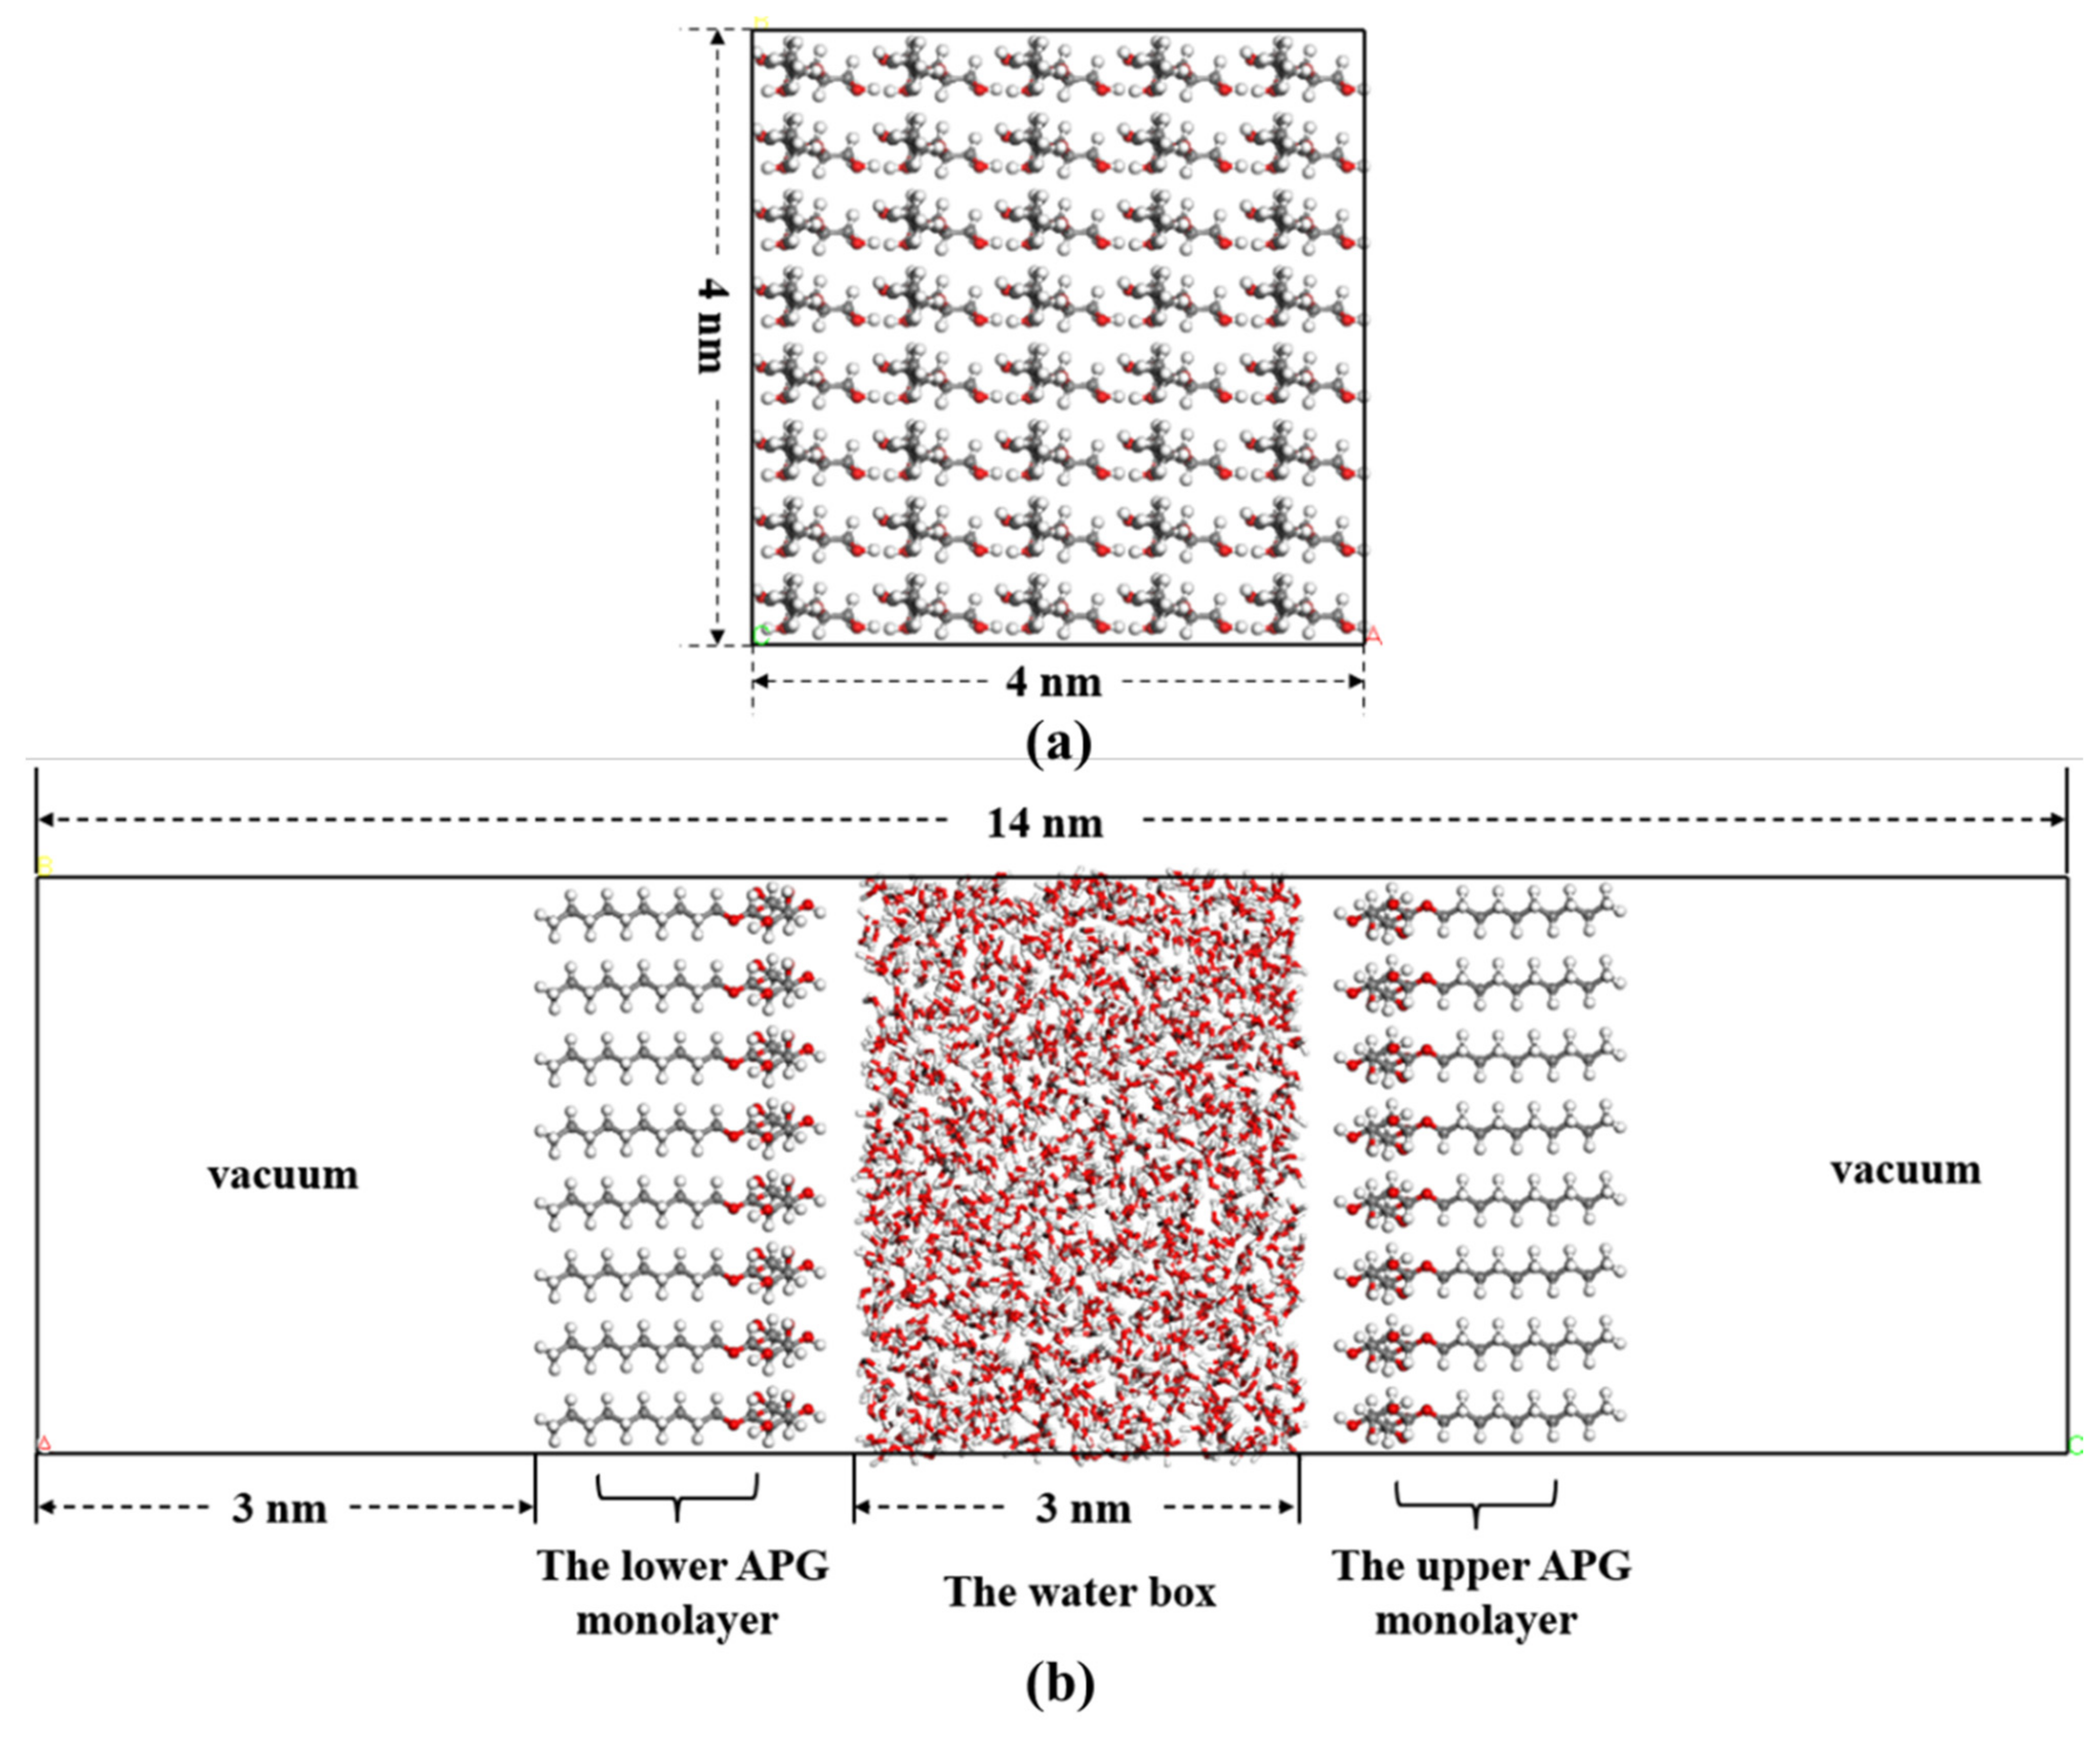
2.3.2. Model and Simulation Process

First, water molecules and anions and cations, APG [46] and SDS surfactant molecules, were established, and then the foam film structure was constructed. The foam film model is shown in Figure 1. On the z-axis in three-dimensional space, the foam film consists of three layers of molecules. The first and third layers are surfactant molecules, and the water layer is in the middle. In the process of establishing the brine layer, the number of anions and cations in the box was calculated based on the true density of the brine. A vacuum layer of 30 Å was applied on each side of the film to avoid the effect of the periodic boundary on the surfactant molecules. Before molecular dynamics simulation, geometric optimization was carried out to cause the system reach a relatively stable state. In the molecular dynamic simulation process, we first calculated 600 ps and output 1 frame every 1 ps. Then, we calculated 300 ps and output 1 frame every 1 ps. During this process, the system was basically in a balanced state. During the simulation process, enough trajectory files were output to ensure the accuracy of statistical analysis.

3. Results and Discussion

3.1. Foam Stability from Experimental Results

We observed the drainage process of APG foam with different salts and concentrations at 25 °C and compared it with the foam system without salt. The resulting foam drainage curve is shown in Figure 2. With the increase of time, the discharge volume of different foam systems gradually increased until reaching the maximum value. However, with the addition of cations, the drainage rate of the foam gradually decreased, and the time to reach the maximum drainage volume gradually increased. Moreover, with the increase of cation concentration, the foam drainage rate gradually decreased, and the time to reach the maximum drainage was prolonged. At the same time, we found that the valence state of the cation also affected the foam drainage. Compared with Na+, the ability of divalent cations Ca2+ and Mg2+ to slow down foam drainage was stronger, while Ca2+ had stronger ability to slow down foam drainage than Mg2+.
As shown in Figure 3 and Table 1, we captured images of foams containing 50 g/L CaCl2, 50 g/L MgCl2, and 50 g/L NaCl at 5 min, 10 min, and 20 min after foaming through the foam observation device and counted the number of foams in images; their particle size distribution is shown in Figure 4. Particle size distribution during foam coarsening in different systems. (a) 50 g/L CaCl2, (b) 50 g/L MgCl2, (c) 50 g/L NaCl, and (d) APG. In all foam, the number of foams was maintained at a high level at 5 min. Within 5–10 min, the number of foams dropped significantly, and within 10–20 min, the change of the number of foam was relatively small. Considering the 50 g/L CaCl2 foam system as an example, at 5 min, there were 978 foams in the visual field, most of which were relatively small foams. However, at 10 min, the number of bubbles dropped to 389, and at 20 min, the number of bubbles remained at 284, and the number of large bubbles increased. Combining images and statistical data, we found that within 5–10 min, a large number of small foams coarsened into large foams, and within 10–20 min, this phenomenon became less obvious. This is because, in the initial stage, the pressure difference between the relatively large foam and the small foam was large, the gas phase mass transfer rate was fast, and the foam coarsening phenomenon was obvious. With the increase of time, the particle size distribution curve shifted slightly to the right, the number of small bubbles decreased, but the diameter did not change much, and the number and radius of large bubbles gradually increased. The results also show that adding cations were able to slow down the foam coarsening process, and the ability to slow down the coarsening was: Ca2+ > Mg2+ > Na+.
In previous studies, cations have been shown to reduce the stability of anionic surfactant SDS foam systems, and divalent cations affect large monovalent cations [50]. The specific performance was such that the cations aggravated the drainage and foam collapse of the foam. In addition, even after the cation concentration reached a certain level, foaming became difficult. The effect of cations on the APG foam was completely different from that on the SDS foam. APG foam showed good salt tolerance, while SDS foam was completely the opposite.

3.2. Dispersion Characteristics of Cations in Foam Films

3.2.1. Distribution of Cations

We first analyzed the distribution of cations in different system and obtained the relative concentration distribution curves of cations. The radial distribution functions (RDF) g(r) of the surfactants APG and SDS head groups and cations were then calculated, and the g(r) curves were obtained. The distribution of cations around zx (centroid of head groups) was also calculated. Figure 5 shows the relative concentration distribution of cations in the APG foam. We found that in the APG foam system, the cations were mainly distributed in the water layer away from the head groups. Additionally, the relative density distribution of salt ions was basically the same, and the peak value was approximately 5. With the increase of salt ion concentration, this law still maintained. As can be seen from Figure 6,there were almost no cations near the surfactant head groups. Both of these points indicate that the attraction between the head groups of APG and the cation was weak. However, from Figure 7, we can see that in the foams formed by SDS, the cations were close to the head groups of surfactant, which was completely different from the distribution of cations in APG. We can establish that the anti-salt stability of APG foam and SDS foam is related to the interaction between surfactant and cation.
The influence mechanism of cations on the stability of nonionic surfactant (APG) foam and anionic surfactant (SDS) foam was clearly different. Due to the negative charge of anionic surfactant hydrophilic head groups, there was a strong electrostatic interaction with the cations so that the cations gathered around the head groups in large quantities, which, in turn, affected the stability of the foam. However, for nonionic surfactants, the head groups were neutral, and the interaction with cations was weak.

3.2.2. Mobility of Surfactant Head Groups and Surrounding Cations

The cations around the head groups are the key factors affecting the foam stability. We calculated the mean square displacement (MSD) of the head groups and its surrounding cations to evaluate the strength of the interaction between the head groups and the surrounding cations. If the MSD curves of the cation and the head groups were close to each other or overlap, it meant that they were closely bound and their relative positions had not changed. Otherwise, we considered them to be separate from each other, which means that the two interacted weakly. MSD is defined as follows [51]:
M S D t = 1 N i = 1 N ( | r i t r i 0 | 2 )
In the formula, N is the number of target molecules, r i t is the position of molecule i at time t, and r i 0 is the position of molecule i at time 0. MSD can represent the mobility of molecules, and the larger the slope, the higher the diffusion rate of molecules.
We calculated the MSD at the initial 600 ps, and the obtained results are shown in Figure 8 and Figure 9. In the APG foam, the MSD curves of the cation and the head groups were farther and farther apart with increasing time. This indicates that the interaction between the head groups and the cation was very weak, and the cation diffused freely in the solution without being bound by the head groups. In the SDS foam, the MSD curves of cations and head groups of SDS were very close, indicating that the relative positions of cations and head groups were relatively fixed. This is due to the strong electrostatic interaction between the head groups and the cation, and the cations diffused to the vicinity of the head groups will be bound by the head groups, resulting in the aggregation of cations around the head groups.

3.3. Hydration of Surfactant Head Groups and Cations

3.3.1. The Effect of Cations on the Number of Water Molecules near the Head Groups

Selecting the APG head groups as the center, the radial distribution of water molecules was analyzed. Figure 10 represents the APG foam without cation, which can be used as a control. The RDF of APG head groups and water molecules in different concentrations of Na+, Ca2+, and Mg2+ foam was obtained, as shown in the Figure 11. We found that with the addition of metal cations, the number of water molecules around the APG head groups decreased. The decrease in the number of water molecules around the head groups varied with different cation species and cation concentrations, but only slightly, up to 11.8%. From Figure 12, in the SDS foam, the addition of cations was able to greatly reduce the peak value of g(r), which was the most obvious in the foam with Ca2+ added where g(r) decreased by 46.5%. The results show that with the increase of cation concentration, the probability of cations appearing around the head groups (APG) was greater, and the position of the cation was getting increasingly closer to the head groups. As shown in Table 2, in the foam with a concentration of 10 g/L NaCl, Na+ did not appear in the hydration layer of the head groups, but when the concentration was 50 g/L and 100 g/L, there was Na+ in the hydration layer. In the system with Ca2+ added, at the concentration of 10 g/L and 50 g/L, there was no Ca2+ in the hydration layer, and when the concentration was 100 g/L, there was Ca2+ in the hydration layer. In the system with Mg2+ added, when the concentration increased to 100 g/L, there was still no Mg2+ in the hydration layer. From this we can see that the ease of the three cations approaching the APG head groups was: Na+ > Ca2+ > Mg2+.
However, in the process of the cations approaching the head groups gradually, the cations in different positions had different influence mechanisms on the hydration layer of the head groups. On the basis of the evidence provided by the simulation experiments, we propose the mechanism of the influence of cations on the hydration layer of the head groups of nonionic surfactants (APG) at the molecular level. In the process of increasing cation concentration, the cation gradually approached the APG head groups. From Figure 11 and Figure 13, we can found that the ability of cations to attract water molecules was stronger than that of nonionic surfactant head groups; when the overlapping area of the hydration layer of the cation and the hydration layer of the head groups was small, the cation and the headgroups competed for adsorption, reducing the amount of water molecules around the headgroups. Considering Mg2+ as an example, when the concentration was 10 g/L, Mg2+ at a distance of 4.48 angstroms from the headgroups attracted water molecules to form a hydration layer of Mg2+, in the range of approximately 2 angstroms. This range affected the hydration layer of the head groups. This means that Mg2+ competes with the headgroups to adsorb water molecules, so that the ability of the APG head groups to bind water molecules became weaker, and the peak of g(r) decreased. As cations continued to approach the head groups, the overlapping area of the two hydration layers was larger. The strong attraction of cations to water molecules increased the density of water molecules around the head groups, resulting in an increase in the peak of g(r). However, when the concentration increased to a certain value, the cations entered the hydration layer of the head groups and replaced the original position of water molecules, so that the density of water molecules around the head groups gradually decreased, and the peak value of g(r) decreased.
From the results, it can be seen that the addition of cations reduced the water-holding capacity of SDS foam and reduced the stability of the foam. For APG foams, however, cations slightly reduced the number of water molecules in the hydration layer of the headgroups. From this point of view, it was not conducive to foam holding liquid. But cations entered the hydration layer, which may have made it more difficult for the hydration layer to lose water molecules due to the strong attraction of cations to water molecules.

3.3.2. The Diffusivity of Water Molecules in the Headgroups Hydration Layer

We found that in the APG foam with cations, there were two factors that mainly affected the stability and drainage of the foam: one was the number of water molecules in the hydration layer of surfactant head groups, and the other was the diffusivity of water molecules in the hydration layer. Two factors together determined the water retention capacity of the foam. The harder it was for the water molecules to diffuse, indicating that the foam film was in a more stable state, the slower the drainage, and the less likely the foam was to break. From the previous analysis, we know that the number of water molecules in the head groups hydration layer of APG is in a relatively stable state, and the type and concentration of cations have little effect on it. Therefore, we calculated the MSD of water molecules in the head groups hydration layer of different systems to evaluate the ease of diffusion of water molecules in the hydration layer. The results are shown in Figure 14. The results show that the water molecules in the hydration layer of head groups were more difficult to lose after the addition of cations, and the water molecules in the hydration layer of headgroups in the divalent cationic foam were more difficult to diffuse. In the foam system containing three different salts, the water retention capacity of the foam was: Ca2+ > Mg2+ > Na+. Combined with the experimental situation, we can see that in the foam with cations added, the cations were dispersed near or in the hydration layer of the head groups. Due to the strong attraction of cations to water molecules, the diffusion coefficient of water molecules in the hydration layer of head groups was reduced. This enhanced the water retention capacity of the foam and reduced the rate of foam drainage, and this trend increased with increasing concentrations.

3.4. Changes in the Structure of the Surfactant Monolayer

3.4.1. Aggregation of Surfactant Molecules

In previous studies, it was found that the arrangement behavior of the head groups and the tail groups also affects the stability of the foam. We defined the centroid (zx) of the APG head groups and used the g(r) of zx and zx to study the clustering of the head groups. The larger peak value of g(r), the smaller the distance corresponding to the peak value, the more obvious the phenomenon of head groups aggregation. Aggregation of the head groups can disrupt the monolayer structure of the surfactant, making the foam prone to voids and collapse [15]. The effect of different cations on the degree of head groups aggregation is shown in Figure 15 and Table 3. It was found that in the APG foam, the peak value and position of the first peak of RDF did not change much, indicating that the addition of cations would not cause serious aggregation of the head groups. However, in the foam formed by the nonionic surfactant SDS, the addition of salt ions caused obvious head groups aggregation, and Ca2+ was the most likely to cause this phenomenon. In the system without cations, the peak of g(r) was 10.4, the peak of g(r) was 13.2 after the addition of Na+, the peak of g(r) was 13.5 after the addition of Mg2+, and the peak of g(r) was 14.0 after the addition of Ca2+.

3.4.2. Orientation of Head and Tail Groups

To describe the orientation of head and tail groups, we define θhead and θtail, and its rules are as shown in Figure 16. θhead represents the angle between the head groups and the z-axis, and θtail represents the angle between the tail groups and the z-axis. We also define Ltail, which is the distance between the atoms at either end of the tail. A smaller θhead indicates that the head group is more inclined to align perpendicular to the interface. This increases the thickness of the liquid film, which contributes to the stability of the foam [52]. The larger the θtail, the smaller the angle between the tail groups and the interface, which will make a staggered arrangement between the tail groups. This increases the viscoelasticity and disturbance resistance of the foam film, which increases the stability of the foam [22,29]. Furthermore, the compact arrangement will make the diffusion rate of gas molecules slower; that is, it will slow down the coarsening process of the foam. A larger Ltail indicates that the tail chain is stretched out rather than curled up. In Figure 17a, the θhead in the APG foam containing cations is counted. Moreover, it can be found that the addition of cations will make the θhead smaller, which is beneficial for improving the stability of the foam. In the divalent cation system, the probability of the small-angle distribution of headgroups is higher, and it is most obvious in the foams containing Ca2+. From Figure 17b, it can be seen that in the SDS foam, the variation of θhead is consistent with that in the APG foam. However, adding cations makes the θhead smaller and tends to be more obvious, which may be related to the strong electrostatic interaction between the cations and the head groups.
Figure 18 shows the statistical results of θtail and Ltail in different foam. For APG foam, Na+ had little effect on the θtail, Mg2+ and Ca2+ made the θtail larger, and the Ltail increased. In general, the addition of cations reduced the angle between the tail groups and the liquid phase and allowed the tail groups to expand. In this way, a more sufficient staggered arrangement was achieved between the tail chains, which allowed the foam have better viscoelasticity and increased the stability of the foam. For the SDS foam system, the cation increased the interface angle between the tail groups and the liquid phase, and only Ca2+ made the tail chain longer; Na+ and Mg2+ had little effect on the Ltail. However, the decrease of θtail and the increase of Ltail greatly reduced the probability of cross-arrangement of tail groups, which is the one of main reason why Ca2+ greatly reduced the stability of SDS foam.

4. Conclusions

In this work, the effects of common cations on the stability of nonionic surfactant (APG) foams were investigated experimentally and by molecular dynamics simulations and compared with anionic surfactant (SDS) foams. The following conclusions are drawn:
(1)
Through experimental exploration, it is found that cations can increase the stability of APG foam, and its ability to stabilize foam is Ca2+ > Mg2+ > Na+. The greater the cation concentration, the stronger the ability to stabilize foam. It is specifically manifested in slowing down the drainage rate and coarsening process of the foam.
(2)
The distribution of cations in the foam water layer was investigated. It was found that the interaction between the head groups of APG and the cations was small. The cations were distributed mainly in the water layer away from the head groups, and the number of cations around the head groups was less. In SDS foam, however, there were always more cations around the head groups due to the strong electrostatic interaction between the head groups and the cation.
(3)
The hydration of surfactant headgroups and cations was explored by molecular dynamics simulations. It is found that there are two main factors affecting the foam drainage: one is the effect of cations on the number of water molecules in the head groups hydration layer, and the other is the effect of cations on the ease of diffusion of water molecules in the head groups hydration layer. The results show that cations have little effect on the number of water molecules in the headgroups hydration layer of APG. The reason for the stability of the foam is that the addition of cations makes the diffusion of water molecules in the hydration layer more difficult, and its influence is Ca2+ > Mg2+ > Na+. The addition of cations will greatly reduce the number of molecules in the hydration layer of the SDS foam head and reduce its liquid holding capacity, among which Ca2+ is the most severe.
(4)
The addition of cations will change the structure of the surfactant monolayer. In APG foams, cations do not substantially aggregate head groups but make θhead smaller, θtail larger, and Ltail larger. This means that the head groups are more inclined to be aligned perpendicular to the liquid-phase interface, and the tail groups are more inclined to achieve a cross-alignment and cover the gas–liquid interface. This can not only slow down the gas phase mass transfer process of the adjacent foam and slow down the coarsening process of the foam but also increase the viscoelasticity and anti-disturbance ability of the foam film. For SDS foam, although the decrease of θhead is beneficial to the stability of the foam, the decrease of θtail and the increase of Ltail will reduce the strength of the foam film. At the same time, cations can cause local aggregation of SDS molecules, which greatly increases the probability of foam collapse.

Author Contributions

Conceptualization, B.X. and L.T.; methodology, B.X. and N.L.; experiment J.W.; software, B.X.; data curation, L.T.; writing—original draft preparation, B.X. and N.L.; writing—review and editing, Z.Y. and N.L.; funding acquisition and supervision, Z.Y. and N.L.; All authors have read and agreed to the published version of the manuscript.

Funding

This work is subsidized by the project of The Key Laboratory of Well Stability and Fluid & Rock Mechanics in Oil and Gas Reservoir of Shaanxi Province, Xi’an Shiyou University (No. WSFRM20210402001) and the Opening Project of Oil & Gas Field Applied Chemistry Key Laboratory of Sichuan Province (NO. YQKF202010).

Institutional Review Board Statement

The study did not require ethical approval.

Informed Consent Statement

Not applicable.

Data Availability Statement

Not applicable.

Conflicts of Interest

The authors declare no conflict of interest.

References

  1. Wang, J.; Nguyen, A.V.; Farrokhpay, S. A critical review of the growth, drainage and collapse of foams. Adv. Colloid Interface Sci. 2016, 228, 55–70. [Google Scholar] [CrossRef] [PubMed] [Green Version]
  2. Patino, J.M.R.; Sanchez, C.C.; Niño, M.R.R. Implications of interfacial characteristics of food foaming agents in foam formulations. Adv. Colloid Interface Sci. 2008, 140, 95–113. [Google Scholar] [CrossRef] [PubMed]
  3. Rujirawanich, V.; Chavadej, S.; O’Haver, J.H.; Rujiravanit, R. Removal of trace Cd2+ using continuous multistage ion foam fractionation: Part I—The effect of feed SDS/Cd molar ratio. J. Hazard. Mater. 2010, 182, 812–819. [Google Scholar] [CrossRef] [PubMed]
  4. Wen, Y.; Lai, N.; Du, Z.; Xu, F.; Zhang, X.; Han, L.; Yuan, L. Application of orthogonal experiment method in foam flooding system composition and injection parameter optimization. J. Pet. Sci. Eng. 2021, 204, 108663. [Google Scholar] [CrossRef]
  5. Lai, N.; Yuan, L.; Li, W.; Xiong, W.; Yu, G.; Du, Z.; Song, Z.; Wen, Y. Research on the Properties of Natural Gas Foamed Gel as a Profile Control and an Oil Displacement Agent in Strong Heterogeneous Reservoirs. Energy Fuels 2021, 35, 7738–7755. [Google Scholar] [CrossRef]
  6. Evans, L.; Thalody, B.P.; Morgan, J.D.; Nicol, S.K.; Napper, D.H.; Warr, G.G. Ion flotation using carboxylate soaps: Role of surfactant structure and adsorption behaviour. Colloids Surf. A Physicochem. Eng. Asp. 1995, 102, 81–89. [Google Scholar] [CrossRef]
  7. Zhao, T.; Xu, G.; Yuan, S.; Chen, Y.; Yan, H. Molecular dynamics study of alkyl benzene sulfonate at air/water interface: Effect of inorganic salts. J. Phys. Chem. B 2010, 114, 5025–5033. [Google Scholar] [CrossRef]
  8. Yang, W.; Yang, X. Molecular dynamics study of the foam stability of a mixed surfactant/water system with and without calcium ions. J. Phys. Chem. B 2011, 115, 4645–4653. [Google Scholar] [CrossRef]
  9. Das, S.; Nayyar, N.; Bhirud, R.G.; Narayan, K.S.; Kumar, V.V. Precipitation of anionic surfactants in the presence of sodium oleate and calcium ions. J. Am. Oil Chem. Soc. 1994, 71, 757–761. [Google Scholar] [CrossRef]
  10. Sun, L.; Pu, W.F.; Xin, J.; Wei, P.; Wang, B.; Li, Y.B.; Yuan, C.D. High temperature and oil tolerance of surfactant foam/polymer–surfactant foam. Rsc Adv. 2015, 5, 23410–23418. [Google Scholar] [CrossRef]
  11. Wen, Y.; Lai, N.; Li, W.; Zhang, Y.; Du, Z.; Han, L.; Song, Z. Factors influencing the stability of natural gas foam prepared by alkyl polyglycosides and its decay rules. J. Pet. Sci. Eng. 2021, 196, 108039. [Google Scholar] [CrossRef]
  12. Rodríguez-Pérez, M.A.; Campo-Arnáiz, R.A.; Aroca, R.F.; de Saja, J.A. Characterisation of the matrix polymer morphology of polyolefins foams by Raman spectroscopy. Polymer 2005, 46, 12093–12102. [Google Scholar] [CrossRef]
  13. Terriac, E.; Emile, J.; Axelos, M.A.V.; Grillo, I.; Meneau, F.; Boué, F. Characterization of bamboo foam films by neutron and X-ray experiments. Colloids Surf. A Physicochem. Eng. Asp. 2007, 309, 112–116. [Google Scholar] [CrossRef]
  14. Bélorgey, O.; Benattar, J.J. Structural properties of soap black films investigated by X-ray reflectivity. Phys. Rev. Lett. 1991, 66, 313. [Google Scholar] [CrossRef] [PubMed]
  15. Lambert, J.; Cantat, I.; Delannay, R.; Mokso, R.; Cloetens, P.; Glazier, J.A.; Graner, F. Experimental growth law for bubbles in a moderately “wet” 3D liquid foam. Phys. Rev. Lett. 2007, 99, 058304. [Google Scholar] [CrossRef] [PubMed] [Green Version]
  16. Cantat, I.; Renault, A.; Veretennikov, I.; Cloetens, P.; Graner, F.; Glazier, J.A.; Lambert, J.; Delannay, R. Extraction of relevant physical parameters from 3D images of foams obtained by X-ray tomography. Colloids Surf. A Physicochem. Eng. Asp. 2005, 263, 295–302. [Google Scholar]
  17. Heuser, J.; Moller, J.; Spendel, W.; Pacey, G. Aqueous foam drainage characterized by terahertz spectroscopy. Langmuir 2008, 24, 11414–11421. [Google Scholar] [CrossRef]
  18. Chen, Y.; Das, R.; Battley, M. Effects of cell size and cell wall thickness variations on the stiffness of closed-cell foams. Int. J. Solids Struct. 2015, 52, 150–164. [Google Scholar] [CrossRef]
  19. Lai, N.; Zhao, J.; Zhu, Y.; Wen, Y.; Huang, Y.; Han, J. Influence of different oil types on the stability and oil displacement performance of gel foams. Colloids Surf. A Physicochem. Eng. Asp. 2021, 630, 127674. [Google Scholar] [CrossRef]
  20. Tiwari, S.P.; Steckel, J.A.; Sarma, M.; Bryant, J.; Lippert, C.A.; Widger, L.R.; Thompson, J.; Liu, K.; Siefert, N.; Hopkinson, D.; et al. Foaming dependence on the interface affinities of surfactant-like molecules. Ind. Eng. Chem. Res. 2019, 58, 19877–19889. [Google Scholar] [CrossRef]
  21. Li, C.L.; Zhang, T.T.; Ji, X.J.; Wang, Z.K.; Sun, S.Q.; Hu, S.Q. Effect of Ca2+/Mg2+ on the stability of the foam system stabilized by an anionic surfactant: A molecular dynamics study. Colloids Surf. A Physicochem. Eng. Asp. 2016, 489, 423–432. [Google Scholar] [CrossRef]
  22. Hu, X.Y.; Li, Y.; He, X.J.; Li, C.X.; Li, Z.Q.; Cao, X.L.; Xin, X.; Somasundaran, P. Structure–behavior–property relationship study of surfactants as foam stabilizers explored by experimental and molecular simulation approaches. J. Phys. Chem. B 2012, 116, 160–167. [Google Scholar] [CrossRef] [PubMed]
  23. Tang, H.; Song, J.; Zha, M.; He, J.; Yan, Z. Molecular dynamics simulation on the structure–activity relationship between the Gemini surfactant and foam properties. AIChE J. 2022, 68, e17625. [Google Scholar] [CrossRef]
  24. Du, X.; Zhao, L.; He, X.; Chen, H.; Fang, W.; Li, W.X. Ultra-stable aqueous foams with multilayer films stabilized by 1-dodecanol, sodium dodecyl sulfonate and polyvinyl alcohol. Chem. Eng. Sci. 2017, 160, 72–79. [Google Scholar] [CrossRef]
  25. Yan, H.; Guo, X.L.; Yuan, S.L.; Liu, C.B. Molecular dynamics study of the effect of calcium ions on the monolayer of SDC and SDSn surfactants at the vapor/liquid interface. Langmuir 2011, 27, 5762–5771. [Google Scholar] [CrossRef]
  26. Zhao, H.; Sun, H.Y.; Qi, N.; Li, Y. Understanding of the foam capability of sugar-based nonionic surfactant from molecular level. Colloids Surf. A Physicochem. Eng. Asp. 2018, 551, 165–173. [Google Scholar] [CrossRef]
  27. Sun, S.; Zhang, X.; Wang, P.; Wang, H.; Wang, Z.; Luo, J.; Li, C.; Hu, S. Emulsified oil phase induced internal instability of ionic and nonionic foams revealed by coarse-grained molecular dynamics simulation. Comput. Mater. Sci. 2019, 169, 109111. [Google Scholar] [CrossRef]
  28. Wu, G.; Yuan, C.T.; Ji, X.J.; Wang, H.B.; Sun, S.Q.; Hu, S.Q. Effects of head type on the stability of gemini surfactant foam by molecular dynamics simulation. Chem. Phys. Lett. 2017, 682, 122–127. [Google Scholar] [CrossRef]
  29. Li, C.X.; Li, Y.; Yuan, R.; Lv, W.Q. Study of the microcharacter of ultrastable aqueous foam stabilized by a kind of flexible connecting bipolar-headed surfactant with existence of magnesium ion. Langmuir 2013, 29, 5418–5427. [Google Scholar] [CrossRef]
  30. Jang, S.S.; Goddard, W.A. Structures and properties of newton black films characterized using molecular dynamics simulations. J. Phys. Chem. B 2006, 110, 7992–8001. [Google Scholar] [CrossRef] [Green Version]
  31. von Rybinski, W. Alkyl glycosides and polyglycosides. Curr. Opin. Colloid Interface Sci. 1996, 1, 587–597. [Google Scholar] [CrossRef]
  32. Iglauer, S.; Wu, Y.; Shuler, P.; Tang, Y.; Goddard, W.A. Alkyl polyglycoside surfactant–alcohol cosolvent formulations for improved oil recovery. Colloids Surf. A Physicochem. Eng. Asp. 2009, 339, 48–59. [Google Scholar] [CrossRef]
  33. Li, G.; Chen, L.; Ruan, Y.; Guo, Q.; Liao, X.; Zhang, B. Alkyl polyglycoside: A green and efficient surfactant for enhancing heavy oil recovery at high-temperature and high-salinity condition. J. Pet. Explor. Prod. Technol. 2019, 9, 2671–2680. [Google Scholar] [CrossRef] [Green Version]
  34. Li, Q.; Huang, Y.; Wen, D.; Fu, R.; Feng, L. Application of alkyl polyglycosides for enhanced bioremediation of petroleum hydrocarbon-contaminated soil using Sphingomonas changbaiensis and Pseudomonas stutzeri. Sci. Total Environ. 2020, 719, 137456. [Google Scholar] [CrossRef] [PubMed]
  35. Liu, E.-B.; Peng, Y.; Peng, S.-B.; Yu, B.; Chen, Q.-K. Research on low carbon emission optimization operation technology of natural gas pipeline under multi-energy structure. Pet. Sci. 2022. In Press, Journal Pre-proof. [Google Scholar] [CrossRef]
  36. Gao, P.T.; Guo, L.; Sun, J.; Wang, Y.; She, Z.L.; Gao, M.C.; Zhao, Y.G.; Jin, C.J. Effect of alkyl polyglycosides on the performance of thermophilic bacteria pretreatment for saline waste sludge hydrolysis. Bioresour. Technol. 2020, 296, 122307. [Google Scholar] [CrossRef] [PubMed]
  37. Luo, J.; Feng, L.; Chen, Y.; Sun, H.; Shen, Q.; Li, X.; Chen, H. Alkyl polyglucose enhancing propionic acid enriched short-chain fatty acids production during anaerobic treatment of waste activated sludge and mechanisms. Water Res. 2015, 73, 332–341. [Google Scholar] [CrossRef]
  38. Ryan, L.D.; Kaler, E.W. Alkyl polyglucoside microemulsion phase behavior. Colloids Surf. A Physicochem. Eng. Asp. 2001, 176, 69–83. [Google Scholar] [CrossRef]
  39. Chai, J.L.; Wu, Y.T.; Li, X.Q.; Yang, B.; Chen, L.S.; Shang, S.C.; Lu, J.J. Phase behavior of the microemulsion systems containing alkyl polyglucoside and hexadecyl-trimethyl-ammonium bromide. J. Chem. Eng. Data 2011, 56, 48–52. [Google Scholar] [CrossRef]
  40. Wang, Z.N.; Li, G.Z.; Zhang, G.Y.; Diao, Z.Y.; Chen, L.S.; Wang, Z.W. Molecular interaction in binary surfactant mixtures containing alkyl polyglycoside. J. Colloid Interface Sci. 2005, 290, 598–602. [Google Scholar] [CrossRef]
  41. Wang, Q.G.; Wang, D.M.; Wang, H.T.; Xu, C.H. Influence of alkyl polyglucoside and fatty alcohol ether sulfate on the foaming and wetting properties of sodium dodecyl benzene sulfonate for mine dust control. Powder Technol. 2019, 345, 91–98. [Google Scholar] [CrossRef]
  42. Wei, P.; Zhai, K.; Guo, K.; Xie, Y.; Huang, X. Highly viscous liquid foam for oil-displacement: Surface & phase behavior enhancement. J. Pet. Sci. Eng. 2022, 212, 110274. [Google Scholar]
  43. Ding, L.; Jouenne, S.; Gharbi, O.; Pal, M.; Bertin, H.; Rahman, M.A.; Economou, I.G.; Romero, C.; Guérillot, D. An experimental investigation of the foam enhanced oil recovery process for a dual porosity and heterogeneous carbonate reservoir under strongly oil-wet condition. Fuel 2022, 313, 122684. [Google Scholar] [CrossRef]
  44. Marinova, K.G.; Naydenova, K.T.; Basheva, E.S.; Bauer, F.; Tropsch, J.; Franke, J. New surfactant mixtures for fine foams with slowed drainage. Colloids Surf. A Physicochem. Eng. Asp. 2017, 523, 54–61. [Google Scholar] [CrossRef]
  45. Zhang, C.; Xue, Y.; Huang, D.; We, B. Design and Fabrication of anionic/cationic surfactant foams stabilized by lignin–cellulose nanofibrils for enhanced oil recovery. Energy Fuels 2020, 34, 16493–16501. [Google Scholar] [CrossRef]
  46. Niu, W.; Nie, W.; Yuan, M.; Bao, Q.; Zhou, W.; Yan, J.; Yu, F.; Liu, C.; Sun, N.; Xue, Q. Study of the microscopic mechanism of lauryl glucoside wetting coal dust: Environmental pollution prevention and control. J. Hazard. Mater. 2021, 412, 125223. [Google Scholar] [CrossRef] [PubMed]
  47. Sun, H.; Jin, Z.; Yang, C.; Akkermans, R.L.C.; Robertson, S.H.; Spenley, N.A.; Miller, S.; Todd, S.M. COMPASS II: Extended coverage for polymer and drug-like molecule databases. J. Mol. Modeling 2016, 22, 1–10. [Google Scholar] [CrossRef] [PubMed]
  48. Wang, Z.; Lv, Q.; Chen, S.; Li, C.; Sun, S.; Hu, S. Glass transition investigations on highly crosslinked epoxy resins by molecular dynamics simulations. Mol. Simul. 2015, 41, 1515–1527. [Google Scholar] [CrossRef]
  49. Peng, Z.; Ewig, C.S.; Hwang, M.-J.; Waldman, M.; Hagler, A.T. Derivation of class II force fields. 4. van der Waals parameters of alkali metal cations and halide anions. J. Phys. Chem. A 1997, 101, 7243–7252. [Google Scholar] [CrossRef]
  50. Jiang, N.; Yu, X.; Sheng, Y.; Zong, R.; Li, C.; Lu, S. Role of salts in performance of foam stabilized with sodium dodecyl sulfate. Chem. Eng. Sci. 2020, 216, 115474. [Google Scholar] [CrossRef]
  51. Parra, J.G.; Domínguez, H.; Aray, Y.; Iza, P.; Zarate, X.; Schott, E. Structural and interfacial properties of the CO2-in-water foams prepared with sodium dodecyl sulfate (SDS): A molecular dynamics simulation study. Colloids Surf. A Physicochem. Eng. Asp. 2019, 578, 123615. [Google Scholar] [CrossRef]
  52. Xu, C.; Wang, H.; Wang, D.; Zhu, X.; Zhu, Y.; Bai, X.; Yang, Q. Improvement of foaming ability of surfactant solutions by water-soluble polymers: Experiment and molecular dynamics simulation. Polymers 2020, 12, 571. [Google Scholar] [CrossRef] [PubMed]
Figure 1. Foam model. (a) Side view of model, (b) Front view of model.
Energies 15 07684 g001
Figure 2. Drainage process of different foam systems. (a) NaCl, (b) MgCl2, and (c) CaCl2.
Energies 15 07684 g002
Figure 3. Coarsening process of different foams. (a) APG, (b) APG with 50 g/L NaCl, (c) APG with 50 g/L MgCl2, and (d) APG with 50 g/L CaCl2.
Energies 15 07684 g003
Figure 4. Particle size distribution during foam coarsening in different systems. (a) 50 g/L CaCl2, (b) 50 g/L MgCl2, (c) 50 g/L NaCl, and (d) APG.
Energies 15 07684 g004
Figure 5. Distribution of cations in different APG foams. (a) CaCl2, (b) MgCl2, and (c) NaCl.
Energies 15 07684 g005aEnergies 15 07684 g005b
Figure 6. Radial distribution function of cations and zx. (a) APG foam system, (b) SDS foam system.
Energies 15 07684 g006
Figure 7. Distribution of cations in different SDS foams. (a) 50 g/L CaCl2, (b) 50 g/L MgCl2, and (c) 50 g/L NaCl.
Energies 15 07684 g007aEnergies 15 07684 g007b
Figure 8. MSD of surfactant head groups and cations surrounding the head groups in different APG foams. (a) 50 g/L CaCl2, (b) 50 g/L MgCl2, and (c) 50 g/L NaCl.
Energies 15 07684 g008
Figure 9. MSD of surfactant head groups and cations surrounding the head groups in different SDS foams. (a) 50 g/L CaCl2, (b) 50 g/L MgCl2, and (c) 50 g/L NaCl.
Energies 15 07684 g009
Figure 10. RDF of APG head groups and water molecules.
Energies 15 07684 g010
Figure 11. RDF of APG head groups and water molecules in foams with different concentrations of cation. (a) CaCl2, (b) MgCl2, and (c) NaCl.
Energies 15 07684 g011
Figure 12. Radial distribution functions of SDS head groups and water molecules in different cationic foam systems. (a) SDS, (b) SDS with 50 g/L CaCl2, (c) SDS with 50 g/L MgCl2, and (d) SDS with 50 g/L NaCl.
Energies 15 07684 g012aEnergies 15 07684 g012b
Figure 13. RDF of water and cations in APG foams (In hydration layer).
Energies 15 07684 g013
Figure 14. MSD of water molecules in the head groups hydration layer in different APG foams. (a) APG with CaCl2, (b) APG with MgCl2, (c) APG with NaCl.
Energies 15 07684 g014
Figure 15. The RDF of head groups and head groups in different foams. (a) APG foam system, (b) SDS foam system.
Energies 15 07684 g015
Figure 16. Definition of the tilt angle of head groups (θhead) and tail groups (θtail) and the length of tail groups (Ltail).
Energies 15 07684 g016
Figure 17. Distribution of θhead in different foams. (a) APG foam system, (b) SDS foam system.
Energies 15 07684 g017
Figure 18. Arrangement and orientation of tail groups in different foam. (a) APG foam (θtail), (b) SDS foam (θtail), (c) APG foam (Ltail), and (d) SDS foam (Ltail).
Energies 15 07684 g018
Table 1. Variation of the number of foams in different cationic systems with time.
System50 g/L CaCl250 g/L MgCl250 g/L NaClAPG
Time (min)51020510205102051020
Number978389284866328236735288202557204127
Table 2. Minimum distance of cation from head groups in different foam.
System10 g/L NaCl50 g/L NaCl100 g/L NaCl10 g/L MgCl250 g/L MgCl2100 g/L MgCl210 g/L CaCl250 g/L CaCl2100 g/L CaCl2
rmin (Å)3.272.312.034.483.943.424.943.32.71
Table 3. Coordinate of peak value in different foam.
SystemAPGAPG with 50 g/L CaCl2APG with 50 g/L MgCl2APG with 50 g/L NaClSDSSDS with 50 g/L CaCl2SDS with 50 g/L MgCl2SDS with 50 g/L NaCl
r6.475.835.836.434.534.584.735.40
g(r)8.48.38.347.610.414.013.513.2
Publisher’s Note: MDPI stays neutral with regard to jurisdictional claims in published maps and institutional affiliations.

