Abstract
To maintain reservoir pressure, water is injected into oil reservoirs. In carbonate rock, water quickly breaks through fractures and highly permeable formations to production wells. This study analyzes the effect of the permeability, oil viscosity, pressure drop, and distance on the water velocity from an injection well to a production well. In the Tempest MORE hydrodynamic simulator (Roxar), a three-layer model of an oil reservoir was created, and water flow from an injection well to a production well was simulated with various values of the permeability, oil viscosity, and bottom hole pressure. The water velocity in the reservoir was estimated based on the mobility factor (k/µo). The results showed that at a mobility factor of less than 2 μm2/Pa s at a distance of 100 m in the reservoirs, the time of water migration from the injection well to the production well increased sharply, and at a mobility factor of more than 2 μm2/Pa s, it became shorter. An analysis of the time of water migration in fields with high-viscosity oil was conducted. The watering time turned out to be shorter than that predicted by the simulation. The permeability of the reservoir and the viscosity of the oil had the greatest influence on the water velocity. To a lesser extent, the time of water migration was affected by the distance between the wells and the difference in the bottomhole pressures. The average migration time for water with a mobility factor of more than 2 µm2/(Pa s) was 6.3 years. Based on the regression analysis of the field data, a linear equation for the time of water migration was obtained. The resulting equation makes it possible to predict the water cuts of wells and optimize oil production.
1. Introduction
The development of oil deposits is conducted mainly by the injection of water to maintain reservoir pressure. If oil is produced without water injection, then there will be a decrease in the reservoir pressure. The decrease in the reservoir pressure causes decreases in the permeability and oil recovery [1,2]. Managing oil production from reservoirs to maximize the future economic return of an asset is an important issue in petroleum engineering [3]. Water injection contributes to an increase in oil recovery but also leads to an increase in the well water cut. At high value of the layer-by-layer heterogeneity of the reservoir and oil viscosity, the probability of the uneven movement of water along the reservoirs and premature watering of production wells increases [4,5,6].
In the presence of clays in the geological section of the oil reservoir during water injection, a decrease in the permeability is possible due to kaolinite particles blocking the pore channels. In this case, the permeability can decrease to 64% of the initial value [7]. Owing to the incompatibility of the injected and formation water during flooding, salts can be deposited inside the pores of the reservoir rock to reduce the effective permeability, which ultimately affects the fluid flow and thus leads to a decrease in the overall productivity [8]. In addition, a decrease in permeability can occur due to the detachment, migration, and capture of small particles in small-diameter pore channels [9].
The higher the viscosity of the oil is, the stronger the dynamic heterogeneity will be as the displacement process proceeds and the greater the difference in the distribution of flow rates will be in different layers, which will lead to the formation and growth of viscous fingers. The rock wettability and pore-space structure play an important role in determining the dynamics of oil–water flow at the pore scale and affect the final water velocity during waterflooding [10].
Taking into account the properties of the field as well as individual productive zones makes it possible to increase the efficiency of waterflooding [11]. The main causes of the water flooding of wells include cone formation and movement of the water front through layers with high permeability [12,13,14]. The effect of water injection into the reservoir depends on the permeability. The effect of water injection in low-permeability reservoirs is very different from the effect in medium- and high-permeability reservoirs [15]. Therefore, when developing fields, it is important to study the patterns of waterflooding front movement in formations with low permeability [16]. An anisotropic relative permeability not only influences the breakthrough time and waterflood coverage but also has a significant impact on the overall water cut [17].
In oil fields, watering of production wells in the most permeable reservoirs is one of the main problems [18]. To prevent premature watering and increase the production of an oil reservoir, injection of polymers and cyclic flooding are conducted, although gel-forming technologies have been noted for having the highest manufacturability [19]. Therefore, forecasting of the water migration time is an urgent task.
The change in the water cut in wells is often studied based on the production of recoverable oil reserves of various viscosities [20,21,22]. The known parameter dependencies allow the prediction of the water cut at various stages of reservoir development [23,24]. Oil recovery factors depend on the reservoir permeability, dynamic viscosity of the reservoir oil, production levels, and compensation of fluid production by water injection [25]. However, the dependence of the water cut on the oil recovery is applicable for the field as a whole, but it poorly predicts the time at which water will completely fill the oil reservoir. The stimulation of oil production using software allows for the comprehensive assessment of the dynamics of oil and water production by wells and provides forecasts for the near future. Reservoir models are built based on various types of information, including laboratory data on fluids, the results of processing the geophysical characteristics, and well tests. If the reservoir area is poorly covered by wells, then the model will not be accurate. In this case, to predict the production indicators, it is possible to use the equations obtained by processing information from analogous fields.
Along with geological factors [26], the water cut is affected by the development system and well operation modes [27,28,29,30]. With an increase in the water cut, the current oil production often decreases, and the deposition of salts in wells and gathering systems increases [31,32].
In this work, modeling in a hydrodynamic simulator of a section of an oil reservoir with injection and production wells was conducted to estimate the time of water migration between wells. The issue of rapid water movement is especially relevant for oil fields with high viscosities and permeabilities. The model predicted permeabilities of up to 500 × 10−3 µm2 and oil viscosities of up to 100 MPa·s. The dependencies of the water migration time on the reservoir permeability, bottom hole pressure, and oil viscosity were obtained.
Information was collected on fields where a reservoir pressure maintenance system was being created. The actual water migration time from the injection well to the production well was determined. A comparison was made between the actual values of the irrigation time and the model data. Real time is less.
Because the creation of a reservoir model that takes into account all possible natural factors is quite laborious and requires a large amount of information, the use of statistical regression models allows the time of water migration between wells to be quickly predicted with less labor and activity planning in a timely manner.
2. Simulation of Water Movement in Reservoir
Simulations of the movement of water in the reservoir will help to highlight the most significant factors that affect the time it takes for water to move from an injection well to a production well [33]. To assess the estimated water migration time, a model of a reservoir area with production and injection wells was created in the Tempest MORE hydrodynamic simulator (Roxar). In the simulator, the flow of oil (o), water (w), and gas (g) in a porous medium obey Darcy’s law and the equations of continuity of the flow of a weakly compressible multiphase fluid and a Newtonian flow.
The continuity equations for water, oil, and gas include the formation permeability k. The permeability changes its value with changes in the reservoir pressure. The following calculation algorithm is proposed:
- -
- the pressure in the reservoir and the saturation of the reservoir with oil, water, and gas are determined by solving the material balance equation;
- -
- the effective pressure is calculated;
- -
- the fluid flow between cells is determined.
The model consisted of three layers with a thicknesses of 1.5 m. The perforation intervals—the entire thickness of the layers. The distance between the wells was 500 m. The layers were homogeneous. The cell thickness in the model was 1.5 m, and the depth and width were both 25 m. The production and injection of water in the wells were controlled through the values of the bottomhole pressure (Table 1). The calculated initial data is shown in Table 1, Table 2, Table 3 and Table 4.

Table 1.
Initial data for modeling.
Table 2.
PVT for oil (variant 1).
Table 3.
PVT for gas (variant 1).
Table 4.
Relative phase permeabilities in the oil–water system (variant 1).
During the simulation, the value of one of the parameters was changed step by step, and the remaining parameters were not changed. The time of water movement from the injection well to the production was measured. The speed and time of water movement at specified distances were estimated. Figure 1 shows an image of the computational hydrodynamic model.
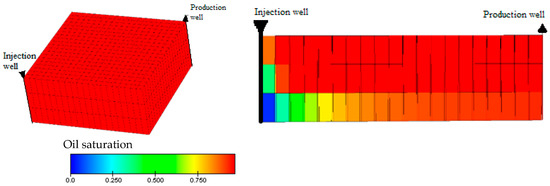
Figure 1.
Hydrodynamic model of the site.
For the effective application of water cut reduction technology, it is necessary to predict the time of water movement through reservoir sections with different permeabilities. When modeling, calculations were performed for the movement of water from an injection well to a production well, depending on the properties of the reservoir oil, reservoir permeability, and bottomhole pressure. The position of the water front in the reservoir was noted by changing the water saturation of the model cells.
The dependence of the velocity of the displacement front on the permeability of the interlayer and the dynamic viscosity of the oil from the simulations is shown in Figure 2. The values in Figure 2 were obtained by determining the time of movement of water from an injection well over a distance of 400 m at various values of the reservoir permeability and oil viscosity. The average speed of the injected water at a permeability of 450 × 10−3 µm2 and a viscosity of 30 mPa·s was 57 m/year.
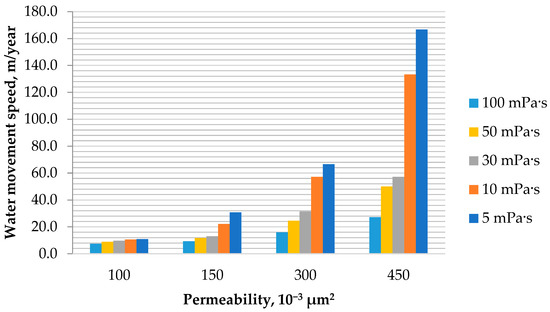
Figure 2.
Dependence of the water movement speed on the permeability and dynamic viscosity of oil (distance of 400 m, Pinj − Pbot = 8 MPa).
The average velocities of the movement of the water–oil front with the increase in the permeability increased significantly, while the travel time decreased. The speed of water movement increased as the mobility coefficient increased (Figure 3). The duration of the movement of the displacement front at a certain distance was influenced by the mobility factor (the ratio of the permeability and dynamic viscosity of the reservoir oil) (Figure 4).
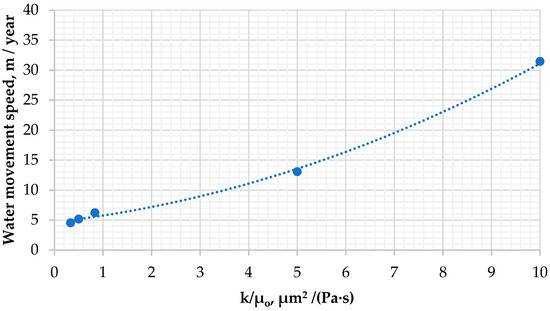
Figure 3.
Dependence of the water movement speed on the mobility factor (distance of 400 m, Pinj − Pbot = 8 MPa).
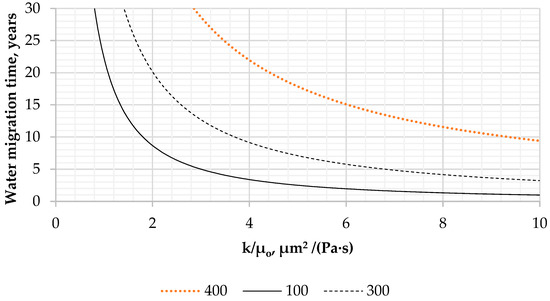
Figure 4.
Dependence of the water migration time on the mobility factor and distances of 100, 300, and 400 m from the production well (Pinj − Pbot = 8 MPa).
The results of the model calculations showed that when water approached a production well, its velocity increased significantly because the filtration area decreased. The mobility factor (k/µo) had the greatest influence on the movement of water. At a distance of 100 m in the layers with a mobility factor of less than 2 μm2/Pa s, the timing of the advance of the displacement front from the injection well to the production well increased sharply. For mobility factors greater than 2 μm2/Pa·s, the time was less than 8–9 years.
3. Water Cut in Fields
Research of the dynamics of the water migration time of the Tournaisian reservoirs of the Nozhovskaya group of fields was conducted (Figure 5). The fields are characterized by a high oil viscosity. The oil reservoirs contained up to 14 oil-saturated permeable layers with a thicknesses from 0.2 to 14.6 m and core permeabilities from 0.00036 to 0.774 µm2. Intensive watering of production wells was observed, which was associated with a high dynamic viscosity of the reservoir oil as well as the presence of bottom water, oil–water zones, and heterogeneity of the reservoir in terms of the filtration properties. During the development of oil reserves from such reservoirs, an uneven movement of the displacement front occurred, and the likelihood of advanced watering of the production wells increased. The geological parameters of the deposits are shown in Table 5.
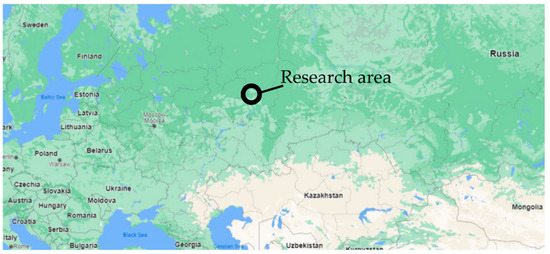
Figure 5.
Research area (using Google Maps).
Table 5.
Geological parameters of the Tournaisian carbonate reservoirs (Nozhovskaya group of fields).
The well was considered to be watered when the water cut was above 80%. The results of the analysis of the field information made it possible to assess the regularity of the water migration time based on the permeability, the distance between the production and injection wells, the bottomhole pressure, and the oil viscosity. Information on the predicted water cut allowed for prompt planning of measures to regulate the oil displacement front by aligning the injectivity and production profiles in the injection and production wells.
A database on the history of the oil and water production by the wells was created (Table 6). The water migration time was determined according to the history of the production wells. The data were compared in terms of the geological parameters of the reservoir and the distances between the wells. The permeability in the well drainage zone was obtained from the results of well tests.
Table 6.
Water migration time from the injection well to the production well.
The results in the table make it possible to find patterns in the water migration time variations with the permeability, the distance between the production and injection wells, the pressure at the bottom of the wells, and the viscosity of the reservoir oil. Information about the predicted water migration time allows the planning of measures to block the reservoirs.
The water migration time was significantly reduced with an increase in the permeability (Figure 6) and mobility factor (Figure 7). If the permeability was greater than 0.25 μm2, the average period of watering did not exceed 6 years. When comparing Figure 6b,c, it can be noted that with an increase in the difference in the bottomhole pressures between the injection and production wells, the water migration time decreased.
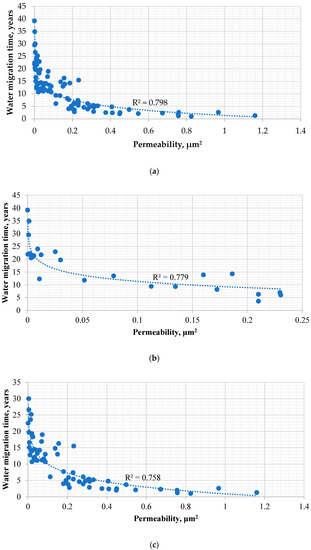
Figure 6.
Dependence of the water migration time on the permeability: (a) all wells, (b) Pinj − Pbot < 10 MPa, and (c) Pinj − Pbot > 10 MPa.
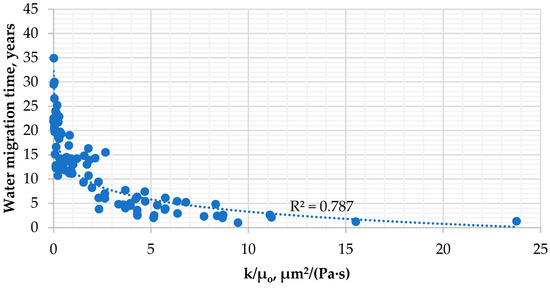
Figure 7.
Dependence of the water migration time on the mobility factor.
The dependence of the water migration time on the mobility factor was plotted. The data dependencies for real wells were similar in trend to the theoretical dependencies built using the hydrodynamic model (Figure 8). However, according to the model, the water migration time from the injection well to the production well turned out to be longer. This was because in the model, the pore space was homogeneous, while in the real oil reservoir, the distribution had a complex structure and communication of voids occurred. This conclusion is consistent with previous results [34], where using an example of sandstone, large differences in the oil production were revealed depending on small changes in the structure of the pore spaces of the rock. It can be concluded that having an accurate understanding of the pore structure in waterflooding is necessary to develop strategies aimed at maximizing the oil recovery.
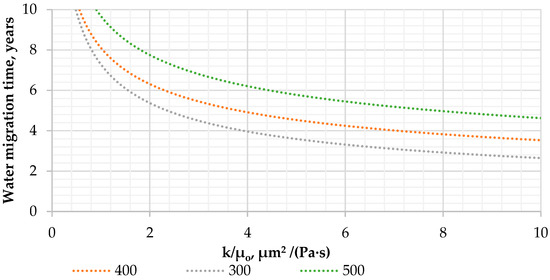
Figure 8.
Dependence of the water migration time on the mobility factor (distances of 300, 400, and 500 m).
The average water migration time with a mobility factor of more than 2 μm2/(Pa·s) was 6.3 years (with a distance between the production and injection wells of 400 m). These results may indicate a longer period for the watering of production wells when predicting using geological and hydrodynamic models.
For the mathematical processing of the data in Table 6, the classical multiple linear regression model was used. It was assumed that the relationship between the parameters could be described by a linear relationship of the form:
where Y is the dependent variable, u is a random component of the model, xi represents the independent variables, and βi represents the regression coefficient.
Y = β1x1 + β2x2 +…+ βixi + u,
The relationship between the dependent variable T and independent variables k, µ, L, Pinj, and Pbot were determined via regression, where the least squares method was used in the regression analysis. The following equation was obtained to estimate the water migration time (years) at a distance L from the injection well:
where L is the distance from the injection to the production well (m), k is the permeability (μm2), µ is the dynamic viscosity of the reservoir oil (Pa·s), Pbot is the bottomhole pressure in the production well (MPa), and Pinj is the bottomhole pressure in the injection well (MPa). For Equation (2), the following limits for the initial parameters should be used:
T = 38.40 − 8.26·log(k/µ·103) + 0.001·L − 0.11·(Pinj − Pbot), R = 0.88,
L: 300 … 500 m, k/µo: 0.1 … 15 µm2/(Pa·s), Pinj − Pbot: 4 … 17 MPa.
A comparison of the predicted (according to Equation (2)) and actual values is shown in Figure 9. Good convergence of the predicted and actual values of the water migration time confirmed the possibility of forecasting using Equation (2).
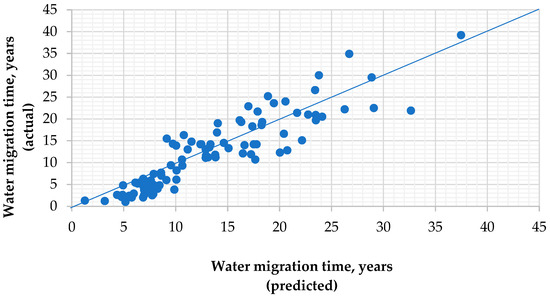
Figure 9.
Comparison of predicted and actual values of the water migration time.
When considering a water migration time of up to 10 years, the predicted and actual values of the water migration time agreed closely. When comparing data from wells that watered after more than 10 years, the discrepancy between the actual and predicted values increased. Wells that flooded 10 years after the start of waterflooding were operating in low permeability formations, so a high accuracy of the water migration time prediction was not required. Equation (2) makes it possible to predict the water migration time within the limits described above. The issue of the water migration time for interlayers with high permeabilities (greater than 0.2 µm2) is especially important. In most of the explored fields, rapid flooding of the wells was observed. As shown by the analysis of the results to identify sources of watering, along with the high viscosity of the reservoir oil, the reasons for the more intensive watering were the advanced penetration of water through the more permeable part (separated layers) of the layered heterogeneous reservoir (56.3%). The fields were developed with low efficiency due to their complex geological and physical structures, i.e., the separation of productive layers into a large number of thin interlayers with a high viscosity of the reservoir oil. Under these conditions, the development of the oil reserves occurred by displacing the oil through the most permeable interlayers with water.
The timely application of polymer or gel compositions makes it possible to increase the oil recovery in oil fields by at least 6% [35,36]. The main goal in conducting such work in wells is to reduce the filtration parameters in the washed part of the formation to reduce the water cut of the product. Under field conditions, various compositions are used to form insulating screens in flooded interlayers, which can significantly reduce the permeability of rock. It is planned to use the proposed equation to identify wells with short watering periods for modeling measures using polymer or gel compositions.
4. Conclusions
A study of the movement of water from an injection well to a production well was carried out using a three-layer reservoir model. It was revealed that the factors with the greatest influences on the time of water movement between wells was the permeability of the rock and the viscosity of the oil. When the ratio of the permeability to the viscosity was more than 2 μm2/(Pa·s), the velocity of the water in the reservoir increased. It is necessary to monitor the course of water migration in reservoirs with high coefficients of mobility in order to plan water shut-off measures in wells.
A database of the time of water movement from injection wells to production wells of the Tournaisian reservoirs of the Nozhovskaya group of fields was established. Through well tests, the permeabilities in the well drainage zone were obtained. Based on regression analysis of the time of water movement, the reservoir parameters, and the pressures at the bottomholes, Equation (1) was obtained. The average water migration time with a mobility factor of more than 2 μm2/(Pa·s) was 6.3 years (with a distance between the production and injection wells of 400 m). Using Equation (1) allows rapid prediction of the time of water movement for wells with high permeabilities in drainage zones and block watered formations.
Author Contributions
V.V.P.: Conceptualization, Methodology, Writing original draft, Investigation. I.S.P.: Formal analysis, Resources, Investigation. V.A.M.: Writing, review & editing. All authors have read and agreed to the published version of the manuscript.
Funding
The research was supported by a grant from the Russian Science Foundation (project no. 19-79-10034). https://rscf.ru/project/19-79-10034/, accessed on 1 October 2022.
Data Availability Statement
Data will be made available on request.
Conflicts of Interest
The authors declare no conflict of interest.
References
- Poplygin, V.V.; Poplygina, I.S. Evaluation of rational bottom-hole pressure for oil deposits with high gas saturation. Neft. Khozyaystvo Oil Ind. 2012, 10, 104–105. [Google Scholar]
- Mordvinov, V.A.; Poplygin, V.V.; Chalov, S.V. Change in the productivity of the obtaining bore holes with the development of the deposits of oil with the high gas saturation. Neft. Khozyaystvo Oil Ind. 2010, 8, 104–106. [Google Scholar]
- Chen, C.; Yang, M.; Han, X.; Zhang, J. Water flooding performance prediction in layered reservoir using big data and artificial intelligence algorithms. In Proceedings of the Society of Petroleum Engineers—Abu Dhabi International Petroleum Exhibition and Conference 2019, ADIP 2019, Abu Dhabi, UAE, 11–14 November 2019. [Google Scholar] [CrossRef]
- Glasbergen, G.; Yeager, V. Model, measure, and optimize fluid placement in formations with reservoir pressure heterogeneities. In Proceedings of the 2010 SPE International Symposium and Exhibition on Formation Damage Control 2010, Lafayette, LA, USA, 10–12 February 2010. [Google Scholar]
- Prasun, S.; Wojtanowicz, A.K. Semi-analytical prediction of critical oil rate in naturally fractured reservoirs with water coning. J. Pet. Sci. Eng. 2019, 180, 779–792. [Google Scholar] [CrossRef]
- Zheng, Q.; Liu, H.; Zhang, B.; Li, N.; Li, F. Identification of high permeability channels along horizontal wellbore in heterogeneous reservoir with bottom water. J. Pet. Explor. Prod. Technol. 2014, 4, 309–314. [Google Scholar] [CrossRef][Green Version]
- Zhou, Y.; Yang, W.; Yin, D. Experimental investigation on reservoir damage caused by clay minerals after water injection in low permeability sandstone reservoirs. J. Pet. Explor. Prod. Technol. 2022, 12, 915–924. [Google Scholar] [CrossRef]
- Khurpade, P.D.; Kshirsagar, L.K.; Nandi, S. Prediction of Reducing Permeability due to Scale Deposition during Water-flood-ing Operations of Crude. Reserv. Pet. Coal 2022, 64, 455–466. [Google Scholar]
- Ligeiro, T.S.; Vaz, A.; Chequer, L. Forecasting the impact of formation damage on relative permeability during low-salinity waterflooding. J. Pet. Sci. Eng. 2022, 208, 109500. [Google Scholar] [CrossRef]
- Ning, T.; Xi, M.; Hu, B.; Wang, L.; Huang, C.; Su, J. Effect of viscosity action and capillarity on pore-scale oil–water flowing behaviors in a low-permeability sandstone waterflood. Energies 2021, 14, 8200. [Google Scholar] [CrossRef]
- Malahov, A.O.; Saifullin, E.R.; Varfolomeev, M.A.; Nazarychev, S.A.; Mustafin, A.Z.; Yuan, C.; Novikov, I.P.; Zharkov, D.A.; Sagirov, R.N.; Kadyrov, R.I. Screening of Surfactants for Flooding at High-Mineralization Conditions: Two Production Zones of Carbonate Reservoir. Energies 2022, 15, 411. [Google Scholar] [CrossRef]
- Al-Khelaiwl, F.T.; Birchenko, V.M.; Konopczynski, M.R.; Davies, D.R. Advanced wells: A comprehensive approach to the selection between passive and active inflow-control completions. SPE Prod. Oper. 2010, 25, 305–326. [Google Scholar] [CrossRef]
- Nasir, Y.; Yu, W.; Sepehrnoori, K. Hybrid derivative-free technique and effective machine learning surrogate for nonlinear constrained well placement and production optimization. J. Pet. Sci. Eng. 2020, 186, 106726. [Google Scholar] [CrossRef]
- Annan, B.E.; Kwami, S.K.O.; Aidoo, B.A.; Brantson, E.T. Critical evaluation of infill well placement and optimization of well spacing using the particle swarm algorithm. J. Pet. Explor. Prod. Technol. 2019, 9, 3113–3133. [Google Scholar] [CrossRef]
- Wang, C.; Sun, Z.; Sun, Q.; Zhang, L.; Zhang, X. Comprehensive evaluation of waterflooding front in low-permeability reservoir. Energy Sci. Eng. 2021, 9, 1394–1408. [Google Scholar] [CrossRef]
- Zeinijahromi, A.; Al-Jassasi, H.; Begg, S.; Bedrikovetski, P. Improving sweep efficiency of edge-water drive reservoirs using induced formation damage. J. Pet. Sci. Eng. 2015, 130, 123–129. [Google Scholar] [CrossRef]
- Li, C.; Wang, S.; You, Q.; Yu, C. A new measurement of anisotropic relative permeability and its application in numerical simulation. Energies 2021, 14, 4731. [Google Scholar] [CrossRef]
- Poplygina, I.S.; Mordvinov, V.A. Using a gel-forming composition to reduce the water rehabilitation of oil wells with high-vision oil. Bull. Tomsk. Polytech. Univ. Geo Assets Eng. 2019, 330, 37–43. [Google Scholar]
- Poplygin, V.V.; Wiercigroch, M. Research of efficiency of complex non-stationary impact on layer with high-quality oil. Bull. Tomsk. Polytech. Univ. Geo Assets Eng. 2020, 331, 7–12. [Google Scholar]
- Xu, L.; Hou, G.; Dai, C.; Shi, Y.; Luo, P.; Wang, Y.; Liang, Y.; Ma, W. New insights into reservoir architecture of Fuyu oil layer in southern Songliao Basin based on analyses of water-flooding characteristics. Energy Explor. Exploit. 2016, 34, 61–76. [Google Scholar] [CrossRef]
- Li, S.; Liu, Y.; Xue, L.; Yang, L.; Yuan, Z.; Jian, C. An investigation on water flooding performance and pattern of porous carbonate reservoirs with bottom water. J. Pet. Sci. Eng. 2021, 200, 108353. [Google Scholar] [CrossRef]
- Zhao, Y.; Lu, G.; Zhang, L.; Yang, K.; Li, X.; Luo, J. Physical simulation of waterflooding development in large-scale fractured-vuggy reservoir considering filling characteristics. J. Pet. Sci. Eng. 2020, 191, 107328. [Google Scholar] [CrossRef]
- Li, Y. The theory and method for development of carbonate fractured-cavity reservoirs in Tahe oilfield. Shiyou Xuebao/Acta Pet. Sin. 2013, 34, 115–121. [Google Scholar] [CrossRef]
- Poplygln, V.V.; Galkin, S.V. Forecast quick evaluation of the indices of the development of the oil deposits. Neft. Khozyaystvo Oil Ind. 2011, 3, 112–115. [Google Scholar]
- Kozhevnikov, E.V.; Turbakov, M.S.; Riabokon, E.P.; Poplygin, V.V. Effect of effective pressure on the permeability of rocks based on well testing results. Energies 2021, 14, 2306. [Google Scholar] [CrossRef]
- Zhao, X.; Qian, Q.; Shi, C.; Wang, J.Y. Determination of dynamic drainage volume in water-flood operations based on fluid flow velocity field delineation. J. Energy Resour. Technol. Trans. ASME 2021, 143, 043003. [Google Scholar] [CrossRef]
- Eldaoushy, A.S.; Al-Ajmi, M.; Ashkanani, F. Utilization of interwell water tracer to study subsurface flow of the injected water and optimize waterflood in mauddud carbonate reservoir, raudhatain field, North Kuwait. In Proceedings of the 2015 SPE Kuwait Oil and Gas Show and Conference, Kuwait, Mishref, 11–14 October 2015. [Google Scholar]
- Mikhailov, N.N.; Melekhin, S.V. The coefficient of oil displacement by water at variable values of capillary number. Neft. Khozyaystvo Oil Ind. 2021, 4, 62–66. [Google Scholar] [CrossRef]
- Seright, R.; Brattekas, B. Water shutoff and conformance improvement: An introduction. Petroleum Science 2021, 18, 450–478. [Google Scholar] [CrossRef]
- Aljubran, M.J.; Horne, R. Prediction of multilateral inflow control valve flow performance using machine learning. SPE Prod. Oper. 2020, 35, 691–702. [Google Scholar] [CrossRef]
- Nwachukwu, A.; Jeong, H.; Pyrcz, M.; Lake, L.W. Fast evaluation of well placements in heterogeneous reservoir models using machine learning. J. Pet. Sci. Eng. 2018, 163, 463–475. [Google Scholar] [CrossRef]
- Tolmacheva, K.I.; Boronin, S.A.; Osiptsov, A.A. Formation damage and cleanup in the vicinity of flooding wells: Multi-fluid suspension flow model and calibration on lab data. J. Pet. Sci. Eng. 2019, 178, 408–418. [Google Scholar] [CrossRef]
- Liu, Z.; Forouzanfar, F.; Zhao, Y. Comparison of SQP and AL algorithms for deterministic constrained production optimization of hydrocarbon reservoirs. J. Pet. Sci. Eng. 2018, 171, 542–557. [Google Scholar] [CrossRef]
- Yang, Y.; Xiao, W.; Bernabe, Y.; Xie, Q.; Wang, J.; He, Y.; Li, M.; Chen, M.; Ren, J.; Zhao, J.; et al. Effect of pore structure and injection pressure on waterflooding in tight oil sandstone cores using NMR technique and pore network simulation. J. Pet. Sci. Eng. 2022, 217, 110886. [Google Scholar] [CrossRef]
- Juri, J.E.; Ruiz, A.M.; Pedersen, G.; Pagliero, P.; Blanco, H.; Eguia, V.; Vazquez, P.; Bernhardt, C.; Schein, F.; Villarroel, G.; et al. Grimbeek2: First Successful Application Polymer Flooding in Multilayer Reservoir at YPF. Interpretation of Polymer Flooding Response. In Proceedings of the SPE Latin America and Caribbean Petroleum Engineering Conference, Buenos Aires, Argentina, 17–19 May 2017. [Google Scholar] [CrossRef]
- Li, J.; Pei, Y.; Wang, Y.; Ma, K.; Jiang, H.; Wei, F. Field Pilot of Gel Barriers Placement for In-Depth Fluid Diversion of Horizontal Wells in Jidong Oilfield. In Proceedings of the IOR 2017-19th European Symposium on Improved Oil Recovery, Stavanger, Norway, 24–27 April 2017. [Google Scholar] [CrossRef]


Publisher’s Note: MDPI stays neutral with regard to jurisdictional claims in published maps and institutional affiliations. |
© 2022 by the authors. Licensee MDPI, Basel, Switzerland. This article is an open access article distributed under the terms and conditions of the Creative Commons Attribution (CC BY) license (https://creativecommons.org/licenses/by/4.0/).