Article

Experimental Study on the Catalyst-Coated Membrane of a Proton Exchange Membrane Electrolyzer

by
Amadeu Gomes Rocha
1,2,
Rui Ferreira
1,2,*,
Daniela Falcão
1,2 and
Alexandra M. F. R. Pinto
1,2,*
1
CEFT—Transport Phenomena Research Center, Faculty of Engineering, University of Porto, Rua Dr. Roberto Frias, 4200-465 Porto, Portugal
2
ALiCE—Associate Laboratory in Chemical Engineering, Faculty of Engineering, University of Porto, Rua Dr. Roberto Frias, 4200-465 Porto, Portugal
*
Authors to whom correspondence should be addressed.
Energies 2022, 15(21), 7937; https://doi.org/10.3390/en15217937
Submission received: 5 September 2022 / Revised: 20 October 2022 / Accepted: 21 October 2022 / Published: 26 October 2022

Abstract

:
Proton exchange membrane (PEM) technology may regulate the electrical grid connected to intermittent power sources. The growing pace of R&D in alternative components is widening manufacturing methods and testing procedures across the literature. This turns the comparison between performances into a more laborious task, especially for those starting research in this area, increasing the importance of testing components accessible to all. In this study, an electrochemical characterization is performed on a commercial single-cell PEM water electrolyzer with commercial catalyst-coated membranes (CCMs) and one prepared in-house. Two membrane thicknesses and the effect of different catalysts are assessed. The thicker membrane, Nafion 117, operates with 5% greater ohmic overvoltage than the thinner Nafion 115, resulting in up to 1.5% higher voltage for the former membrane. Equivalent Ir black CCMs provided by different suppliers and one prepared in-house perform similarly. Regarding the influence of the anode catalyst, Ir black, IrRuOx and IrRuOx/Pt have similar performance, whereas IrOx has worse performance. Compared with Ir black, the mix of IrRuOx/Pt operated with 1.5% lower voltage at 2.6 A cm−2, whereas IrRuOx performed with 2% lower voltage at 0.3 A cm−2. A temporary increase in performance is observed when the anode is purged with hydrogen gas.

1. Introduction

To decrease dependency on fossil fuels, the share of solar and wind power generation technologies in the energy market has been increasing [1]. However, further implementation of these intermittent power sources brings new challenges related to grid stabilization and coordination of power supply and demand [2,3,4,5]. Due to its high energy density, hydrogen gas is an appropriate energy vector that can store the excess power produced from intermittent sources during hours of low electrical demand; a concept regularly called power-to-gas (PTG) [6].
Hydrogen produced by alkaline water electrolysis has been used for a century, mainly by the chemical industry [7,8]. However, compared with this most mature technology, Proton Exchange Membrane Water Electrolyzers (PEM WE) operate with higher energy density, have faster system response, feature higher voltage efficiency and have safer operation [9,10]. This makes PEM WE a more dynamic technology to stabilize the grid from intermittent power generation from renewable sources. However, to further increase market penetration, PEM WE capital costs need to be reduced while the system durability is increased [11]. R&D in the area mostly tackles this problem through research on alternative and cheaper components [11,12,13].
The PEM WE core component is a polymeric solid electrolyte membrane that names the technology. In 1973, Russel et al. [14] applied a solid polymer electrolyte to a water electrolyzer for the first time. By that time, the authors had already considered the hydrogen produced by the system a possible fuel for energy transmission and storage. The state-of-the-art membrane is made of perfluorocarbon-sulfonic acid (PFSA) ionomer. The most used of these materials is Nafion, from Dupont, which is composed of a polytetrafluoroethylene (PTFE) backbone and double ether perfluoro side chains with an external sulfonic acid group [15,16]. Available membranes have a thickness of 50–250 µm. Thicker membranes have greater mechanical stability and better isolate the produced gases and electricity [17,18]. However, thinner membranes benefit from lower overvoltage due to lower proton transport resistance. The protonic conductivity of Nafion membranes increases with temperature and with water content within the operable range of a PEM WE (water content close to saturation and 25 °C to 90 °C). Thus, the operating temperature should be high but without compromising the humidity of the membrane [16].
In PEM WE, the membrane has a catalyst layer coated on both sides, forming the catalyst-coated membrane (CCM) [16]. The oxygen-rich environment from the oxygen evolution reaction (OER) and the high operating voltages of the anode added to the high acidity dictated by the membrane creates a severely corrosive environment that only a few noble metals can withstand. Due to the slow kinetics and high price of the OER catalyst, this catalyst has been one of the most researched components. In 1976, Miles and Thomason found that the catalytic activity order for the OER is Ir ≈ Ru > Pd > Rh > Pt > Au > Nb in 0.1 mol L−1 H2SO4 at 80 °C [19]. The oxides of each of the metals influence the electrocatalytic activities [19]. Of the studied metal oxides, RuO2 was found to have the best catalytic activity, be cheaper and exhibit a metallic conductivity as high as IrO2. However, RuO2 is more prone to corrosion than IrO2 [20,21]. This makes IrO2 the dominant catalyst for the OER, and the loading is currently around 2 mg cm−2 [10,22]. In an attempt to exploit the advantages of both metal oxides, Ir–Ru–Ox mixes are frequently used as OER electrocatalysts [10,23]. Generally, carbon-supported Pt-based materials are the state-of-the-art electrocatalysts for the hydrogen evolution reaction (HER). Pt yields the best activity and shows excellent stability in the PEM WE cathode. The current loading of the cathode catalyst layer ranges from 0.5–2.0 mg cm−2 of platinum nanoparticles supported on carbon black (Pt/C) [10,24].
With the increasing number of studies tackling specific component problems, comparing reported values across the literature is becoming a more demanding and ambiguous task [10,11,22,25]. Bender et al. [22] published a list of 26 design parameters (e.g., membrane thickness and gas permeation, surface area of catalysts, etc.) from the four main components (bipolar plate (BPP), porous transport layer (PTL), membrane and catalysts) that can influence the potential variation of a PEMWE. The authors also reported a distribution of performance from the literature. A 500 mV deviation at 1 A cm−2 for Nafion 115 and 200 mV for Nafion 117 was found [22]. The CCM, one of the main sources of resistances in an operating PEM WE, is generally prepared and assembled following a wide variety of procedures, which may interfere with the CCMs performance [26,27,28,29]. This turns the start of research more complicated for benchmarking performance. Recently, the European Commission [30] published a complete and comprehensive set of harmonized testing protocols and procedures that if commonly agreed upon may increase the coherence of the R&D of PEM WE.
This work aims to present a straightforward PEM WE performance assessment on commercial components and provide a plain explanation of the analysis of electrochemical methods used to characterize in situ single-cell PEM devices. These options are publicly available and generally serve as a starting point for experimental PEM WE technology research. Independent characterization of these components allows starting laboratories to fine-tune experimental set-ups. This article reports PEM WE performance using commercial CCMs with different features. The tested CCMs have different membrane thicknesses and different catalyst types. Equivalent CCMs from two different suppliers are evaluated and compared with a third equivalent CCM prepared in-house. Additionally, the effect of increasing the operating temperature from 25 °C to 80 °C is assessed on one of the CCMs. In this work, we also report data on the effect that short hydrogen purges have on the PEM WE performance. This effect, which is rarely reported, was recently highlighted by Rheinländer et al. [31], as the authors conclude that during open circuit voltage (OCV), in a PEM WE operating with the cathode pressurized, the hydrogen crossover would promote the anode catalyst reduction. Additional data on this effect can be relevant for the literature, as although this effect increases the OER activity, it may also lead to the formation of a less stable catalyst and cause its premature degradation [31].

2. Experimental

2.1. Electrolyzer

In Figure 1, an open view of the commercial electrolyzer used in this study is shown (EC-EL-05 from ElectroChem Inc., Woburn, MA, USA). The electrolyzer has an active area of 5 cm2. It is composed of titanium BPPs with column/pin type flow fields (Figure 1a). A 0.3 mm-thick Pt coated Ti felt (Bekaert, Zwevegem, Belgium) was applied as PTLs (Figure 1b). Each tested CCM was assembled with new PTLs and sealed with silicone gaskets with 0.3 mm of thickness. The applied torque was 3.5 N·m in each of the twelve bolts. The device operating temperature was measured near the active area with a type-K thermocouple. Its heating system consists of two 60 W silicone rubber heaters (SR3033 G17, Durex Industries, Cary, NC, USA) attached to each side of the cell.

2.2. CCMs

In Table 1, the list of CCMs and their features under the scope of this work are shown. The number assigned to each CCM respects the chronological sequence in which the CCMs were tested. In the rest of this document, the respective number of the CCM is always mentioned whenever a CCM is referred to.
Electrochemical tests on the PEM WE assembled with CCMs 1, 2 and 8, allow to compare similar CCMs acquired from two different suppliers (QuinTech and Fuel Cells Etc) and one prepared in our laboratories. With CCMs 3, 4, 6 and 7, different anode catalysts were assessed (Ir black, IrOx, IrRuOx/Pt and IrRuOx, respectively). The CCM 5 differs from the 7 concerning the membrane thickness: Nafion 117 (0.183 mm) is thicker than Nafion 115 (0.127 mm).
During the 750 h of operation that this study took, and the multiple CCMs tested, a crescent ohmic loss was perceived. This degradation was experimentally confirmed to be on the BPPs through the repetition of test samples. This effect was cautiously pondered in the results to permit comparison of the CCMs.

2.3. CCM In-House (8) Preparation Procedure

The in-house CCM (8) was prepared by spray deposition on the membrane. The membrane was pre-treated in H2O2 for half an hour at 80 °C. After cooling, it was rinsed and bathed in distilled water for half an hour at 80 °C. The procedure was repeated with H2SO4 and rinsed again with distilled water. Before spraying, the membrane was dried in absorbent paper for half an hour.
The cathode side was coated with 1 mg Pt cm−2, while the anode side was coated with 2 mg Ir cm−2. In both cases, the ink was prepared with the necessary amount of the powder catalysts (platinum on graphitized carbon, 20% Pt/Vulcan XC72 by Sigma-Aldrich for the cathode and Ir black, 99.8% purity metals basis, by Alfa Aesar for the anode), 15 wt% of Nafion (from a 5 wt% Nafion solution in lower aliphatic alcohols, by Sigma-Aldrich) and 2-propanol (by VWR Chemicals) as solvent. The mixing was performed by ultrasonication for thirty minutes. Additionally, in each 10 min interval, the ink was mixed manually. The ink was sprayed first in a PTL to weigh the amount of ink necessary to spray in the membrane. Weighting the membrane directly could not be performed due to the variation of the humidity content, as Nafion is extremely sensible to water. The spraying was performed in a vertical horizontal crisscross pattern in a 40 °C heated plate.

2.4. Test Setup

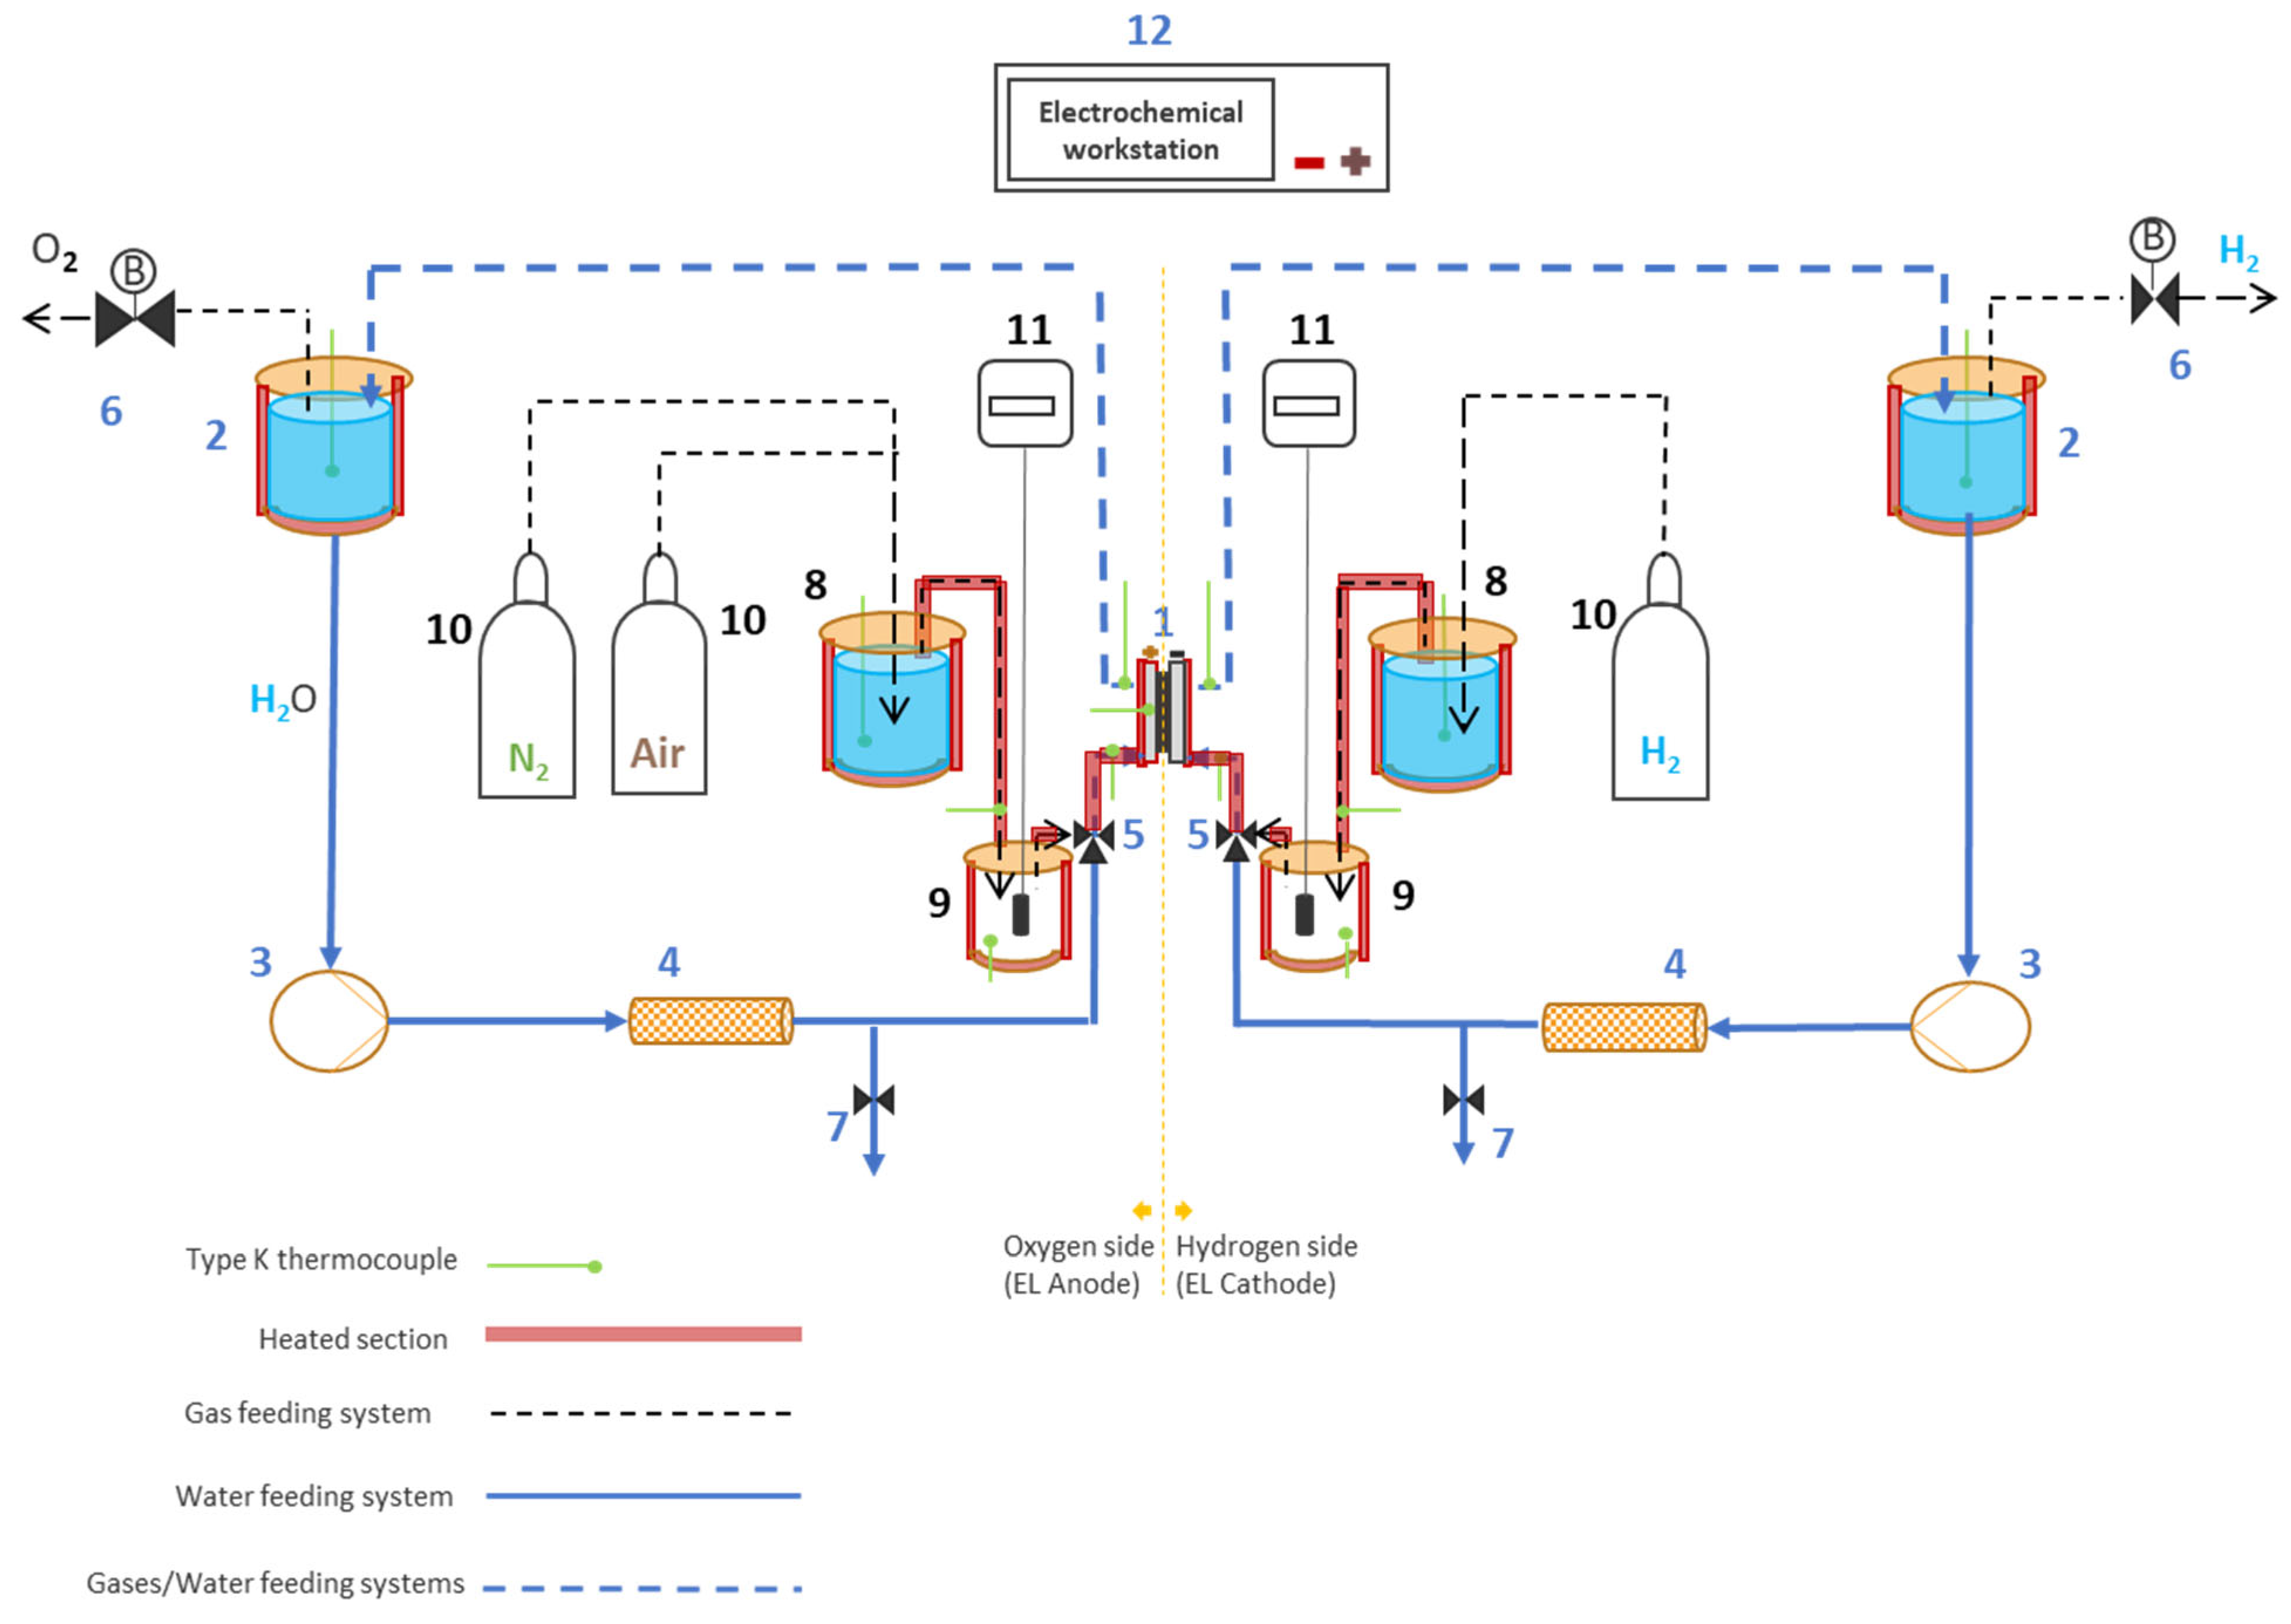
As seen in Figure 2, the setup has two feeding systems. One for water (represented by blue full lines and components numbered in blue) and another for gases (represented by dashed black lines and exclusive components numbered in black). Downstream of the three-way valves, the tubing is common for gases and water (represented by dashed blue lines).
The system allows feeding water to both the electrodes. Peristaltic pumps (NE-9000, New Era Pump Systems, Inc, Farmingdale, NY, USA) transport demineralized water from the feeding tanks (Stainless steel, AISI 304, Tecnogial, Matosinhos, Portugal) through the ion exchangers (Omniflow Protect+ion, i2M, Raleigh, NC, USA) to the electrolyzer. The ion exchangers guarantee that the water conductivity is maintained below 1 µS cm−1. This was verified before the tests of each CCM by taking a water sample through the water discharge valve (Swagelok, Solon, OH, USA). This valve also allows refilling of the water tanks. As the electrolysis reaction occurs in the electrolyzer, the evolved gases flow back to the water feeding tanks. Two back pressure regulators (BPR-1, Swagelok) connected to these tanks allow pressurizing the system up to 2 bars (pressure limit dictated by the ion-exchangers). Thus, the setup can operate with differential pressure or equal pressure on both sides. The heated sections of the setup are shown as a thick red line in Figure 2. These are heated with flexible heaters (FTSO 50 W m−1, Flexelec, Saint-Bonnet-de-Mure, France) and are installed at the tanks and in the tubing upstream of the electrolyzer. The temperature measurements are performed with type-K thermocouples that measure the water temperature at the tanks and at the PEM WE inlets and outlets. All the tubing is covered with Armaflex thermal isolation or glass wool.
The three-way valves (Swagelok) allow changing between the water and gas feeding systems. The latter enables Cyclic Voltammetry (CV) and Linear Sweep Voltammetry (LSV) tests at different temperatures and to operate a fuel cell or a Unitized Regenerative Fuel Cell (URFC). The feeding gases are bubbled into the humidification tanks heated water, and their humidity content is measured by a humidity probe (HMT337, Vaisala, Vantaa, Finland). An electrochemical workstation (Zahner Zennium with a PP 241 potentiostat, Zahner, Kronach, Germany) is used to operate the PEM electrolyzer and perform the electrochemical tests. The PP 241 has a potential accuracy of ±0.1%/±1 mV and current accuracy of ±0.25%/±1 mA.

2.5. Conditioning

Every testing day began with the deaeration of the anode water tank with N2. Each CCM was conditioned for two days before the electrochemical characterization at different temperatures. The conditioning is performed to stabilize the performance. On the first day, the PEM WE were operated in intervals of 20 min at 1.5 and 1.7 V, first at 60 °C and then at 80 °C. The conditioning at each temperature was terminated after two identical I-V curves were obtained after operation at 1.7 V. On the second day, the electrolyzer was operated at 60 °C and 0.2 A cm−2 for 10 h. The performance stability was recorded, and the effect of the conditioning was assessed through I-V curves performed at the beginning and end of the 10 h period.

2.6. Electrochemical Characterization

For the same purpose as the conditioning, a reconditioning procedure was performed at the beginning of the other testing days by setting a current of 0.2 A cm−2 for 20 min at room temperature. In the preparation for this study, different CCMs from the same batch were tested multiple times. This was also carried out when unexpected results were retrieved. Because every time we tested different units of equivalent CCMs a high reproducibility was seen (overlapping curves), this repetition was not performed for all tested CCMs.
In situ CV and LSV tests were performed at 25 °C and ambient pressure, at the beginning of each operating day. For the in situ CVs, only the anode was analyzed, and the cathode was used as both reference and counter electrode. CV was carried with 50 mL min−1 of deaerated water flowing at the anode and humidified H2 flowing at the cathode. Two CV tests were performed for each measurement. Each CV test was comprised of three cycles in which the anode was cycled three times between 0.4 V and 1.4 V at 20 mV s−1. The coulombic charge of the first cycles was not taken into consideration, and the last two cycles of each test were averaged. This charge was obtained through the integration of the positive part of the respective voltammograms. Due to the reaction mechanisms of the oxygen evolution reaction in acidic media on iridium-based catalysts being not fully understood, each reported charge density is only compared with others obtained with the same CCM [32,33]. For the LSV tests, humidified H2 was fed to the anode of the electrolyzer, which was used as counter and reference electrode, while humidified N2 purged the cathode. Three measurements were made between 0.1 V and 0.4 V at 2 mV s−1 for each LSV test. The membrane hydrogen crossover was obtained by averaging the current density obtained at 0.3 V of the last two measurements.
Before each I-V curve or EIS test, the electrolyzer was left in OCV for 10 min, followed by 5 min at a current density of 0.1 A cm−2. Polarization curves were drawn stepwise in galvanostatic mode, increasing the current from 5 mA cm−2 up to a cut-off voltage of 2 V with a hold time of 1 min on each point. The curves were repeated until two identical curves were obtained. EIS tests were performed at 1.5 V, 1.6 V and 1.7 V in a range from 100 mHz to 100 kHz with a 10 mV AC amplitude excitation and with a hold time of 3 min. Both EIS and I-V curves were performed at 25 °C, 40 °C, 60 °C and 80 °C ambient pressure and 60 mL min−1 water flow rate at both anode and cathode. The ohmic resistance (Rohm, related to the purely ohmic resistances) was obtained through the intersection of the Nyquist plots with the lower value intersection of the arc with the real part of impedance, Z’ axis. The total overvoltage for each potential was obtained by the difference between the reversible voltage and the operating voltage. The activation overvoltage (ƞact, related to reaction kinetics) was retrieved from the difference between the total overvoltage and the ohmic overvoltage ƞohm (which was calculated directly from the Rohm). The total overvoltage was considered to be the voltage above the reversible voltage (1.23 V).

3. Discussion and Results

Before reporting the main results, a brief discussion about the first hours of operation with each CCM is presented. It is common to see long conditioning times across the PEM WE literature (16 h [34], 300 h [35] and overnight [36]). However, in this study, the performance obtained at the end of the first conditioning day, which took 8 h at maximum, was sufficient to obtain at least 98% of the best performance achieved with each CCM. During the second day, the tested CCMs operated steadily at a current density of 0.2 A cm−2 for 10 consecutive hours at 60 °C, and no performance improvement was observed. In fact, the performance slightly decreased during this period. The maximum voltage efficiency loss was obtained with the IrRuOx 117 (5) and IrOx (4), which had a voltage increase of 0.03 V during this period. However, after an operation stoppage of 10 min, which preceded our I-V curve procedure, the WE already reversed some of that loss of performance.

3.1. Suppliers Comparison

In Figure 3, it is shown a comparison of the I-V curves and respective overvoltages obtained at 80 °C from a CCM prepared in-house (8) and equivalent CCMs supplied by QuinTech (1) and Fuel Cells Etc (2). Figure 3A shows PEM WE I-V curves at ambient pressure. The current density (x-axis in A cm−2) is proportional to the hydrogen being produced, and the voltage (y-axis) represents the potential difference being applied to the WE. Therefore, the I-V curves easily permit observing the overall WE performance under different operating conditions. The curves are divided into two distinct parts. The first part, at lower current densities, with a logarithmic shape, is a range of operation in which the ohmic overvoltages are negligible compared with the activation overvoltages (about 88% of the total overvoltage at 240 mA cm−2 for QuinTech (1)). The activation overvoltages are mainly due to the kinetic hindrances of the reactions, and their relation with the current density increase is depicted in Figure 3B. The second and linear part of the PEM WE I-V curve is a region where the ohmic overvoltages greatly increase their share in the total overvoltage (about 38% of the total overvoltage at 1.40 A cm−2 for QuinTech (1)). These overvoltages are called ohmic due to their linear relation between the voltage and the current density and result from the resistance to the transport of charges through the membrane and metallic components of the PEM WE. Their relationship with the current density increase is shown in Figure 3C.
In Figure 3, it is possible to see that the three CCMs operated similarly. The maximum difference in performance was observed at the highest current density. At 2.4 A cm−2, the QuinTech CCM (1) operated at 1.85 V and the in-house (8) at 1.89 V. Because no significant ohmic overvoltages are seen, in Figure 3, it is discovered that the small difference between the commercial (1 and 2) and the in-house (8) is related to higher activation overvoltages in the in-house (8). A note to the process of preparing CCMs is that on our first try assembling catalysts in a Nafion membrane, we obtained a normal WE performance.

3.2. Membrane Thickness Effect

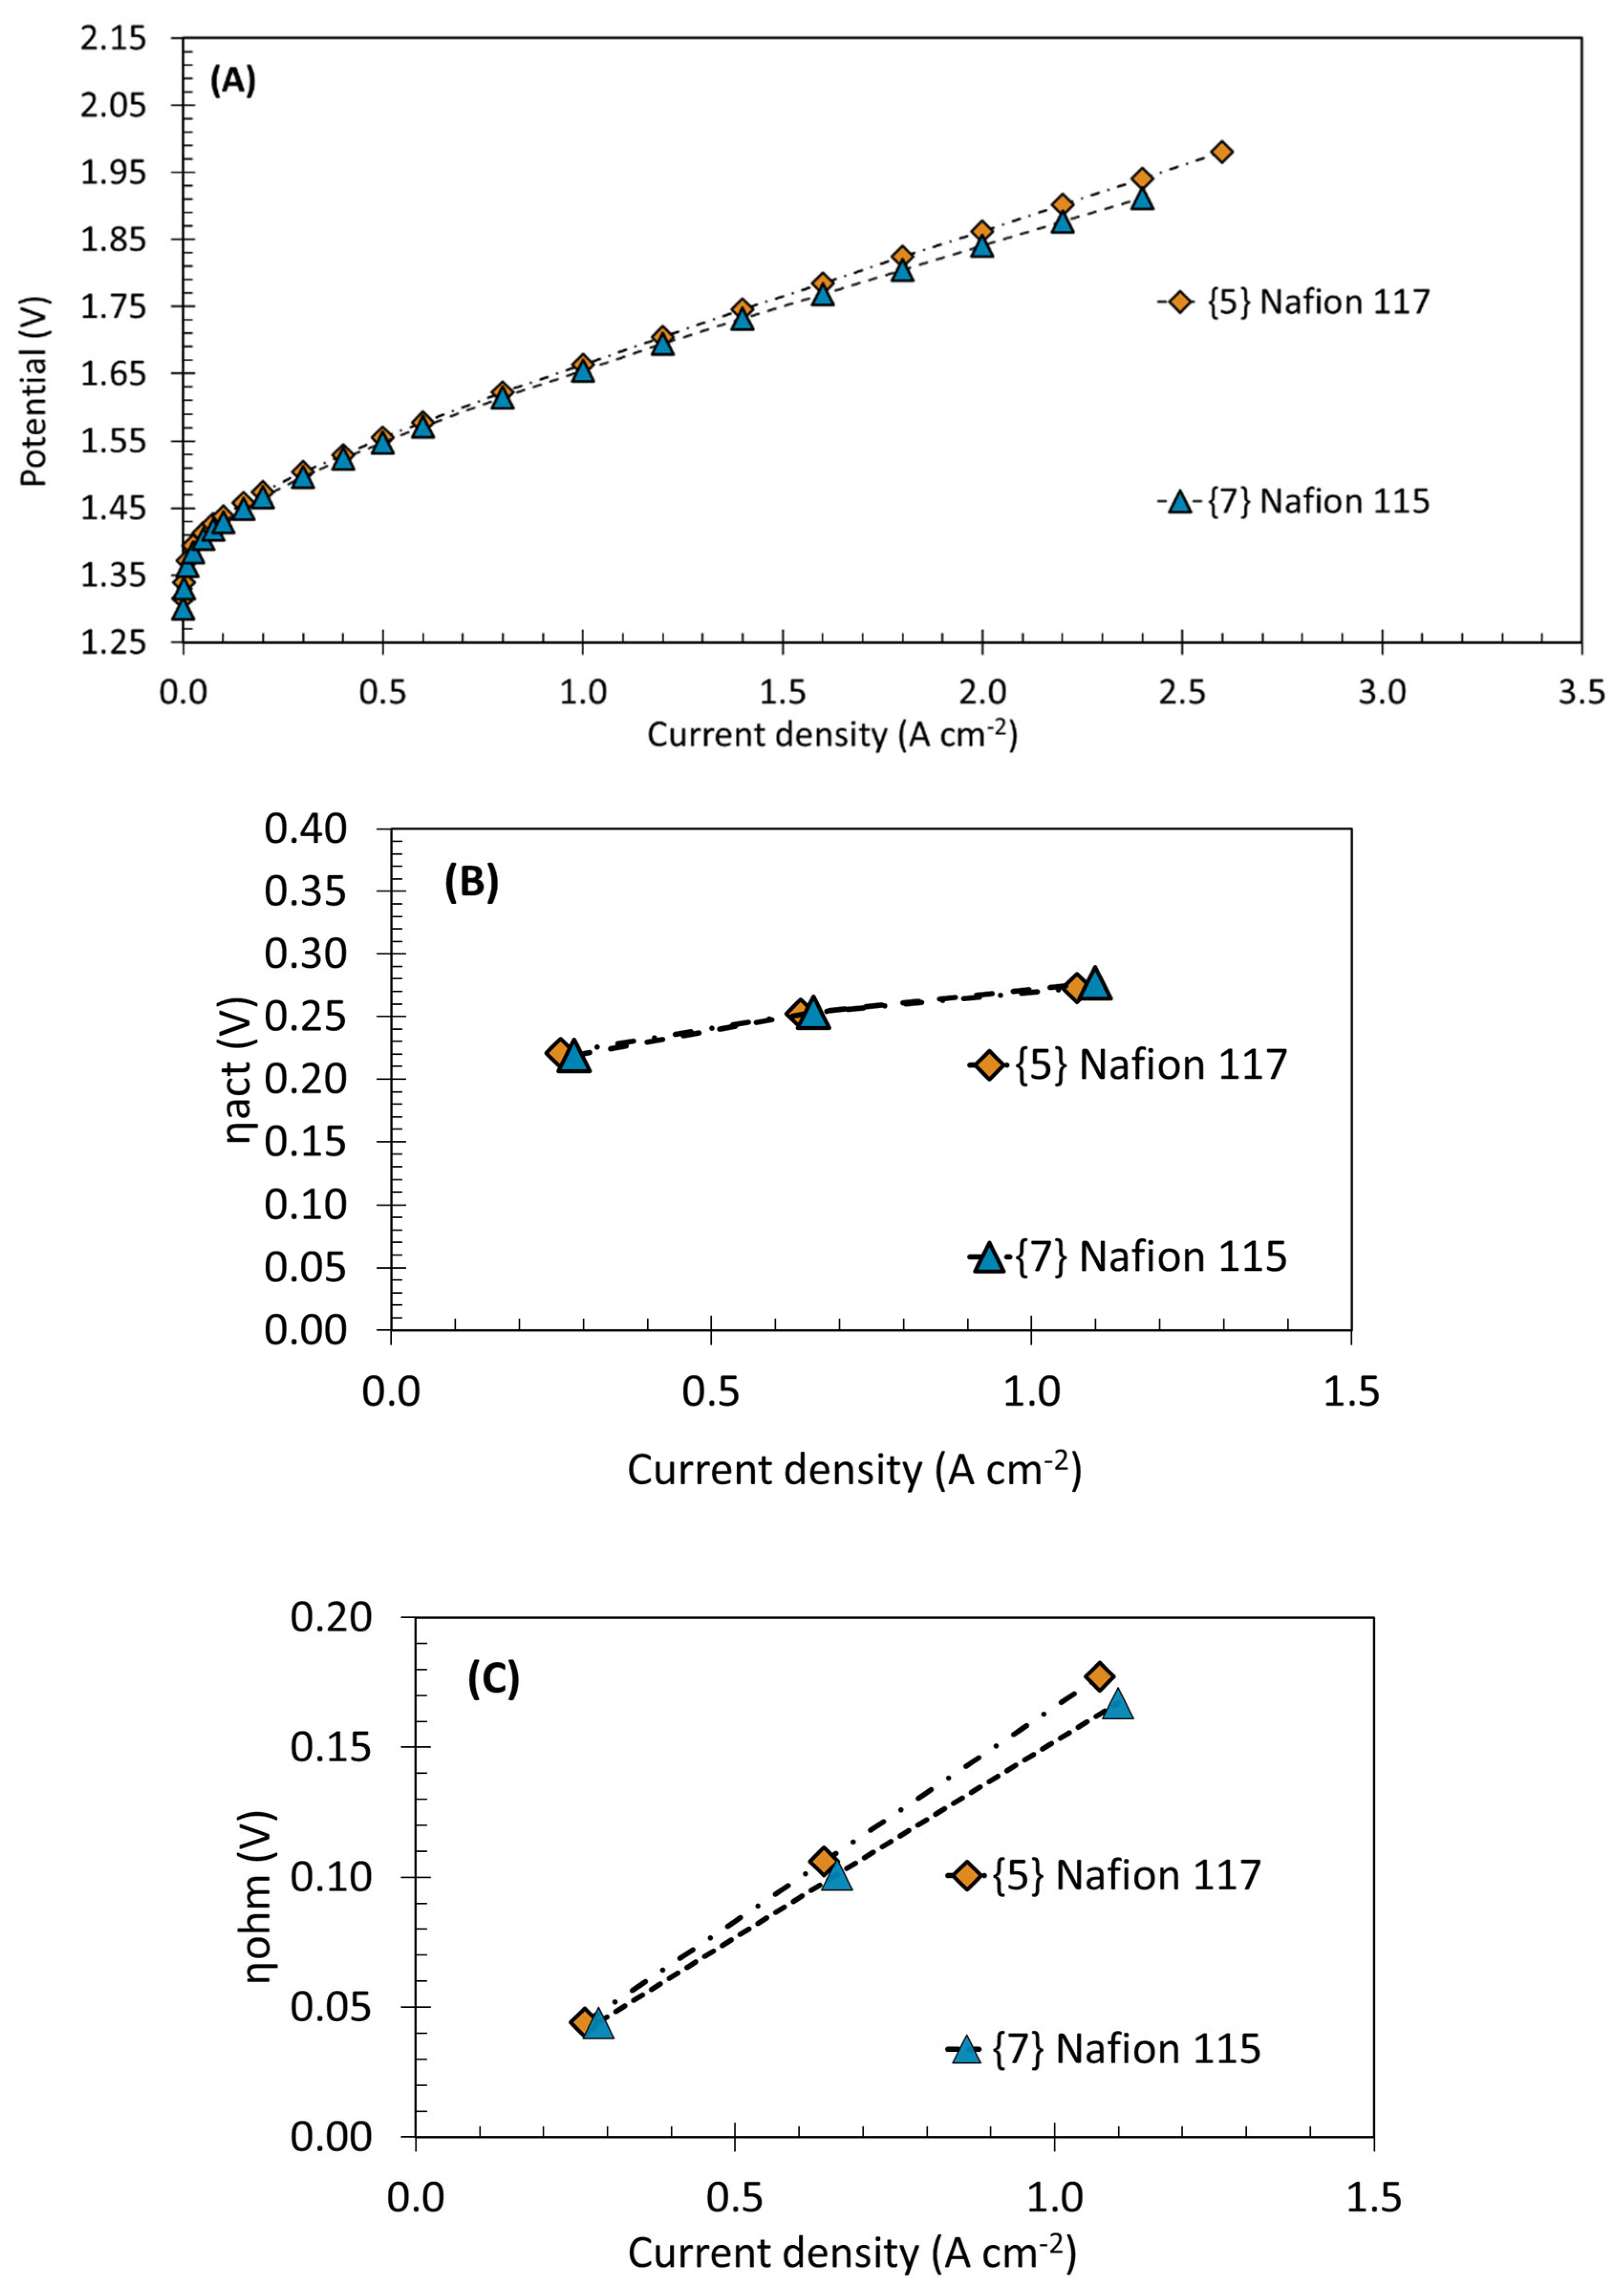
To assess the effect that the membrane thickness has on PEM WE performance, a CCM with Nafion 115 (7) was compared with a CCM with Nafion 117 (5). Both these CCMs were supplied by Fuel Cells Etc and are equal in catalyst type and loading. Their I-V curves and overvoltage plots can be seen in Figure 4. The CCM with the thicker membrane (5) has higher ohmic overvoltage than the CCM with the thinner membrane (7) for the greater current densities. This is mainly due to the higher distance that the protons need to cross in the thicker membrane, resulting from an increased transport drag in the thicker membrane [16,37]. However, the I-Vs in Figure 4A show that the difference in performance is only noticeable for higher current densities. This small impact of this range of membrane thicknesses (0.127–0.183 mm) is in accordance with some literature [38,39,40]. The superior thickness of the Nafion 117 (5) adds an advantage to the endurance of the membrane, with only a 5% greater increase in ohmic overvoltages over the tested range of current densities.
Although the membrane thickness effect is already known, it is important to report this effect in other devices and experimental apparatus. Although the overall conclusion is similar to others, the values obtained through the experimental data are not.

3.3. Catalyst Type Effect

As depicted in Figure 5, the CCM with IrRuOx catalyst (7) is at the same time the CCM with lower activation overvoltage and higher ohmic overvoltage at higher current densities. The lower activation overvoltage of this catalyst is in accordance with the literature, as it is the catalyst with the highest kinetic activity for WE used in this set [41,42]. In comparison, the CCM, which has half the content of IrRuOx and half the content of Pt (6) (which corresponds to a CCM designed for a URFC), operated with similar activation overvoltage but with lower ohmic overvoltage. If the Fuel Cells Etc preparation procedure for the IrRuOx (7) and the IrRuOx/Pt (6) CCM was equivalent, the lowest ohmic overvoltage suggests that the presence of the Pt can decrease the contact resistances between the catalyst layer and the Pt/Ti PTL or allow better binding properties with the Nafion. Despite these differences, the IrRuOx (7), IrRuOx/Pt (6) and Ir black (3) produced similar results (1.6 V at 1 A cm−2) which, as far as the authors’ know, are within the typical performances found in the literature. In their PEM WE review, Kumar et al. [11] retrieved performances ranging from 1.56 V up to 1.80 V with Ir black and IrRuO2 at 1 A cm−2. The only CCM in this study that produced significantly different results is the IrOx (4) (1.77 V at 1 A cm−2). The worse performance of this CCM was due to its significantly greater activation overvoltage, as it is shown in Figure 5B. After achieving a potential great enough (>1.5 V) to overpass the reaction resistances, the variation of the ohmic overvoltages with the current density has a behavior similar to the rest of the CCMs. The significantly higher activation overvoltages (approx. 45% higher) for the IrOx catalyst were not expected by the authors of this study. The literature shows higher performance for this catalyst [42,43,44]. Three samples of the IrOx CCM (4) were tested, one from a different batch from the other two, and all the performances retrieved were similar. The performance of this catalyst is highly dependent on the preparation conditions [45]. Due to IrOx being acquired as a customized order and not appearing in the Fuel Cells Etc website as a standard option, it is possible that the manufacturer does not have its assembly procedures so optimized with this catalyst. Similar to the in-house (8), our group also tried to prepare a CCM with IrOx. However, although our first efforts to produce a PEM WE CCM with Ir black were well succeeded, our attempts to obtain an IrOx CCM delivered virtually non-functional CCMs. This suggests that Ir black may be a more straightforward catalyst to whoever is beginning the preparation of PEM WE CCMs.

3.4. Temperature and Operating Voltage Analysis

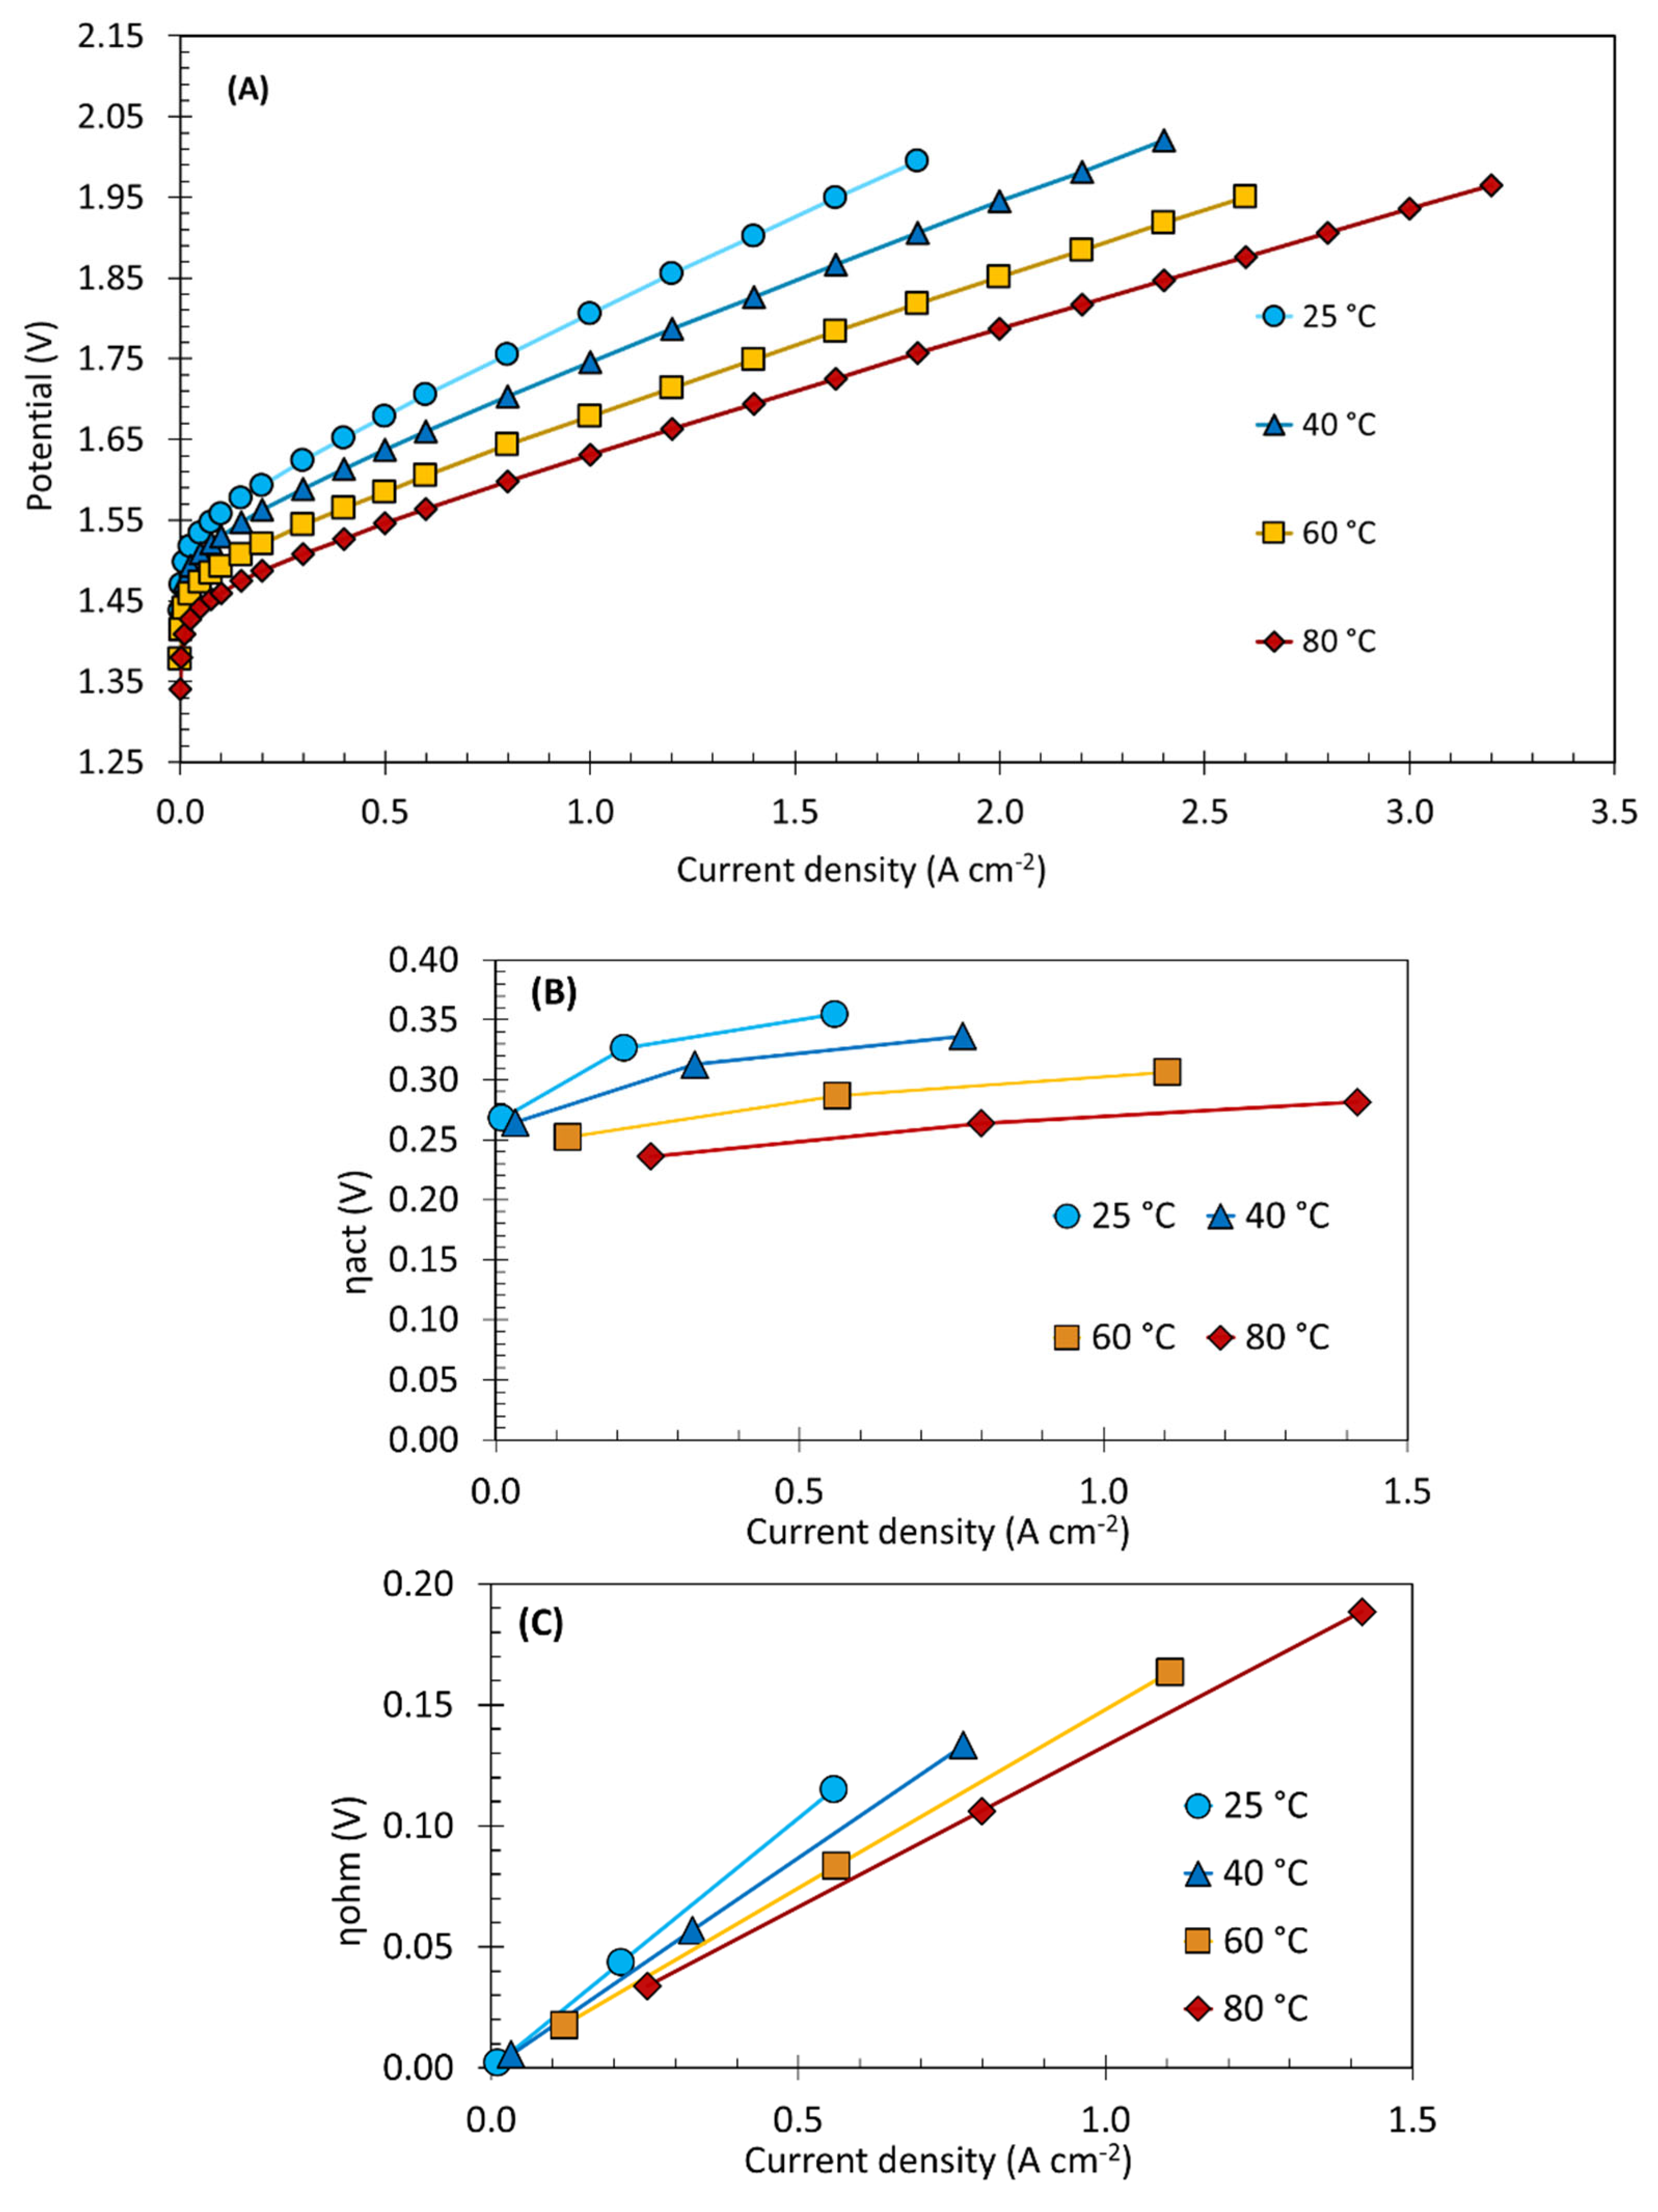
The effect of the temperature increase on WE performance was similar to all CCMs. Therefore, only the data from the QuinTech CCM (1) at 25 °C, 40 °C, 60 °C and 80 °C are shown in Figure 6.
In Figure 6A, it is possible to see that a temperature increase benefits both the logarithmic and linear regions of the curves. This means, respectively, that the increase in performance is due to both a decrease in activation and ohmic overvoltages, as verified in Figure 6B,C. It is known that higher temperatures benefit the transport of charges through the system, especially the proton conductivity in the membrane, therefore decreasing ohmic resistances. Additionally, higher temperatures ease the catalytic system, thus decreasing activation resistances [18]. The data observed in Figure 6B,C also show that the overvoltages decrease is greater when increasing the temperature from 25 °C to 40 °C and from 40 °C to 60 °C than in the range of 60 °C to 80 °C. Although higher temperatures favor the electrolysis processes, they may also intensify the degradation processes of membrane thinning and passivation of Ti components, reducing the durability of the PEM WE [34,46]. Therefore, the performance/durability trade-off must be considered with caution when choosing the operating temperature.

3.5. Hydrogen Purge

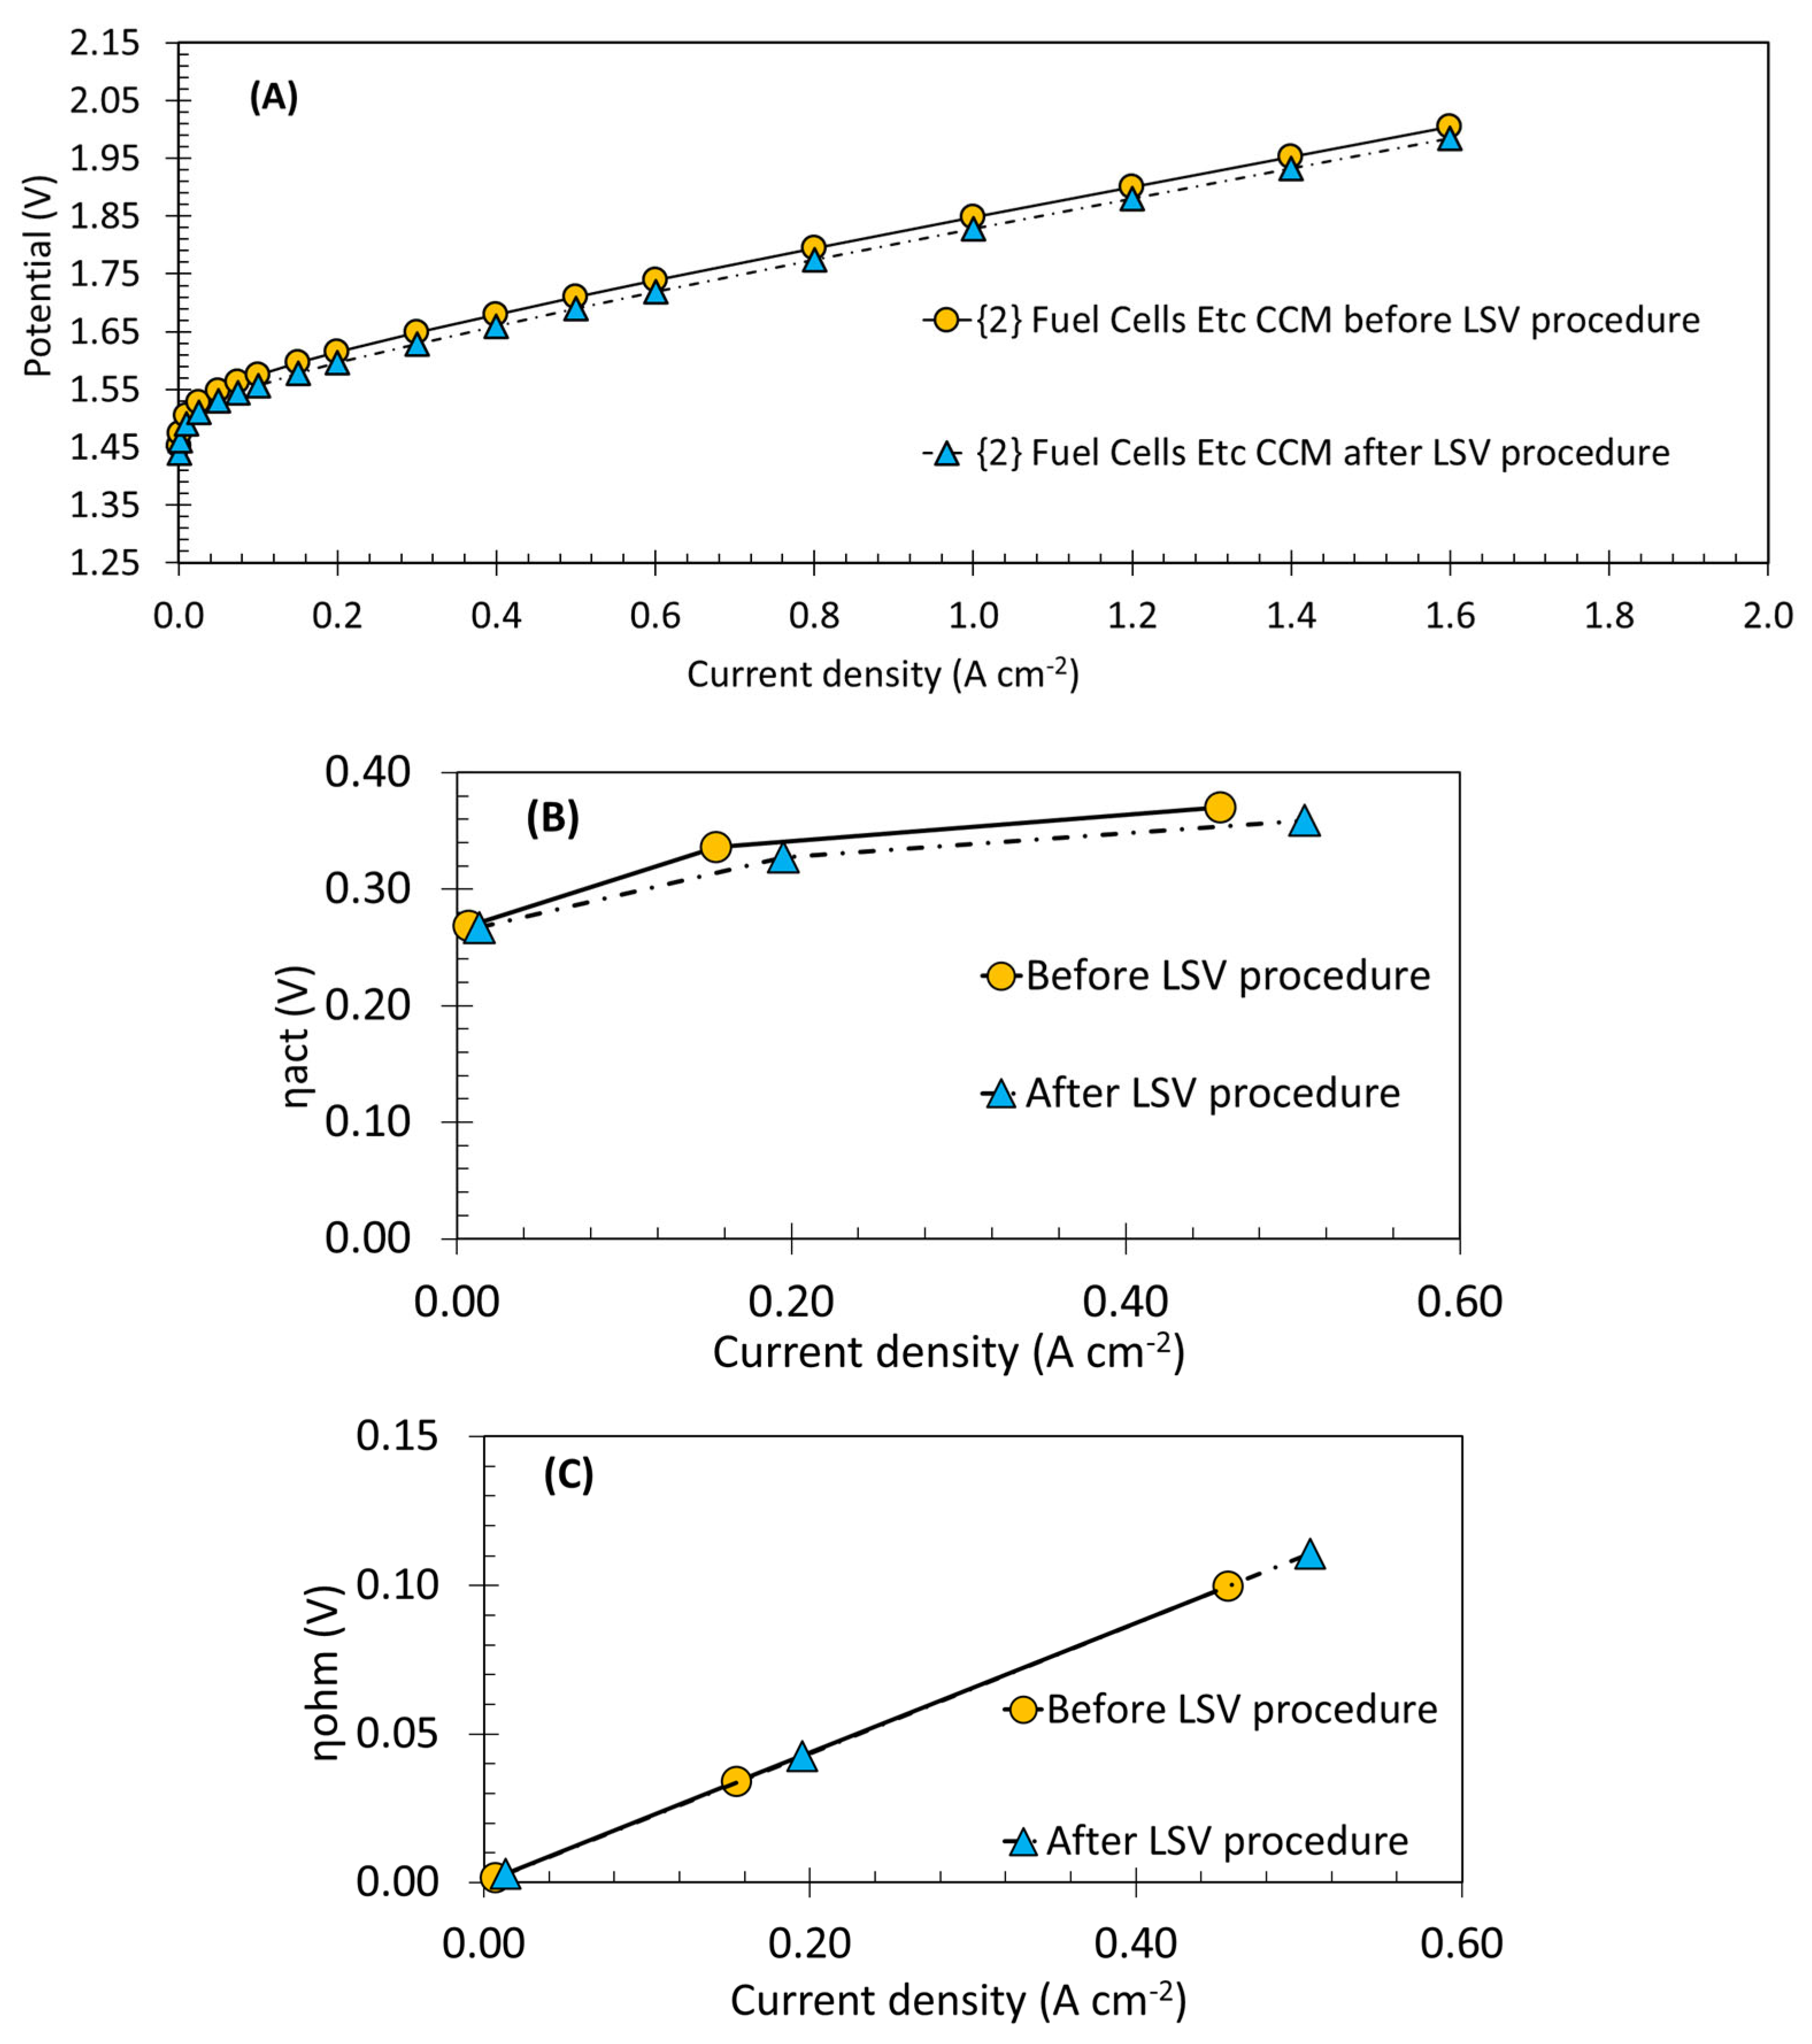
The LSV tests were performed regularly to assess the hydrogen crossover and the state of health of the CCMs. Although no significant crossover was seen in any assessed CCM (hydrogen crossover current < 0.30 mA cm−2), a general temporary increase in performance, up to 2% voltage, was observed after performing the LSV procedure. The overvoltages retrieved from the EIS tests confirmed that this increase in efficiency is due to a decrease in activation resistances with the LSV test. This is shown in Figure 7. The CV scans performed before and after the LSV also verified a general increase in the calculated charge densities, as shown in Table 2. To verify if this increase in performance was due to the electrochemistry of the LSV or due exclusively to the physical phenomena involved in the LSV procedure, a test with a CCM of the same batch as the Ir black (3) was performed without applying the sweeping potential. It was found that the physical phenomena (flowing H2 in the anode and N2 in the cathode during half an hour) were enough to observe the sudden increase in performance. This is possibly related to the interchangeability of the metallic iridium with its different oxidation states. In the presence of hydrogen, iridium oxide can change into a hydrous oxide that is more active but less stable [31,47]. In Table 2, it is seen that the IrOx had the greatest increase both in charge density and average voltage, followed by Ir black CCMs, and the CCMs with catalyst mixes had the least benefit. A certain relation between the voltage increase and charge density is also observable. Despite the slight and only temporary impact on performance, the fact that this phenomenon was persistently seen in all the tested CCMs made the authors report it. Moreover, a similar effect has been observed before, caused by the hydrogen crossover and low anode potentials promoted by the shutdown periods of an electrolyzer operating under differential pressure. This topic can be relevant for PEM WE operating with impermanent power sources that cause regular operation stoppage [31]. The CV plots for each of the tested anode catalysts before and after the hydrogen purge can be found in Support Material Figure S1. The average charge densities obtained for each tested CCM are shown in Figure S2.

4. Conclusions

The literature on PEM WE is expanding, with the development of components employing alternative materials and advancements in manufacturing procedures. As commercial components are often used as a starting point for research in the area, it is important to regularly characterize the components commercially supplied. In this study, multiple CCMs were characterized in a commercial PEM electrolyzer. It was found that equivalent CCMs, two supplied by different stores and one corresponding to our group first effort to replicate these commercial CCMs, performed equivalently. Related to the membrane thickness, it was found that the difference between Nafion 115 (0.127 mm) and Nafion 117 (0.183 mm) is only reflected in a maximum of 5% performance improvement at the highest current density tested (2.5 A cm−2). With respect to the anode catalyst, CCMs with IrRuOx, IrRuOx/Pt and Ir black performed similarly, with the IrRuOx/Pt performing slightly better at the highest current densities due to reduced ohmic overvoltages and the IrRuOx performing slightly better at the lowest current densities due to reduced activation overvoltages. IrOx performed with significantly lower performance due to greater activation overvoltage, something unexpected. All the tested CCM performance increased equivalently with the increase in temperature from 25 °C to 80 °C due to a decrease in both activation and ohmic overvoltages. Flowing hydrogen in the anode was shown to temporarily improve performance by up to 2%.

Supplementary Materials

The following supporting information can be downloaded at: https://www.mdpi.com/article/10.3390/en15217937/s1, Figure S1: CV plots obtained with scan rate of 20 mV/s for each anode catalyst tested in this study with nafion 115 and 3 mg cm−2 catalyst load, obtained at room temperature. Figure S2: Average charge density obtained before and after hydrogen purge at 20 mV s−1.

Author Contributions

Conceptualization, R.C.B.F., D.F. and A.M.F.R.P.; Investigation, A.G.R.; Project administration, A.M.F.R.P.; Supervision, R.C.B.F., D.F. and A.M.F.R.P.; Writing—original draft, A.G.R.; Writing—review & editing, R.C.B.F., D.F. and A.M.F.R.P. All authors have read and agreed to the published version of the manuscript.

Funding

This work was financially supported by LA/P/0045/2020 (ALiCE), UIDB/00532/2020 and UIDP/00532/2020 (CEFT), funded by national funds through FCT/MCTES (PIDDAC). This paper is a result of the project “HyGreen&LowEmissions–Tackling Climate Change Impacts: the role of Green Hydrogen production, storage and use, together with low emissions energy systems”, with the reference NORTE-01-0145-FEDER-000077, supported by Norte Portugal Regional Operational Programme (NORTE 2020), under the PORTUGAL 2020 Partnership Agreement, through the European Regional Development Fund (ERDF). This work is a result of the project “UniRCell”, with the reference POCI-01-0145-FEDER-016422, supported by Norte Portugal Regional Operational Programme (NORTE 2020), under the Portugal 2020 Partnership Agreement, through the European Regional Development Fund (ERDF).

Conflicts of Interest

The authors declare no conflict of interest.

References

  1. IEA. Net Renewable Capacity Additions by Technology, 2017–2023. Available online: https://www.iea.org/data-and-statistics/charts/net-renewable-capacity-additions-by-technology-2017-2023 (accessed on 20 September 2022).
  2. World Energy: Issues Monitor 2019. In World Energy: Issues Monitor; World Energy Council: London, UK, 2019.
  3. IRENA (Ed.) Hydrogen from Renewable Power: Technology Outlook for the Energy Transition; International Renewable Energy Agency: Abu Dhabi, United Arab Emirates, 2018. [Google Scholar]
  4. Akinyele, D.O.; Rayudu, R.K. Review of Energy Storage Technologies for Sustainable Power Networks. Sustain. Energy Technol. Assess. 2014, 8, 74–91. [Google Scholar] [CrossRef]
  5. Zohuri, B.; McDaniel, P. Chapter 8-Energy storage technologies and their role in Renewable Integration. In Introduction to Energy Essentials; Zohuri, B., McDaniel, P., Eds.; Academic Press: Cambridge, MA, USA, 2021; pp. 277–320. [Google Scholar]
  6. Price, A. Chapter 1—The Exploitation of Renewable Sources of Energy for Power Generation. In Electrochemical Energy Storage for Renewable Sources and Grid Balancing; Garche, J., Ed.; Elsevier: Amsterdam, The Netherlands, 2015; pp. 3–12. [Google Scholar]
  7. Buttler, A.; Spliethoff, H. Current status of water electrolysis for energy storage, grid balancing and sector coupling via power-to-gas and power-to-liquids: A review. Renew. Sustain. Energy Rev. 2018, 82, 2440–2454. [Google Scholar] [CrossRef]
  8. LeRoy, R.L. Industrial water electrolysis: Present and future. Int. J. Hydrogen Energy 1983, 8, 401–417. [Google Scholar] [CrossRef]
  9. Briguglio, N.; Antonucci, V. Chapter 1—Overview of PEM Electrolysis for Hydrogen Production. In PEM Electrolysis for Hydrogen Production; CRC Press: Boca Raton, FL, USA, 2016; pp. 1–9. [Google Scholar]
  10. Carmo, M.; Fritz, D.L.; Mergel, J.; Stolten, D. A comprehensive review on PEM water electrolysis. Int. J. Hydrogen Energy 2013, 38, 4901–4934. [Google Scholar] [CrossRef]
  11. Shiva Kumar, S.; Himabindu, V. Hydrogen production by PEM water electrolysis—A review. Mater. Sci. Energy Technol. 2019, 2, 442–454. [Google Scholar] [CrossRef]
  12. Ayers, K.E.; Anderson, E.B.; Capuano, C.; Carter, B.; Dalton, L.; Hanlon, G.; Manco, J.; Niedzwiecki, M. Research Advances towards Low Cost, High Efficiency PEM Electrolysis. ECS Trans. 2010, 33, 3–15. [Google Scholar] [CrossRef]
  13. Lettenmeier, P.; Wang, R.; Abouatallah, R.; Saruhan, B.; Freitag, O.; Gazdzicki, P.; Morawietz, T.; Hiesgen, R.; Gago, A.S.; Friedrich, K.A. Low-Cost and Durable Bipolar Plates for Proton Exchange Membrane Electrolyzers. Sci. Rep. 2017, 7, 44035. [Google Scholar] [CrossRef] [Green Version]
  14. Russell, J.H.; Nuttall, L.J.; Fickett, A.P. Hydrogen Generation by Solid Polymer Electrolyte Water Electrolysis. Am. Chem. Soc. Div. Fuel Chem. Prepr. 1973, 18, 24–33. [Google Scholar]
  15. Barbir, F. Chapter 4—Main Cell Components, Materials Properties and Processes. In PEM Fuel Cells: Theory and Practice; Academic Press: Burlington, MA, USA, 2005; pp. 73–113. [Google Scholar]
  16. Ito, H. Chapter 6—Membranes. In PEM Electrolysis for Hydrogen Production; CRC Press: Boca Raton, FL, USA, 2016; pp. 119–134. [Google Scholar]
  17. Ito, H.; Maeda, T.; Nakano, A.; Takenaka, H. Properties of Nafion membranes under PEM water electrolysis conditions. Int. J. Hydrogen Energy 2011, 36, 10527–10540. [Google Scholar] [CrossRef]
  18. Smolinka, T.; Ojong, E.T.; Lickert, T. Chapter 2—Fundamentals of PEM Water Electrolysis. In PEM Electrolysis for Hydrogen Production; CRC Press: Boca Raton, FL, USA, 2016; pp. 11–33. [Google Scholar]
  19. Miles, M.H.; Thomason, M.A. Periodic Variations of Overvoltages for Water Electrolysis in Acid Solutions from Cyclic Voltammetric Studies. J. Electrochem. Soc. 1976, 123, 1459–1461. [Google Scholar] [CrossRef]
  20. Miles, M.H.; Klaus, E.A.; Gunn, B.P.; Locker, J.R.; Serafin, W.E.; Srinivasan, S. The oxygen evolution reaction on platinum, iridium, ruthenium and their alloys at 80 °C in acid solutions. Electrochim. Acta 1978, 23, 521–526. [Google Scholar] [CrossRef]
  21. Galizzioli, D.; Tantardini, F.; Trasatti, S. Ruthenium dioxide: A new electrode material. I. Behaviour in acid solutions of inert electrolytes. J. Appl. Electrochem. 1974, 4, 57–67. [Google Scholar] [CrossRef]
  22. Bender, G.; Carmo, M.; Smolinka, T.; Gago, A.; Danilovic, N.; Mueller, M.; Ganci, F.; Fallisch, A.; Lettenmeier, P.; Friedrich, K.; et al. Initial approaches in benchmarking and round robin testing for proton exchange membrane water electrolyzers. Int. J. Hydrogen Energy 2019, 44, 9174–9187. [Google Scholar] [CrossRef]
  23. Sunde, M.T.S. Chapter 3—Electrocatalysts for Oxygen Evolution Reaction (OER). In PEM Electrolysis for Hydrogen Production; CRC Press: Boca Raton, FL, USA, 2016; pp. 36–58. [Google Scholar]
  24. Carmo, M.; Lüke, W.; Stolten, D. Chapter 4—Electrocatalysts for the Hydrogen Evolution Reaction. In PEM Electrolysis for Hydrogen Production; CRC Press: Boca Raton, FL, USA, 2016; pp. 65–85. [Google Scholar]
  25. Immerz, C.; Paidar, M.; Papakonstantinou, G.; Bensmann, B.; Bystron, T.; Vidakovic-Koch, T.; Bouzek, K.; Sundmacher, K.; Hanke-Rauschenbach, R. Effect of the MEA design on the performance of PEMWE single cells with different sizes. J. Appl. Electrochem. 2018, 48, 701–711. [Google Scholar] [CrossRef] [Green Version]
  26. Ma, L.; Sui, S.; Zhai, Y. Investigations on high performance proton exchange membrane water electrolyzer. Int. J. Hydrogen Energy 2009, 34, 678–684. [Google Scholar] [CrossRef]
  27. Xu, W.; Scott, K. The effects of ionomer content on PEM water electrolyser membrane electrode assembly performance. Int. J. Hydrogen Energy 2010, 35, 12029–12037. [Google Scholar] [CrossRef]
  28. Rasten, E.; Hagen, G.; Tunold, R. Electrocatalysis in water electrolysis with solid polymer electrolyte. Electrochim. Acta 2003, 48, 3945–3952. [Google Scholar] [CrossRef] [Green Version]
  29. Slavcheva, E.; Radev, I.; Bliznakov, S.; Topalov, G.; Andreev, P.; Budevski, E. Sputtered iridium oxide films as electrocatalysts for water splitting via PEM electrolysis. Electrochim. Acta 2007, 52, 3889–3894. [Google Scholar] [CrossRef]
  30. Tsotidris, G.; Pilenga, A. EU Harmonized Protocols for Testing of Low Temperature Water Electrolysis; Publications Office of the European Union: Luxembourg, 2021. [Google Scholar]
  31. Rheinländer, P.J.; Durst, J. Transformation of the OER-Active IrOx Species under Transient Operation Conditions in PEM Water Electrolysis. J. Electrochem. Soc. 2021, 168, 024511. [Google Scholar] [CrossRef]
  32. Siracusano, S.; Baglio, V.; Grigoriev, S.; Merlo, L.; Fateev, V.; Aricò, A.S. The influence of iridium chemical oxidation state on the performance and durability of oxygen evolution catalysts in PEM electrolysis. J. Power Sources 2017, 366, 105–114. [Google Scholar] [CrossRef]
  33. Millet, P. Chapter 10—Characterization tools for Polymer Electrolyte Membrane (PEM) Water electrolyzers. In PEM Electrolysis for Hydrogen Production: Principles and Applications; CRC Press: Boca Raton, FL, USA, 2016. [Google Scholar]
  34. Fouda-Onana, F.; Chandesris, M.; Médeau, V.; Chelghoum, S.; Thoby, D.; Guillet, N. Investigation on the degradation of MEAs for PEM water electrolysers part I: Effects of testing conditions on MEA performances and membrane properties. Int. J. Hydrogen Energy 2016, 41, 16627–16636. [Google Scholar] [CrossRef]
  35. Lettenmeier, P.; Wang, R.; Abouatallah, R.; Helmly, S.; Morawietz, T.; Hiesgen, R.; Kolb, S.; Burggraf, F.; Kallo, J.; Gago, A.; et al. Durable Membrane Electrode Assemblies for Proton Exchange Membrane Electrolyzer Systems Operating at High Current Densities. Electrochim. Acta 2016, 210, 502–511. [Google Scholar] [CrossRef] [Green Version]
  36. Gago, A.; Ansar, S.; Saruhan, B.; Schulz, U.; Lettenmeier, P.; Cañas, N.; Gazdzicki, P.; Morawietz, T.; Hiesgen, R.; Arnold, J.; et al. Protective coatings on stainless steel bipolar plates for proton exchange membrane (PEM) electrolysers. J. Power Sources 2016, 307, 815–825. [Google Scholar] [CrossRef] [Green Version]
  37. Ferreira, R.; Falcão, D.; Oliveira, V.; Pinto, A. Experimental study on the membrane electrode assembly of a proton exchange membrane fuel cell: Effects of microporous layer, membrane thickness and gas diffusion layer hydrophobic treatment. Electrochim. Acta 2017, 224, 337–345. [Google Scholar] [CrossRef]
  38. Yuan, X.Z.; Zhang, S.; Wang, H.; Wu, J.; Sun, J.C.; Hiesgen, R.; Friedrich, K.A.; Schulze, M.; Haug, A. Degradation of a polymer exchange membrane fuel cell stack with Nafion® membranes of different thicknesses: Part I. In situ diagnosis. J. Power Sources 2010, 195, 7594–7599. [Google Scholar] [CrossRef] [Green Version]
  39. Ni, M.; Leung, M.K.; Leung, D.Y. Energy and exergy analysis of hydrogen production by a proton exchange membrane (PEM) electrolyzer plant. Energy Convers. Manag. 2008, 49, 2748–2756. [Google Scholar] [CrossRef]
  40. Saeba, D.; Patcharavorachot, Y.; Hacker, V.; Assabumrungrat, S.; Arpornwichanop, A.; Authayanun, S. Analysis of Unbalanced Pressure PEM Electrolyzer for High Pressure Hydrogen Production. Chem. Eng. Trans. 2017, 57, 1615–1620. [Google Scholar]
  41. Sapountzi, F.M.; Gracia, J.M.; Weststrate, C.-J.; Fredriksson, H.O.; Niemantsverdriet, J.W. Electrocatalysts for the generation of hydrogen, oxygen and synthesis gas. Prog. Energy Combust. Sci. 2017, 58, 1–35. [Google Scholar] [CrossRef] [Green Version]
  42. Siracusano, S.; Van Dijk, N.; Payne-Johnson, E.; Baglio, V.; Aricò, A. Nanosized IrOx and IrRuOx electrocatalysts for the O2 evolution reaction in PEM water electrolysers. Appl. Catal. B Environ. 2015, 164, 488–495. [Google Scholar] [CrossRef]
  43. Cheng, J.; Zhang, H.; Chen, G.; Zhang, Y. Study of IrxRu1−xO2 oxides as anodic electrocatalysts for solid polymer electrolyte water electrolysis. Electrochimica Acta 2009, 54, 6250–6256. [Google Scholar] [CrossRef]
  44. Hegge, F.; Lombeck, F.; Ortiz, E.C.; Bohn, L.; Von Holst, M.; Kroschel, M.; Hübner, J.; Breitwieser, M.; Strasser, P.; Vierrath, S. Efficient and Stable Low Iridium Loaded Anodes for PEM Water Electrolysis Made Possible by Nanofiber Interlayers. ACS Appl. Energy Mater. 2020, 3, 8276–8284. [Google Scholar] [CrossRef]
  45. Trasatti, S. Electrocatalysis in the anodic evolution of oxygen and chlorine. Electrochim. Acta 1984, 29, 1503–1512. [Google Scholar] [CrossRef]
  46. Frensch, S.H.; Fouda-Onana, F.; Serre, G.; Thoby, D.; Araya, S.S.; Kær, S.K. Influence of the operation mode on PEM water electrolysis degradation. Int. J. Hydrogen Energy 2019, 44, 29889–29898. [Google Scholar] [CrossRef]
  47. Rakousky, C.; Reimer, U.; Wippermann, K.; Kuhri, S.; Carmo, M.; Lueke, W.; Stolten, D. Polymer electrolyte membrane water electrolysis: Restraining degradation in the presence of fluctuating power. J. Power Sources 2017, 342, 38–47. [Google Scholar] [CrossRef]
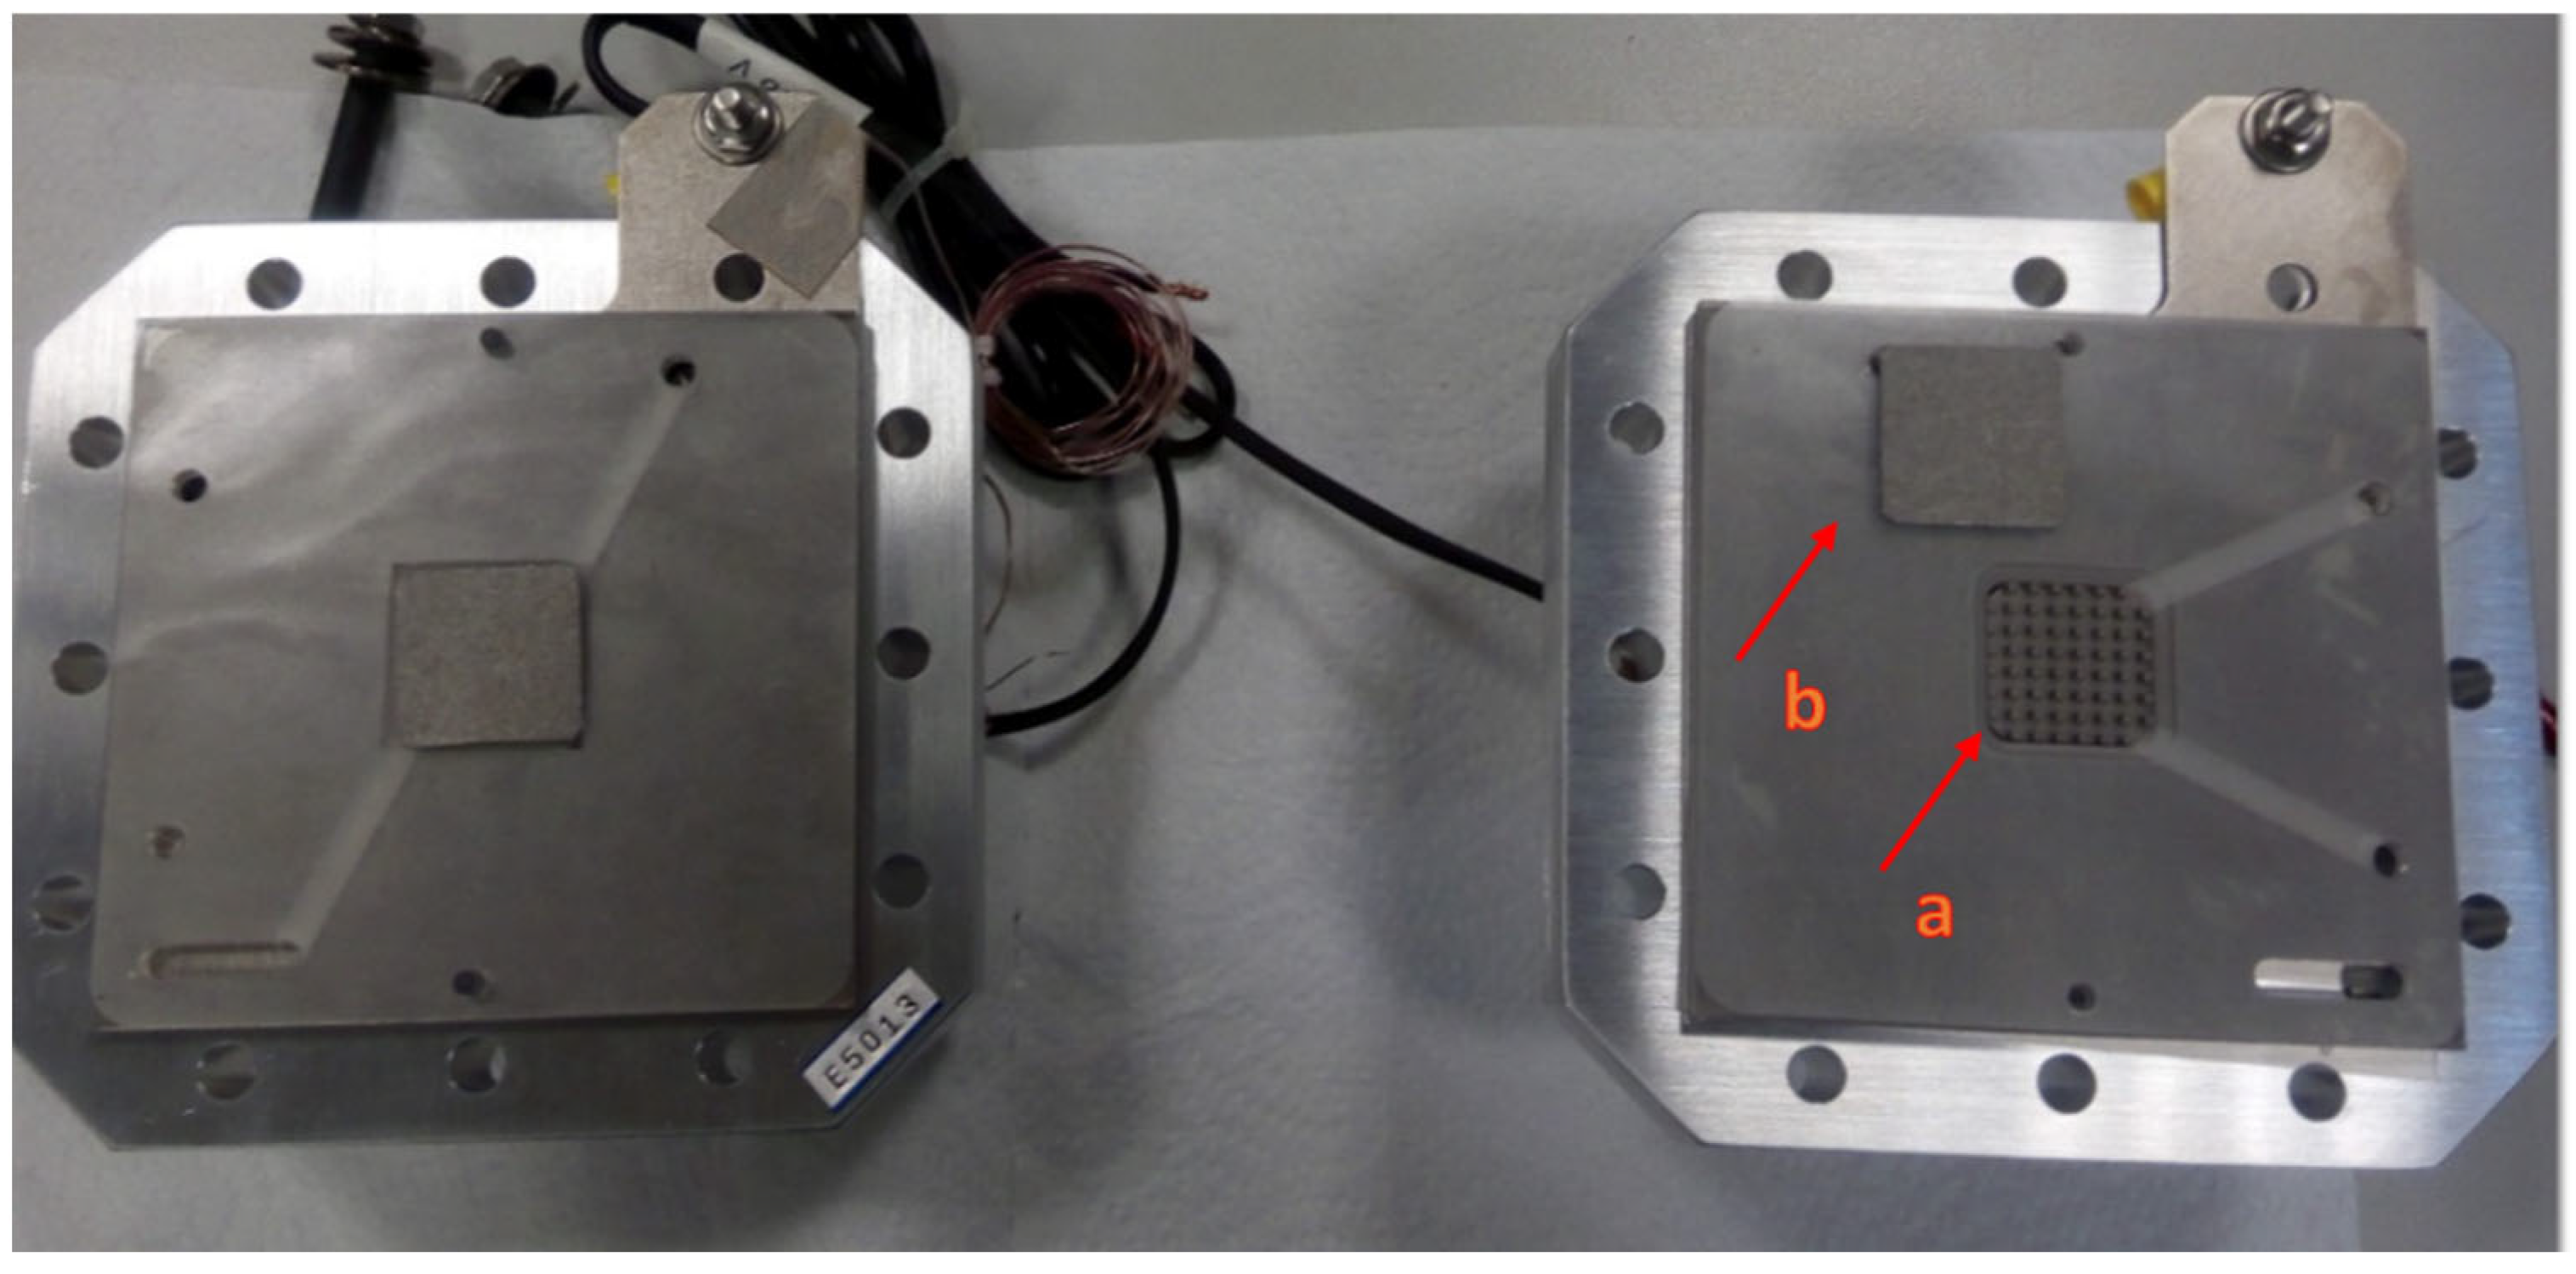
Figure 1. Open view of the commercial electrolyzer EC-EL-05 from Electrochem. (a) Bipolar plates flow field, (b) PTL.
Energies 15 07937 g001
Figure 2. Scheme of the PEM WE test setup: (1) PEM electrolyzer, (2) water feeding tank, (3) peristaltic pump, (4) ion exchanger, (5) three-way valve, (6) back pressure regulator, (7) water refill/discharge valve, (8) humidification tank, (9) humidity sensor tank, (10) compressed hydrogen, N2 and air, (11) humidity probe and (12) electrochemical workstation.
Energies 15 07937 g002
Figure 3. Data of equivalent CCMs from different suppliers operating at 80 °C. (A) I-V curves, (B) activation overpotentials, (C) ohmic overpotentials.
Energies 15 07937 g003
Figure 4. Data of CCMs with different membrane thicknesses operating at 80 °C. (A)-I-V curves, (B)-activation overpotentials, (C)-ohmic overpotentials.
Energies 15 07937 g004
Figure 5. Data of CCMs with different anode catalyst operating at 80 °C. (A) I-V curves, (B) activation overpotentials, (C) ohmic overpotentials.
Energies 15 07937 g005
Figure 6. Operating temperature effect of the QuinTech CCM at different temperatures. (A) I-V curves, (B) activation overpotentials, (C) ohmic overpotentials.
Energies 15 07937 g006
Figure 7. Hydrogen anode purge temporary effect on the performance, with WE operating with QuinTech CCM. (A)-I-V curves, (B)-activation overpotentials, (C)-ohmic overpotentials.
Energies 15 07937 g007
Table 1. Characteristics of the CCMs tested in this study.
NumberCCMSupplier
Nafion MembraneElectrocatalysts
Anode Loading (mg cm−2)Cathode
Loading (mg cm−2)
1115Ir black (2.0)Pt on advanced carbon (1.0)QuinTech
2115Ir black (2.0)Pt/C 60% (1.0)Fuel Cells Etc
3115Ir black (3.0)Pt black (3.0)Fuel Cells Etc
4115IrOx
(3.0)
Pt black (3.0)Fuel Cells Etc
5117IrRuOx (3.0)Pt black (3.0)Fuel Cells Etc
6115IrRuOx (1.5)Pt black (1.5)Pt black (3.0)Fuel Cells Etc
7115IrRuOx (3.0)Pt black (3.0)Fuel Cells Etc
8115Ir black (2.0)Pt/C 20% (1.0)In-house
Table 2. Average temporary voltage improvement and charge density increase after hydrogen purge on anode.
(1) QuinTech
Ir Black (2.0 mg cm−2)
(2)
Fuel Cells Etc Ir Black
(2.0 mg cm−2)
(3)
Ir Black
(4)
IrOx
(5)
IrRuOx
Nafion 117
(6) IrRuOx/Pt Black(7) IrRuOx
Nafion 115
Average voltage improvement (%)0.71.11.02.00.60.70.5
Charge density increase (%) (from CV scans at 20 mV s−1)253024536288
Publisher’s Note: MDPI stays neutral with regard to jurisdictional claims in published maps and institutional affiliations.