


Experimental Research on the Flow and Heat Transfer Characteristics of Subcritical and Supercritical Water in the Vertical Upward Smooth and Rifled Tubes

Abstract
:1. Introduction
2. Experimental Setup and Data Processing
2.1. Experimental Setup
2.2. Data Processing
2.3. Uncertainties Analysis
3. Results and Discussion
3.1. The Heat Transfer Characteristics of Water in the Smooth Tube
3.1.1. The Heat Transfer Characteristics at Subcritical Pressure
3.1.2. The Heat Transfer Characteristics at Near-Critical Pressure
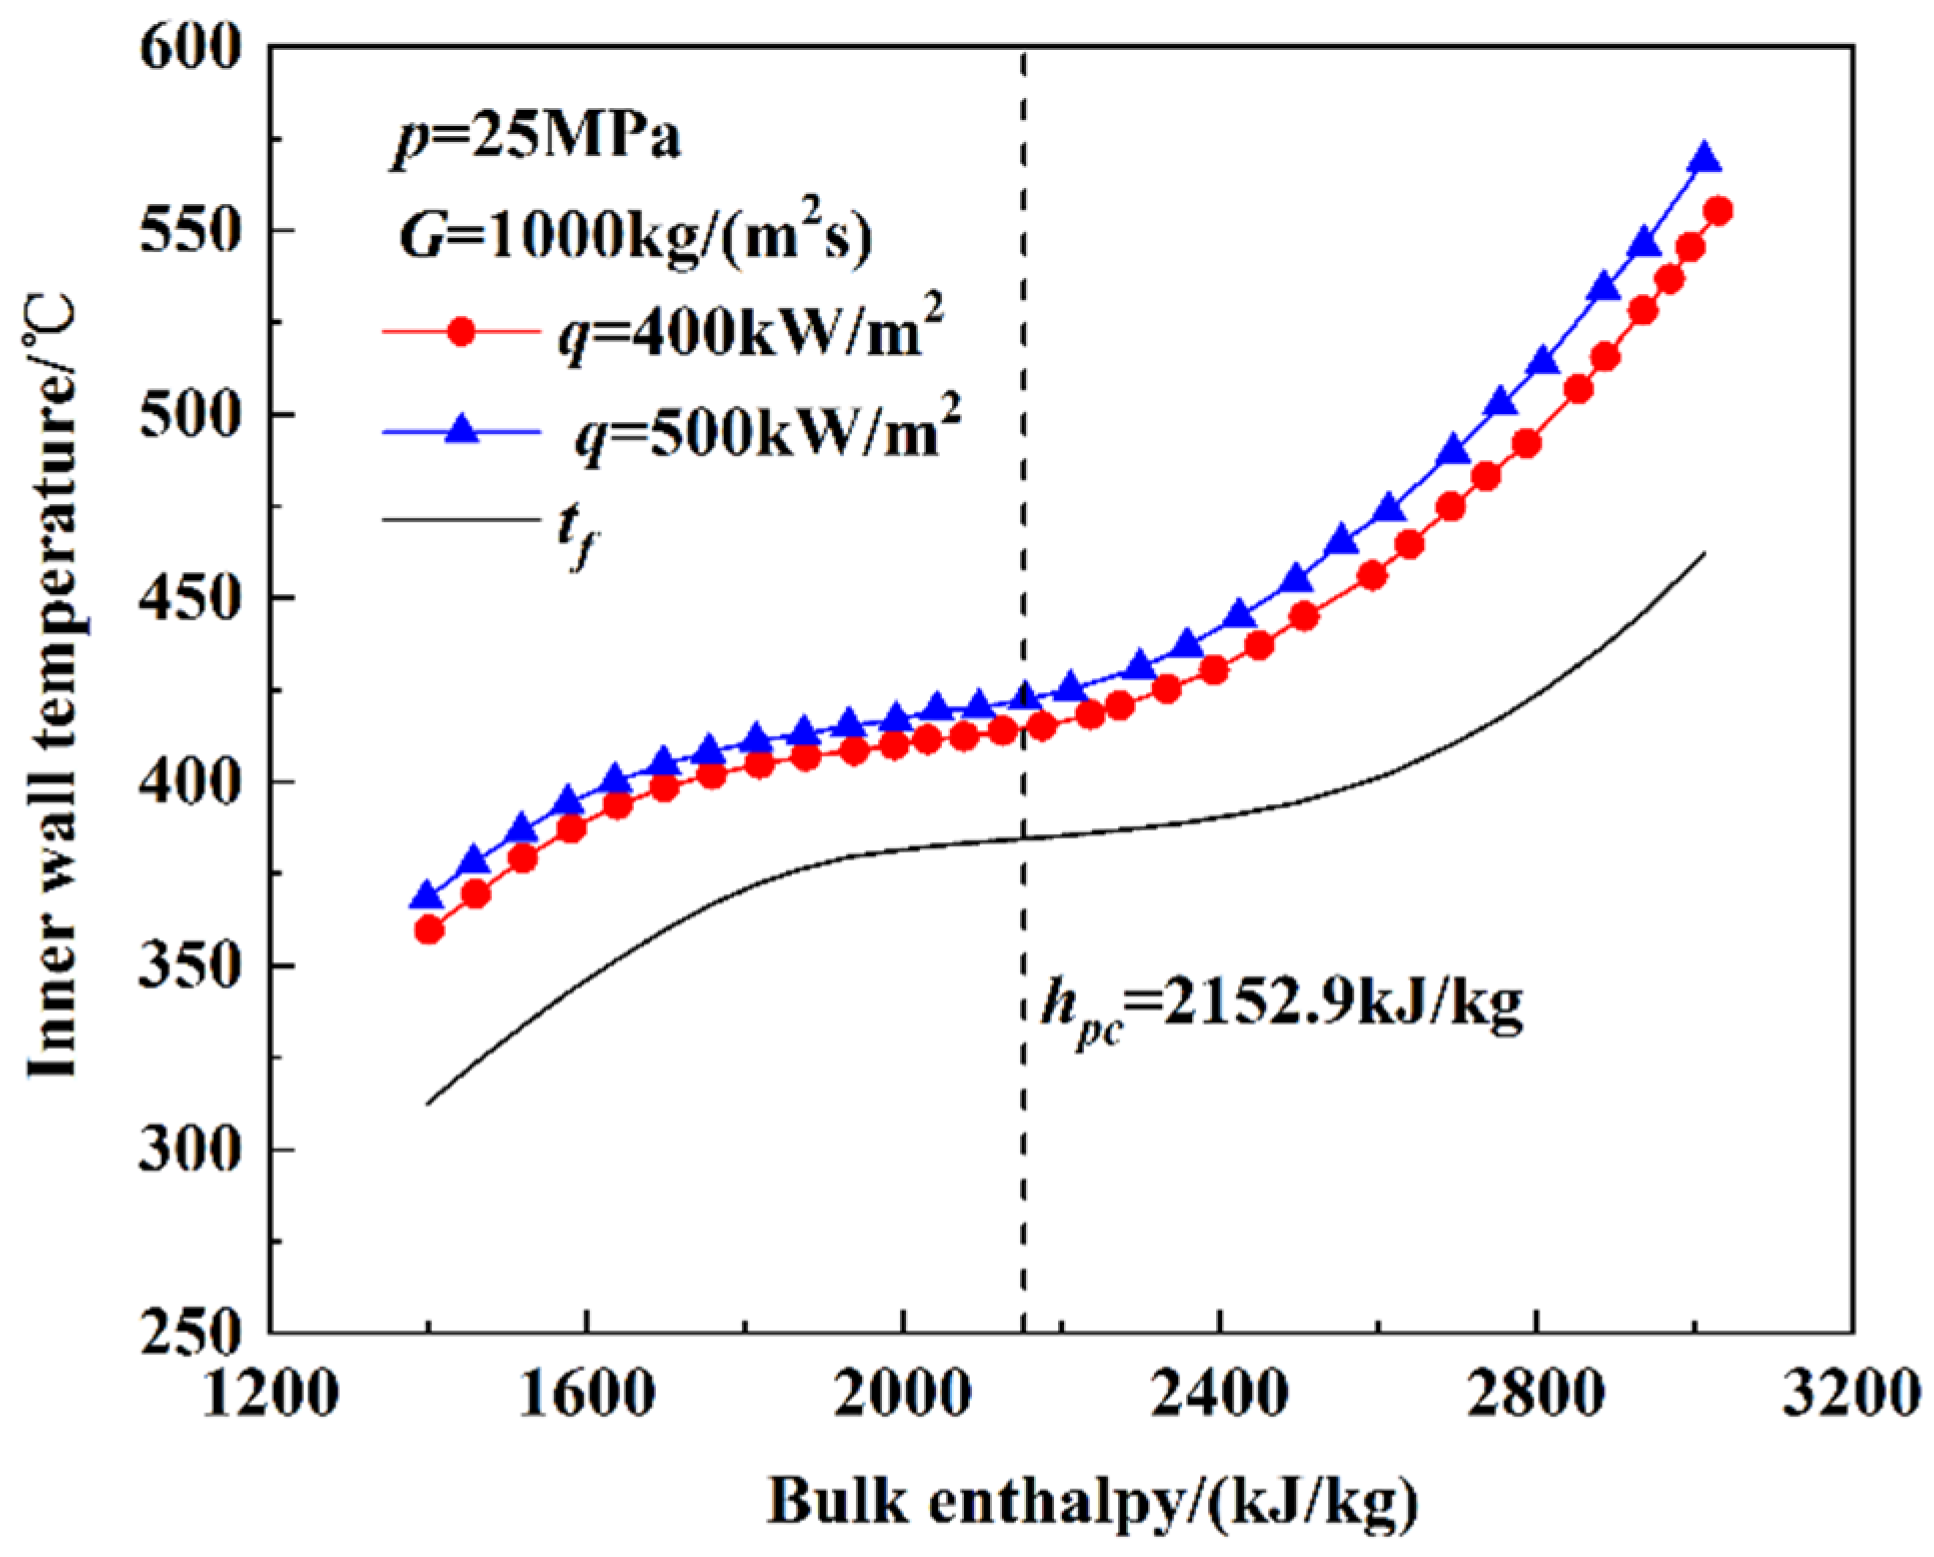
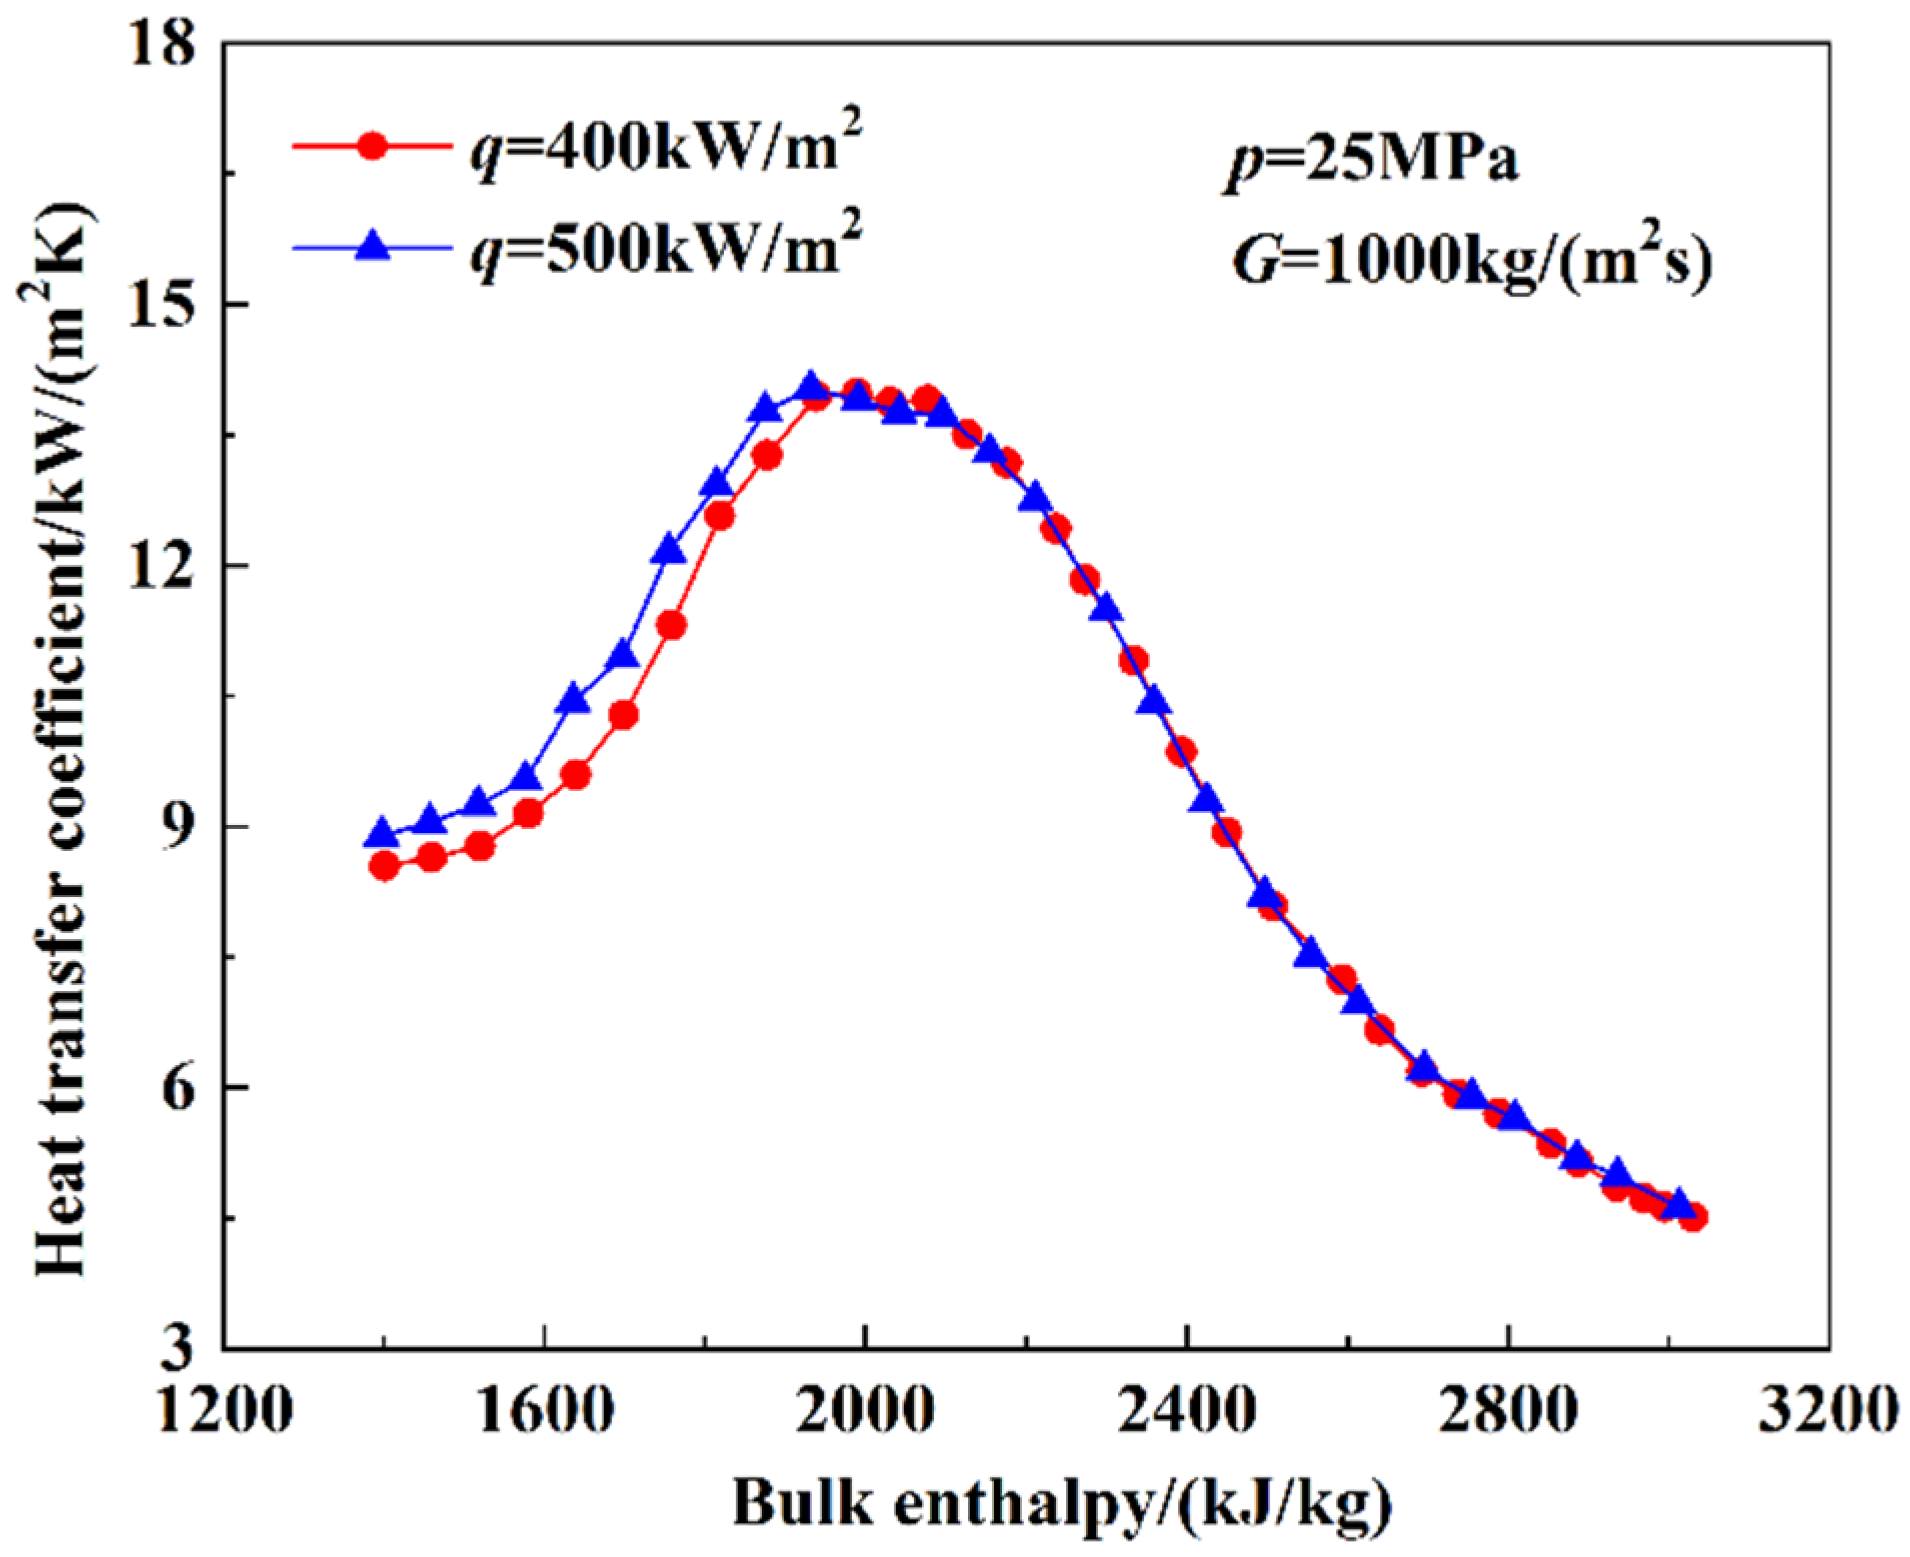
3.1.3. The Heat Transfer Characteristics at Supercritical Pressure
3.2. The Heat Transfer Characteristics of Water in the Rifled Tube
3.2.1. The Heat Transfer Characteristics at Subcritical Pressure
3.2.2. The Heat Transfer Characteristics at Near-Critical Pressure
3.2.3. The Heat Transfer Characteristics at Supercritical Pressure
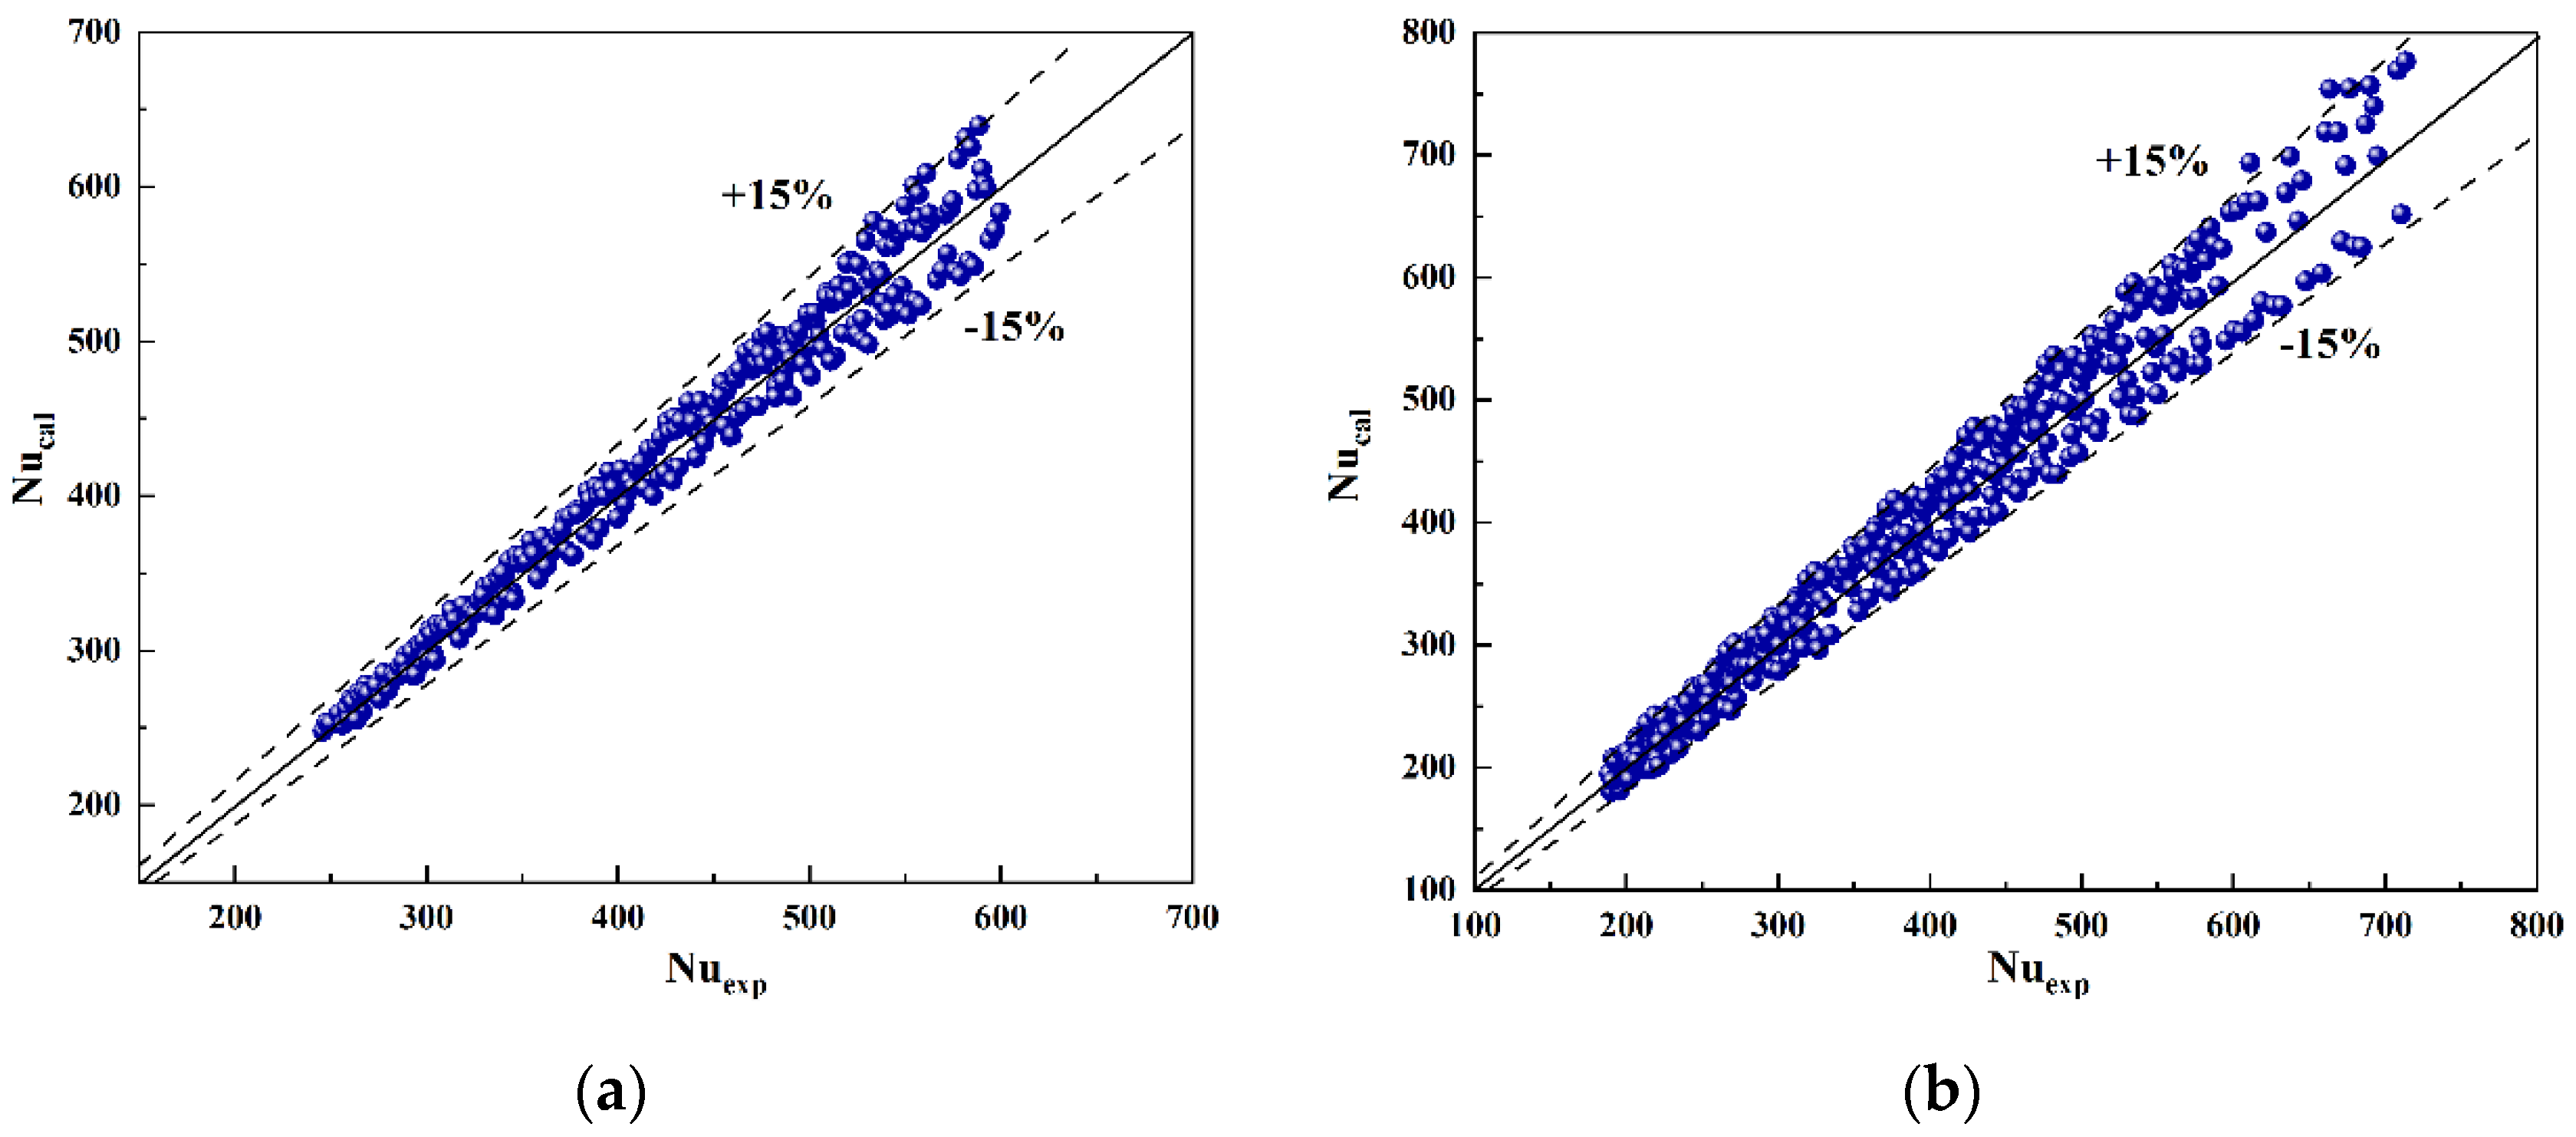
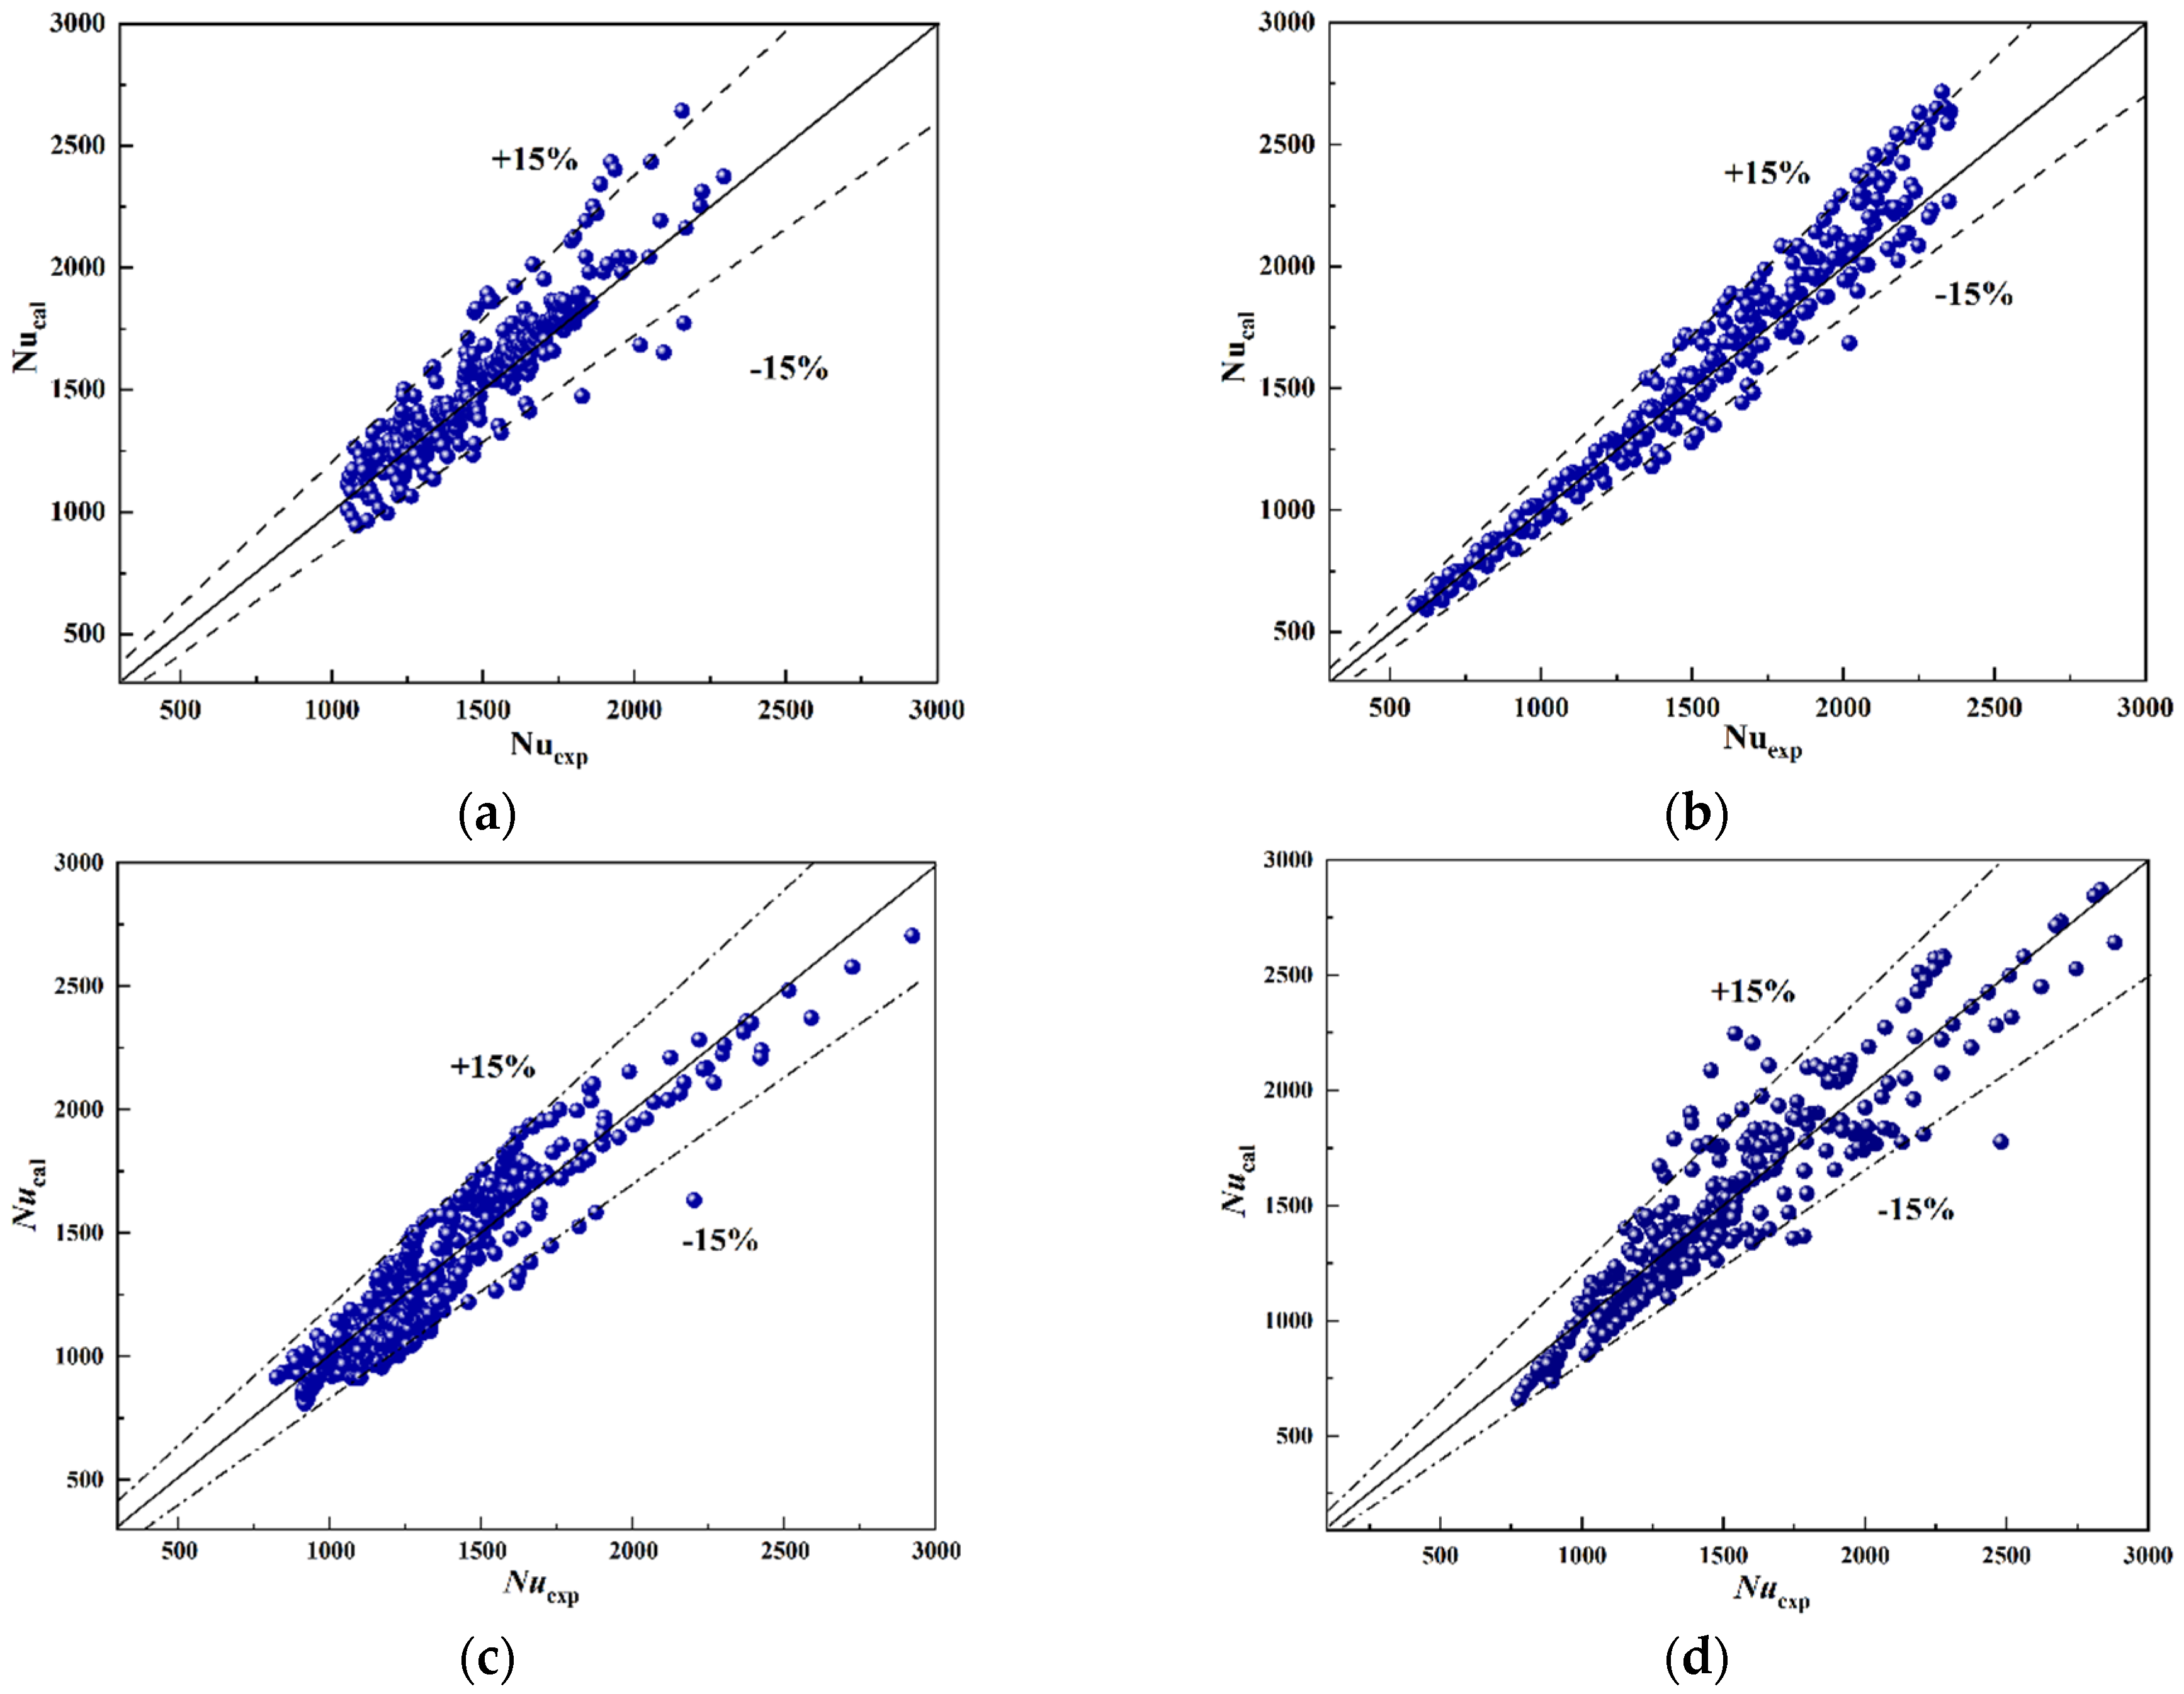
3.3. Heat Transfer Correlations
3.3.1. Heat Transfer Correlations at Subcritical Pressure
3.3.2. Heat Transfer Correlations at Near-Critical Pressure
3.3.3. Heat Transfer Correlations at Supercritical Pressure
3.4. The Resistance Characteristics
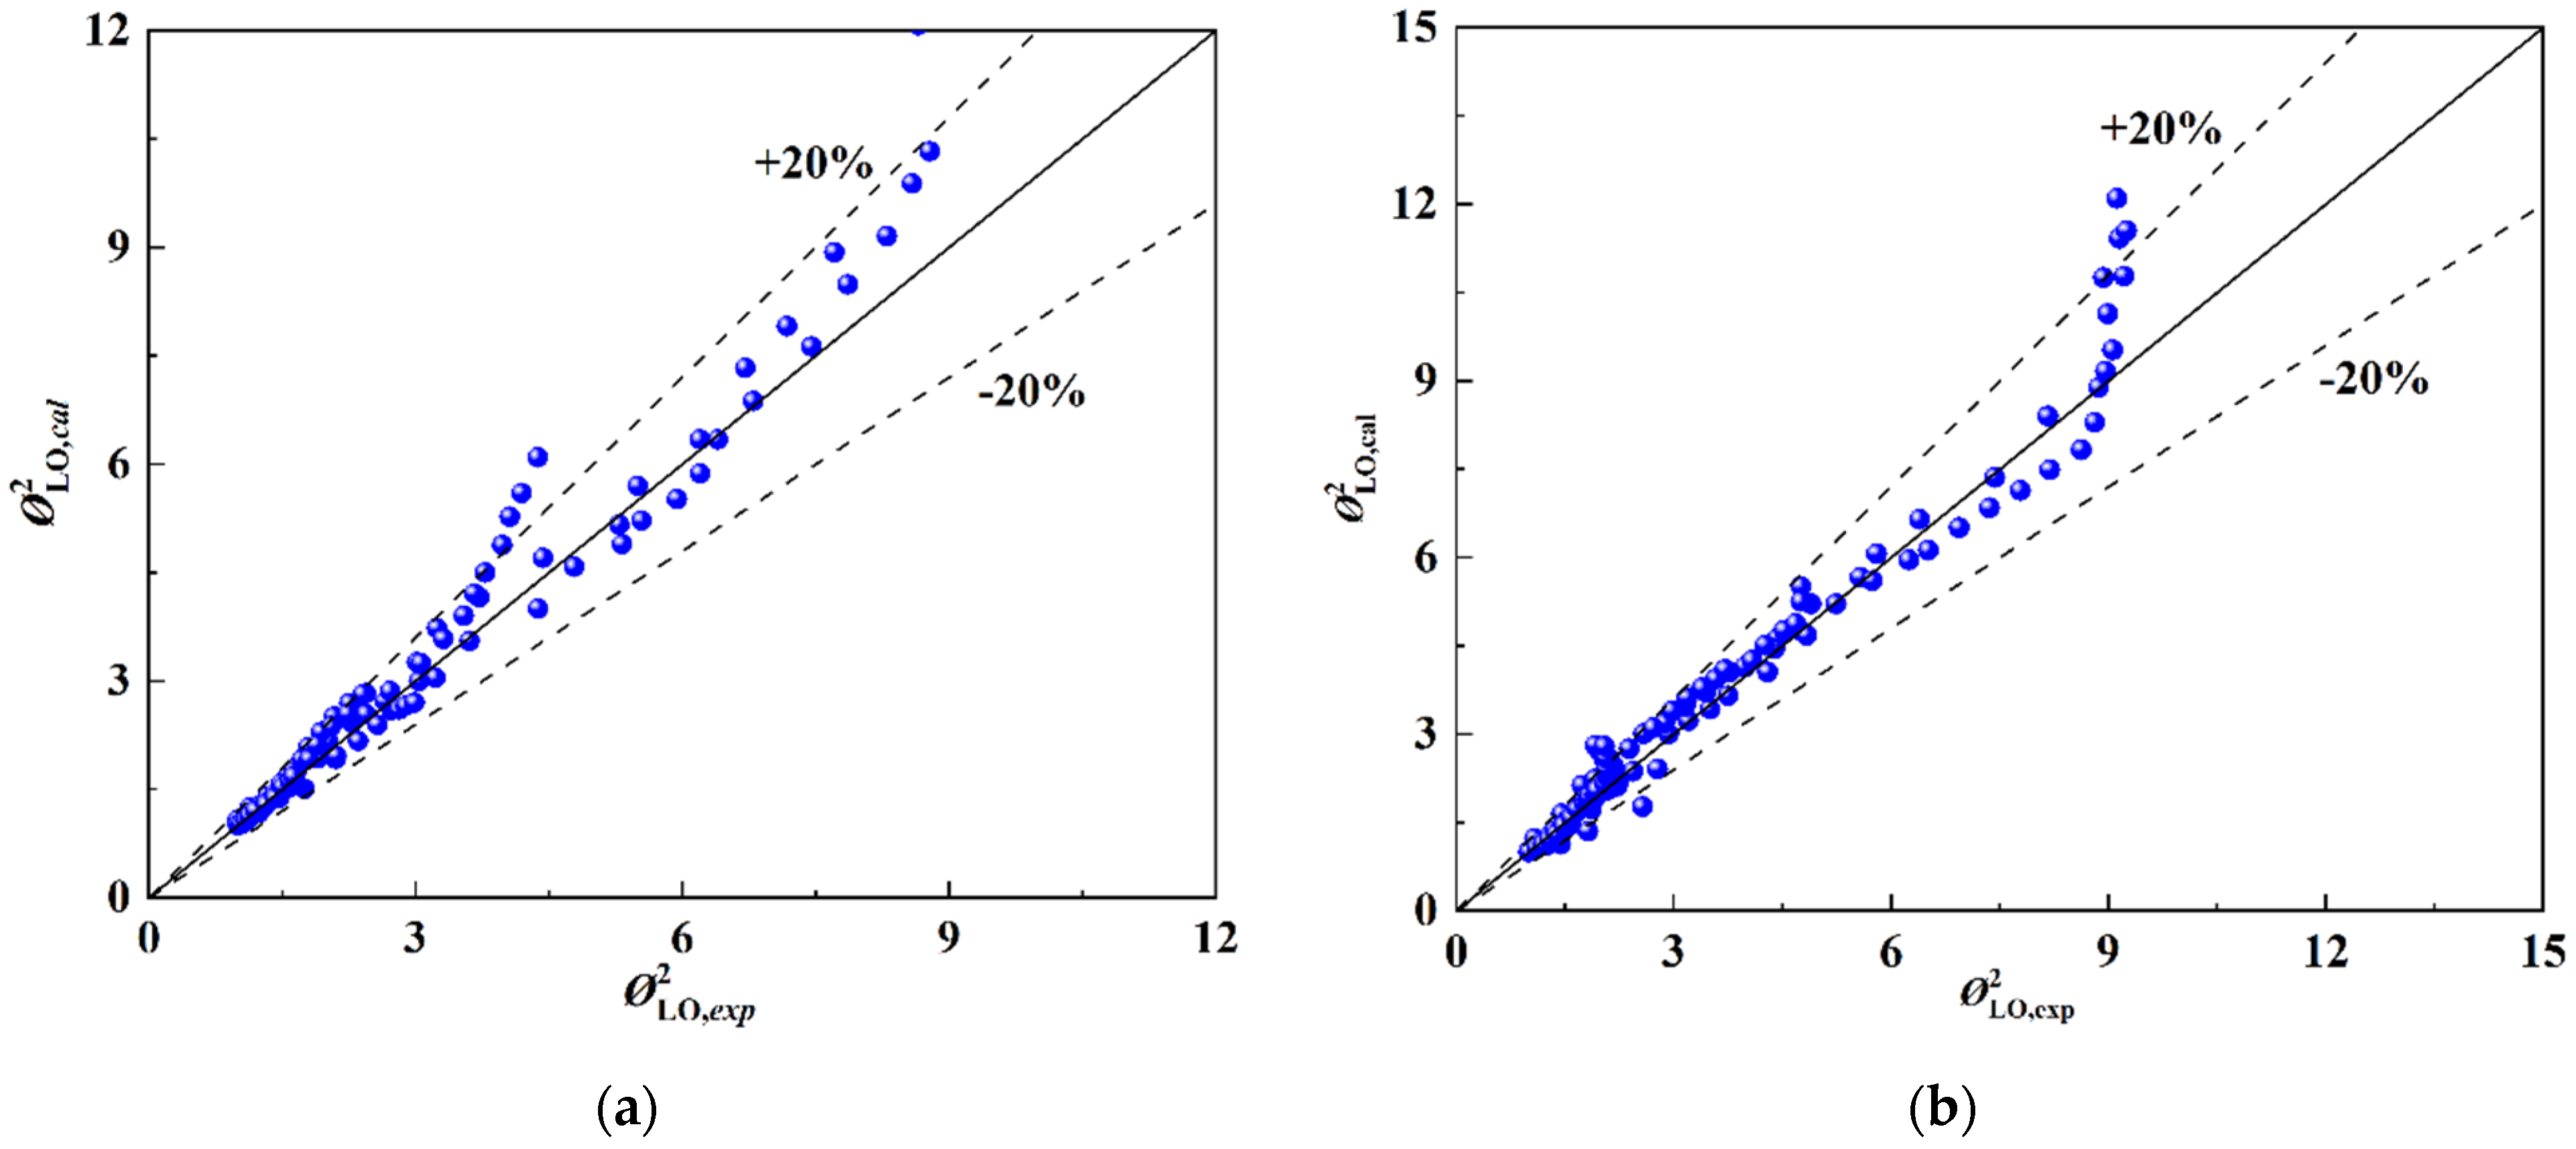
3.4.1. The Resistance Characteristics at Subcritical/Near-Critical Pressure
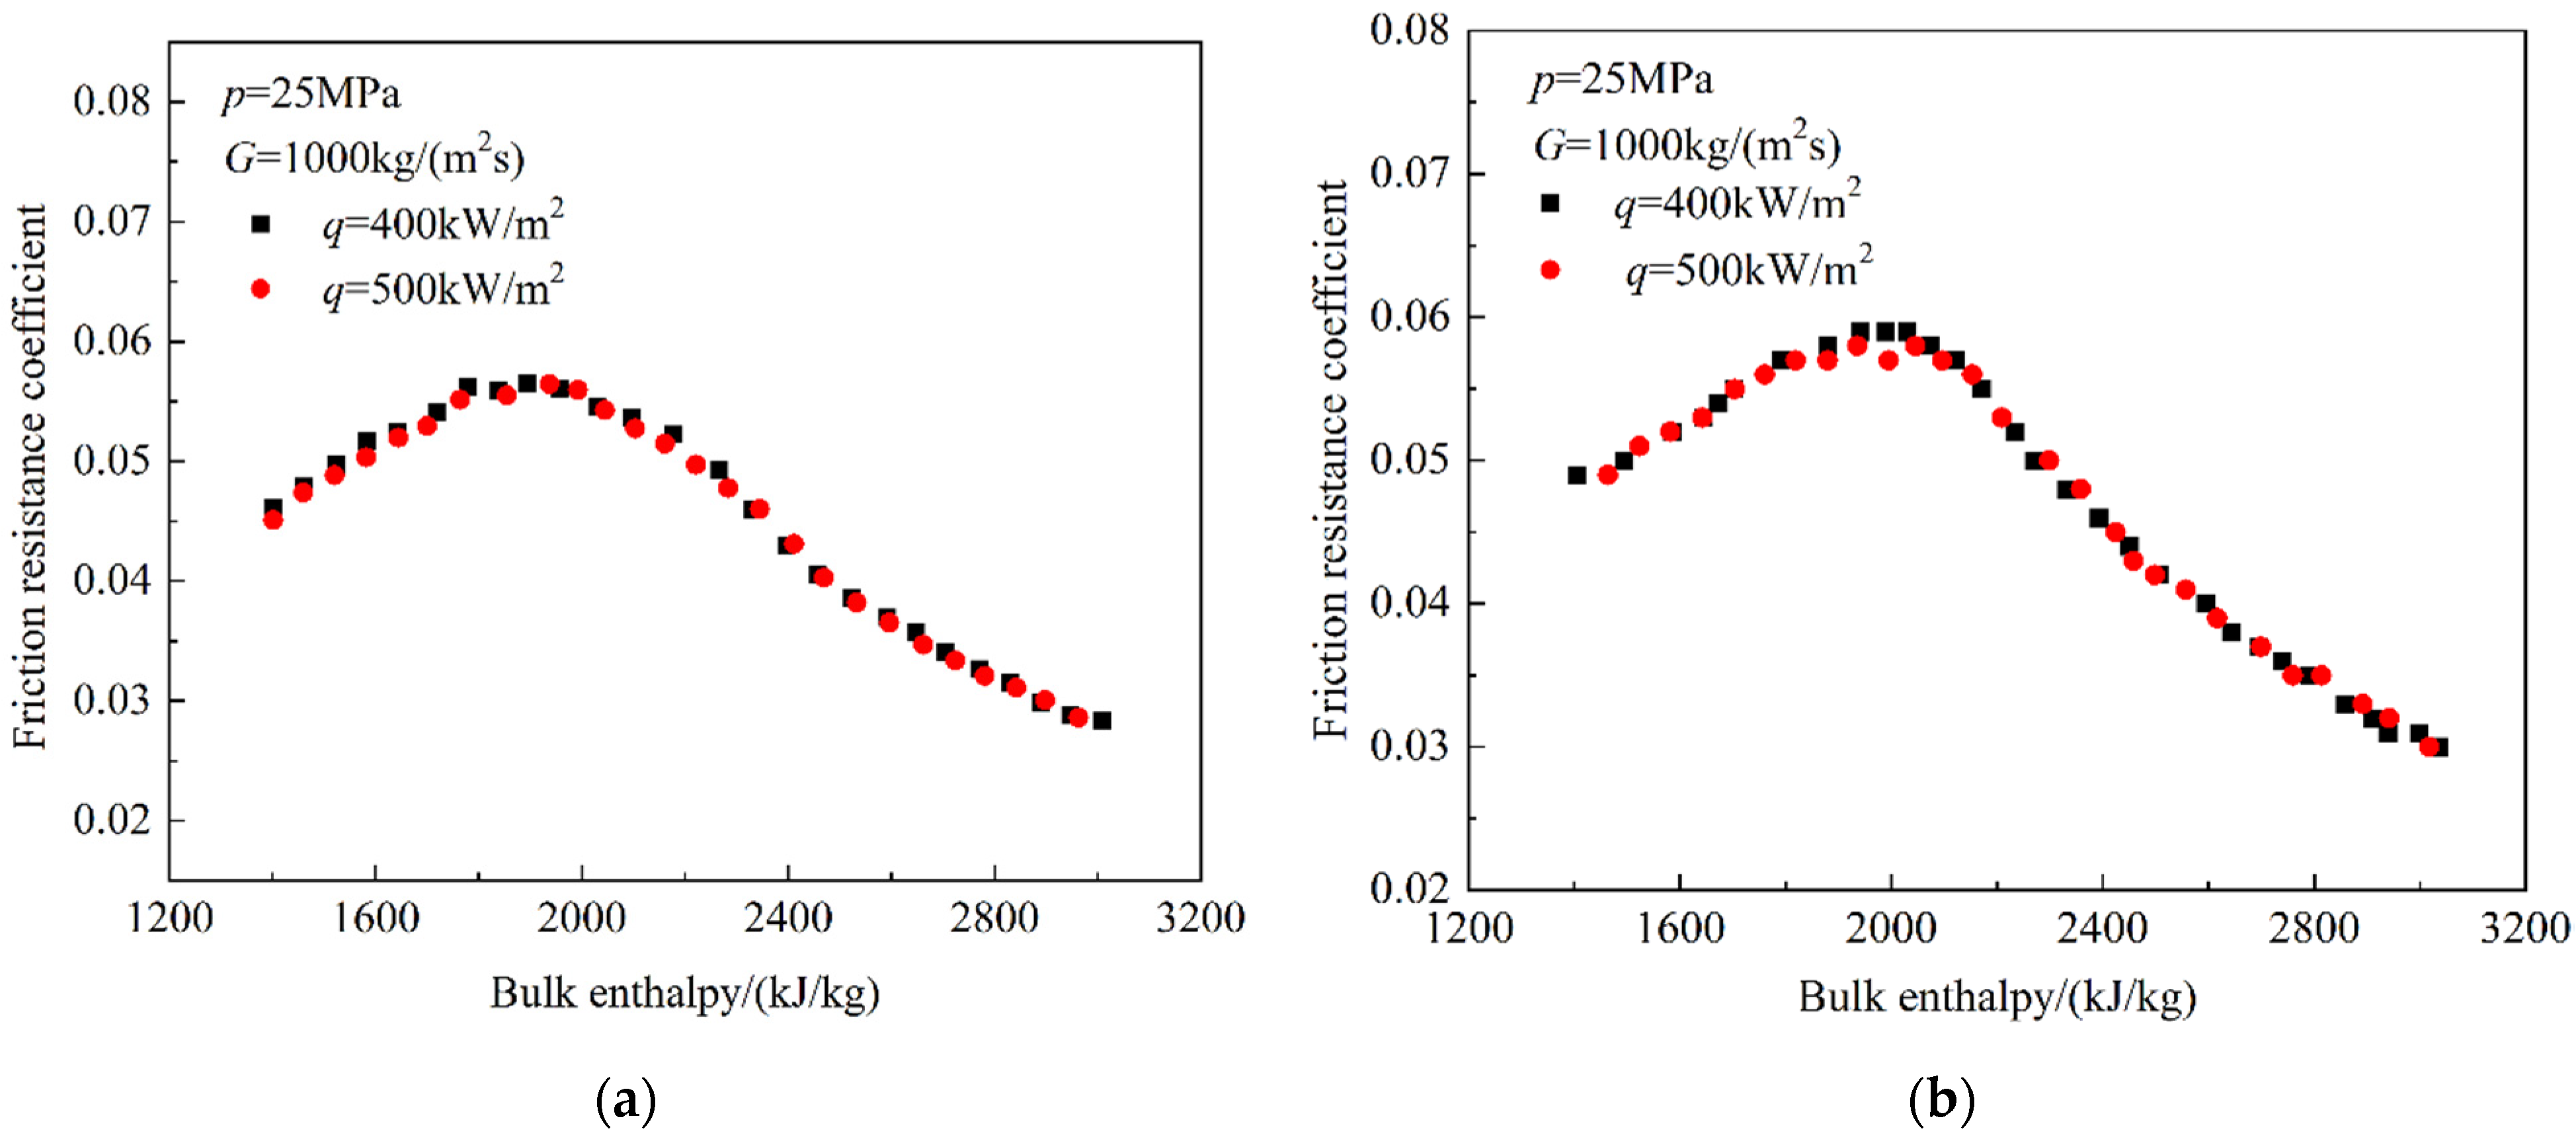
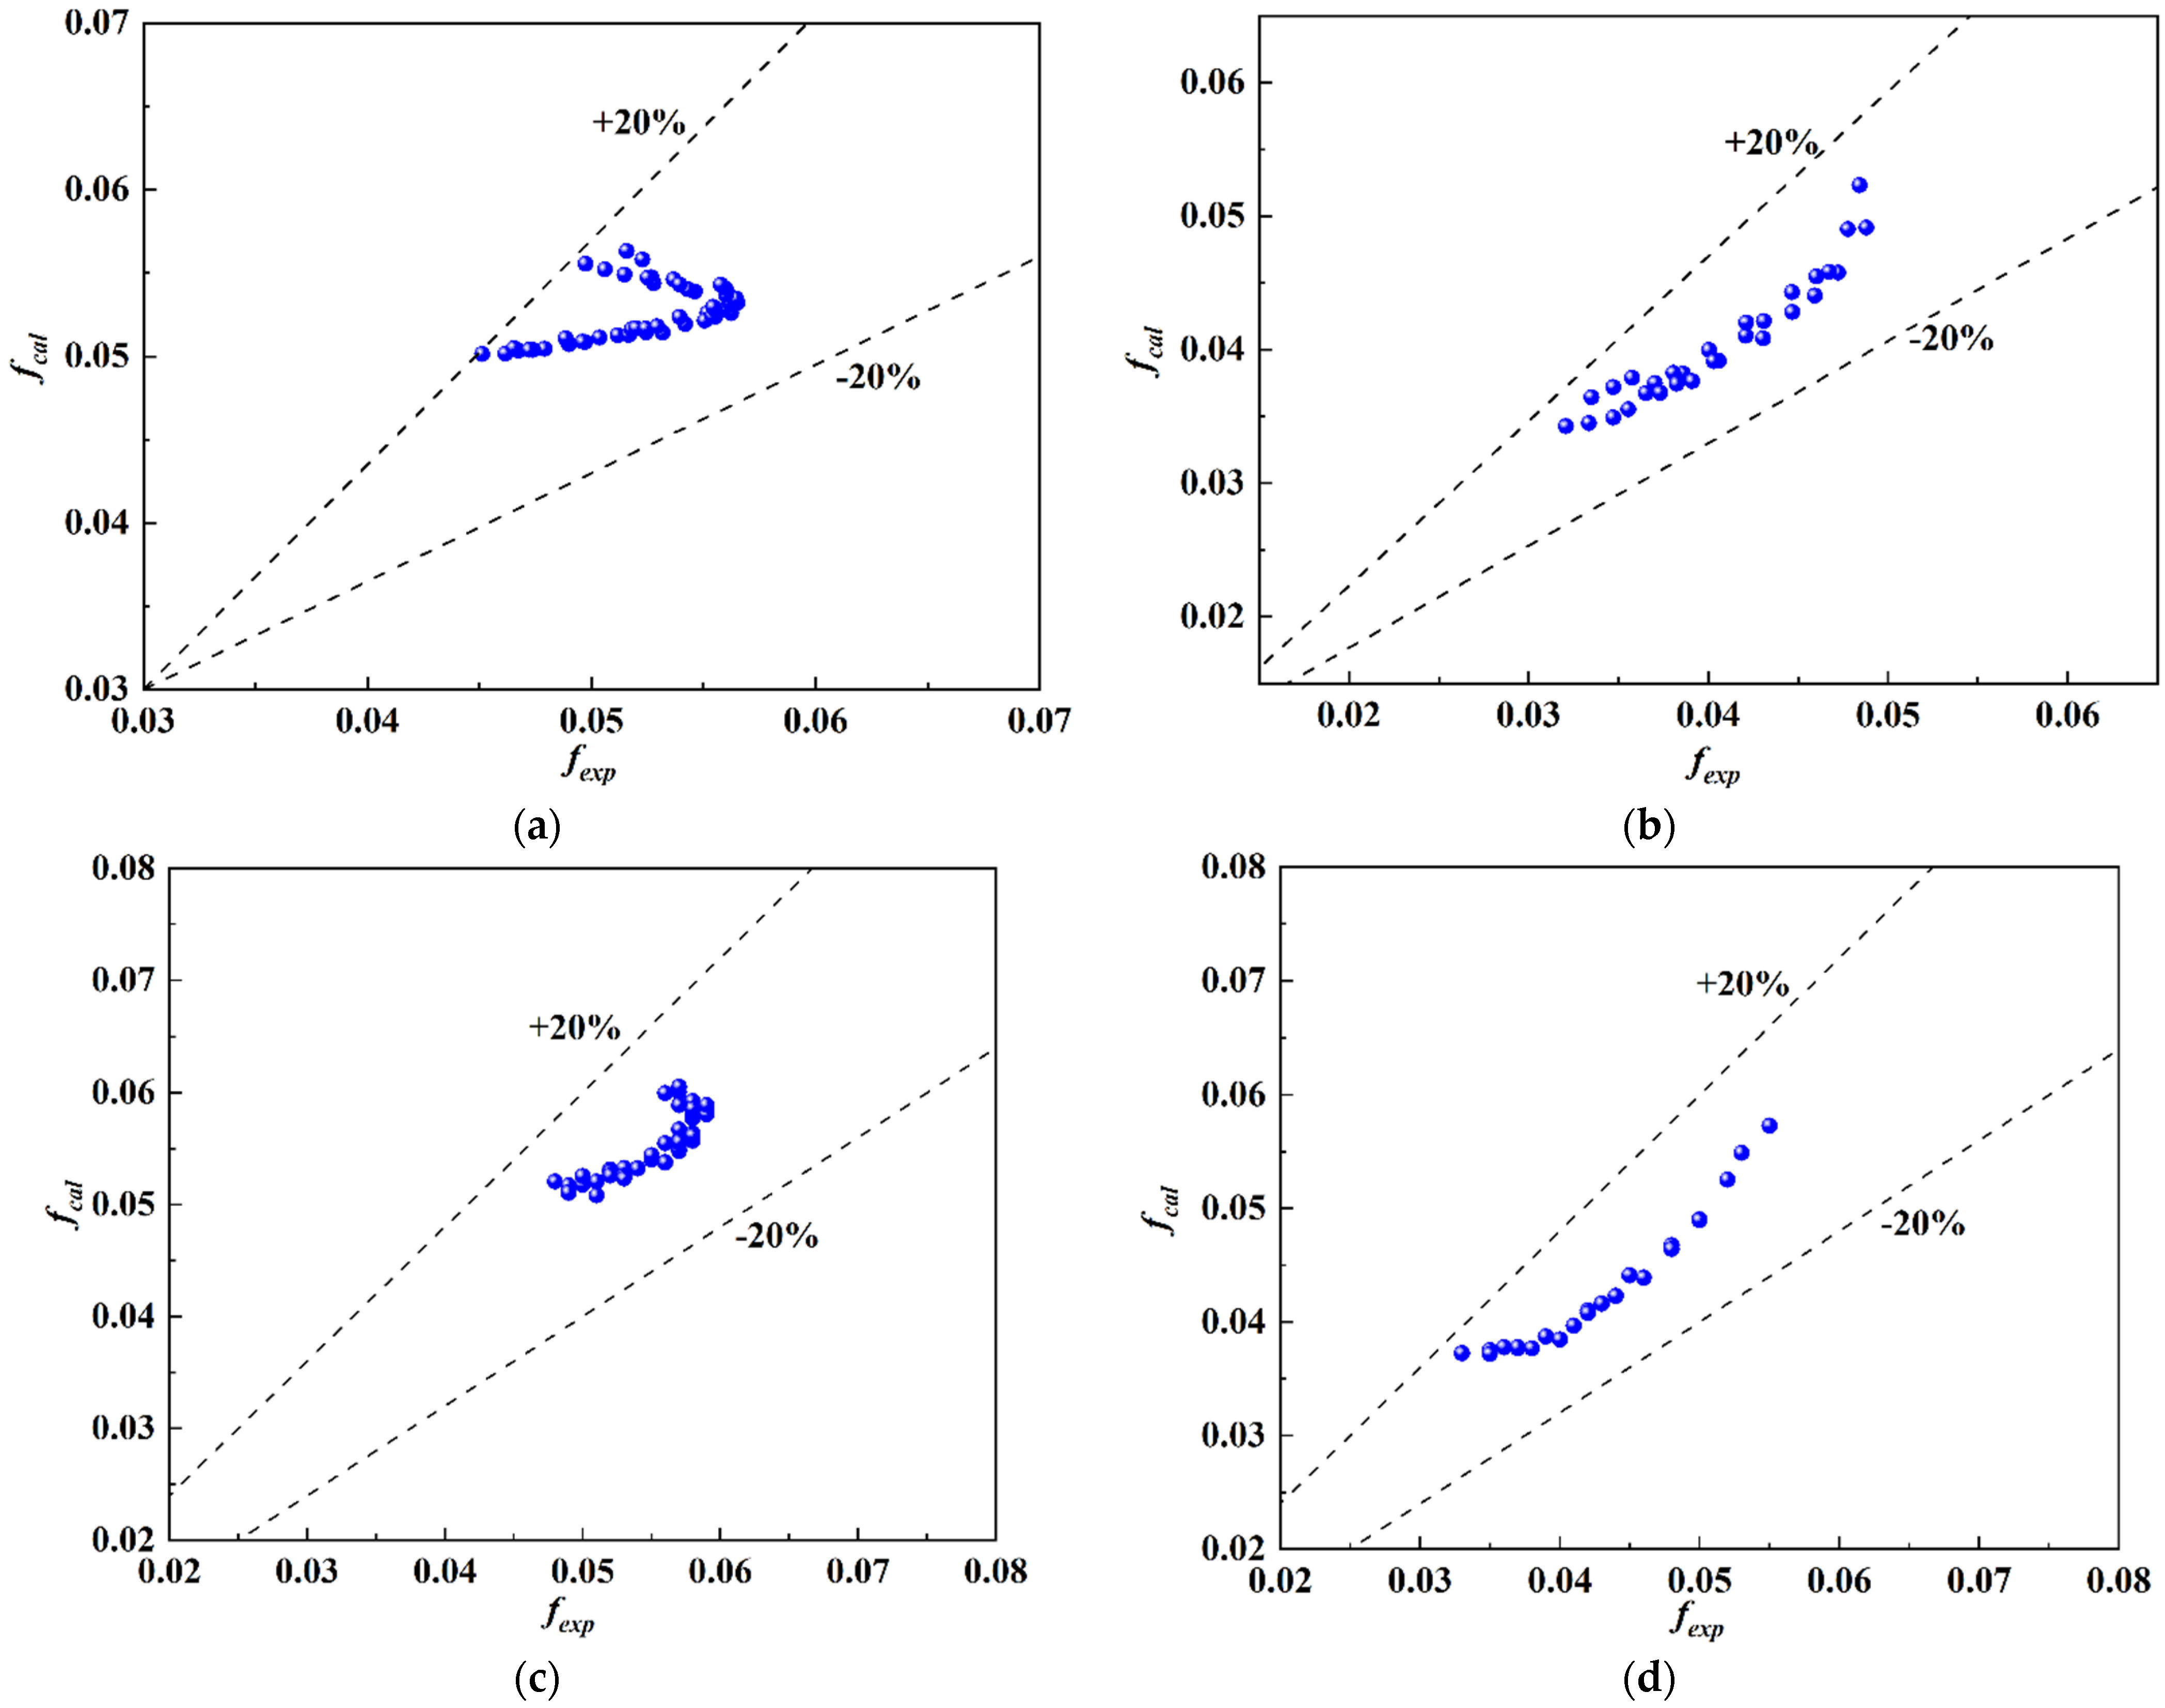
3.4.2. The Resistance Characteristics at Supercritical Pressure
4. Conclusions
- At subcritical pressures, the inner wall temperature increased with enthalpy in the low enthalpy region, the inner wall temperature remained stable in the nucleate boiling region, and the inner wall temperature abruptly increased after HTD occurred. The HTC was improved, and HTD occurred in advance with the increase in heat flux. In addition, the HTC could be improved, and HTD could be delayed by using the rifled tube.
- At near-critical pressure, the heat transfer characteristics were similar to those at the subcritical pressure. However, DNB was more likely to occur. The peak temperature increased as the heat flux increased. DNB could be avoided, and the HTC could be improved by using the rifled tube.
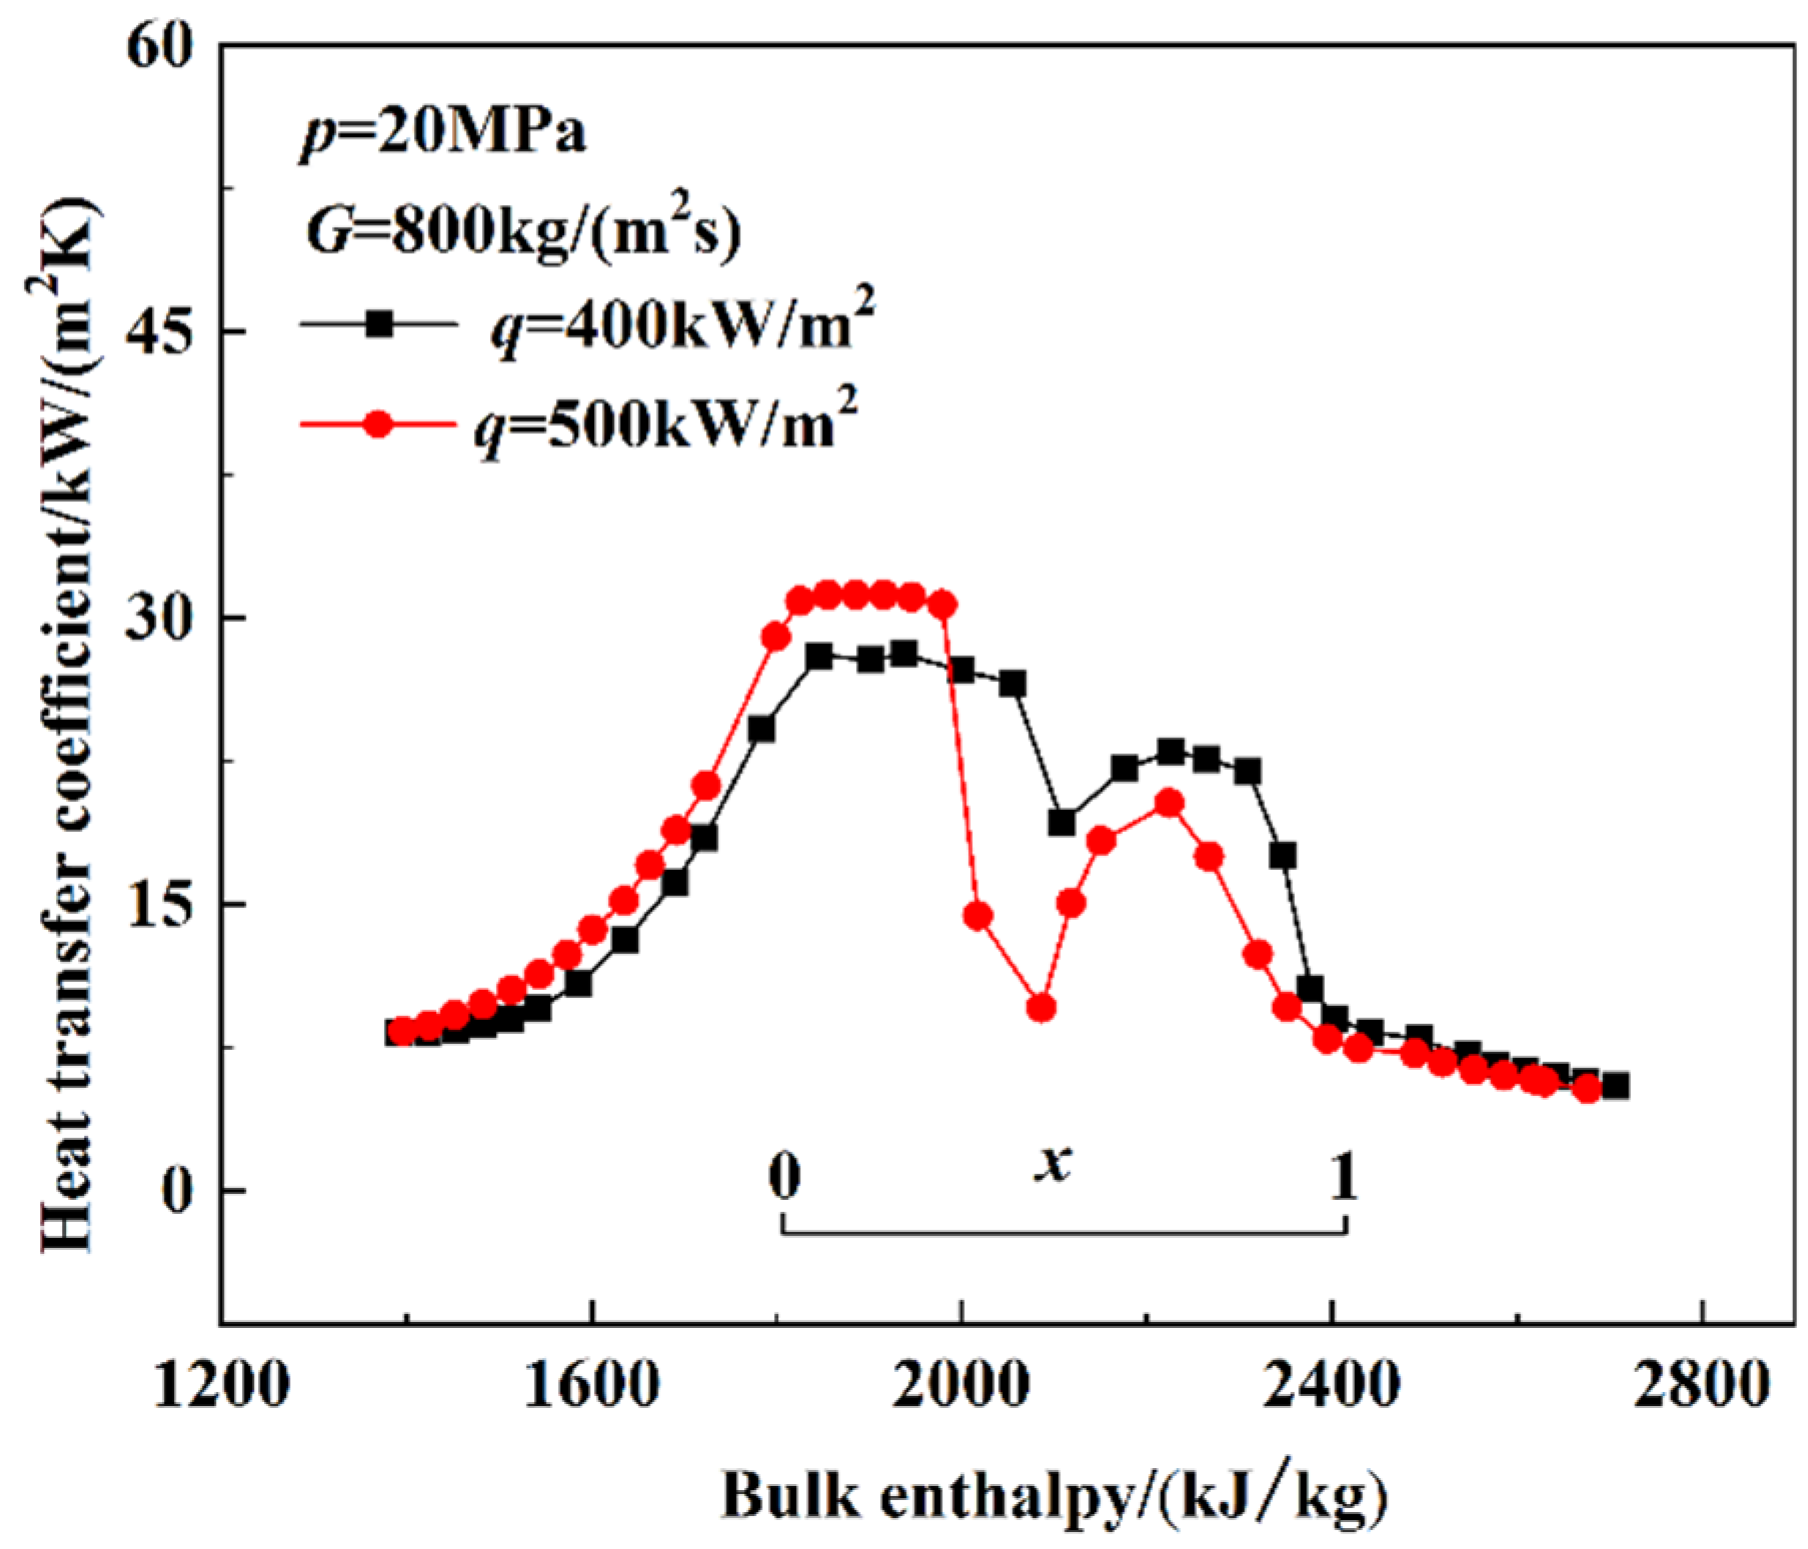
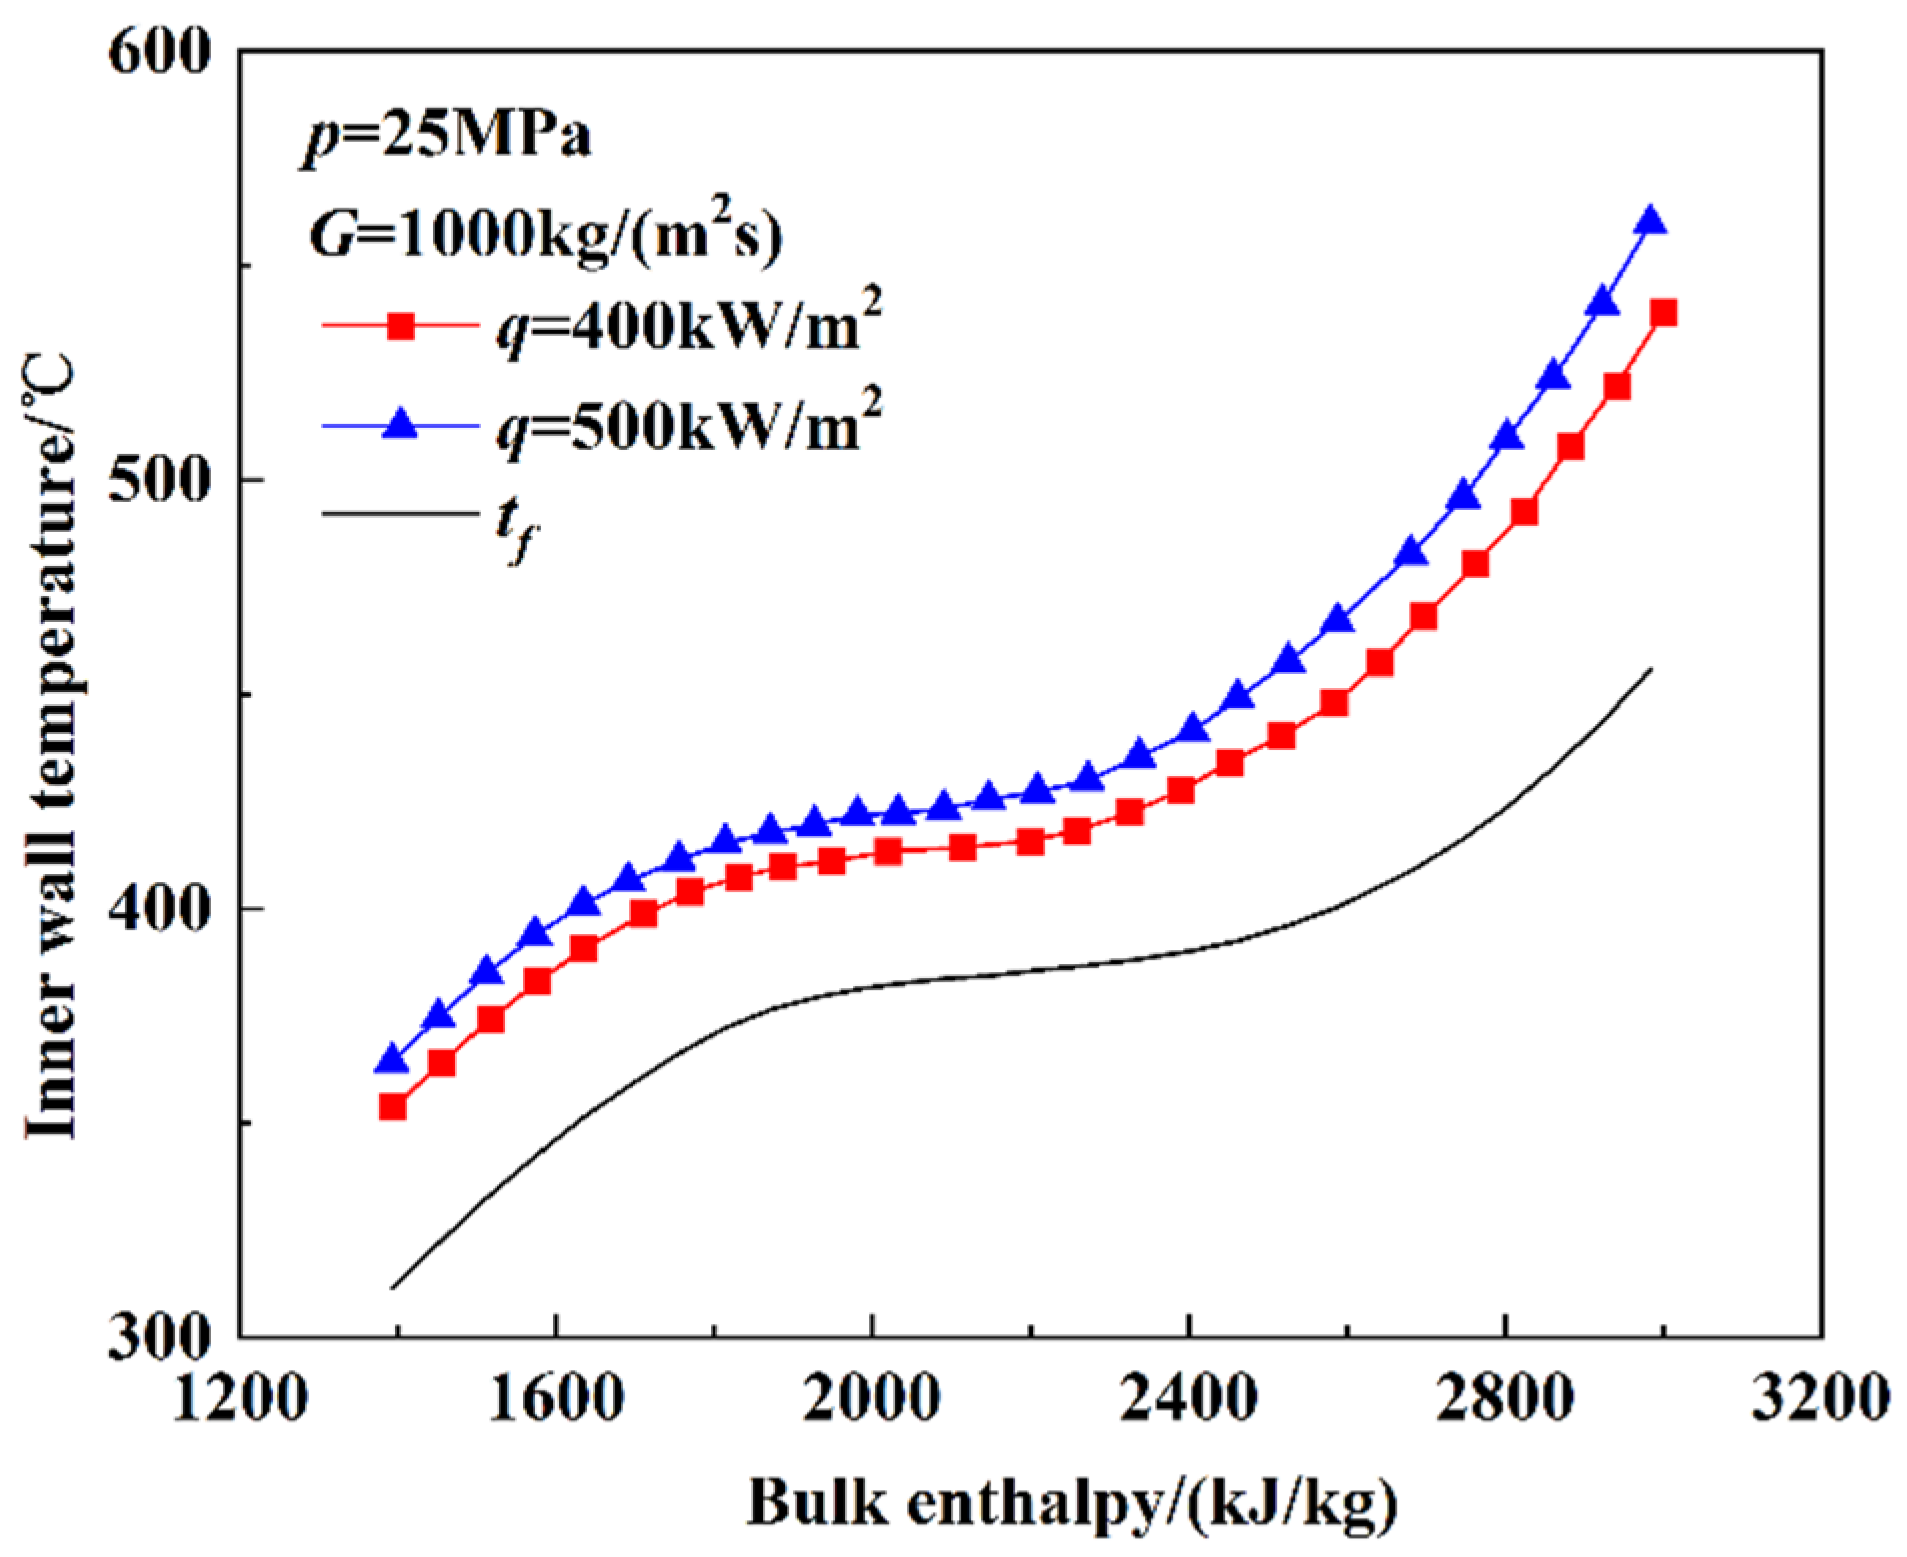
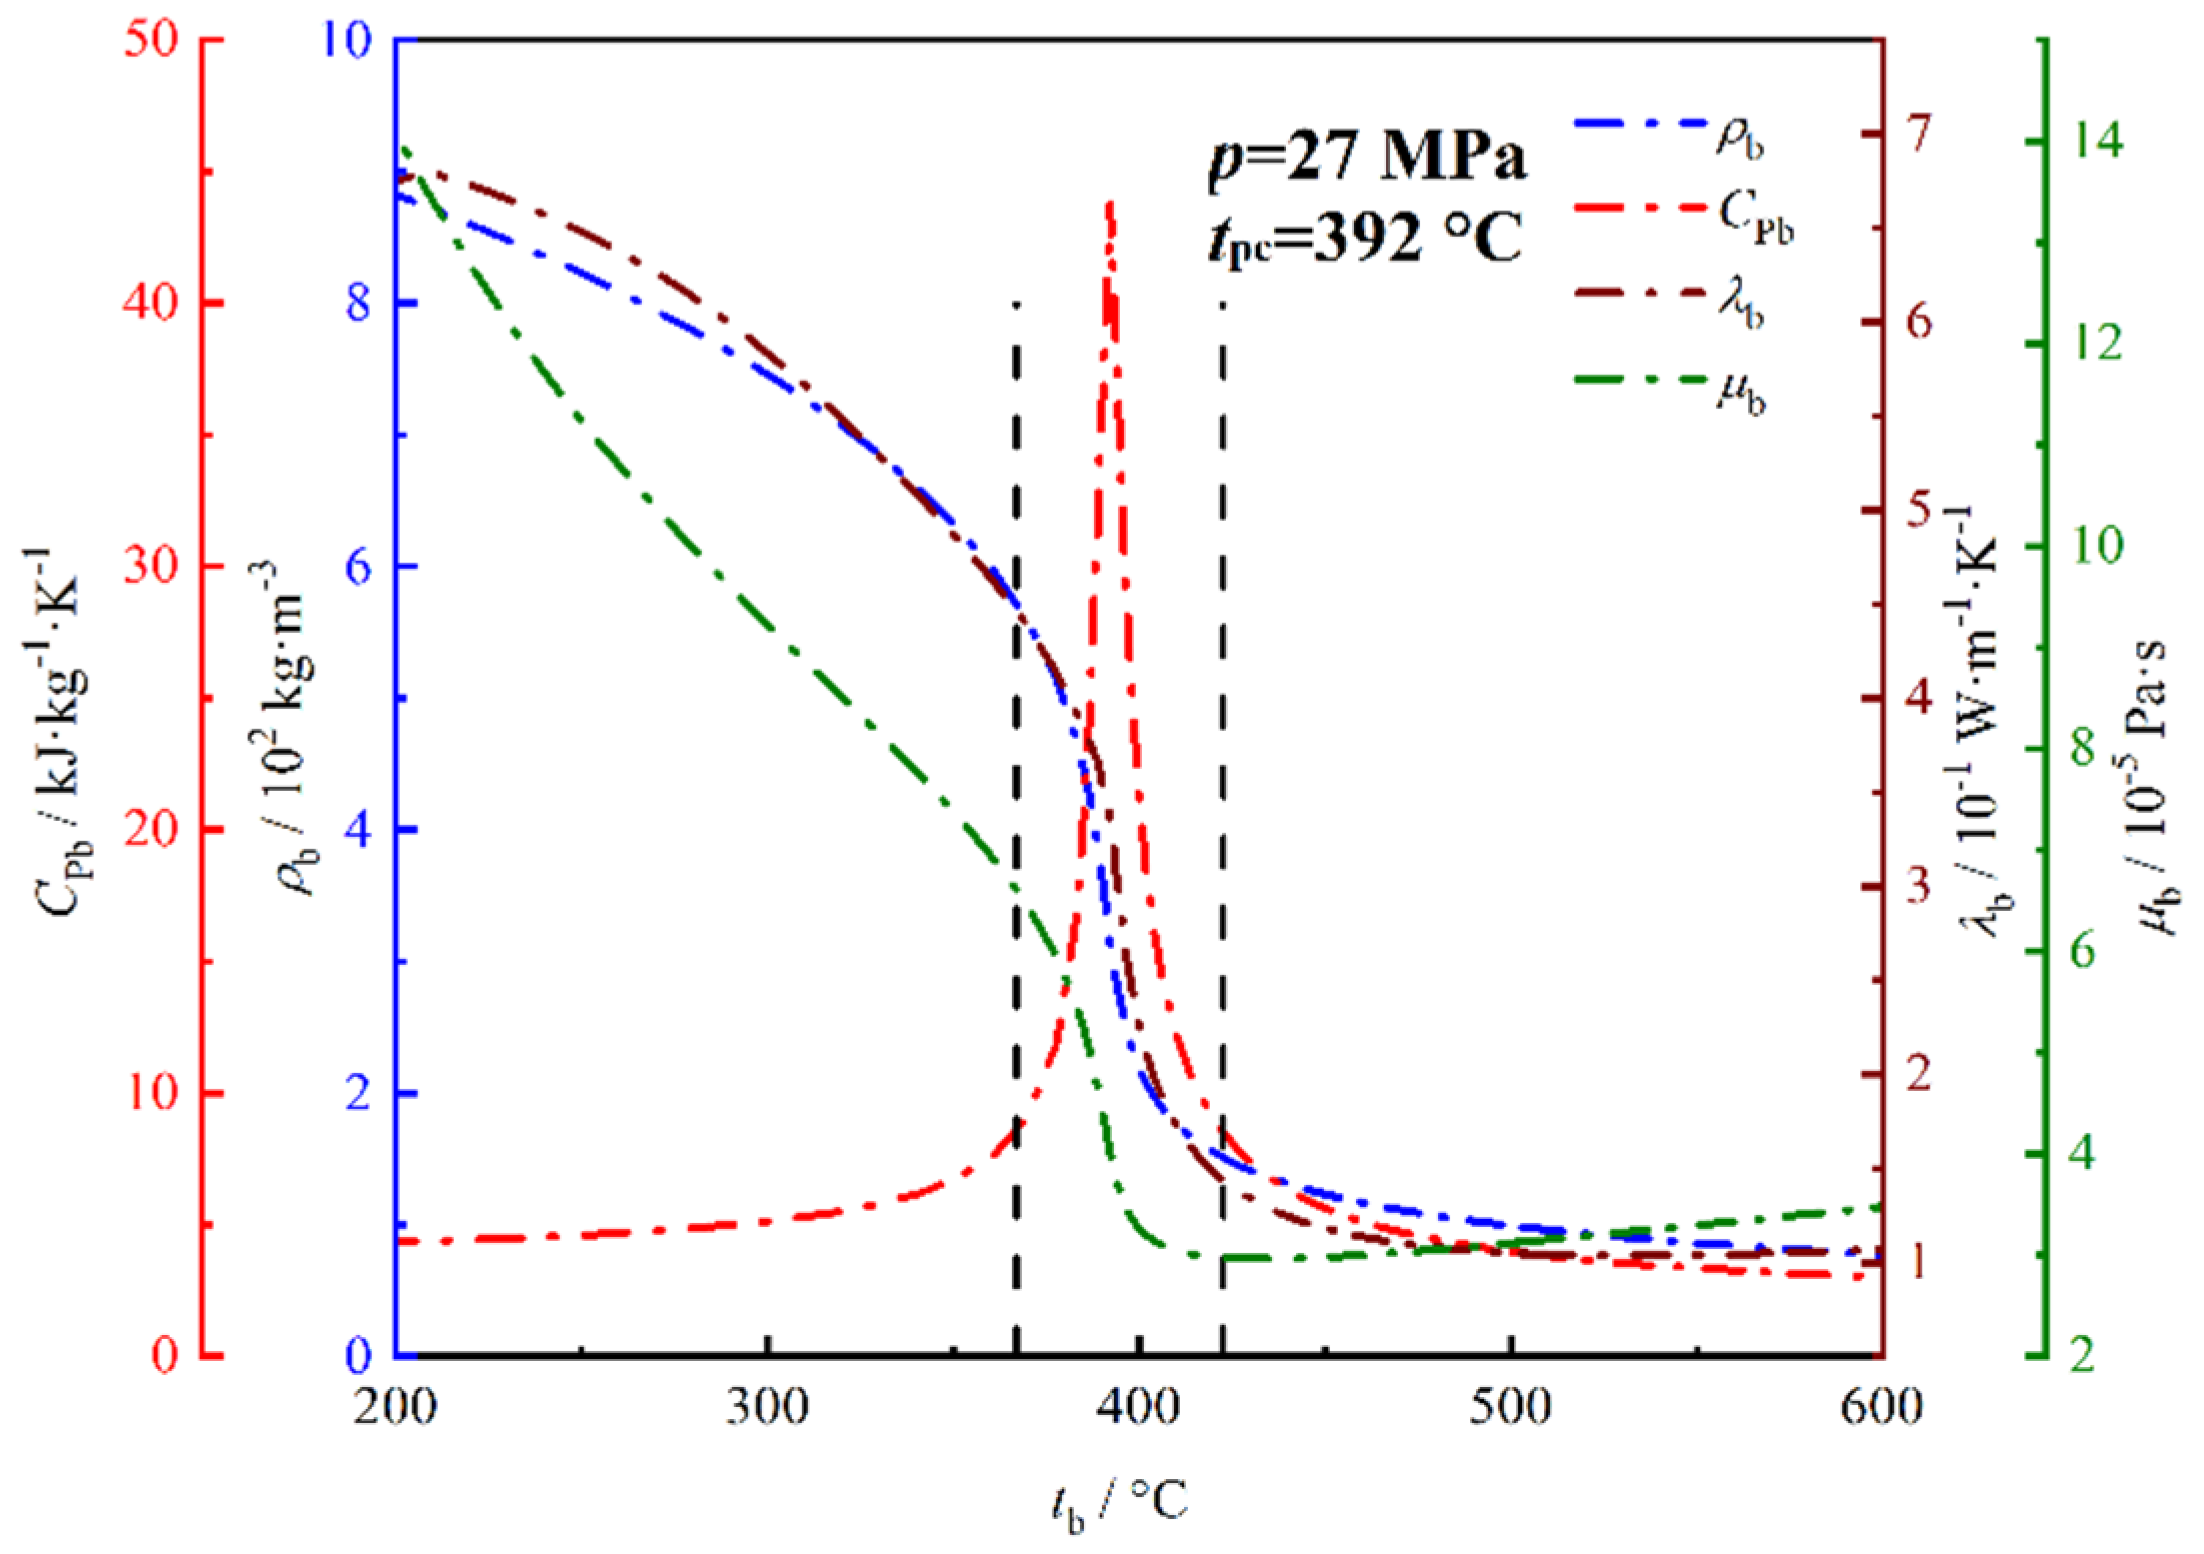
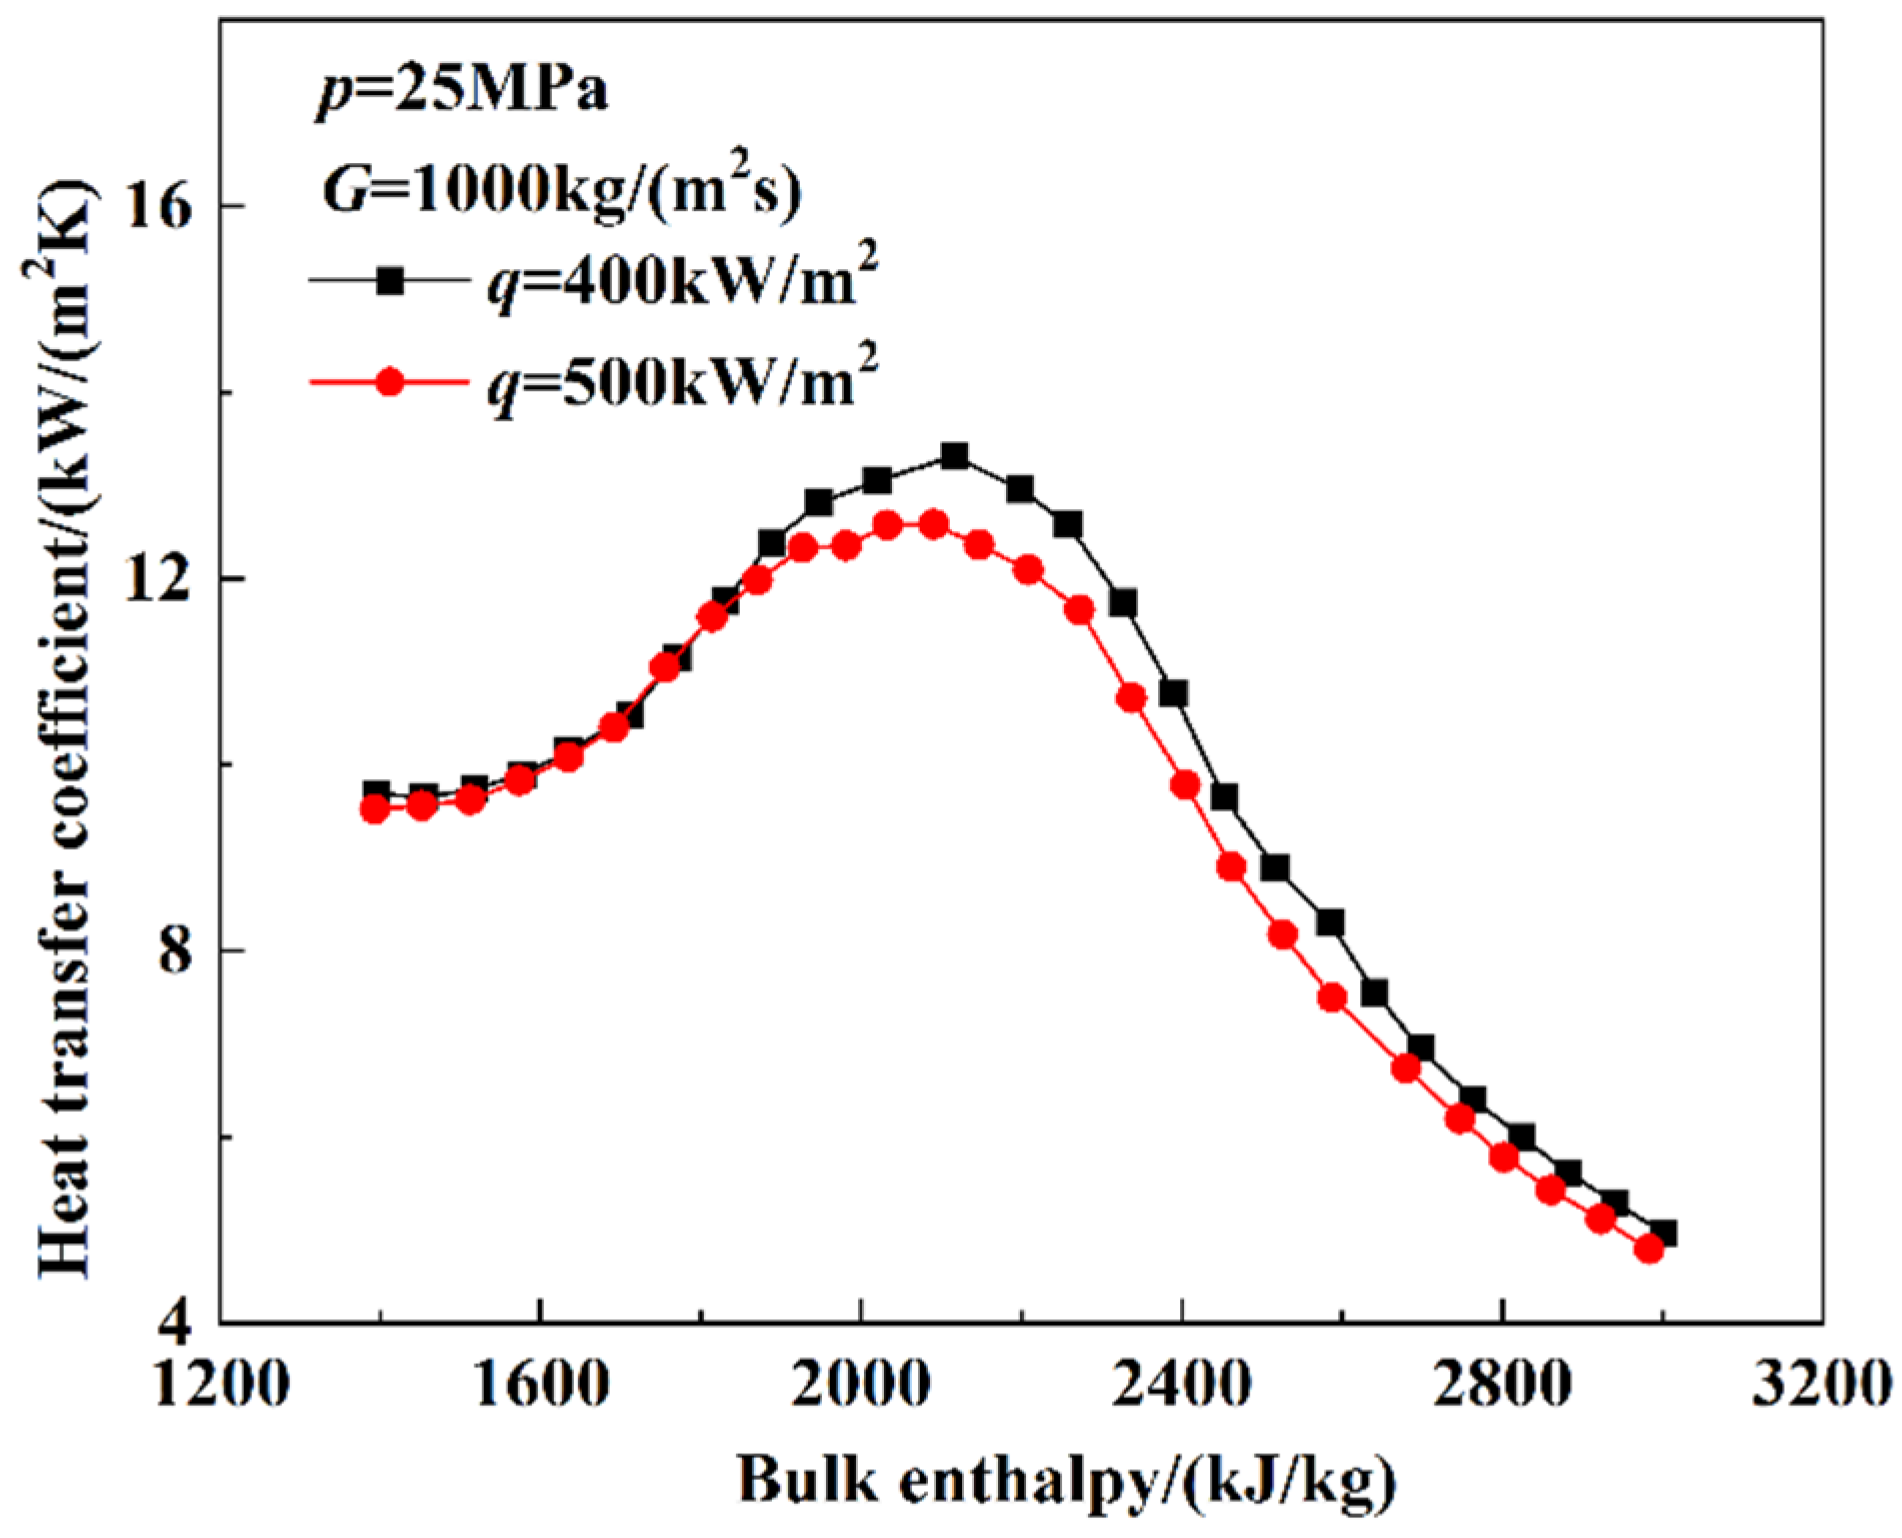
- At supercritical pressures, the HTC increased with enthalpy until it reached a maximum. After the maximum HTC, the HTC decreased as the bulk enthalpy increased. The increase in HTC resulted from the variation in the thermophysical properties. The influence of heat flux is related to the type of test section. The influence of heat flux on the heat-transfer characteristics in the smooth tube was mainly reflected in the pseudo critical region and the high-enthalpy region, where the HTC decreased as heat flux increased. The influence of the heat flux on heat-transfer characteristics in the rifled tube was mainly reflected in the low-enthalpy region, where the HTC increased with heat flux.
- The heat transfer correlations of the smooth tube and rifled tube were fitted by the experimental data. The heat transfer correlations were divided by subcritical, near-critical, and supercritical pressure. The average relative errors are limited to 20%. All the correlations apply only to the specific tube type used in the experiments.
- The friction resistance coefficient correlations of the smooth tube and rifled tube were fitted by the experimental data, and they were divided by subcritical/near-critical and supercritical pressure. The average relative errors were limited to 20%. All the correlations applied only to the specific tube type used in the experiments.
Author Contributions
Funding
Data Availability Statement
Conflicts of Interest
Nomenclature
| Cp | Specific heat, J/(kg·K) |
| di | Inner diameter, m |
| do | Outer diameter, m |
| E | Voltage, V |
| I | Current, A |
| G | Mass flux, kg/(m2·s) |
| hw | Specific enthalpy of fluid at the inner wall, J/kg |
| hin | Inlet specific enthalpy of bulk fluid, J/kg |
| hout | Outlet specific enthalpy of bulk fluid, J/kg |
| hl | Single-phase heat transfer coefficient for the entire fluid as liquid, W/(m2·K) |
| htp | Two-phase heat transfer coefficient, W/(m2·K) |
| ΔH | Added enthalpy, J/s |
| λw | Thermal conductivity of test section, W/(m·K) |
| λg | Thermal conductivity of gas phase, W/(m·K) |
| P | Pressure, Pa |
| Pcr | Critical pressure, Pa |
| q | Heat flux, W/m2 |
| QE | Electric power, W |
| tf | Bulk fluid temperature, °C |
| tiw | Inner wall temperature, °C |
| tow | Outer wall temperature, °C |
| vf | Specific volume while the characteristic temperature is the bulk fluid temperature |
| vw | Specific volume while the characteristic temperature is the inner wall temperature |
| x | Dryness, kg/kg |
| η | Thermal efficiency of electric power, % |
| μg | Dynamic viscosity of gas phase, N·S/m2 |
| μl | Dynamic viscosity of liquid phase, N·S/m2 |
| ρg | Density of gas phase, kg/m3 |
| ρl | Density of liquid phase, kg/m3 |
| Xtt | Martinelli parameter |
| Subscript | |
| gw | Physical property of gas phase state water when the qualitative temperature is the inner wall |
| lo | Entire liquid phase state |
| l | Liquid phase state |
| g | Gas phase state |
| cr | Critical pressure |
| max | Maximum value for operating parameter in experiments |
| sl | Saturated liquid water |
| sv | Saturated vapor |
References
- Lei, X.L.; Li, H.X.; Zhang, W.Q.; Dinh, N.T.; Guo, Y.M.; Yu, S.Q. Experimental study on the difference of heat transfer characteristics between vertical and horizontal flows of supercritical pressure water. Appl. Therm. Eng. 2017, 113, 609–620. [Google Scholar] [CrossRef] [Green Version]
- Yu, S.Q.; Li, H.X.; Lei, X.L.; Feng, Y.C.; Zhang, Y.F.; He, H.; Wang, T. Influence of buoyancy on heat transfer to water flowing in horizontal tubes under supercritical pressure. Appl. Therm. Eng. 2013, 59, 380–388. [Google Scholar] [CrossRef]
- Wang, H.; Bi, Q.C.; Yang, Z.D.; Gang, W.; Hu, R. Experimental investigation on heat transfer characteristics of high pressures water in a vertical upward annular channel. Exp. Therm. Fluid Sci. 2013, 45, 169–179. [Google Scholar] [CrossRef]
- Shen, Z.; Yang, D.; Chen, G.M.; Xiao, F. Experimental investigation on heat transfer characteristics of smooth tube with downward flow. Int. J. Heat Mass Transf. 2014, 68, 669–676. [Google Scholar] [CrossRef]
- Swenson, H.S.; Carver, J.R.; Kakarala, C.R. Heat transfer to supercritical water in smooth bore tubes. J. Heat Transf. 1965, 84, 477–484. [Google Scholar] [CrossRef]
- Vikhrev, Y.V.; Barulin, Y.D.; Konkov, A.S. A study of heat transfer in vertical tubes at supercritical pressures. Teploenergetika 1967, 14, 116–119. [Google Scholar]
- Yamagata, K.; Yoshida, S.; Fujii, T.; Hasegawa, S.; Nishikaw, K. Forced convective heat transfer to supercritical water flowing in tubes. Int. J. Heat Mass Transf. 1972, 15, 2575–2593. [Google Scholar] [CrossRef]
- Kolher, W.; Kastner, W. Heat transfer and pressure loss on rifled tubes. In Proceedings of the 8th International Heat Transfer Conference, San Francisco, CA, USA, 17–22 August 1986; Volume 5, pp. 2861–2964. [Google Scholar]
- Kafenguaz, N.L.; Fedorov, M.I. Pseudoboiling and heat transfer in a turbulent flow. J. Eng. Phys. 1968, 14, 489–490. [Google Scholar] [CrossRef]
- Grabezhnaya, V.A.; Kirillov, P.L. Heat transfer in pipes and rod bundles during flow of supercritical pressure water. At. Energy 2004, 96, 358–364. [Google Scholar] [CrossRef]
- Yoshida, S.; Mori, H. Heat transfer to supercritical pressure fluids flowing in tubes. In Proceedings of the 1st International Symposium on Supercritical Water-Cooled Reatcor Design and Technology (SCR-2000), Tokyo, Japan, 6–8 November 2000. Paper No. 106. [Google Scholar] [CrossRef]
- Mokry, S.; Pioro, I.; Farah, A.; King, K.; Gupta, S.; Peiman, W.; Kirillov, P. Development of supercritical water heat transfer correlation for vertical bare tubes. Nucl. Eng. Des. 2011, 241, 1126–1136. [Google Scholar] [CrossRef]
- Wang, S.Y.; Yang, D.; Zhao, Y.J.; Qu, M.F. Heat transfer characteristics of spiral water wall tube in a 1000 MW ultra-supercritical boiler with wide operating load mode. Appl. Therm. Eng. 2018, 130, 501–514. [Google Scholar] [CrossRef]
- Wang, S.Y.; Xin, Y.F.; Yang, D.; Dong, L.; Zhou, X.H. Experimental and numerical study on the heat transfer to supercritical water in an inclined smooth tube. Int. J. Therm. Sci. 2021, 170, 10711. [Google Scholar] [CrossRef]
- Shen, Z.; Yang, D.; Li, Y.D.; Liang, Z.Y.; Wan, L. Numerical analysis of heat transfer to water flowing in rifled tube at supercritical pressures. Appl. Therm. Eng. 2018, 133, 704–712. [Google Scholar] [CrossRef]
- Pioro, I.L.; Khartabi, H.F.; Duffey, R.B. Heat transfer to supercritical fluids flowing in channels-empirical correlations (Survey). Nucl. Eng. Des. 2004, 230, 69–91. [Google Scholar] [CrossRef]
- Chen, J.C. Correlation for boiling heat transfer to saturated fluids in convective flow. Ind. Eng. Chem. Process Dev. 1996, 5, 322–329. [Google Scholar] [CrossRef] [Green Version]
- Polyakov, A.F. Heat transfer under supercritical pressures. Adv. Heat Transf. 1991, 21, 1–51. [Google Scholar] [CrossRef]


| Parameter | Dimension |
|---|---|
| Outer diameter, dout | 31.8 mm |
| Maximum inner diameter, dmax | 20.8 mm |
| Minimum inner diameter, dmin | 18.1 mm |
| Hydraulic diameter, dh | 19.75 mm |
| Number of thread, N | 4 |
| Thread form | orthogon |
| Thread height, H | 1.35 mm |
| Thread width, b | 6 mm |
| Thread angle, a | 43.6° |
| Pitch, S | 17.5 mm |
| Case | Pressure MPa | Heat Flux kW/m2 | Mass Flux kg/(m2·s) | Start Parameters | End Parameters | ||||
|---|---|---|---|---|---|---|---|---|---|
| Temperature °C | Enthalpy kJ/kg | Dryness | Temperature °C | Enthalpy kJ/kg | Dryness | ||||
| 1 | 10 | 200 | 300 | 275 | 1209 | −0.15 | 320 | 2782 | 1.04 |
| 2 | 10 | 300 | 300 | 275 | 1209 | −0.15 | 320 | 2782 | 1.04 |
| 3 | 15 | 300 | 500 | 315 | 1423 | −0.19 | 355 | 2733 | 1.12 |
| 4 | 15 | 400 | 500 | 315 | 1423 | −0.19 | 355 | 2733 | 1.12 |
| 5 | 20 | 400 | 800 | 345 | 1607 | −0.49 | 375 | 2602 | 1.35 |
| 6 | 20 | 500 | 800 | 345 | 1607 | −0.49 | 375 | 2602 | 1.35 |
| 7 | 25 | 400 | 1000 | 360 | 1698 | 450 | 2950 | ||
| 8 | 25 | 500 | 1000 | 360 | 1698 | 450 | 2950 | ||
| Parameter | Standard Uncertainty |
|---|---|
| Fluid temperature | 0.3 °C |
| Inner wall temperature | 0.4 °C |
| Pressure | 0.006 MPa |
| Mass flux | 6.2 kg/(m2·s) |
| Inner wall heat flux | 21.2 kW/m2 |
Publisher’s Note: MDPI stays neutral with regard to jurisdictional claims in published maps and institutional affiliations. |
© 2022 by the authors. Licensee MDPI, Basel, Switzerland. This article is an open access article distributed under the terms and conditions of the Creative Commons Attribution (CC BY) license (https://creativecommons.org/licenses/by/4.0/).
Share and Cite
Du, X.; Li, W.; Zhang, X.; Chen, J.; Chen, T.; Yang, D. Experimental Research on the Flow and Heat Transfer Characteristics of Subcritical and Supercritical Water in the Vertical Upward Smooth and Rifled Tubes. Energies 2022, 15, 7941. https://doi.org/10.3390/en15217941
Du X, Li W, Zhang X, Chen J, Chen T, Yang D. Experimental Research on the Flow and Heat Transfer Characteristics of Subcritical and Supercritical Water in the Vertical Upward Smooth and Rifled Tubes. Energies. 2022; 15(21):7941. https://doi.org/10.3390/en15217941
Chicago/Turabian StyleDu, Xiaocheng, Weiteng Li, Xirong Zhang, Jingrong Chen, Tingyu Chen, and Dong Yang. 2022. "Experimental Research on the Flow and Heat Transfer Characteristics of Subcritical and Supercritical Water in the Vertical Upward Smooth and Rifled Tubes" Energies 15, no. 21: 7941. https://doi.org/10.3390/en15217941
APA StyleDu, X., Li, W., Zhang, X., Chen, J., Chen, T., & Yang, D. (2022). Experimental Research on the Flow and Heat Transfer Characteristics of Subcritical and Supercritical Water in the Vertical Upward Smooth and Rifled Tubes. Energies, 15(21), 7941. https://doi.org/10.3390/en15217941