1. Introduction
The transportation industry is one of the main contributors to the production and emission of carbon dioxide gas, including the transportation in the oil and gas industries, of which 60% is specialized transportation and 40% is technological transportation [
1,
2,
3]. Therefore, the electrification of transportation has received more attention in recent years [
4,
5]. Many studies have been conducted regarding the effect of increasing the number of electric vehicles on the reduction in carbon emissions [
6,
7,
8]. According to a study on the potential of the reduction in carbon dioxide emissions in German commercial transport by electric vehicles, the postal service can avoid CO2 emissions by about 40–70% if it uses “green” electricity for charging [
7]. Additionally, based on the estimation of carbon dioxide emissions from the electrification of conventional diesel buses in Shenzhen, China, the use of electric buses can reduce CO
2 emissions by 21.8% compared to conventional diesel buses in 2018 [
8].
The fast-charging method is one of the attractive ways to enable the use of electric vehicles over long distances, which has a charging time of about a few minutes [
9,
10]. The charging power of the fast charger is in the range of 20 kW to 250 kW and more [
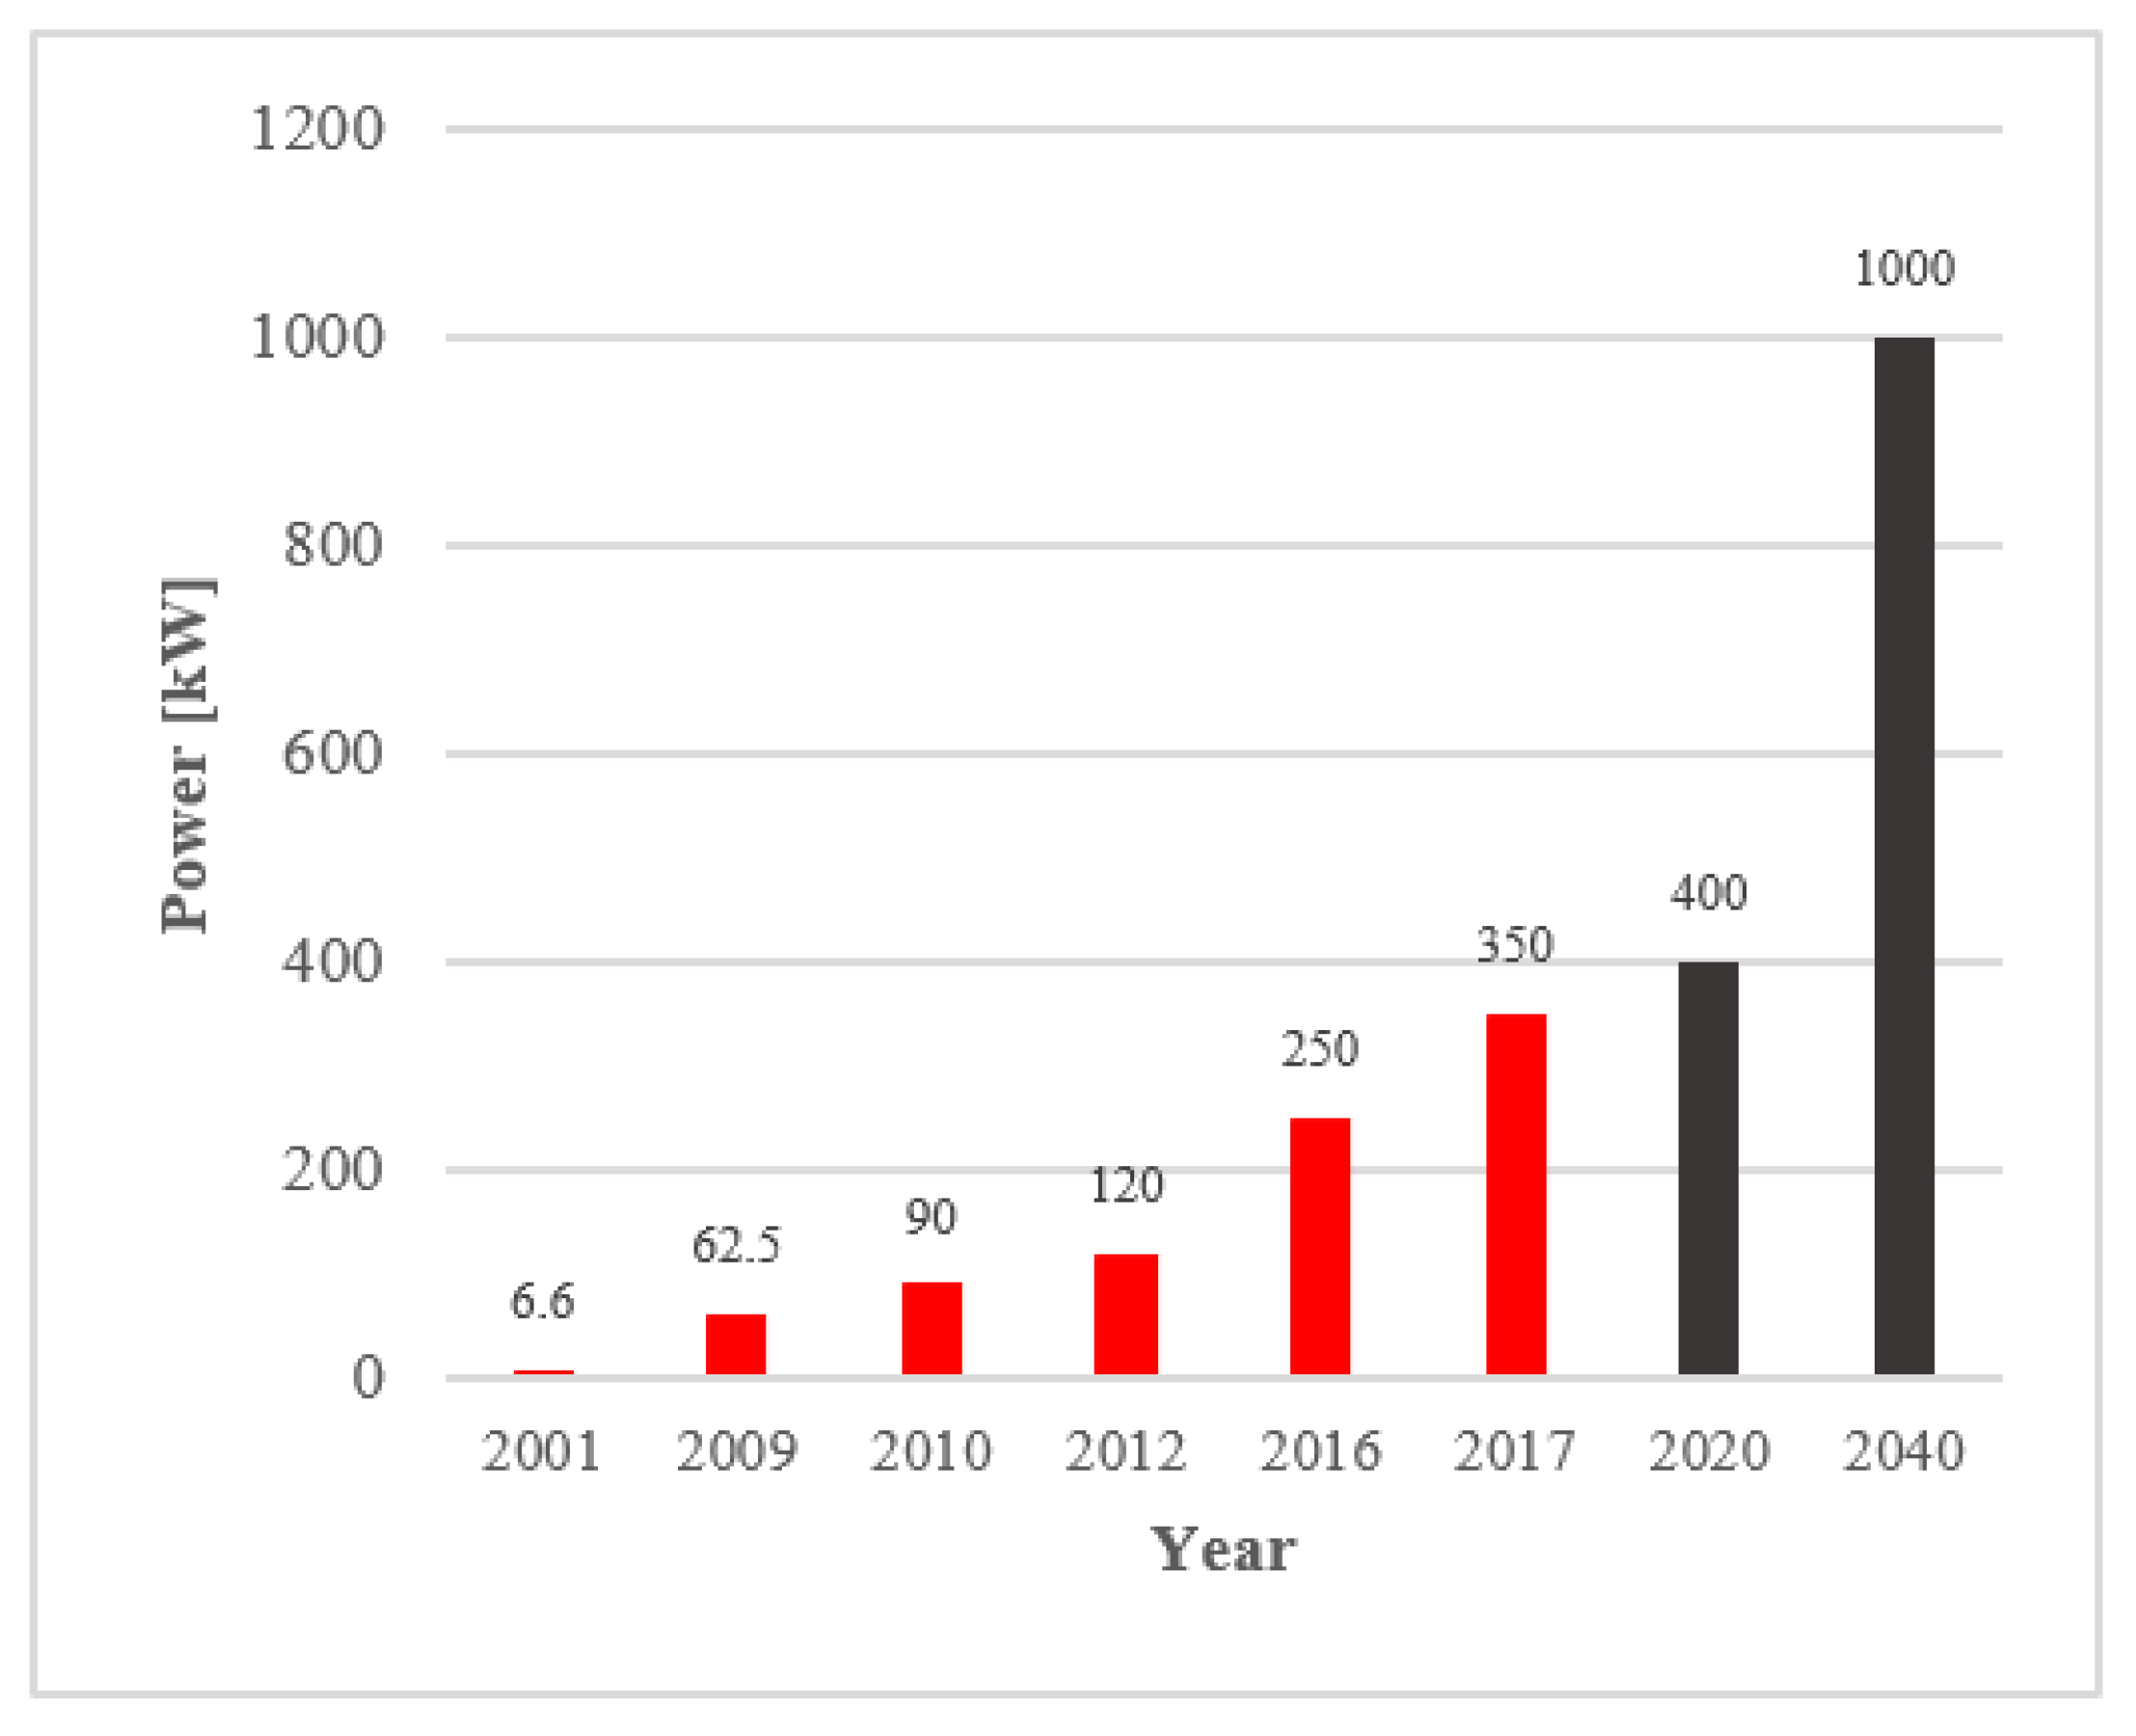
11]. ABB has developed a 350 kW charger and claims it is the fastest charger available. The company has also developed and operated a 600 kW flash charger for TOSA electric buses [
12,
13]. As can be seen in
Figure 1, the power of chargers has increased rapidly in recent years [
13].
Based on the rate observed in
Figure 1 and considering the expected development of battery technologies in the future, a peak power of 1 MW can be achieved in 2040. In this regard, the company “Trolleybus Optimisation System Alimentation (TOSA)” has built an electric bus route in Geneva, Switzerland, with the bus being charged in just 15 s at the station. This 15 s is the time required for passengers to get off and on the bus. When the bus stops at the station, a power of 600 kW is transmitted through a transmission device to the light batteries installed on the bus. The new technology, called “Flash Charging”, was developed by engineers at ABB, one of the world’s leading companies in power and automation technologies [
12]. According to the World Bank report on air pollution in Tehran (health costs, resources, and policies) [
14], mobile sources (vehicles) are the biggest cause of pollution in Tehran. According to
Figure 2, 85% of pollution in Tehran is caused by heavy vehicles, among which the share of private sector buses is 35%, Tehran city buses is 28%, trucks is 28%, and minibuses is 8%.
Therefore, the electrification of buses in Tehran is a of high priority. The TOSA flash charging solution enables the implementation of electric buses in the transportation fleet of Tehran. However, measures must be taken to supply the energy required by flash charging stations and to compensate for its negative effects. Flash charging technology is one of the ultra-fast chargering method that injects 600 kW into the E-bus battery in 15–20 s. It, therefore, imposes a “high peak short-term demand” on the power grid. This demand will have negative effects on the distribution network. So, a solution must be provided to eliminate or reduce these negative effects. One of the best solutions is using energy storage devices along with ultra-fast chargers. Due to the characteristics of flash charging technology, the desired storage device should have specifications such as fast response, high-power density, high efficiency, and high-duty cycle. In some studies, hybrid energy storage systems (HESS) have been used in electric vehicle charging stations. HESS is based on superconducting magnetic energy storage (SMES) and battery energy storage (BES) devices [
15]. Additionally, FESS and BES storage units have been used in the application of charging stations based on renewable energy sources [
16,
17]. In the presented structures, Li-ion batteries, Ni-cd batteries, and lead-acid batteries are usually used for long-term energy supply. These batteries have some disadvantages, such as high cost, short life span, high maintenance costs, destructive impact on the environment, and a limited number of charges/discharges [
18].
In this paper, a flywheel energy storage system (FESS)-based electric bus charging station for a case study in Tehran BRT is presented. According to the specifications of the chosen Tehran BRT line, the power and energy requirements for the charging station are obtained in such a way that it has the least negative impact on the power grid. In
Section 2, a topology for the E-bus charging station is proposed and the technical specification of each charging station is obtained. In
Section 3, an economic calculation was conducted in order to compare the cost of using FESS instead of lead-acid battery in the charging station. In
Section 4, a control method for FESS is described. In
Section 5, the proposed charging station is simulated and the calculated specifications are compared with the simulation results. In
Section 6, a downsized laboratory setup for the proposed charging station is implemented and the experimental results are compared with the simulation and calculated results. Finally, in
Section 7, the conclusion of the results for the proposed charging station is presented.
2. Proposed E-Bus Flash Charging Design and Sizing
To size a FESS-based flash charging station, the first step is choosing a bus route in the city. For this purpose, Line 1 of Tehran BRT was selected. The specifications of this bus line are shown in
Table 1.
According to the start and end time of Line 1 of Tehran BRT, the travel time of buses on the route is 16 h and 52 min. As a result, depending on the length of the journey, the number of times (
) that a bus travels between the start and end of the line can be calculated as follows:
Based on the schedule of buses according to the Website of Tehran Bus Company, the minimum travel time from one station to another is 2 min. Additionally, the average stop time of each bus at the station is 30 s. To equip this expressway with an electric bus, the TOSA electric bus shown in
Figure 3 was used [
8]. This bus has two battery packs, each with a capacity of 40 kWh. As a result, the total battery capacity of the TOSA bus is
[
11]. This bus is charged with a pantograph that can be disconnected and reconnected in a short time (less than 5 s).
For remaining the bus on the line 1 route, the remaining capacity of the bus battery, taking into account the minimum state of charge
, must be as follows:
The energy consumption of the TOSA electric bus by the implementation of the electricity consumption model (ECONS-M) [
19,
20] and using TOSA electric bus specifications [
21] was obtained. This model calculates the longitudinal dynamics of the vehicle as a function of the speed of the driving cycle. The main output of this model is the characteristic of electric bus energy consumption. For a vehicle in motion, the traction force can be obtained using a simple two-dimensional application of Newton’s second law to describe the translational and rotational systems. Newton’s second law is expressed as follows:
where
,
, and
are mass of an object, acceleration, and force, respectively. In this model, the effect of angular moments created by rotating propulsion components was obtained by adding an equivalent mass (
) to the vehicle mass, according to Equations (3)–(6). This mass is estimated to be 10% of the vehicle weight for buses [
22].
Figure 4 shows the free-body diagram of a moving vehicle. The main forces acting on the body are the grade force (
), the rolling resistance force (
), and the aerodynamic force (
).
The
represents the force provided by the motor to propel the vehicle by overcoming external resistance forces. Based on this, Equation (3) can be rewritten as follows:
where
is the sum of the external forces acting on the vehicle. The grade force (
), aerodynamic force (
), and rolling resistance force (
) are, respectively, defined in the following equations.
In Equation (5),
is the slope of the road in degrees and
is the standard gravity constant. In Equation (6),
is the air density,
is the front cross-section of the car,
is the drag coefficient, and
is the car speed. Finally, in Equation (7),
is the rolling resistance coefficient, which depends on the vehicle speed and the condition of the tires. The rolling resistance coefficient is obtained from the following equation.
By obtaining
from Equation (4), the wheel torque
is obtained using the following equation:
In the above relationship,
is the radius of the wheel. The electric motor torque
is related to wheel torque according to the following relationship.
where
is the ratio constant of the bus gearbox and
is the transmission efficiency constant.
The rotational speed
of the wheels is obtained from the following equation:
The relationship between wheel rotational speed and motor rotation speed is as follows:
With the motor efficiency available (
), the instantaneous power consumption of the bus is obtained from the following relationship:
In the above relationship, is the efficiency of the converter and is the required power of the peripheral equipment.
When the bus brakes, the motor turns into a generator. This allows the partial recovery of kinetic energy to recharge the batteries. In the case of regeneration, the instantaneous power is:
In the above relation,
is the motor torque when the bus uses regenerative braking. Finally, the energy consumption of the electric bus is obtained simply by integrating the instantaneous power in terms of time in the form of the following relationship:
The main application of this model is to determine the total energy extracted or supplied from the battery to power the bus under certain driving conditions. The approach described in this analysis is a systematic approach for which the main propulsion components are represented by functions that can be fixed or changed according to different parameters (such as torque, speed, and temperature). The system used to model electric bus energy consumption is shown in
Figure 5. To calculate the energy consumption of the electric bus according to the proposed energy consumption model, the input parameters are presented in
Table 2.
By substituting the parameters presented in
Table 2 and considering an auxiliary devices power equal to 2.5 kW (heating, ventilation, and air conditioning (HVAC) in on), the average energy consumption of the electric bus is:
As a result, the total energy consumption of the bus during the journey from the beginning to the end of Line 1 is obtained from the following equation:
According to (2), the allowable amount of energy consumption from the initial capacity of the battery in each path is obtained from the following equation:
According to Equations (17) and (18), the capacity required to charge the bus battery along the route from beginning to end is obtained from the following equation:
By selecting 6 stations on the way and 6 stations on the return route as FESS-based flash charging stations (a total of 12 stations along Tehran line 1 BRT), the minimum amount of charging energy of each charging station is obtained from the following equation:
Therefore, each FESS-based flash charging station should charge the electric bus battery with a minimum energy of
. Since the electric bus stops at the station for
, during this time the charging station with a power of 600 kW charges the bus battery. Therefore, the charging capacity is obtained from the following equation, which must be greater than the minimum energy required to charge the electric bus:
2.1. Energy Storage Device Selection
Given that, all the energy to charge the battery of the electric bus must be provided by the FESS, a flywheel system with a capacity higher than this charging capacity must be selected. Therefore, two paralleled flywheel systems, as shown in
Figure 6, were selected. The total capacity of FESS for the charging station was selected as follows:
The torque-speed characteristic of the FESS electric machine includes two values of continuous torque (rated) and transient torque (peak). Therefore, the electric machine can provide, for example, 30 s of peak torque up to 100% of the rated torque at the charging and discharging mode. In this case, it can be assumed that the power in the short time of 20 s during E-bus charging is constant.
2.2. FESS Recharging Power and Energy Design
According to the required charging capacity, the discharge capacity of each flywheel during the charging period of the electric bus at the station is obtained from the following relation:
Given the minimum travel time from one station to another by bus, the maximum time to recharge the flywheel over the network is as follows:
According to Equations (11) and (12) and assuming that the flywheels are recharged to the same extent as their discharge capacity in the bus battery, the power of the power grid to charge the first flywheel system is obtained as follows:
The power required to recharge the second flywheel system is the same as the first flywheel system. As a result, the total network power is as follows:
The power circuit of the electric bus charging station is shown in
Figure 6. The station includes two FESS, power grid, and a flash charger. The electric bus is charged at the station with a power capacity of 600 kW and energy capacity of 3.33 kWh, which is supplied through two parallel flywheel systems. When there are no buses at the station, two parallel flywheels are recharged through a power of 100 kW grid with an energy capacity of 3.33 kWh.
The duty cycle of the flash charging station is shown in
Figure 7. Additionally, the proposed structure is shown in
Figure 8. Since the electric bus arrives at the station, the pantograph is connected to the battery from the top of the bus for a maximum time of
. The bus battery is then charged for a maximum time of
. During this time, two parallel flywheel systems are discharged to the bus battery. After disconnecting the pantograph, which takes the maximum time of
, the phase of recharging the flywheel systems through the power grid begins at the maximum time of
. This cycle is repeated when the next bus arrives. Based on the charging duty cycle, the flowchart of the charging strategy is shown in
Figure 9.
According to Equation (24) the maximum FESS energy is available. According to the converter efficiency of the FESS system, the following result is obtained:
By obtaining FESS energy, other parameters can be designed. The energy of the flywheel system is as follows:
In the above relation,
is the moment of inertia of the flywheel disk and
is the rotation angular velocity of the flywheel. For design for the desired speed of 14,000 rpm the rotation angular velocity of FESS is obtained as follows:
The moment of inertia of the flywheel is achieved as follows:
The moment of inertia equation can be defined as follows:
where
is the mass of the flywheel disk in kilograms (kg) and
is the radius of the disk in meters (m). Given that, the moment of inertia is obtained from Equation (18) and assuming
, the flywheel radius is obtained from the following equation:
Depending on the application, different geometric structures with different types of materials, such as steel, composite, and nanotechnology, are provided for the flywheel, each of which has different mechanical stress [
23,
24]. The geometric structure of the FESS is shown in
Figure 10. In this structure, the flywheel disc is connected to the rotor part through a mechanical coupling.
Table 3 shows the geometrical dimensions of the flywheel disk. Based on the designed flywheel disk, the maximum mechanical stress in terms of the outer radius and the maximum speed of the flywheel disc is shown in
Figure 11. As can be seen, with the increase in the outer radius and speed of the flywheel, the mechanical stress increases significantly. At the maximum speed of 14,000 rpm and the outer radius of 15 cm, the amount of stress increases to about 220 Mpa. According to the calculation results, in the worst working conditions, the maximum stress is lower than the allowed value for steel material (250 Mpa).
2.3. Power Electronics Converter Design
According to the proposed structure for the charging station, through an ac/dc converter (three-phase rectifier), power flows from the grid to the dc-link. Additionally, through a bidirectional dc/ac converter (three-phase inverter), power and energy flows from the FESS to the dc-link and vice versa. In this section, the technical specifications of these two power electronics converters is obtained. The structure of the grid-side converter is shown in
Figure 12.
According to grid power to charge FESS, the dc-link current is obtained as follows:
Assuming the rectifier converter efficiency is equal to
and the design for DC output power from the grid is equal to
, the following equation for the AC power required from the network (
) is obtained.
For a power factor (
) for the grid, the RMS value of the grid current (
) is obtained from the following equation:
During FESS charging mode, energy is transferred from the dc-link to the machine (motor operation) and during discharging mode, energy is transferred from the flywheel to the dc-link (generator operation). The structure of the FESS converter is shown in
Figure 13.
The FESS is designed to provide a maximum output power equal to the power of the charging station (
). Given that the DC bus voltage is constant, the DC bus current can be calculated as follows:
According to the use of two FESS as parallel to provide power derived by the charger, the following results are obtained:
Assuming the converter efficiency equal to
, the AC power of the electric machine is obtained from the following equation:
FESS generally has two key characteristics, which include power capacity and energy capacity. The power capacity depends on the design of the machine and power electronic converters, such as the current density of the stator winding, the cooling system, and the rating of the power electronic converters and their cooling system. Therefore, the peak charging and discharging power of the FESS can be achieved by selecting the power capacity of the electric motor and interface converters for different values. Another parameter is the energy capacity of the FESS, which depends on the inertia of the rotating disk and the speed of the storage device. Since, according to Equation (16), the value of energy is related to the square of the speed, high-speed flywheels are used for applications that require high energy capacity. However, in applications that require very high-power capacity and long storage time (similar to series or parallel batteries), it is possible to combine small flywheel storage units and achieve high-power and -energy capacities.
By entering a pulsed load (electrical bus load) during charging (energy change) according to Equation (40), it causes a change in the speed of the flywheel disc. In the charging mode of the electric bus, the speed of the flywheel is decreased, which depends on the charging time (
), charging power (
), charging FESS efficiency (
), and disk inertia (
). When recharging the flywheel, the speed of the flywheel increases similarly.
4. FESS Control Method
In this section, to control the FESS, the maximum torque per ampere (MTPA) control system was used. The block diagram of this control system is shown in
Figure 14. In this figure,
and
are the stator
d-axis and
q-axis currents, respectively. Additionally,
and
are the
d and
q axes voltages are generated for controlling the system, respectively [
26]. The rotor position (
) is used in
qd to
abc transformation. This method of control has two internal controllers to control the current and an external control loop to control the supply power, which is called a cascade controller [
27,
28]. In this control method, to calculate the reference currents of the d and q axes, it is necessary to calculate the optimal angle of the phase current (
). This optimal angle is calculated as follows [
29]:
where
is obtained from the outer loop controller. With consideration
, reference currents of the
d and
q axes can be calculated as follows:
In the outer loop, by holding the dc bus voltage constant, the reference power of the flywheel is obtained, which must be supplied by two parallel flywheels.
5. Simulation Results
The proposed structure of the flywheel-based flash charging station, shown in
Figure 8, was simulated with the electric bus charging cycle following
Figure 7. To control two parallel flywheels, the control method presented in
Figure 14 was used. The simulation results for electrical power are shown in
Figure 15. According to this figure, in this simulation, an electric bus enters the station at
. At
, the power transmission system (pantograph) is connected to the electric bus and is ready to charge the battery of the electric bus for
. During this time, the
electric bus battery, all powered by two parallel flywheels, is charged. The charging power is evenly divided between the two flywheels according to the control method, and each has the task of supplying
power. After the power transmission system (pantograph) is completely disconnected from the electric bus, which takes
, both flywheels with a power of
each, the total of which is supplied from the network, are recharged for
. The next cycle is repeated exactly as the next bus arrives.
Figure 16 shows the DC currents drawn from the mains and flywheels and the injected currents from the charger to the battery of the electric bus. Given that the DC bus voltage is
(as shown in
Figure 17), the values of the currents are obtained by dividing the electric power by the DC bus voltage. As can be seen from
Figure 17, at the time of disconnection and connection of energy sources, the voltage fluctuates, which according to the proposed control method (
Figure 14) this oscillation is the criterion for generating compensating power through flywheels.
Figure 18 shows the energy of each power source and charger. As can be seen from this figure, at the time of battery charging, each flywheel is discharged at a rate of
, which is per Equation (11). Additionally, when charging, the charger charges the electric bus battery at
according to (8). While waiting for the charging station, two flywheels are recharged through the mains at the same discharge capacity.
6. Experimental Results
In this section, an experimental setup for FESS with a power of 2.4 kW with the specifications shown in
Table 6 was used. To control FESS, the DSP TMS320F28335 was used. Additionally, to detect rotor speed and position, the Omron Encoder E6B2-CWZ6C with a resolution of 2000 pulses/rotation was used [
28]. Further analyzes, control methods, simulation, and laboratory results are provided for this laboratory setup in [
28].
According to the FESS specifications presented in
Table 6, and considering the FESS minimum speed
, the maximum energy of this FESS is obtained from the following equation:
According to the rated power of FESS (
), the maximum time that FESS can charge the load (electric bus battery emulator) is obtained from the following equation:
According to the above results, FESS specifications for laboratory testing are considered in
Table 7.
Figure 19 shows the laboratory stand for the proposed charging station. Here, two switches were used to create the mode of disconnecting and connecting the electric bus load emulator. When the load is connected to the station (in other words, the electric bus is connected to the charging station for charging), the switch
is in the off position and the switch
is in the connected position. Additionally, when the load is disconnected from the station (there is no electric bus in the station for charging), the switch
is on and the switch
is off. Here, a resistance load was used to model the battery of an electric bus. The amount of resistance load according to the specifications presented in
Table 7 is obtained from the following equation:
Figure 20 shows the experimental results for the proposed flash charging structure.
Figure 20a shows the FESS charge and discharge current. According to this figure, the current of the flywheel at the time of loading the load (electric bus battery emulator) in proportion to its nominal power is equal to
and, at the time of recharging from the network, it is equal to
in proportion to the charging power from the network. The FESS current is also zero during disconnection and connection times. According to
Figure 20b, the mains current is zero at the time of loading by the flywheel and
at the time of FESS recharging in proportion to the power required by the network to recharge the FESS. As can be seen from
Figure 20c, the load charging current in
corresponds to the charging power or rated power of FESS equal to
.
Figure 21 shows the DC bus voltage. According to this figure, the value of DC link voltage is equal to
, but it fluctuates at the time of disconnection and connection of switches, and this perturbation is the criterion of FESS control to supply the required power to the load.
The experimental result for the FESS speed is shown in
Figure 22. According to this figure, during FESS discharging, the speed decreases from the rated speed of 6000 rpm. When the charging cycle starts, the FESS is recharged and the speed of the rotating disk increases.


 ,
, 


