Abstract
In the transition towards a sustainable world with a “green horizon” (something that is also of great importance to the policy of energy self-sufficiency in housing and self-consumption), geothermal energy is seen as quite a feasible alternative for single-family homes. This article focuses on a comparison between the environmental impact and life cycle analysis of three alternatives and provides a base case for the replacement of a conventional type of boiler with a geothermal one for a typical house located in a Mediterranean climate. The first alternative (A) consists of a horizontal catchment system through a field of geothermal probes. The second alternative (B) is a shallow water catchment system, open type, with the return of water to a nearby river. The third option studied (C) is also a shallow water catchment system but with the water, return injected into a well downstream to the underground water flow. The study shows that alternatives A and B have the least environmental impact in most of the categories studied. The total amortization periods for the three alternatives and the base case differ by almost two years, with alternative A taking 6.99 years and alternative C costing 8.82 years.
1. Introduction
The importance of energy supply and the progress towards the conversion of the worldwide energy supply system by means of renewable sources is a reality of today [1]. The awareness of a sustainable world that leaves fossil fuels aside in a transition to clean and less polluting energies opens up a range of possibilities for a study of this type of energy, in many cases with a long research trajectory [2,3] and in others with a shorter history [4,5,6].
In this transition towards a sustainable world with a “green horizon” (which is also of great importance to the policy of energy self-sufficiency in housing and self-consumption), geothermal energy is seen as quite a feasible alternative for single-family homes [5,7,8,9].
The use of geothermal energy depends on temperature. Authors, such as Lee (2001) [10], have classified geothermal energy according to its temperature and enthalpy in a way that its use can range from heating and air conditioning systems at very low temperatures to the production of electrical energy at high temperatures and other uses such as the heating of greenhouses in agriculture or the extraction of chemical substances in the industry.
The uses of this energy can be segregated into three main clusters according to their destination and in four sections according to their temperature. In this way, the taxonomy based on their use is as follows: First group: housing, leisure, and health [11,12,13,14,15]; Second group: Agriculture and food [16,17]; Third group: industry [18,19]. The temperature sections used are: a very low temperature, less than 30 °C; a low temperature between 30° and 90°; a medium temperature between 90° and 150°; and a high temperature, higher than 150°.
For the first group, its uses are mainly in the low-temperature zone, with heating systems operating in heat-air conditioning pumps, underfloor heating, heating in leisure centres and swimming pools, balneotherapy and hot springs, preheating (water-air), uses of sanitary hot water and urban heating.
In the second group (agriculture and food), the most used geothermal energy type are low temperatures. Their main use is in fish farms, mushroom crops, the heating of greenhouses by ground and air, and water-air preheating. Additionally, in this group, medium-temperature geothermal energy is used in the drying processes of agricultural products, wood, fish, and in canning factories.
For the last group, low-temperature geothermal energy is used in water-air preheating and the thawing of products. Medium-temperature geothermal energy is used in wool and dye washing, the drying of industrial products, the production of electric energy in combined cycle plants, absorption in cooling systems, the extraction of chemical substances, freshwater distillation, metal recovery, solution evaporation concentrates, paper pulp manufacturing, and ammonia absorption refrigeration. The industrial use of high-temperature geothermal energy is focused exclusively on the generation of electrical energy.
The use of this type of energy is currently booming, especially in the field of home air conditioning [20], since its technology has undergone a significant improvement in recent decades [21]. This growth importance is estimated in documents such as the Renewable Energy Plan 2011–2020 of Spain [22]. This plan estimated a 10-year growth for these types of facilities to 353% for a conservative scenario or up to 1379% for an optimistic scenario. These data obtained from the IDAE place an average growth in Spain of about 600MWt in 2020 for every 100MWt installed in 2010.
In addition, this type of energy is renewable, clean, and free once the installation has been made as it does not depend on external factors [23,24,25], which makes it very attractive, both for new construction facilities and for the replacement of conventional-type boilers for geothermal boilers.
For its installation, it is necessary to consider a series of factors, such as the characteristics of the ground and the housing or the type of catchment system to be installed. For example, Shah et al. [6], studied the effectiveness of these geothermal systems and Rüther et al. [26] analysed the use of high-density polyethylene for geothermal catchment systems.
Within this sector, there are different catchment systems for a geothermal facility. The two systems most used today are horizontal catchment systems [27,28] and vertical catchment systems [29]. However, there are also other types of systems to obtain the necessary geothermal energy source, such as surface systems. These types of systems take advantage of the subsoil water resources, an accessible water table being necessary, with enough supply flow to obtain the energy needed for air conditioning. Within these types of catchment systems, there are two variants depending on the system with which the water is returned: surface catchment systems with a return to a river and shallow catchment systems with a return to a well. In addition to factors such as economic or technical feasibility, environmental factors must also be considered to select the geothermal collection system to be used. In this factor, which is aimed at making an environmental comparison based on the life cycle analysis of the different collection alternatives presented above, lies the importance and novelty of this article.
The life cycle analysis provides very important information about the environmental impact of such an action. There are numerous life cycle analysis (LCA) articles on renewable energies, such as [30,31,32], but when talking about geothermal energy, this field of research is greatly reduced [13,33,34,35,36] and is even more so when focusing on the field of energy production for the air conditioning of single-family housing [37,38]. The latter studies are also relatively recent, such as that presented by Todoran, T. P. and Balan, M. C. in 2016 [39], about the experiments conducted on a geothermal heat pump to heat a single-family home.
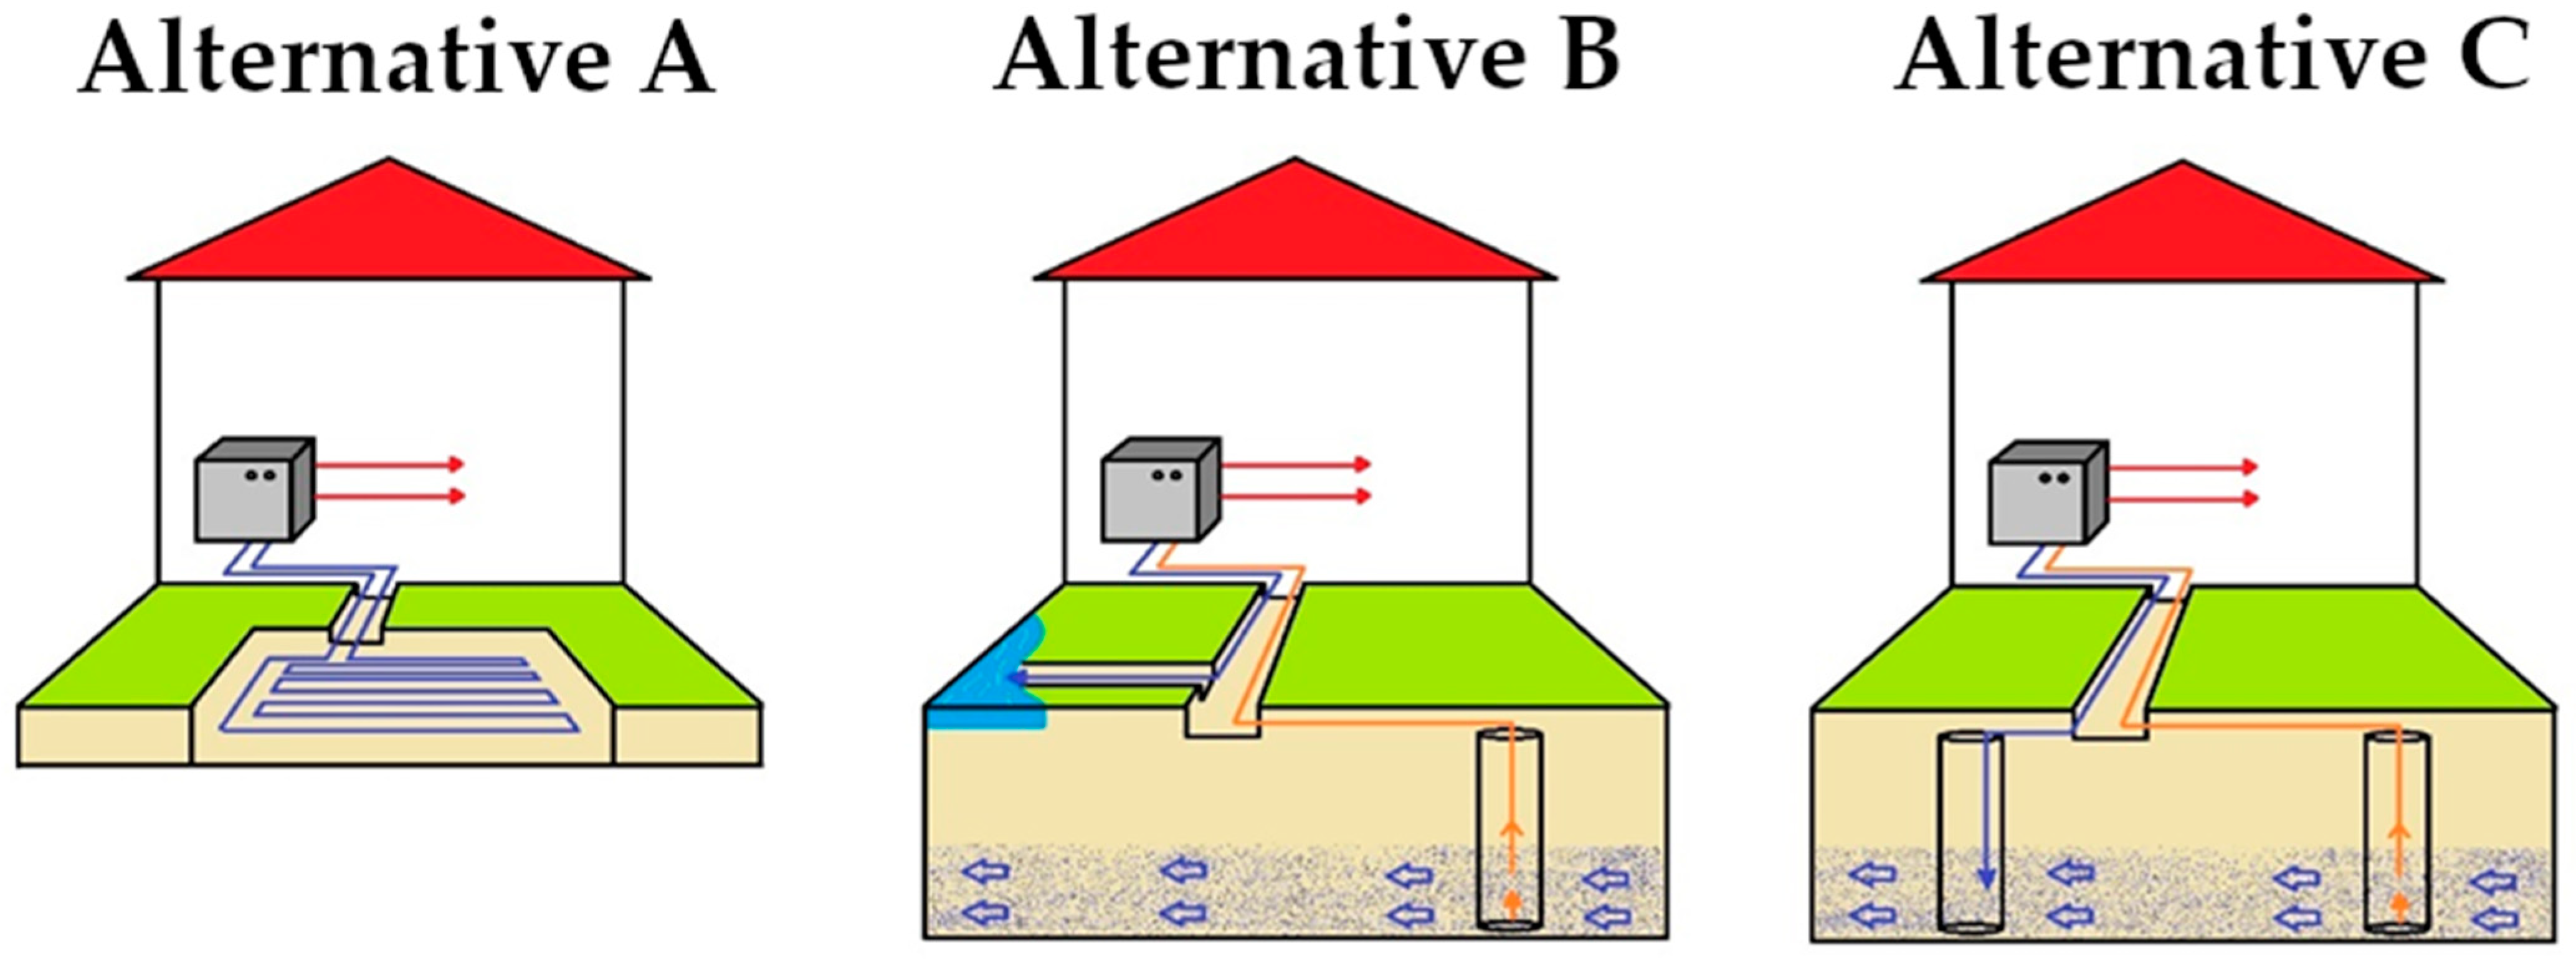
This article focuses on an LCA study of three alternative geothermal options to the base case [40] for the replacement of a conventional boiler with a geothermal boiler for a housing type. In this process, the entire heating and domestic hot water generation system was replaced; however, the radiator systems inside the houses remained intact. These three alternatives (see Figure 1) are described below:
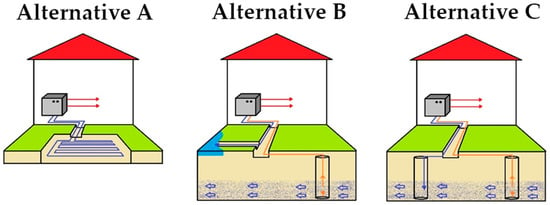
Figure 1.
Sketch of the catchment alternatives.
- Alternative A: A horizontal catchment system consisting of polyethylene collectors generally buried about 1 m deep along a surface normally equivalent to between 1.5 and 3 times the single-family home to be heated for a single-family house of 150 m2.
- Alternatives B and C: Shallow catchment systems. In these types of systems, the water available in the subsoil is used directly, provided that the permeability of the soil is sufficiently high. For an installation of around 203, a water flow of 6 m3/h is needed.
- The return of the heat pump can be performed in two different ways, which result in two different facilities:
- ▪
- Alternative B: A shallow catchment system with a return to the river: the return of water is made to a nearby river.
- ▪
- Alternative C: A shallow catchment system with a return to the well: the return of water is directed to the subsoil through a downstream injection well.
2. Materials and Methods
2.1. Purpose and Scope
The analysis of the LCA of three alternatives to the base case [40] was conducted to replace a conventional boiler with a geothermal boiler for a single-family-type house. These alternatives are differentiated in the geothermal energy catchment system. On the one hand, the first alternative (alternative A) consists of a horizontal catchment system through a field of geothermal probes. The second alternative (alternative B) has been studied as a shallow water catchment system, open type, and with the return of water to a nearby river. The third and last option studied (alternative C) is also a shallow water catchment system, but with the water, return injected into a well downstream to the underground water flow.
The following methodology was used for this article. Firstly, the base case was obtained from the article by Rubio C.-L. et al. [40]. Subsequently, more than 10 installation projects were studied, similar to those present in each of the alternatives. Along with the power capacity of each of the installation projects, the inventory of each was obtained. After obtaining the inventory, the analysis of the alternatives was made using the software SimaPro, using the CML-IA baseline V3.04/EU25 methodology.
In these studies, the heating of a single-family house type was used as the sample. The size of this house was 190 m2, located in a Mediterranean climatic zone of type D2 according to Spanish climatic zones. This D2 characterisation indicated that the winter climate severity in SCI (Spanish acronym) had a value between 0.94 and 1.51, while the summer climate severity in SCV (Spanish acronym) was between 0.5 and 0.83. To obtain the characteristics of this climatic zone, the information provided by the Ministry of Public Works of the Government of Spain was used. Several parameters, such as dry temperature (°C), were obtained from this source, as well as others, such as effective sky temperature (°C), direct solar irradiance on a horizontal surface (W/m2), diffuse solar irradiance on a horizontal surface (W/m2), specific humidity (kgH2O/dry kgaire), relative humidity (%), atmospheric pressure, average wind speed, and dew temperature. These parameters are not fixed and, instead, they rather vary each year as a consequence of climate variation. The parameters introduced in the analysis are the statistical climate values that the Ministry of Public Works and Transport of the Spanish Government obtained after collecting climate data for the last 50 years from all the meteorological stations in Spain.
2.2. Functional Unit
For the analysis of the life cycle of the 3 installation alternatives, the functional unit chosen was the replacement of a conventional boiler with a geothermal type for a single-family house of 190 m2 in total, distributed in 160 m2 of housing and 30 m2 of the garage. The house was located in Logroño, La Rioja, Spain and its air conditioning required a total annual demand of 35,218.8 kWh.
2.3. System Limits
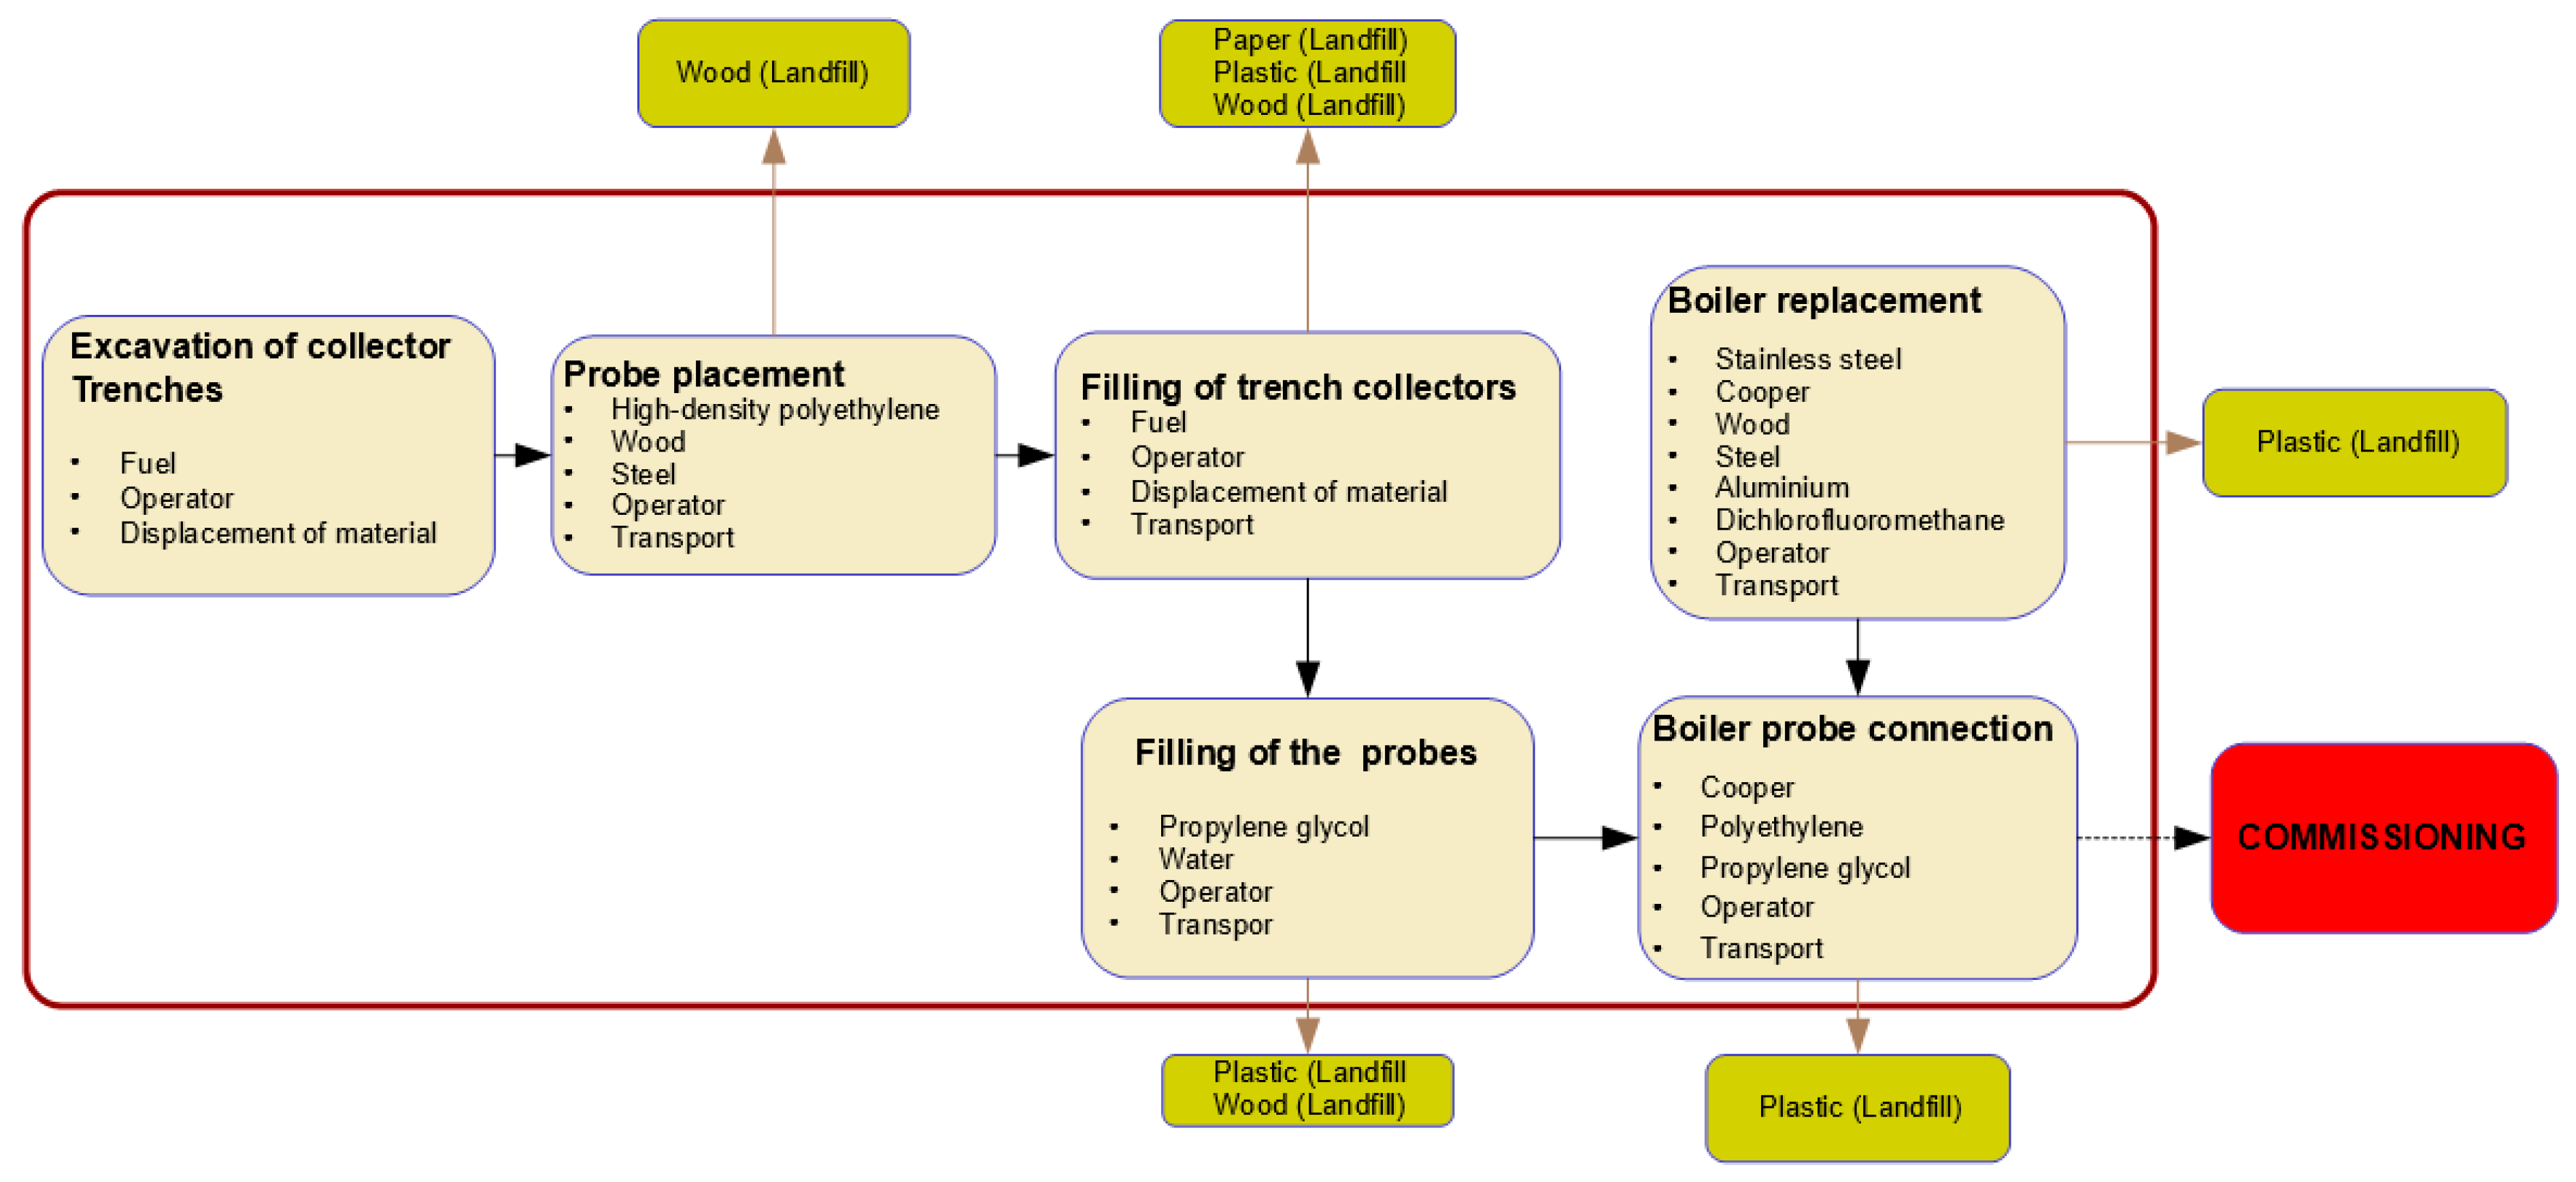
Figure 2 shows the system boundaries for option A based on a horizontal catchment system.
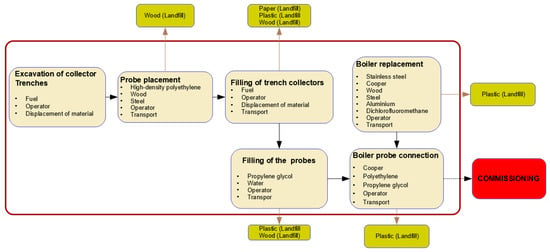
Figure 2.
System boundaries for alternative A.
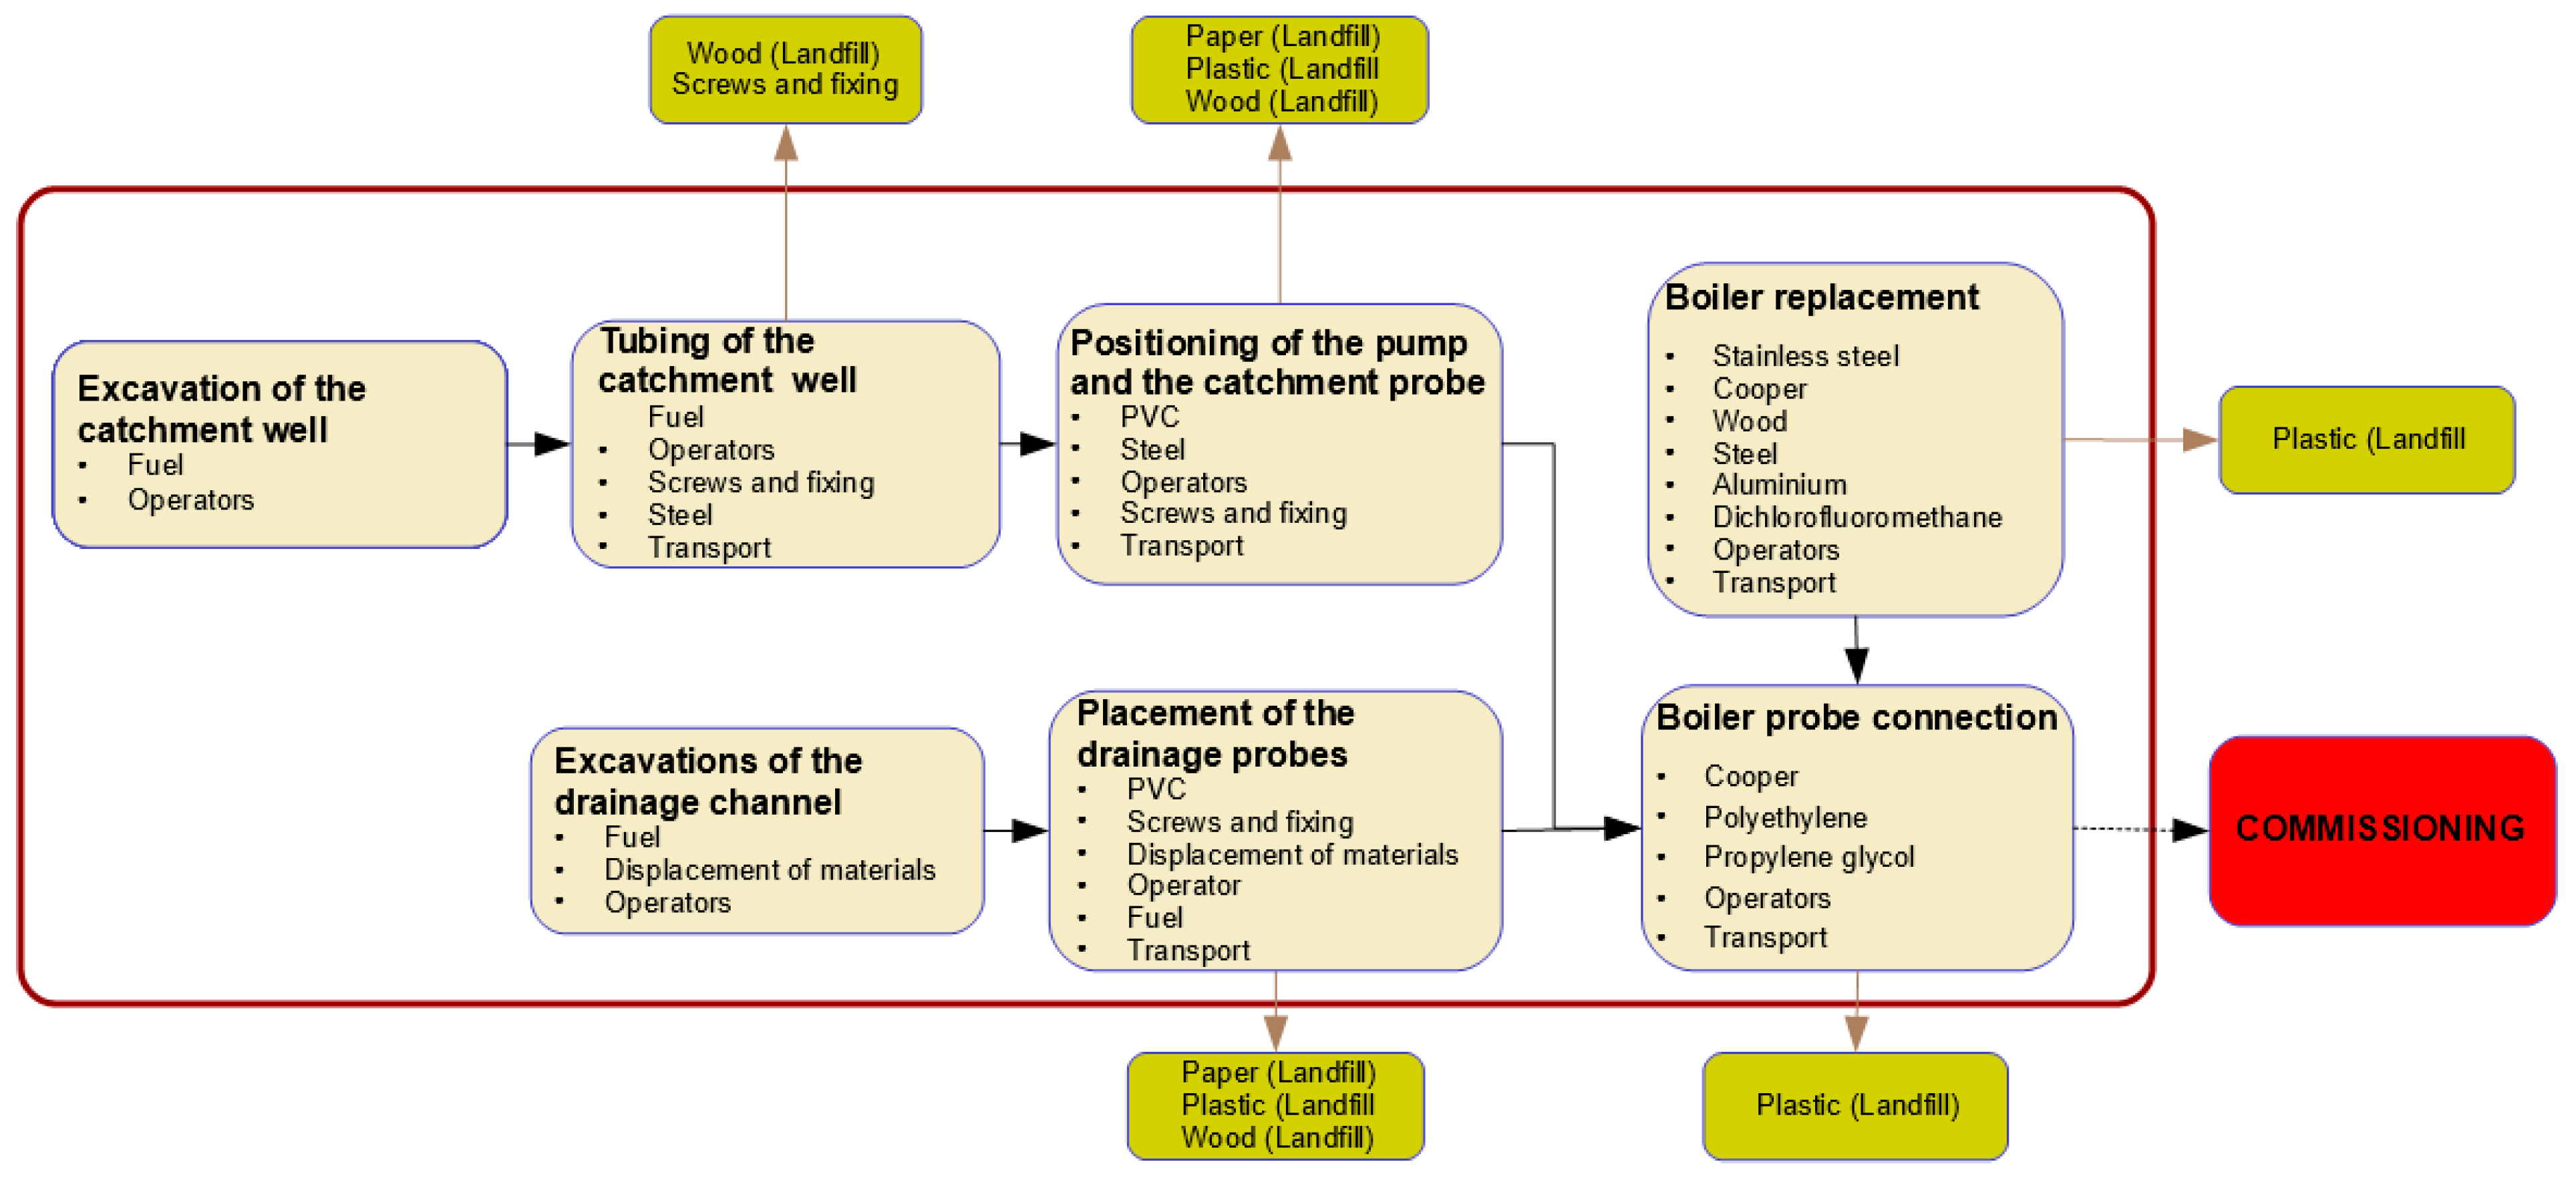
Figure 3 shows the system boundaries for option B based on a shallow catchment system with return to river.
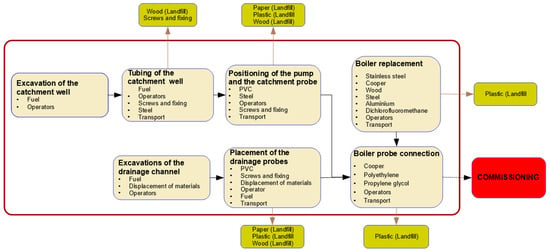
Figure 3.
System boundaries for alternative B.
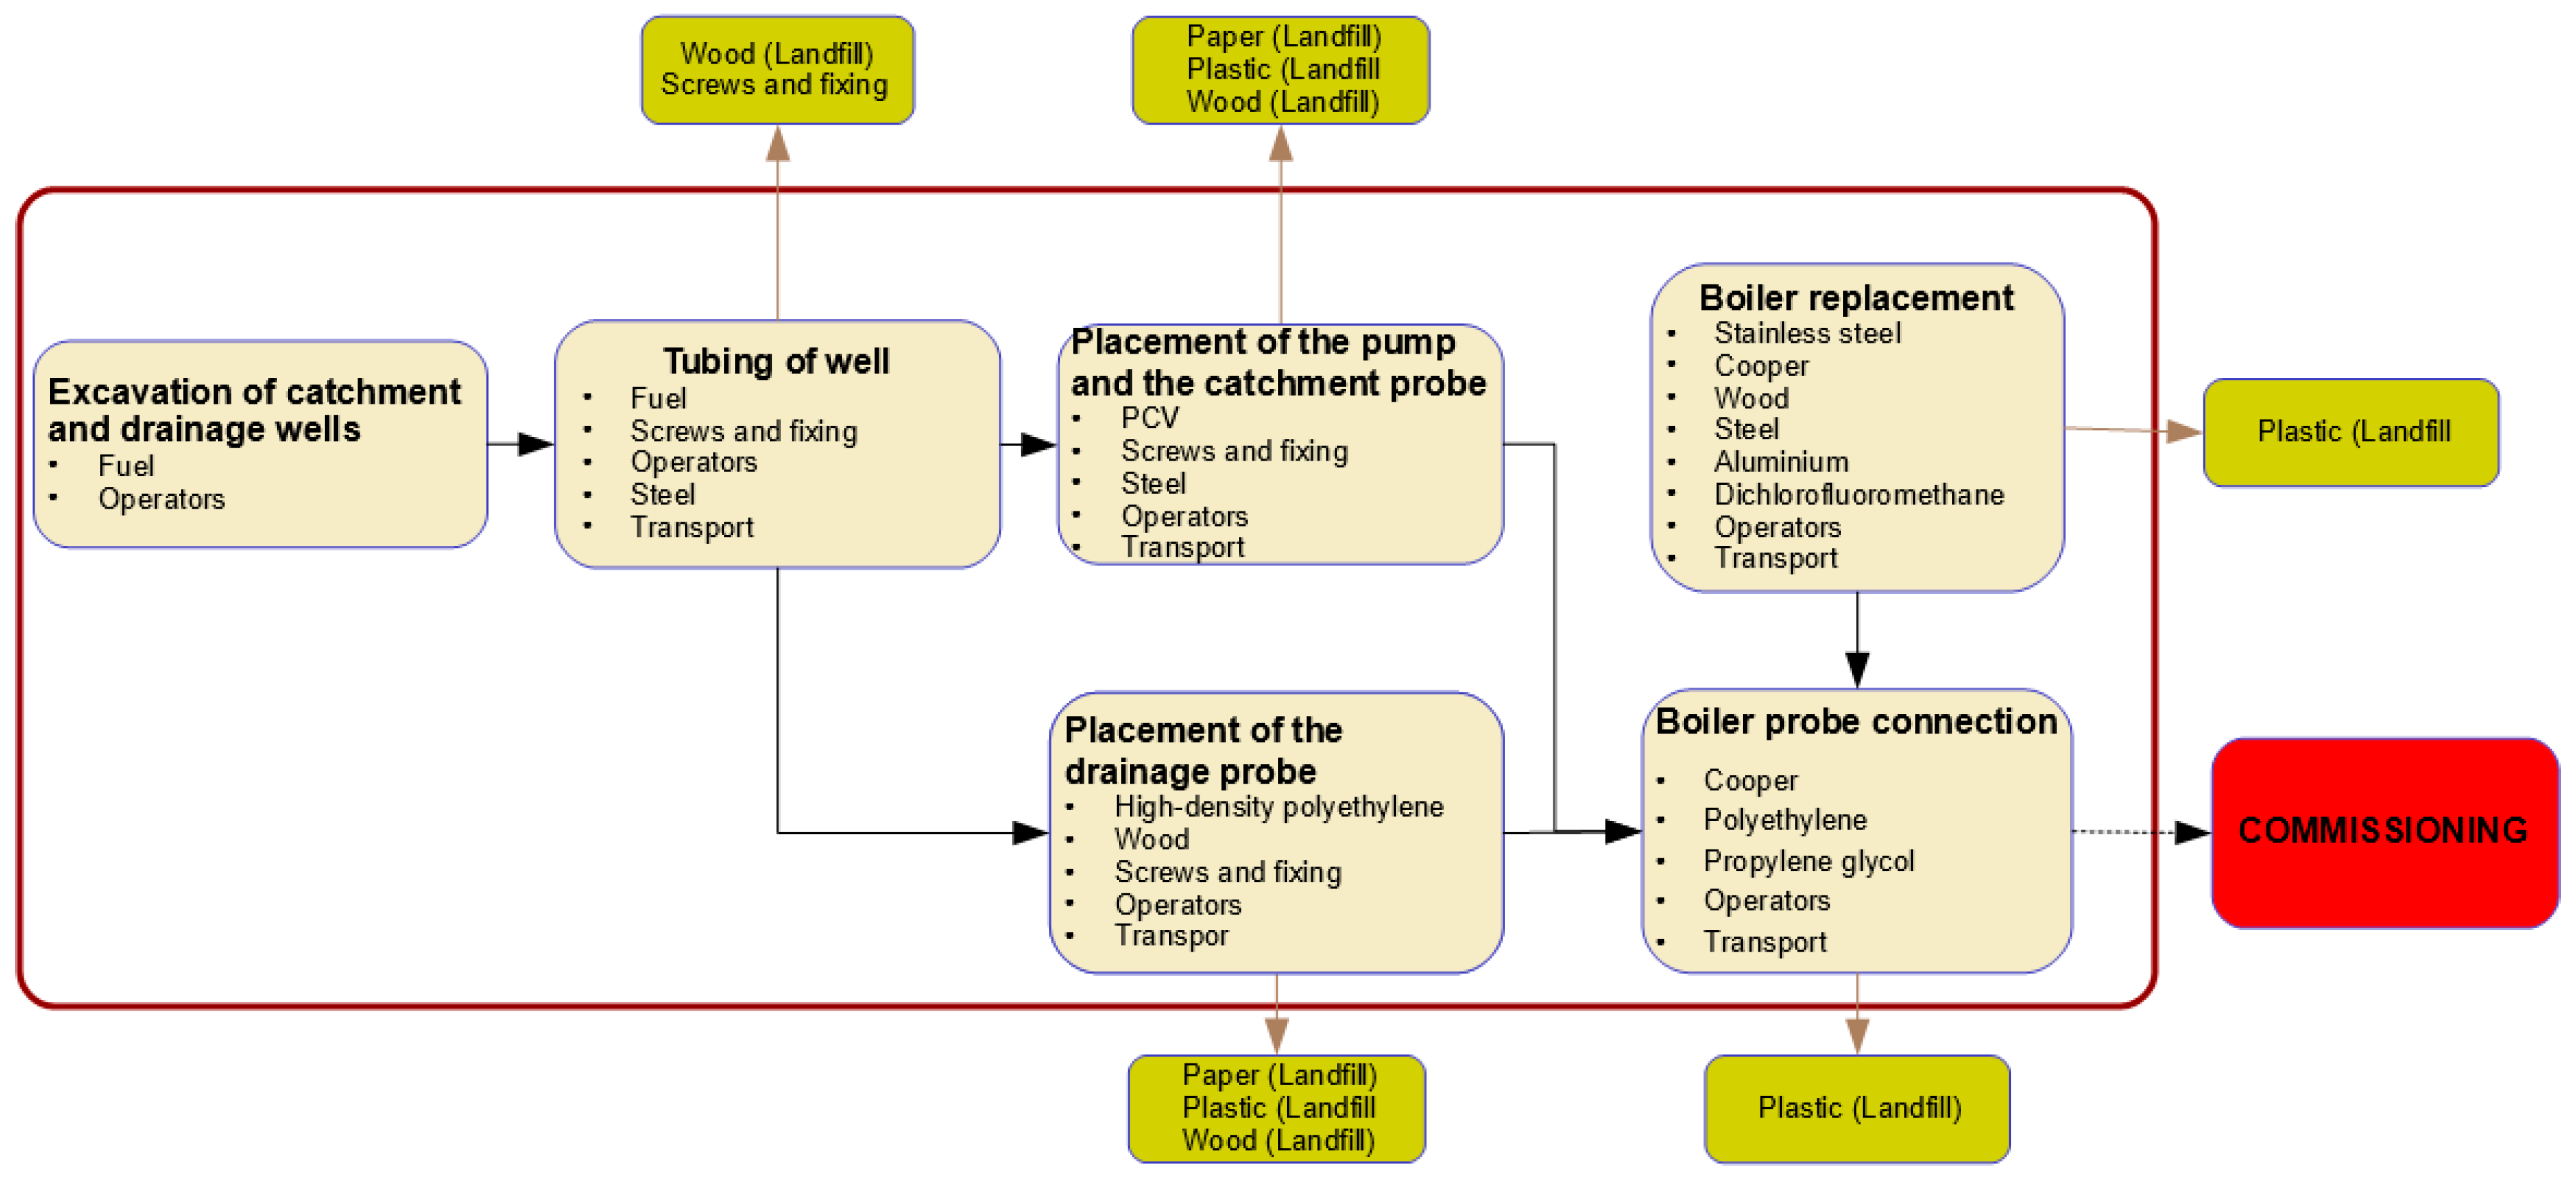
Finally, Figure 4 shows the system boundaries for option C based on a shallow catchment system with return to well.
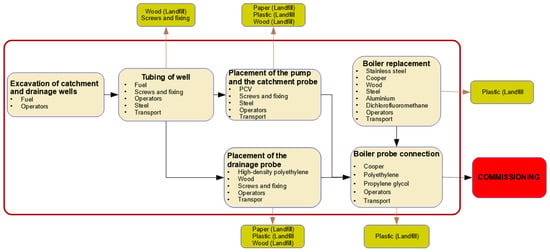
Figure 4.
System boundaries for alternative C.
2.4. Assumptions
To perform the sizing of the geothermal installation to be made, the following assumptions were considered:
- The energy consumption for the air conditioning of the house at a temperature of 22 °C would be 35,218.8 kWh. This information was obtained from the government of Spain through the LIDER-CALENDER-HULC program.
- The interior installation of the house was not modified, apart from the installation of the geothermal catchment and replacement of the conventional boiler with a geothermal one.
- All the necessary materials to make the installation were placed on location without having to consider the displacement of materials to the work site.
- For waste material, transport to the estimated landfill was assumed at a distance of 20 km.
- For alternatives, B and C, the existence of a water table was assumed with a minimum supply of 6 m3/h at a depth of 20 m.
- For alternative C (the shallow catchment system with return to the river) the existence of a drainage system at 20 m from the house was assumed.
2.5. Characteristics of the Reference Building
The reference building for which the life cycle analysis was performed took the form of a single-family dwelling with a total area of 190 m2 distributed in 160 m2 of housing and 30 m2 of the garage. It was a rectangular building, 10 m long and 5 m wide, with two floors with a total height of 8 m. The house was located in Logroño (La Rioja, Spain), in a type D2 climatic zone as corresponds to Annex D DA DB-HE/1 of the Technical Building Code (CTE).
2.6. Inventory
To conduct this environmental impact study, an inventory was made for each of the 3 options mentioned above. Within each of these options, the installation was divided into several phases, depending on the catchment system type. The data in Table 1, Table 2 and Table 3 represent the input inventories of the modeling system. These inventory data for each of the alternatives were obtained after analysing several similar installation projects, averaging the implementation items present in each of them.

Table 1.
Alternative A inventory.

Table 2.
Alternative B inventory.

Table 3.
Alternative C inventory.
2.6.1. Alternative A: Horizontal Catchment System
The phases used to divide this option are the following: Phase 1: excavation of collector trenches, Phase 2: probe placement, Phase 3: filling of trench collectors, Phase 4: filling of probes, Phase 5: boiler replacement, and Phase 6: boiler probe connection. Table 1 shows a summary of the input and waste that were necessary for each phase.
The stages are described below:
- Phase 1: excavation of collector trenches. In this phase, the trenches were excavated where the horizontal collectors of the geothermal catchment system were buried. This stage differs from phase 1 of the base case in that the collectors are buried horizontally rather than vertically so that the volume of earth to be moved is much greater.
- Phase 2: probe placement. The second phase of the installation consisted of introducing the geothermal probes responsible for the transmission of energy between the ground and the boiler.
- Phase 3: filling of trench collectors. The third part of the installation consisted of filling the trenches with the soil previously removed from them.
- Phase 4: filling of probes. This phase consisted of filling the probes with the heat transfer fluid that would exchange the energy with the ground. This phase is similar to that of the base case but uses a smaller amount of fluid.
- Phase 5: boiler replacement. This phase was common for each of the three alternatives studied and common to the base case studied since the installation of the boiler to be used did not vary, only the catchment system.
- Phase 6: boiler probe connection. Similar to the previous phase, this was common for each of the three installation alternatives and the same as the base case since the connections made between the boiler and the probes were the same in each of the three alternatives.
2.6.2. Alternative B: Shallow Catchment System with Return to River
The shallow catchment system with return to the river will consist of the following phases: Phase 1: Excavation of the catchment well, Phase 2: Tubing of the catchment well, Phase 3: Positioning of the pump and the catchment probe, Phase 4: Excavation of the drainage channel, Phase 5: Placement of the drainage probes, Phase 6: Boiler replacement and Phase 7: Boiler probe connection. In this case, phases 6 and 7 coincide with phases 5 and 6 of option A, respectively, so they will not be described again. Table 2 shows the input and waste for each of the phases.
The stages are described below:
- Phase 1: excavation of the catchment well. The first phase of option B involved the excavation of the catchment well. This phase was similar to Phase 1 of the base case, but with much less depth of excavation, since only a 20 m depth was necessary to penetrate the assumed water table.
- Phase 2: tubing of the catchment well. The second phase of this option B was to pipe the catchment well for proper operation.
- Phase 3: placing the pump and the catchment probe. During this identical phase for alternatives B and C, the catchment system was placed. This system consisted of a submerged stainless-steel pump coupled with a PVC suction hose with spiral hard PVC reinforcement.
- Phase 4: excavation of the drainage channel. In the present phase, which differed from alternative C, the installation of the drainage channel for the catchment system of option B was conducted. This drainage channel was assumed to be 20 m long. A trench with a depth of 1 m and a width of 0.4 m was made.
- Phase 5: placement of the drain probes. During this stage, the drainpipe in the pick-up system of option B was placed.
- Phase 6: replacement of the boiler.
- Phase 7: boiler probe connection.
2.6.3. Alternative C: Shallow Catchment System with Return to Well
In this section, the inventory of the third and last option is studied for option C: shallow catchment system with return to well.
This option consisted of the following phases: Phase 1: excavation of the catchment and drainage wells, Phase 2: tubing of the catchment and drainage wells, Phase 3: placement of the pump and the catchment probe, Phase 4: placement of the drainage probe, Phase 5: boiler Replacement, and Phase 6: boiler probe connection. As in the previous case, phases 5 and 6 are identical to those of the other phases and so will not be described again. Table 3 shows the input and waste of each of the phases.
The stages are described below:
- Phase 1: excavation of the catchment and drainage wells. This phase is similar to that of the previous section, but with the provision that two similar wells were made instead of just one. The first of these wells were used as a catchment well, and the second as a drainage well.
- Phase 2: tubing of the catchment and drainage wells. This phase is similar to the previous section but with twice the materials and labour since two similar wells had to be tubed instead of one.
- Phase 3: placing the pump and the catchment probe.
- Phase 4: placement of the drainage probe.
- Phase 5: boiler replacement.
- Phase 6: boiler probe connection.
3. Results
The results of the environmental impact analysis have been studied by comparing the alternatives with the base case and with each other. This comparison is conducted in three different ways:
- A comparative analysis of the environmental impact by phase.
- A comparison of the total impact between the alternatives and the base case.
- Amortization time analysis for each alternative.
The impact categories that have been studied are: Abiotic Depletion (AD), Abiotic Depletion (fossil fuels) (AD-FF), Global Warming-GWP100 (GWP), Ozone Layer Depletion (ODP), Human Toxicity (HT), Fresh Water Aquatic Ecotoxicity (FWAE), Marine Aquatic Ecotoxicity (MAE), Terrestrial Ecotoxicity (TE), Photochemical Oxidation (PO), Acidification (AC), and Eutrophication (EU).
3.1. Results of the Environmental Impact Analysis for Each of the Three Alternatives
This section shows the environmental impact of the replacement of a conventional boiler with a geothermal one for the base case and for each of the alternatives described above.
Results of the Environmental Impact Analysis for Each Alternative
The different environmental impact tables for each of the three alternatives described are shown below in Table 4, Table 5 and Table 6.

Table 4.
Environmental impact by phases for alternative A.

Table 5.
Environmental impact by phases for alternative B.

Table 6.
Environmental impact by phases for alternative C.
For the three alternatives described above, the phase that had the greatest impact on all of them was the replacement phase of the conventional boiler with a geothermal one. Maione et al. [41] analysed the use of geothermal energy in southern Italy and highlight the construction and installation of the system as the source of the greatest environmental impact. In alternative A, this phase had the highest value in 8 of the 11 categories, with AD-FF, GWP, and ODP being the only ones in which another phase impacted the most. In the case of alternative B, the boiler replacement phase obtained the highest value of all categories. Finally, for alternative C, the only category in which it did not obtain the highest value was TE, while in all the others, the replacement of the boiler was the phase that impacted the most.
Another relevant aspect of the analysis by phase was that for alternatives B and C, which both shared a similar catchment system, the excavation part of the well proved to be the one that impacted the least. For alternative B in all categories, as only one well was excavated, and for alternative C in 8 of the 11 categories, it proved to be a low value but not the minimum in AD, ODP, and HT.
3.2. Comparison of the Environmental Impact of the Three Alternatives with the Base Case
Table 7 shows a comparison of the total environmental costs of the four alternatives. The result is that the base case is the one with the highest impact categories at 7 of 11 (AD-FF, GWP, ODP, MAE, PO, AC, and EU). On the other hand, alternative C is the one that impacts the most compared to the other four categories (AD, HT, FWAE, TE). As for alternatives A and B, they have the least impact. Alternative A is the least impactful on (AD, HT, FWAE, MAE, TE, and EU) 6 of the 11 categories, and alternative B is the least impact on the other 5 (AD-FF, GWP, ODP, PO, AC).

Table 7.
Comparison of the environmental impact of the three alternatives with the base case.
Comparing some alternates with others, the three alternatives have less impact in most categories than the base case: alternative A impacted less in all categories, alternative B impacted less in 10 out of 11, and alternative C in 7 out of 11 of the categories. If alternative A is compared with alternative B, the result is that the first one obtains a lower value in the six categories (AD, HT, FWAE, MAE, TE, and EU) and alternative B in the remaining five. If alternatives A and C are compared, the first one obtains a lower value in 7 of the 11 categories (AD, HT, FWAE, MAE, TE, PO, and EU). Finally, when comparing alternatives B and C, the result is that alternative B has a lower value of environmental impact in each of the 11 categories.
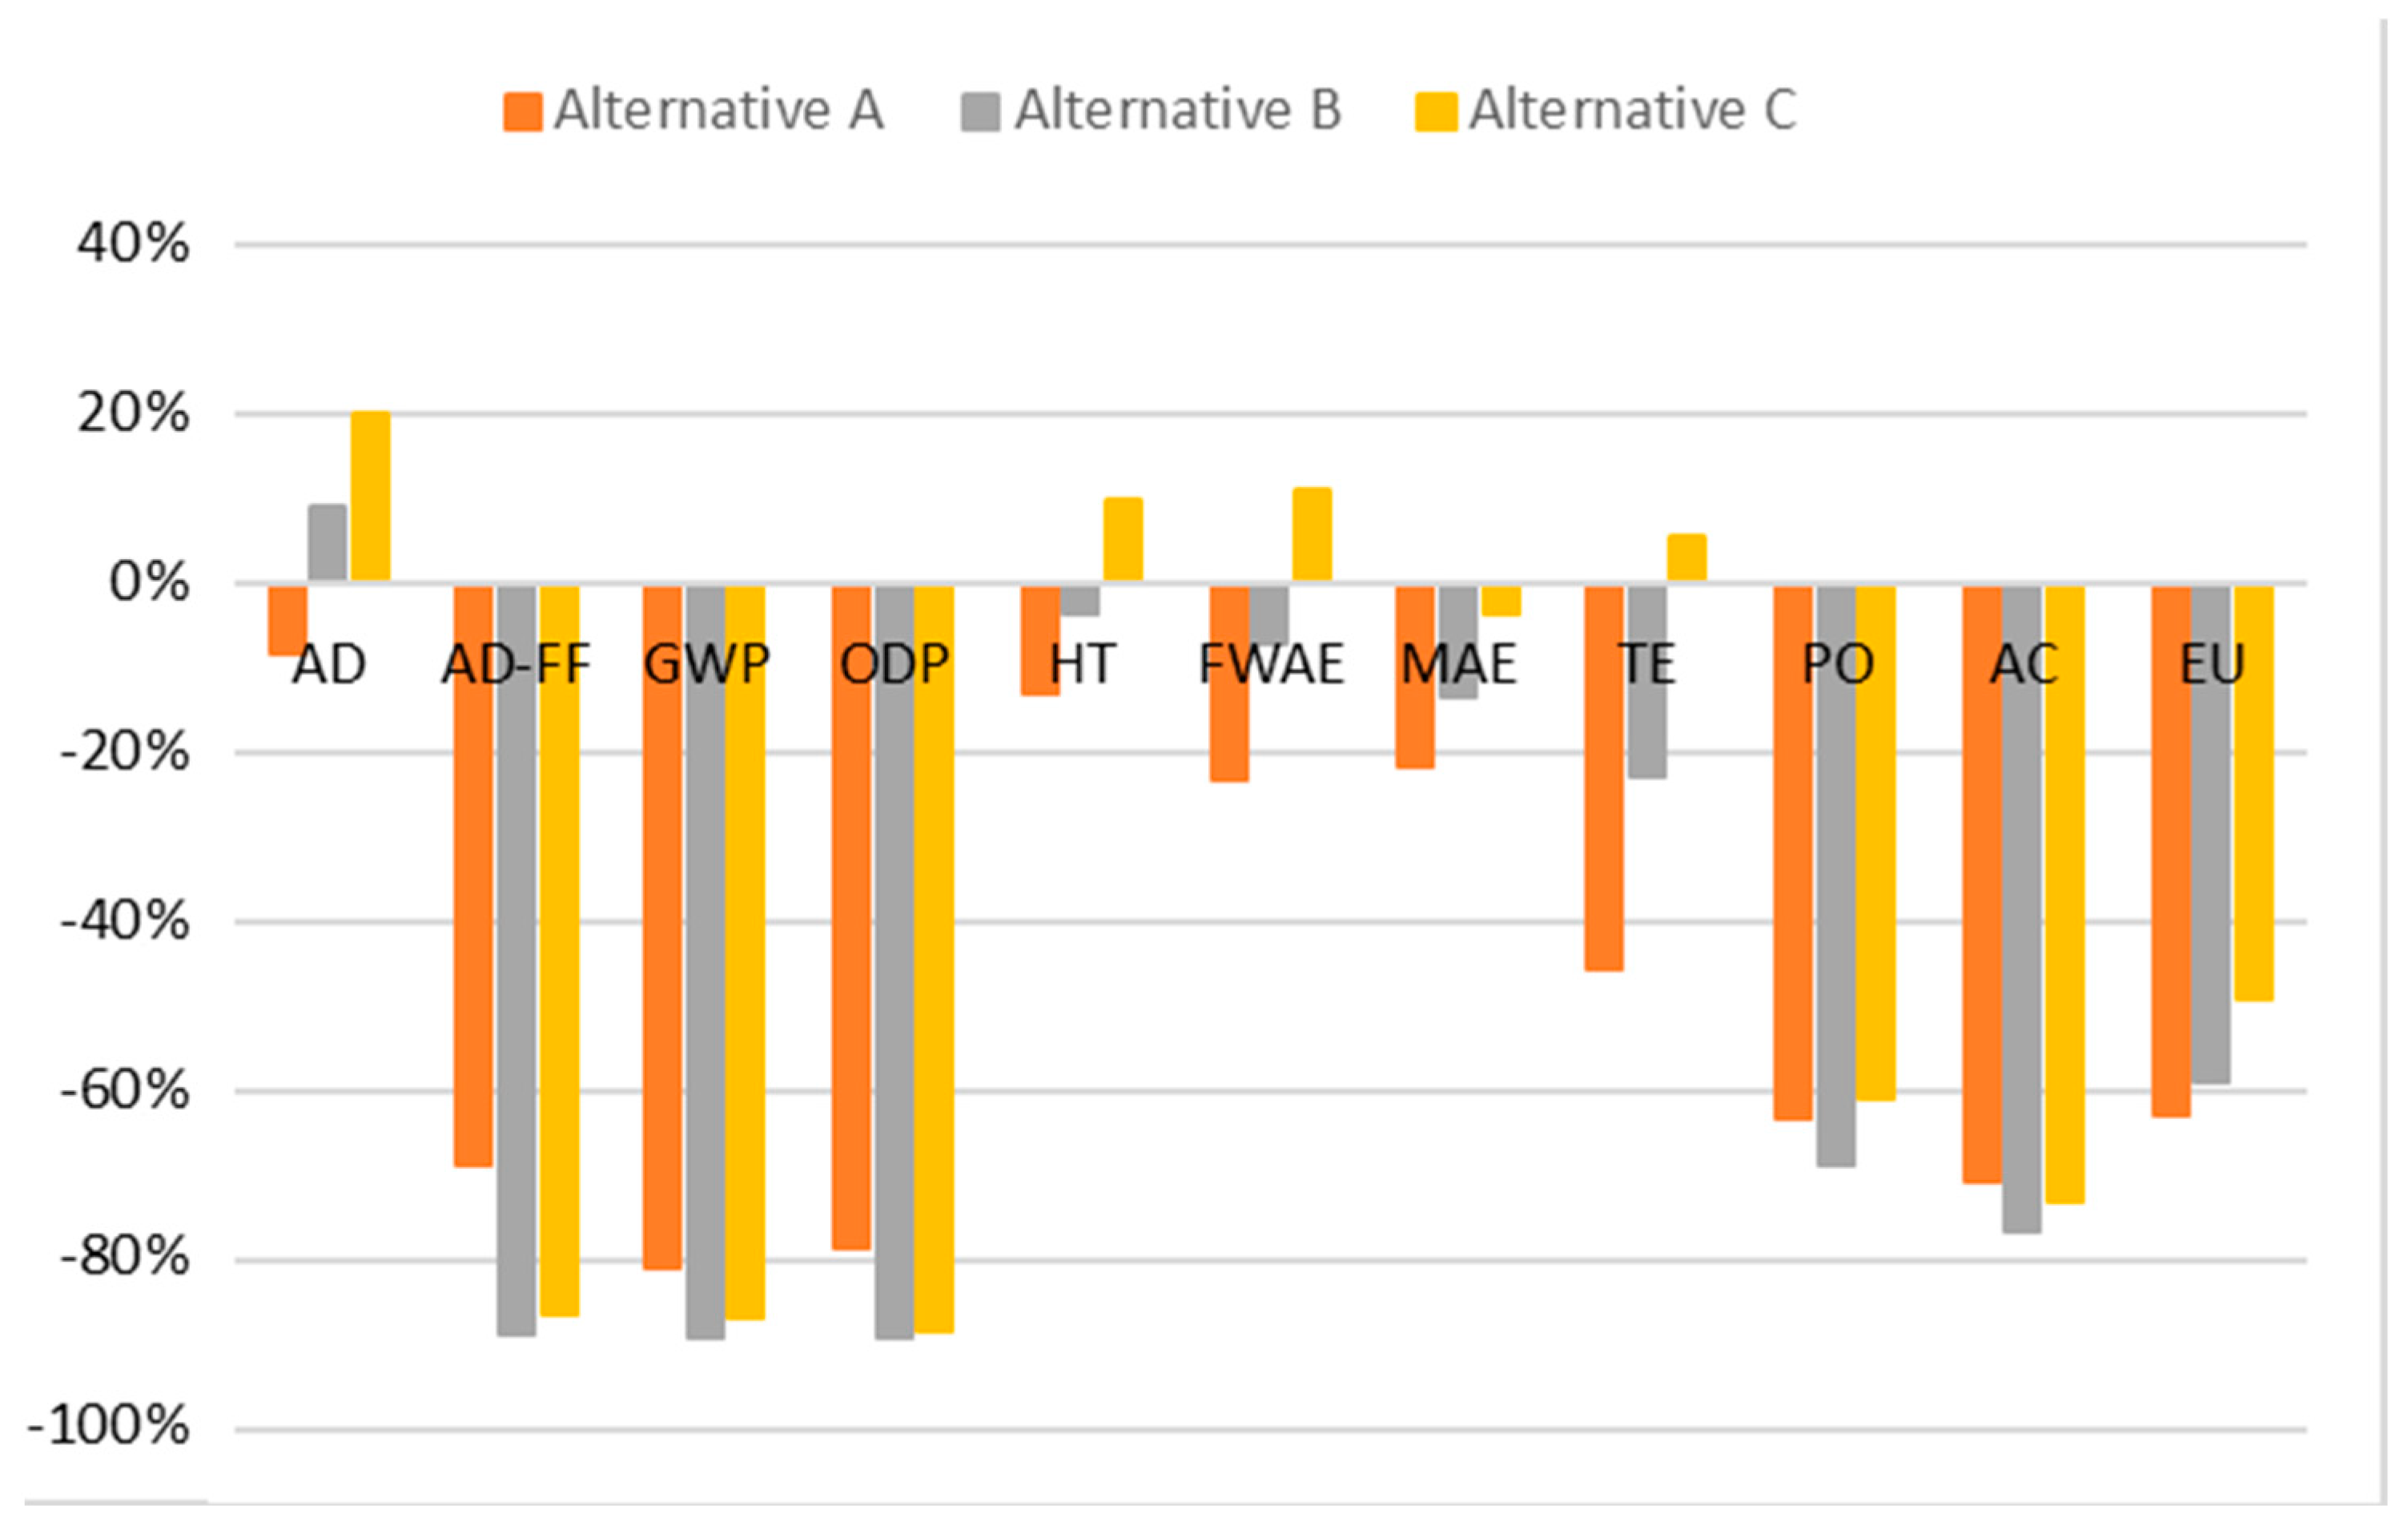
In terms of increases or decreases in the % of each alternative with respect to the base case, it can be seen how alternative A had a decrease in all the categories, while alternative B had an increase in category AD, and alternative C had four increases in categories AD, HT, FWAE, and TE.
For alternative A, the decrements range from 8.05% in the AD category to 80.88% in the GWP category. The categories AD-FF, GWP, ODP, PO, AC, and EU have a decrease of more than 50%, while the other categories range between 8.05% and 45.61%. On the other hand, alternative B has decrements greater than 50% in the categories AD-FF, GWP, ODP, PO AC, and EU. The categories HT, FWAE, MAE, and TE have decrements of less than 22.90%. The category AD is the only one that has an increase, whose value is 9.2%.
When category C is observed, categories AD, HT, FWAE, and TE have increments between 5.61% and 20.11%. The categories AD-FF, GWP, ODP, PO, and AC have decrements between 60.78% and 88.21%. Finally, the MAE and EU categories have decrements of 3.64% and 49.05%, respectively.
De Rose et al. [42] also found a significant variation in the environmental impact between different geothermal facilities in Europe, including facilities that can have an impact of more than double the average value of all the facilities studied.
3.3. Comparison of the Amortization Time of the Environmental Impact of the Three Alternatives with the Base Case
Table 8 shows the amortization of the environmental impact in years for each of the categories of each alternative and the base case. It can be seen that alternatives A and B are the ones that take less time to amortize compared to most of the categories, as is logical since they have the lowest values for each of them. The increment or decrement in % with respect to the base case is also shown.

Table 8.
Comparison of the amortization time of the environmental impact of the three alternatives with the base case.
Observing the graph in Figure 5, a quick glance shows how the three alternatives improve in practically all the categories compared to the base case studied. This can be seen in a simple way since most of the bars in the graph (28 of the 33) have rather high negative percentages (and a decrease with respect to the base case), between 60 and 80% in many cases, while only five have positive percentages of less than 20% (and an increase with respect to the base case).
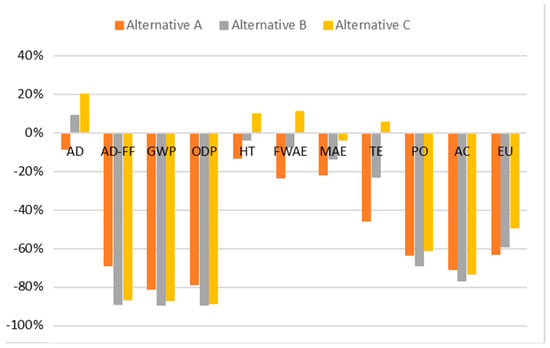
Figure 5.
Bar chart of the increase or decrease rate per category compared to the base case for each of the alternatives.
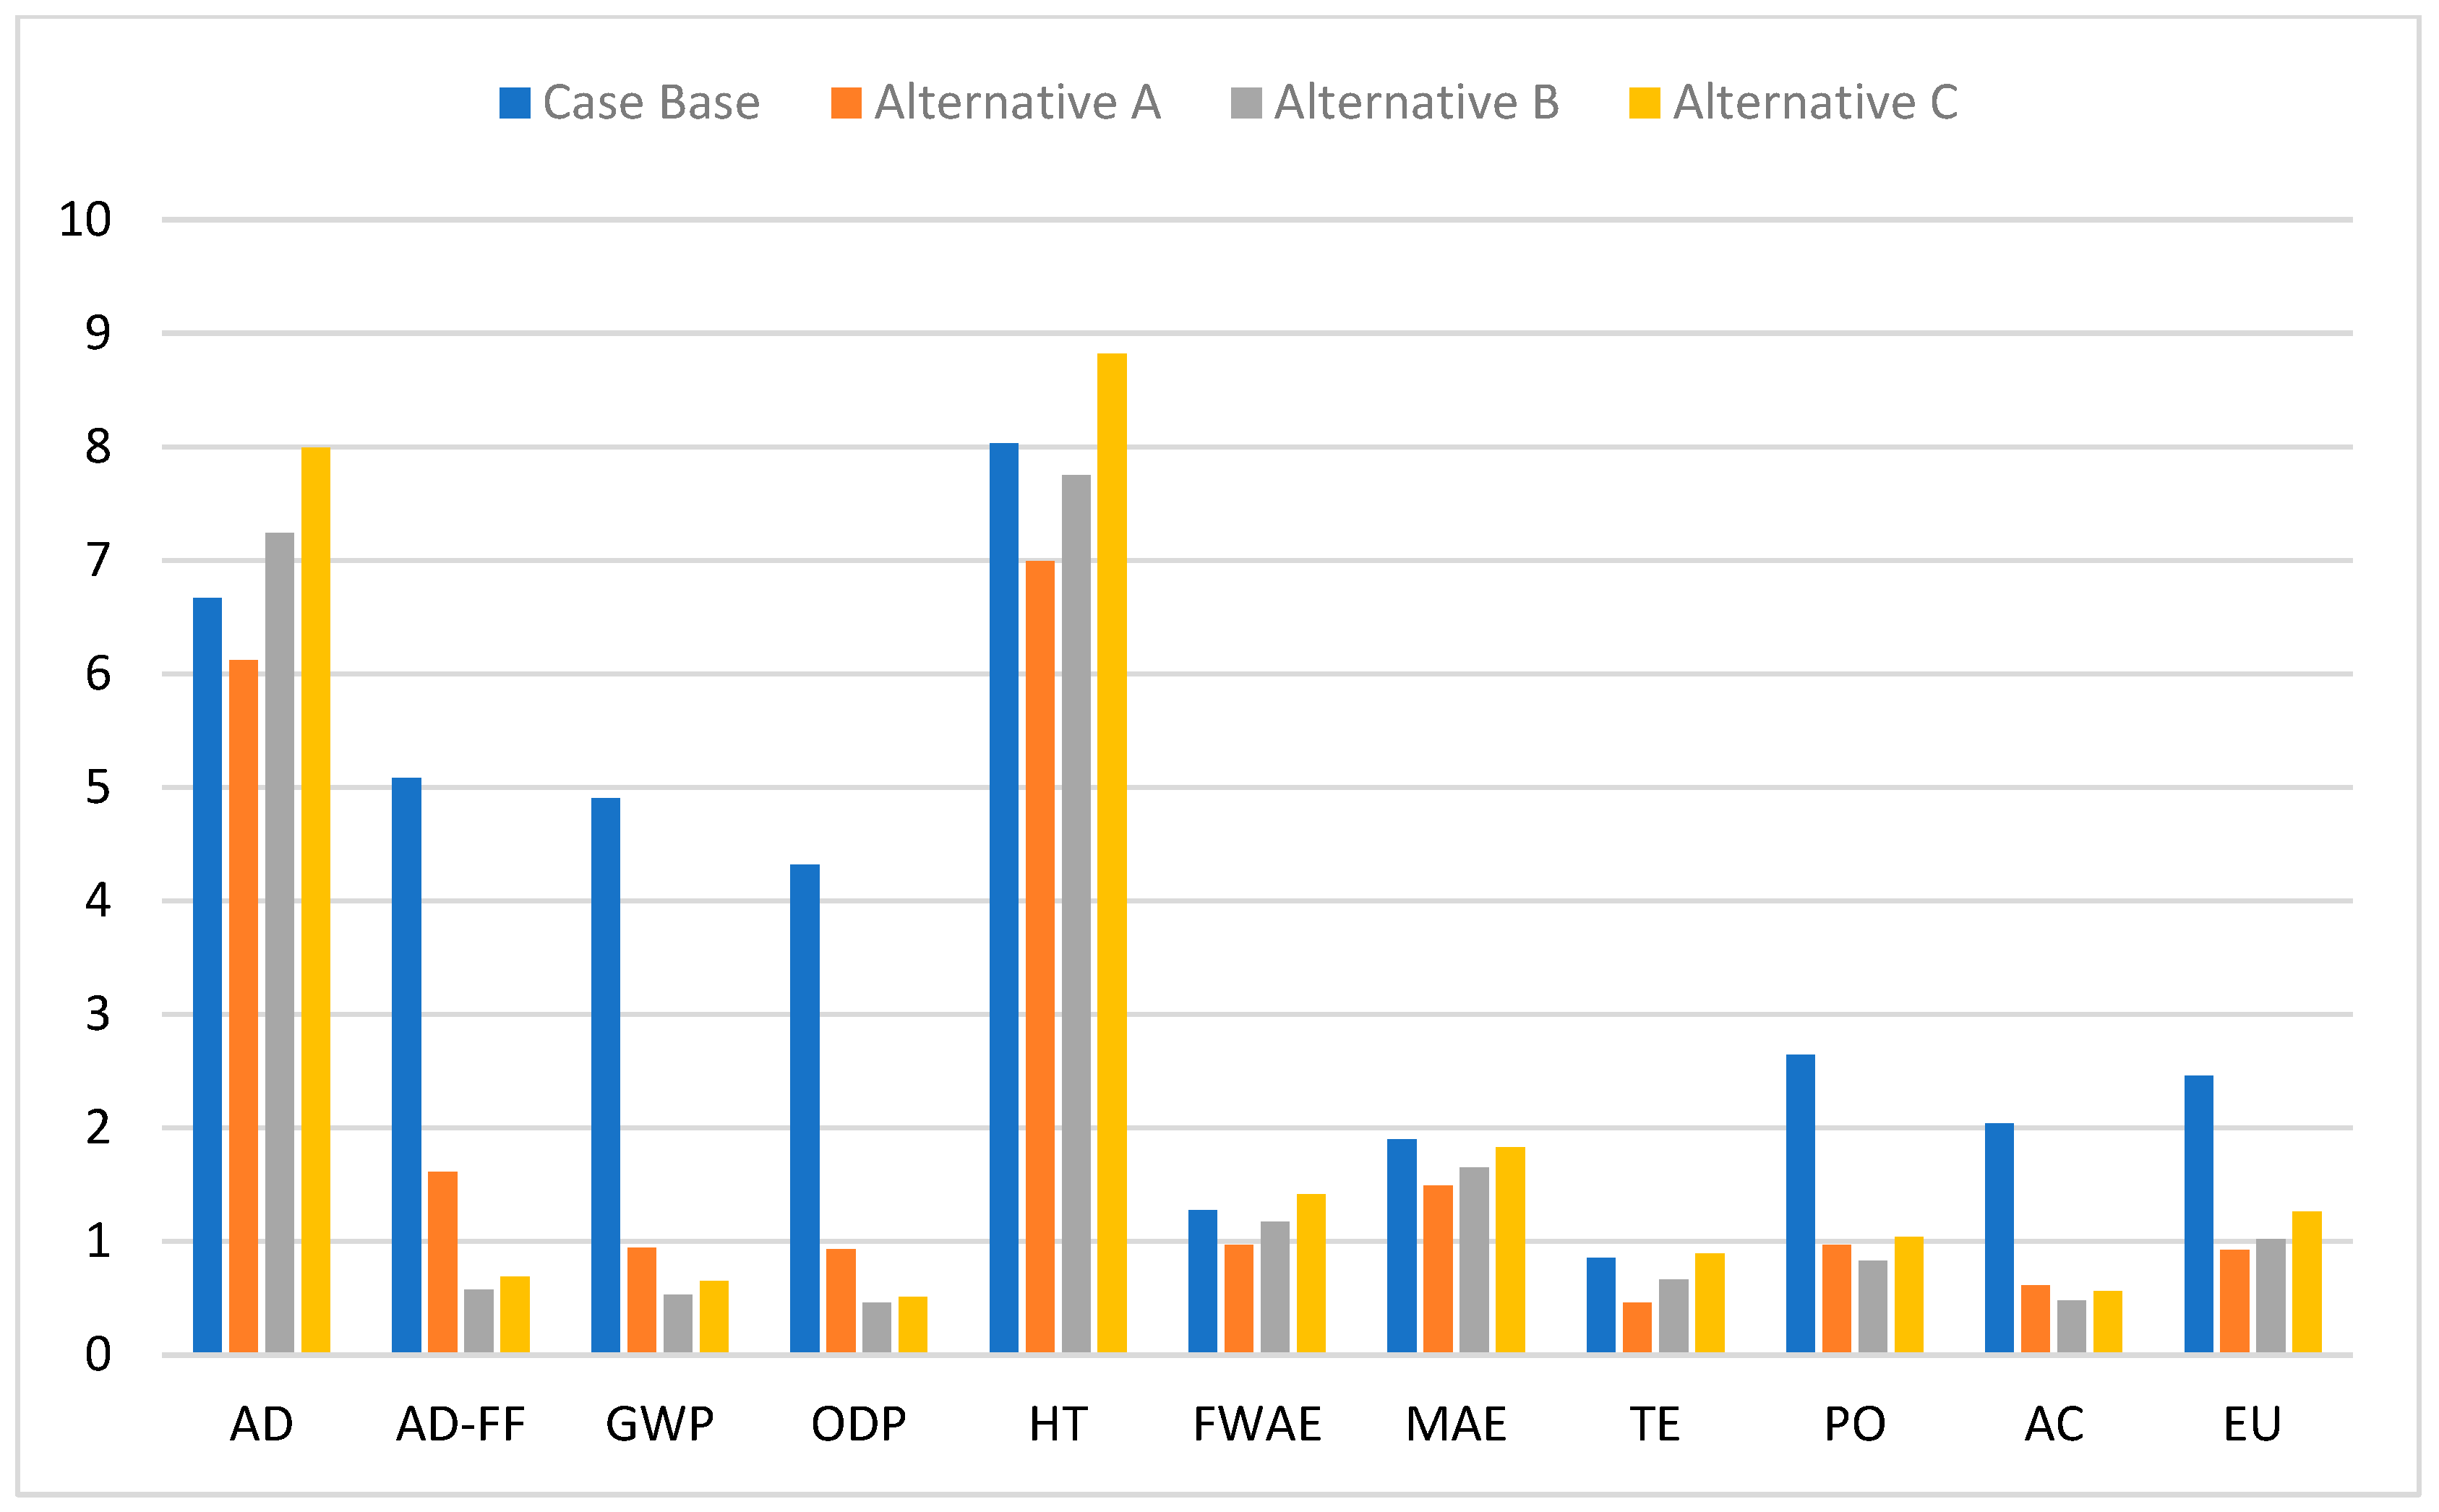
It is worth noting that in the base case and all of the alternatives, the longest amortization time corresponds to the human toxicity (HT) category. The smallest total amortization period in this category corresponds to alternative A, with 6.99 years. For alternative B, this period is extended to 7.75 years. For the base case, it is 8.03 years, while for alternative C, the period in which the installation is environmentally amortized is 8.82 years.
In the case of alternative A, only the categories AD and HT took more than 6 years to amortize, while the rest of the categories were amortized in less than 2 years.
For alternative B, something similar happened where the categories AD and HT needed more than 7 years to amortize, while the rest of the categories did so in a few months, with MAE being the one that took the longest with 1.6 years.
On the one hand, in alternative C, the categories AD and HT took almost 8 years to amortize in the first and almost 9 years in the second. The rest of the categories were amortized in terms of less than two years, as in the other two alternatives.
On the other hand, comparing this trend of the three alternatives with the base case, it can be seen how, for the base case, the amortization times were more distributed among all of the categories, and went from less than one year to MAE, going through 2, 4, 5, and 6 years until they reached 8.03 years in the HT category (see Figure 6).
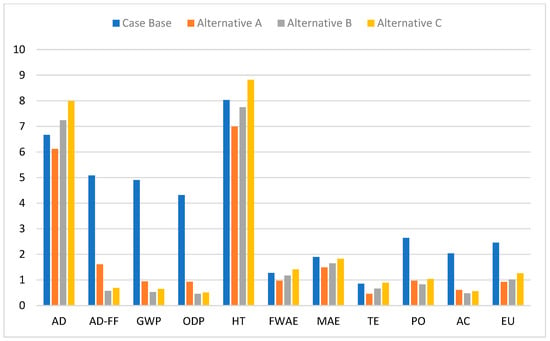
Figure 6.
Bar chart of the years of environmental amortisation by category for the different alternatives.
When talking about a percentage increment or decrement with respect to the base case of each of the three alternatives, it should be noted that as in the previous section, alternative A has decrements in all categories, alternative B has decrements in all categories except AD, and alternative C has decrements in categories AD-FF, GWP, ODP, MAE, PO, AC, and EU and percentage increments in categories AD, HT, FWAE, and TE.
If this percentage is analysed in each of the categories for each alternative, it can be seen that for alternative A, the decrease in the percentage of amortization time ranges from 8.25% in the AD category to 80.88% in the ODP category, resulting in a percentage greater than 50 for AD-FF, GWP, ODP, PO, AC, and EU and a lower percentage for the other categories. On the other hand, alternative B has percentage decrements in years ranging from 3.49% in HT to 89.28% in ODP and a percentage increment of 8.55% in category AD. The categories AD-FF, GWP, ODP, PO, AC, and EU have decrements greater than 50%. When alternative C was analysed, it was observed that the categories AD, HT, FWAE, and TE had decrements ranging from 5.42% in the case of TE to 19.79% in the case of AD. For this alternative, the percentage decrements in years with respect to the base case are higher than 72.70% for the PO, AD-FF, GWP, and ODP categories, 60.61% and 48.78% for the PO and EU categories, respectively, and a decrement of 3.68% for the MAE category.
Finally, it should be added that although the analyses considered very specific factors of the climate zone in which the house was located, it could be said that, even if those parameters were modified to fit another zone, the best alternative, environmentally speaking, would still be alternative A. Amortization periods are likely to vary. This hypothesis is based on the fact that the three alternatives would vary in terms of the energy they have to deliver and, therefore, their construction. It is possible, though, to think that all three would vary proportionally, as the functional input units would vary in this way. Testing this hypothesis, however, would be a topic for further study, adapted to different climatic zones.
4. Conclusions
This article focuses on the comparison of the environmental impact and life cycle analysis of three alternatives and a base case for the replacement of a conventional type of boiler with a geothermal one for a type of house located in a Mediterranean climate D2 with a demand of air conditioning of 35212.8 kWh per year.
The study shows that alternatives A and B have the least environmental impact in most of the categories studied. AD, HT, FWAE, MAE, TE, and EU are the categories in which option A has a lower impact than the rest. AD-FF, GWP, ODP, PO, and AC are the categories in which alternative B obtains less impact than the rest.
The total amortization periods for the three alternatives and the base case differ by almost two years, with alternative A, which was the first to be amortized, taking 6.99 years and alternative C, the one that took the longest time, costing8.82 years to amortize.
Comparing the alternatives with the base case, it can be said that the base case generates the most impact against any of the three alternatives since it has a greater impact on the 11 categories with respect to alternative A in 10 of the 11 categories with respect to alternative B and in 7 of the 11 categories with respect to alternative C.
If the three alternatives are compared with each other, alternative A and alternative B are very similar in terms of impact categories since alternative A obtains a lower value in 6 of the 11 categories and B obtains lower values in the remaining 5. When comparing both alternatives with alternative C, it can be seen how alternative A pollutes less in 7 of the 11 categories than alternative C, and alternative B contaminates less in the 11 categories than alternative C.
When talking about percentage increments and decrements, it can be seen how many percentages are very similar, whether they refer to a total percentage with respect to the base case or the percentage in years of amortization. When making these comparisons for the three alternatives with respect to the base case, it can be seen how alternatives A and B have a greater decrement in all categories for case A and in all except category AD for case B. On the other hand, alternative C has more decrements than increments but does not reach the level obtained by alternatives A and B.
In conclusion, environmentally speaking, alternatives A and B have a lower environmental impact and a shorter amortization time than the base case and alternative C.
Author Contributions
Conceptualization, C.L.R. and J.B.-F.; methodology, C.L.R. and E.M.-C.; software, E.M.-C. and C.L.R.; validation, J.L.G.-A., J.C.S.-D.M. and A.B.; formal analysis, J.C.S.-D.M. and A.B.; investigation, C.L.R.; resources, J.L.G.-A. and A.B.; data curation, C.L.R..; writing—original draft preparation, C.L.R., E.M.-C. and J.B.-F.; writing—review and editing, J.B.-F., J.C.S.-D.M. and A.B.; visualization, J.L.G.-A.; supervision, J.B.-F.; project administration, J.L.G.-A. All authors have read and agreed to the published version of the manuscript.
Funding
This research received no external funding.
Data Availability Statement
Not applicable.
Conflicts of Interest
The authors declare no conflict of interest.
References
- Dincer, I. Renewable energy and sustainable development: A crucial review. Renew. Sustain. Energy Rev. 2000, 4, 157–175. [Google Scholar] [CrossRef]
- Engstroem, S. Renewable energy resources: Wind energy from a Swedish viewpoint. Ambio 1975, 4, 75–79. [Google Scholar]
- Griffin, O. The ocean as a renewable source of energy. J. Eng. Ind. 1975, 97, 897–908. [Google Scholar] [CrossRef]
- Esen, M.; Yuksel, T. Experimental evaluation of using various renewable energy sources for heating a greenhouse. Energy Build. 2013, 65, 340–351. [Google Scholar] [CrossRef]
- Şener, M.F.; Baba, A. Geochemical and hydrogeochemical characteristics and evolution of Kozaklı geothermal fluids, Central Anatolia, Turkey. Geothermics 2019, 80, 69–77. [Google Scholar] [CrossRef]
- Shah, M.; Sircar, A.; Shaikh, N.; Patel, K.; Thakar, V.; Sharma, D.; Sarkar, P.; Vaidya, D. Groundwater analysis of Dholera geothermal field, Gujarat, India for suitable applications. Groundw. Sustain. Dev. 2018, 7, 143–156. [Google Scholar] [CrossRef]
- Apergis, N.; Payne, J.E. Renewable energy consumption and economic growth: Evidence from a panel of OECD countries. Energy Policy 2010, 38, 656–660. [Google Scholar] [CrossRef]
- Purnomo, B.J.; Pichler, T. Geothermal systems on the island of Bali, Indonesia. J. Volcanol. Geotherm. Res. 2015, 304, 349–358. [Google Scholar] [CrossRef]
- Greco, A.; Gundabattini, E.; Solomon, D.G.; Singh Rassiah, R.; Masselli, C. A Review on Geothermal Renewable Energy Systems for Eco-Friendly Air-Conditioning. Energies 2022, 15, 5519. [Google Scholar] [CrossRef]
- Lee, K.C. Classification of geothermal resources by exergy. Geothermics 2001, 30, 431–442. [Google Scholar] [CrossRef]
- Chudy, K. Mine Water as Geothermal Resource in Nowa Ruda Region (SW Poland). Water 2022, 14, 136. [Google Scholar] [CrossRef]
- Kutzner, S.; Heberle, F.; Brüggemann, D. Thermo-Economic Analysis of Near-Surface Geothermal Energy Considering Heat and Cold Supply within a Low-Temperature District Heating Network. Processes 2022, 10, 421. [Google Scholar] [CrossRef]
- Milousi, M.; Pappas, A.; Vouros, A.P.; Mihalakakou, G.; Souliotis, M.; Papaefthimiou, S. Evaluating the Technical and Environmental Capabilities of Geothermal Systems through Life Cycle Assessment. Energies 2022, 15, 5673. [Google Scholar] [CrossRef]
- Novelli, A.; D’alonzo, V.; Pezzutto, S.; Poggio, R.A.E.; Casasso, A.; Zambelli, P. A spatially-explicit economic and financial assessment of closed-loop ground-source geothermal heat pumps: A case study for the residential buildings of valle d’aosta region. Sustainability 2021, 13, 12516. [Google Scholar] [CrossRef]
- Solla, M.; Blázquez, C.S.; Nieto, I.M.; Rodríguez, J.L.; Maté-González, M.Á. GPR Application on Geothermal Studies: The Case Study of the Thermal Baths of San Xusto (Pontevedra, Spain). Remote Sens. 2022, 14, 2667. [Google Scholar] [CrossRef]
- Blázquez, C.S.; Borge-Diez, D.; Nieto, I.M.; Maté-González, M.Á.; Martín, A.F.; González-Aguilera, D. Geothermal Heat Pumps for Slurry Cooling and Farm Heating: Impact and Carbon Footprint Reduction in Pig Farms. Sustainability 2022, 14, 5792. [Google Scholar] [CrossRef]
- Kyriakarakos, G.; Ntavou, E.; Manolakos, D. Investigation of the use of low temperature geothermal organic rankine cycle engine in an autonomous polygeneration microgrid. Sustainability 2020, 12, 10475. [Google Scholar] [CrossRef]
- Haslinger, E.; Turewicz, V.; Hammer, A.; Götzl, G. Assessment of Deep and Shallow Geothermal Resources and Measurement of Waste Heat Potentials from Industrial Processes for Supplying Renewable Heat for Industry and Urban Quarters. Processes 2022, 10, 1125. [Google Scholar] [CrossRef]
- Mun, H.S.; Dilawar, M.A.; Rathnayake, D.; Chung, I.B.; Kim, C.D.; Ryu, S.B.; Park, K.W.; Lee, S.R.; Yang, C.J. Effect of a geothermal heat pump in cooling mode on the housing environment and swine productivity traits. Appl. Sci. 2021, 11, 778. [Google Scholar] [CrossRef]
- Zhang, J.; Lu, X.; Zhang, W.; Liu, J.; Yue, W.; Ma, F. Investigation of a Novel Deep Borehole Heat Exchanger for Building Heating and Cooling with Particular Reference to Heat Extraction and Storage. Processes 2022, 10, 888. [Google Scholar] [CrossRef]
- Wolf, M. 10 Years of geothermal energy utilization. Wasser Abfall 2011, 13, 15–19. [Google Scholar] [CrossRef]
- Renewable Energy Programme. Renewable Energy Plan (2011–2020)—Plan de Energías Renovables (2011–2020); IDEA (Instituto para la Diversificación y Ahorro de la Energía): Madrid, Spain, 2011. [Google Scholar]
- Al-helal, I.; Alsadon, A.; Marey, S.; Ibrahim, A.; Shady, M.; Abdel-Ghany, A. Geothermal Energy Potential for Cooling/Heating Greenhouses in Hot Arid Regions. Atmosphere 2022, 13, 105. [Google Scholar] [CrossRef]
- Miranda, M.M.; Raymond, J.; Willis-Richards, J.; Dezayes, C. Are engineered geothermal energy systems a viable solution for arctic off-grid communities? A techno-economic study. Water 2021, 13, 3526. [Google Scholar] [CrossRef]
- Vokurka, M.; Kunz, A. Case Study of Using the Geothermal Potential of Mine Water for Central District Heating—The Rožná Deposit, Czech Republic. Sustainability 2022, 14, 2016. [Google Scholar] [CrossRef]
- Rüther, J.; Lederer, S.; Peth, C.; Sass, I. Mechanical evaluation of sintered macroporous high-density polyethylene filter elements for shallow geothermal application. J. Porous Media 2016, 19, 219–232. [Google Scholar] [CrossRef]
- Di Sipio, E.; Bertermann, D. Factors influencing the thermal efficiency of horizontal ground heat exchangers. Energies 2017, 10, 1897. [Google Scholar] [CrossRef]
- Di Sipio, E.; Bertermann, D. Soil thermal behavior in different moisture condition: An overview of ITER project from laboratory to field test monitoring. Environ. Earth Sci. 2018, 77, 283. [Google Scholar] [CrossRef]
- Cho, J.-H.; Nam, Y.; Kim, H.-C. Performance and feasibility study of a Standing Column Well (SCW) system using a deep geothermal well. Energies 2016, 9, 108. [Google Scholar] [CrossRef]
- Lijó, L.; González-García, S.; Lovarelli, D.; Moreira, M.T.; Feijoo, G.; Bacenetti, J. Life cycle assessment of renewable energy production from biomass. In Life Cycle Assessment of Energy Systems and Sustainable Energy Technologies; Springer: Berlin/Heidelberg, Germany, 2019; pp. 81–98. [Google Scholar]
- Pehnt, M. Dynamic life cycle assessment (LCA) of renewable energy technologies. Renew. Energy 2006, 31, 55–71. [Google Scholar] [CrossRef]
- Üçtuğ, F.G.; Azapagic, A. Environmental impacts of small-scale hybrid energy systems: Coupling solar photovoltaics and lithium-ion batteries. Sci. Total Environ. 2018, 643, 1579–1589. [Google Scholar] [CrossRef]
- Chiavetta, C.; Tinti, F.; Bonoli, A. Comparative life cycle assessment of renewable energy systems for heating and cooling. Procedia Eng. 2011, 21, 591–597. [Google Scholar] [CrossRef]
- Hanbury, O.; Vasquez, V. Life cycle analysis of geothermal energy for power and transportation: A stochastic approach. Renew. Energy 2018, 115, 371–381. [Google Scholar] [CrossRef]
- Sullivan, J.; Clark, C.; Han, J.; Wang, M. Life Cycle Analysis of Geothermal Systems in Comparison to Other Power Systems; ANL/ESD/10-5; Argonne National Laboratory: Argonne, IL, USA, 2010. [Google Scholar]
- Vasquez, V.R.; Hanbury, O. Life cycle analysis of geothermal energy extraction. In Proceedings of the 2011 AIChE Annual Meeting, Minneapolis, MN, USA, 16–21 October 2011. [Google Scholar]
- Lacirignola, M.; Meany, B.H.; Padey, P.; Blanc, I. A simplified model for the estimation of life-cycle greenhouse gas emissions of enhanced geothermal systems. Geotherm. Energy 2014, 2, 8. [Google Scholar] [CrossRef]
- Russo, G.; Anifantis, A.S.; Verdiani, G.; Mugnozza, G.S. Environmental analysis of geothermal heat pump and LPG greenhouse heating systems. Biosyst. Eng. 2014, 127, 11–23. [Google Scholar] [CrossRef]
- Todoran, T.P.; Balan, M.C. Long term behavior of a geothermal heat pump with oversized horizontal collector. Energy Build. 2016, 133, 799–809. [Google Scholar] [CrossRef]
- Rubio, C.-L.; García-Alcaraz, J.L.; Martínez-Cámara, E.; Latorre-Biel, J.I.; Jiménez-Macías, E.; Blanco-Fernández, J. Replacement of electric resistive space heating by a geothermal heat pump in a residential application–Environmental amortisation. Sustain. Energy Technol. Assess. 2020, 37, 100567. [Google Scholar] [CrossRef]
- Maione, A.; Massarotti, N.; Santagata, R.; Vanoli, L. Environmental assessment of a heating, cooling and electric energy grid from a geothermal source in Southern Italy. J. Clean Prod. 2022, 375, 134198. [Google Scholar] [CrossRef]
- Rose, A.D.; Harcouet-Menou, V.; Laenen, B.; Caia, V.; Facco, L.; Guglielmetti, L.; Olivieri, N.; Rocco, E.; Strazza, C.; Vela, S.; et al. Study on ‘Geothermal Plants’ and Applications’ Emissions: Overview and Analysis; European Commission: Brussels, Belgium, 2020. [Google Scholar]
Publisher’s Note: MDPI stays neutral with regard to jurisdictional claims in published maps and institutional affiliations. |
© 2022 by the authors. Licensee MDPI, Basel, Switzerland. This article is an open access article distributed under the terms and conditions of the Creative Commons Attribution (CC BY) license (https://creativecommons.org/licenses/by/4.0/).

