Article

Experimentally Validated Coulomb Counting Method for Battery State-of-Charge Estimation under Variable Current Profiles

1
Mechanical Engineering Department, Faculty of Technology, University of Eloued, El Oued 39000, Algeria
2
ESTA, School of Business and Engineering, 90000 Belfort, France
3
Femto-ST, FCLAB, University Bourgogne Franche-Comte, CNRS, UTBM, 91110 Belfort, France
*
Authors to whom correspondence should be addressed.
Energies 2022, 15(21), 8172; https://doi.org/10.3390/en15218172
Submission received: 28 September 2022 / Revised: 25 October 2022 / Accepted: 25 October 2022 / Published: 2 November 2022
(This article belongs to the Special Issue Lithium-Ion Batteries: Latest Advances, Challenges and Prospects)

Abstract

:
Battery state of charge as an effective operational indicator is expected to play a crucial role in the advancement of electric vehicles, improving the battery capacity and energy utilization, avoiding battery overcharging and over-discharging, extending the battery’s useful lifespan, and extending the autonomy of electric vehicles. In context, this article presents a computationally efficient battery state-of-charge estimator based on the Coulomb counting technique with constant and variable discharging current profiles for an actual battery pack in real time. A dedicated experimental bench is developed for validation purposes, where pivotal measurements such as current, voltage, and temperature are initially measured during the charging/discharging cycle. The state of charge thus obtained via these measurements is then compared with the value estimated through the battery generic model. Detailed analysis with conclusive outcomes is finally presented to exhibit the flexible nature of the proposed method in terms of the precise state-of-charge estimation for a variety of batteries, ranging from lead–acid batteries for domestic applications to Li-ion batteries inside electric vehicles.

1. Introduction

The battery state of charge (SOC) for electric vehicles is equivalent to the oil meter for conventional fuel vehicles. Typically, the relation between the electrochemical reactions and SOC is complex and difficult to determine. In addition, for vehicles, the working conditions are challenging and complex. It is therefore very difficult to obtain precise SOC as it is a hidden state function of electrochemical reactions inside the battery. It is possible to separate the battery SOC estimation strategies into four classes [1]: characteristic param-driven approach [2,3,4,5,6,7], an integral estimation method [8,9,10,11], a physical model-driven method [12,13,14,15,16], and a data-driven approach [17,18,19,20,21,22,23,24,25], as illustrated in Figure 1.
Subsequently, Table 1 sums up the benefits and drawbacks of four SOC assessment strategies, which are presented in Figure 1. Due to the importance of this topic, SOC estimation is rigorously investigated by several researchers. The work of [27] evaluated the SOC estimation via two model-based techniques that are the extended Kalman filter and the adaptive dual extended Kalman filter influenced by a fuzzy inference system. The experimental results demonstrate that the last technique provides a more precise indication of the battery SOC. The reference [28] is focused on optimizing the battery state of health within the domain of satellite applications. To enhance the performance of the system, the authors have taken into consideration different constraints linked to the battery SOC. For this, the Coulomb counting technique is used to estimate the battery SOC. Another study [29] treated the battery SOC as an operational indicator, which can influence the energy consumption of the electric vehicle [30]. Therefore, the SOC estimator is defined as the crude power consumption of the studied electrical vehicle (for more details, the reader can consult [31,32]).
The goal of this work is to estimate the SOC of a domestic-grade lead–acid battery through empirical measurements of battery voltage and current using the Ampere-hour integral estimation method with constant and variable C-rates for discharge current. There are many studies on the SOC estimation of lead–acid and Li-ion batteries, especially the Coulomb counting method [33,34]. However, the research work conducted in this article differentiates by investigating the discharging behavior of a lead–acid battery in extended and varying conditions.
For that, a dedicated test bench is prepared, and cross-validation is conducted under real-time scenarios and simulations. Finally, the performance of the proposed method is depicted by an evident comparison with the data provided by the manufacturer under variable operating conditions and with the generic battery model. It is worth mentioning here that the proposed method is generic and flexible in terms of its application, which is especially true for domestic-grade batteries as well as for modern Li-ion batteries present in electric vehicles. Moreover, the hysteresis effect is also taken into account considering the studied lead–acid battery.
The remainder of the paper is presented as: In Section 2, the battery management system is summarized by citing some references. The Coulomb counting method is highlighted in Section 3. In Section 4, the generic battery model is developed and comprehensively discussed. The experimental setup, which exhibits the feasibility and the applicability of the proposed approach for the lead–acid battery to attain adequate SOC values, is highlighted in Section 5. Section 6 is dedicated to the obtained results that are discussed in detail. Finally, the conclusions and the relevant perspectives are drawn in Section 7.

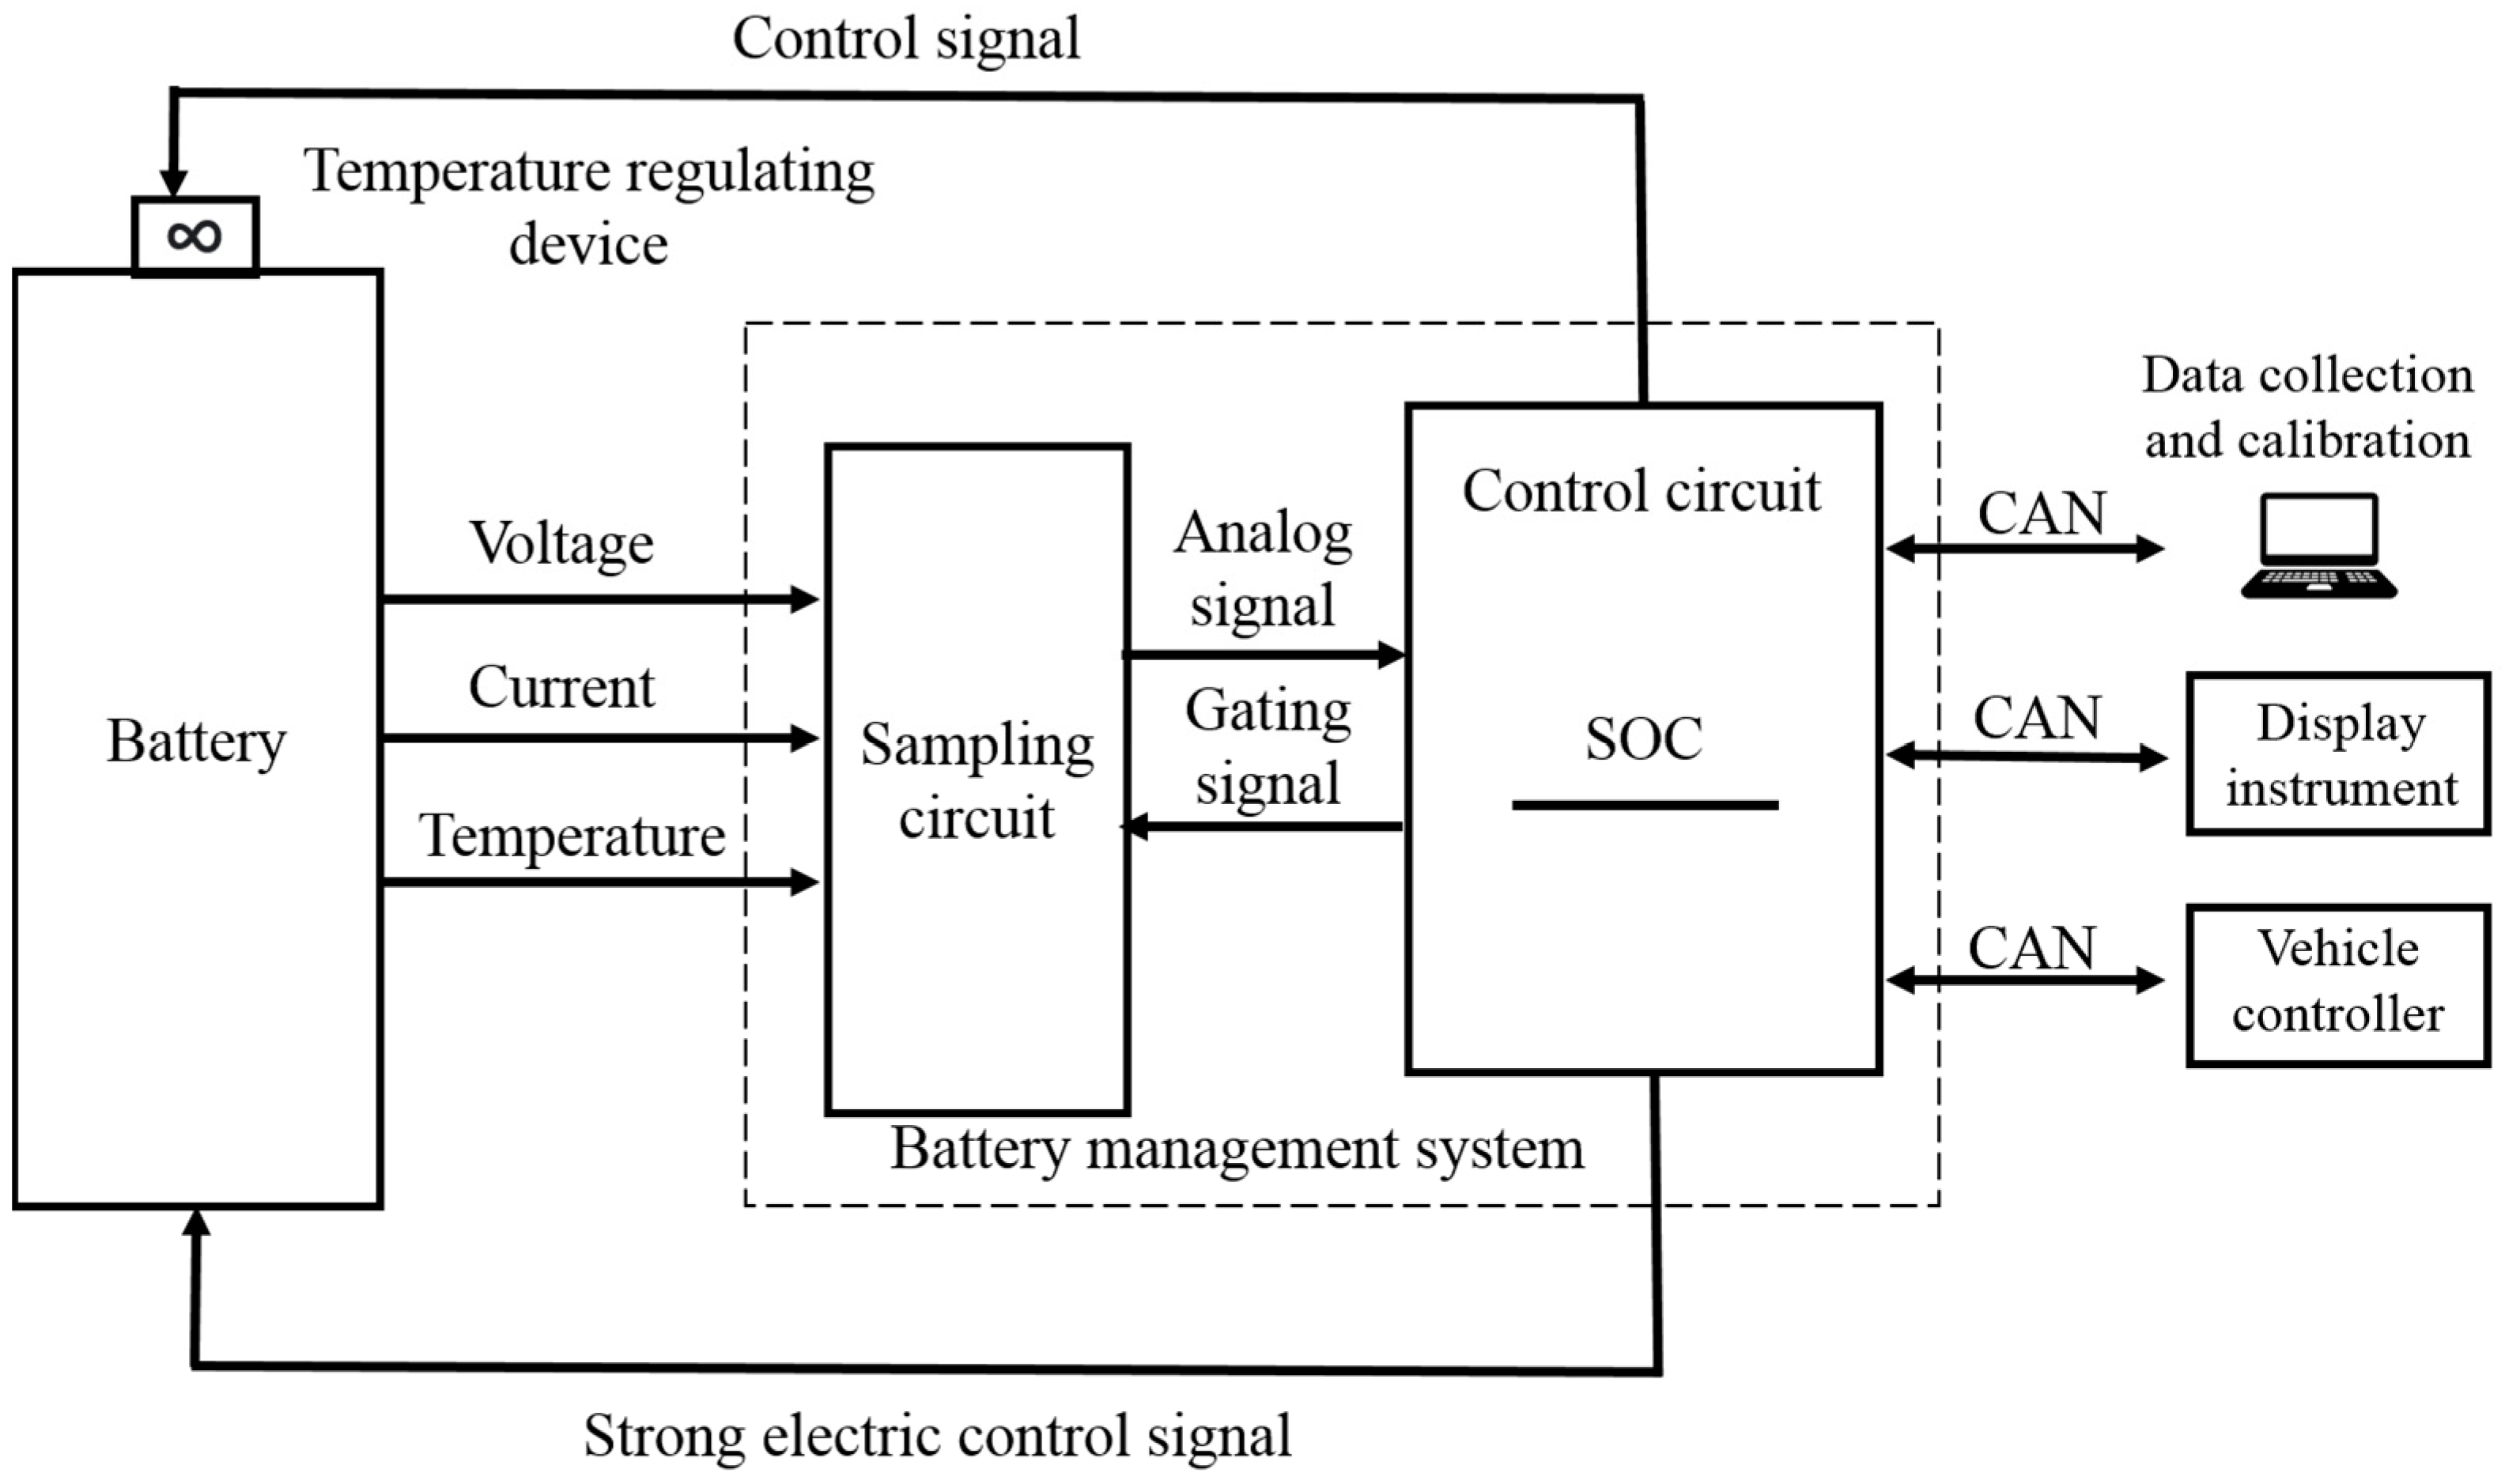
2. Battery Management System

The battery management system (BMS) is a technology that performs the micro-management of the battery pack in terms of its state of health (SOH). Figure 2 depicts a general layout of a typical BMS, which constitutes numerous sensors, actuators, controllers, connection lines, etc. The bidirectional communication between the control unit of BMS and external bodies such as the human media interface is typically carried out via CAN (the communication bus controller area network). Besides maintaining reliability during normal and abnormal operating conditions, adequate provision of the battery state of charge to the vehicle’s vehicle control unit (VCU) is among the vital tasks of BMS.
A well-built BMS aids in collecting critical data in real time, such as electrical measurements, temperature, and other relevant data via inherent sampling hardware. The collected data is then exploited via embedded algorithms and strategies to estimate the battery states, such as SOC [37], SOH [38], SOP [39], and RUL [40]. These states are ultimately fed to VCU, in order to facilitate effective power management.

3. Coulomb Counting Method

The Coulomb counting method (known as the current integration method) is chosen as the baseline in this article and is among the most exploited method [41]. It consists of measuring the battery open circuit voltage at the start-up to estimate the initial SOC using the battery datasheet information. Then, the battery current information is integrated to estimate the amount of charge delivered (or recovered) by the batteries. The overall concept is presented in Equation (1), where knowledge of the initial SOC is detrimental to determining the state of charge [24,42,43]. Based on this approach, the SOC for the battery pack is calculated as follows [44]:
SOC = SOC 0 1 C N t 0 t ƞ · I τ d τ
If the initial value of the charge state SOC0 is specified, or imposed (technically, most researchers impose the initial state as to be fully charged or fully discharged), the Coulomb counter provides precise estimation with relative ease and simplicity [45]. On the contrary, this method is less accurate if the SOC0 is unknown.
The Coulomb counting strategy computes the remaining stored energy essentially by collecting the charge moved in or out of the battery. The precision of this strategy depends fundamentally on a real estimation of the battery current and a precise assessment of the initial SOC. With pre-knowledge of the initial SOC, which also can be stored at the end of the vehicle trip in a flash memory to be reused as the initial SOC for the next trip (and neglecting the battery self-discharge), the battery SOC can be determined by computing the stored and the released energy flows over the operating time. Nevertheless, the stored energy in the battery is not completely available to be used due to the DOD (depth of discharge) which is a quantity of energy to keep inside the battery to avoid permanent damage. Moreover, there are losses during the charging and discharging process. For an exact SOC assessment, this effect should be considered [46]. Futhermore, the SOC must be recalibrated consistently, and the discharge limit should be considered for an exact assessment.

4. Generic Battery Model

The battery model can be obtained by considering a voltage source in series with constant resistance, as appears in Equation (2) [11].
V b a t t   = E 0 K Q Q i t · i t R · I + A · exp   ( B · i t ) K Q Q i t · i *
As depicted in Figure 3, the special feature of this model is the use of filtered current (i*) through the polarization resistance. This filtered current solves the problem of the algebraic loop due to the simulation of power systems in Simulink [47]. Despite the existence of hysteresis between the charging and discharging of the battery voltage, this model is still valid for both charge and discharge cycles [48]. The battery models can be obtained using:
The charge model (i* < 0)
f 1 i t , i * , e x p , b a t t   t y p e = E 0   K Q i t 0.1 Q · i * K   Q i t Q · i t + Exp   ( t )
The discharge model (i* > 0)
f 1 i t , i * , e x p , b a t t   t y p e = E 0   K Q i t Q · i * K   Q i t Q · i t + Exp   ( t )
The employed model is simplistic and cannot exactly mimic the complex electrochemical reactions taking place within the battery under the influence of actual operating conditions. However, this model is still adequate from the computational side, and can suffix for a range of applications. Especially, for the discharge state of lead acid batteries with different currents, which is extensively studied, where the discharge curve of the simulations matches with the discharge curve of the experimental work and with that of the datasheet. Therefore, even with assumptions and limitations, the utilized model suffixes the fundamental needs of this research work. It is worth mentioning here that the hysteresis phenomenon for the lead–acid battery is considered here. The effect can be seen in Figure 4, exhibiting that the exponential voltage increases when the battery is charging, while during the discharging, the exponential voltage decreases immediately.
Application: From the discharge curve provided by the manufacturer, the extracted parameters are presented in Table 2. The model also has its assumptions and limitations as follows:
Limitations
-
The minimum no-load battery voltage is 0 V and the maximum battery voltage is equal to 2 × E 0 .
-
The minimum capacity of the battery is 0 Ah and the maximum capacity is Q m a x .
Assumptions
-
The internal resistance is supposed as a constant value during the charge and the discharge cycles and does not vary with the amplitude of the current.
-
The parameters of the model are deduced from discharge characteristics and assumed to be the same for charging.
-
The capacity of the battery does not change with the amplitude of the current (no Peukert effect).
-
The model does not take the temperature into account.
-
The self-discharge of the battery is not represented. It can be represented by adding a large resistance in parallel with the battery terminals.
-
The battery has no memory effect.

5. Experimental Method and Description
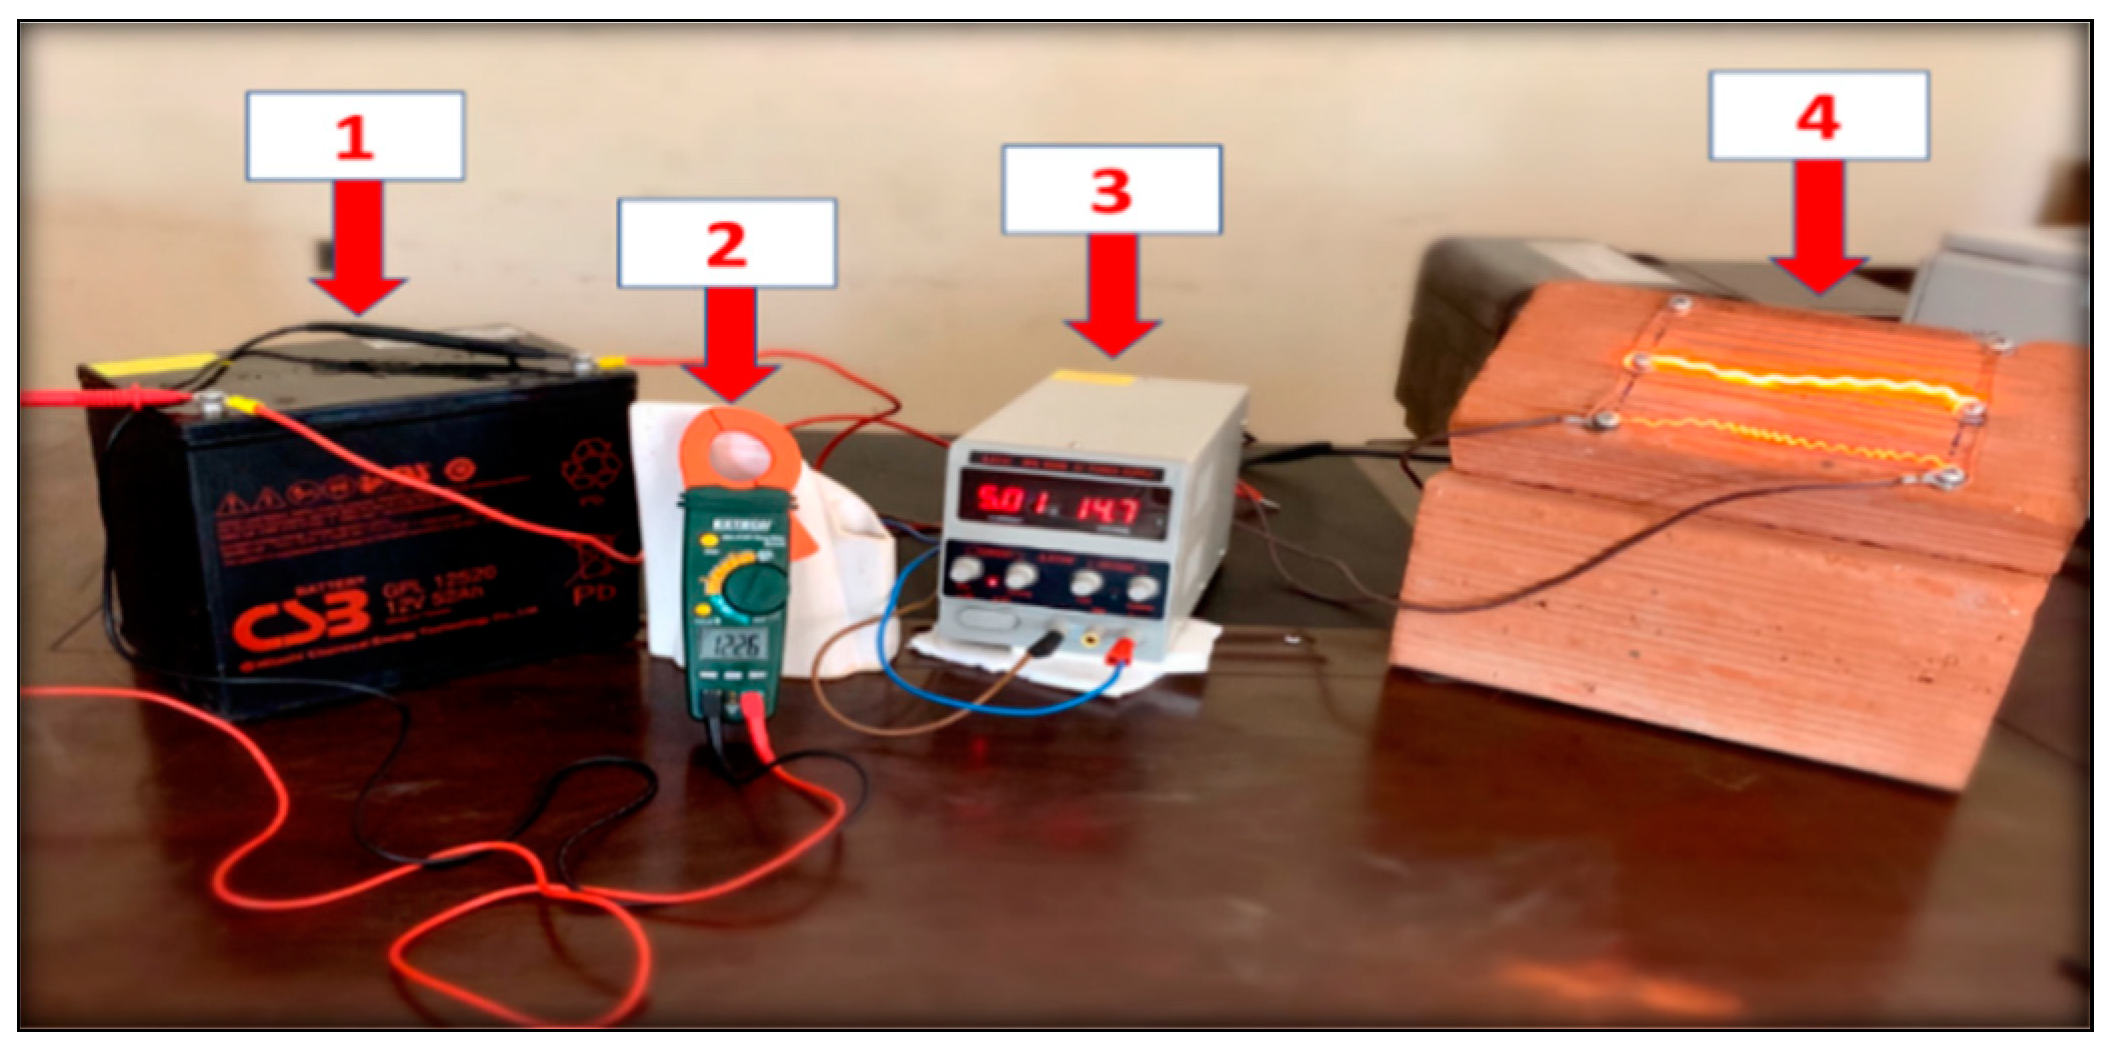
Battery specification: The battery employed in this research is a valve-regulated lead–acid (VRLA) type with a nominal voltage of 12 V and a nominal capacity of 52 Ah. The recommended voltage when charged for standby use is 1.75 V for a single cell (6 cells in series). Further features of this battery are presented in Table 3.
Measurement test bench: The measurement test bench is presented in Figure 5, which further consists of four interconnected components.
  • Lead–acid battery
  • Clamp meter
  • DC power supply
  • Variable resistor (handmade)
Computing parameters: The proposed computing method is implemented in Matlab/Simulink version 2015b and has the following attributes and parameters: variable step, ode45 (Dormand–Prince), relative tolerance = 1 × 10⁻³, time tolerance = 10 × 128 × eps, zero crossing control = use local settings, algorithm = non adaptive, number of consecutive zero crossings = 1000, number of consecutive min steps = 1.
Charging process test: The battery is charged via an external DC power supply, and the initial voltage at the time of testing is effectively set at 14.7 V. The current maximum limit is set to 5.03 A (this is the maximum available value). The battery is connected to the power supply and is left until its fully charged. The voltage and current are measured using a voltmeter and clamp meter every 10 min. The end-of-charge voltage equals Vfinish-ocv = 13.96 V and the end-of-charge current (the minimum value of the current in the vicinity of full charge) is Imin = 0.29 A. When the charging current reaches the minimum value of 0.29 A (indicated by the manufacturer), the battery is disconnected, and the DC power voltage supply is turned off. This test was spanned over 02 days, the duration of this test, therefore, equals Tch = 1440 min or Tch = 24 h.
Discharging process test: Two experiments are conducted in total with relevance to the discharging test:
-
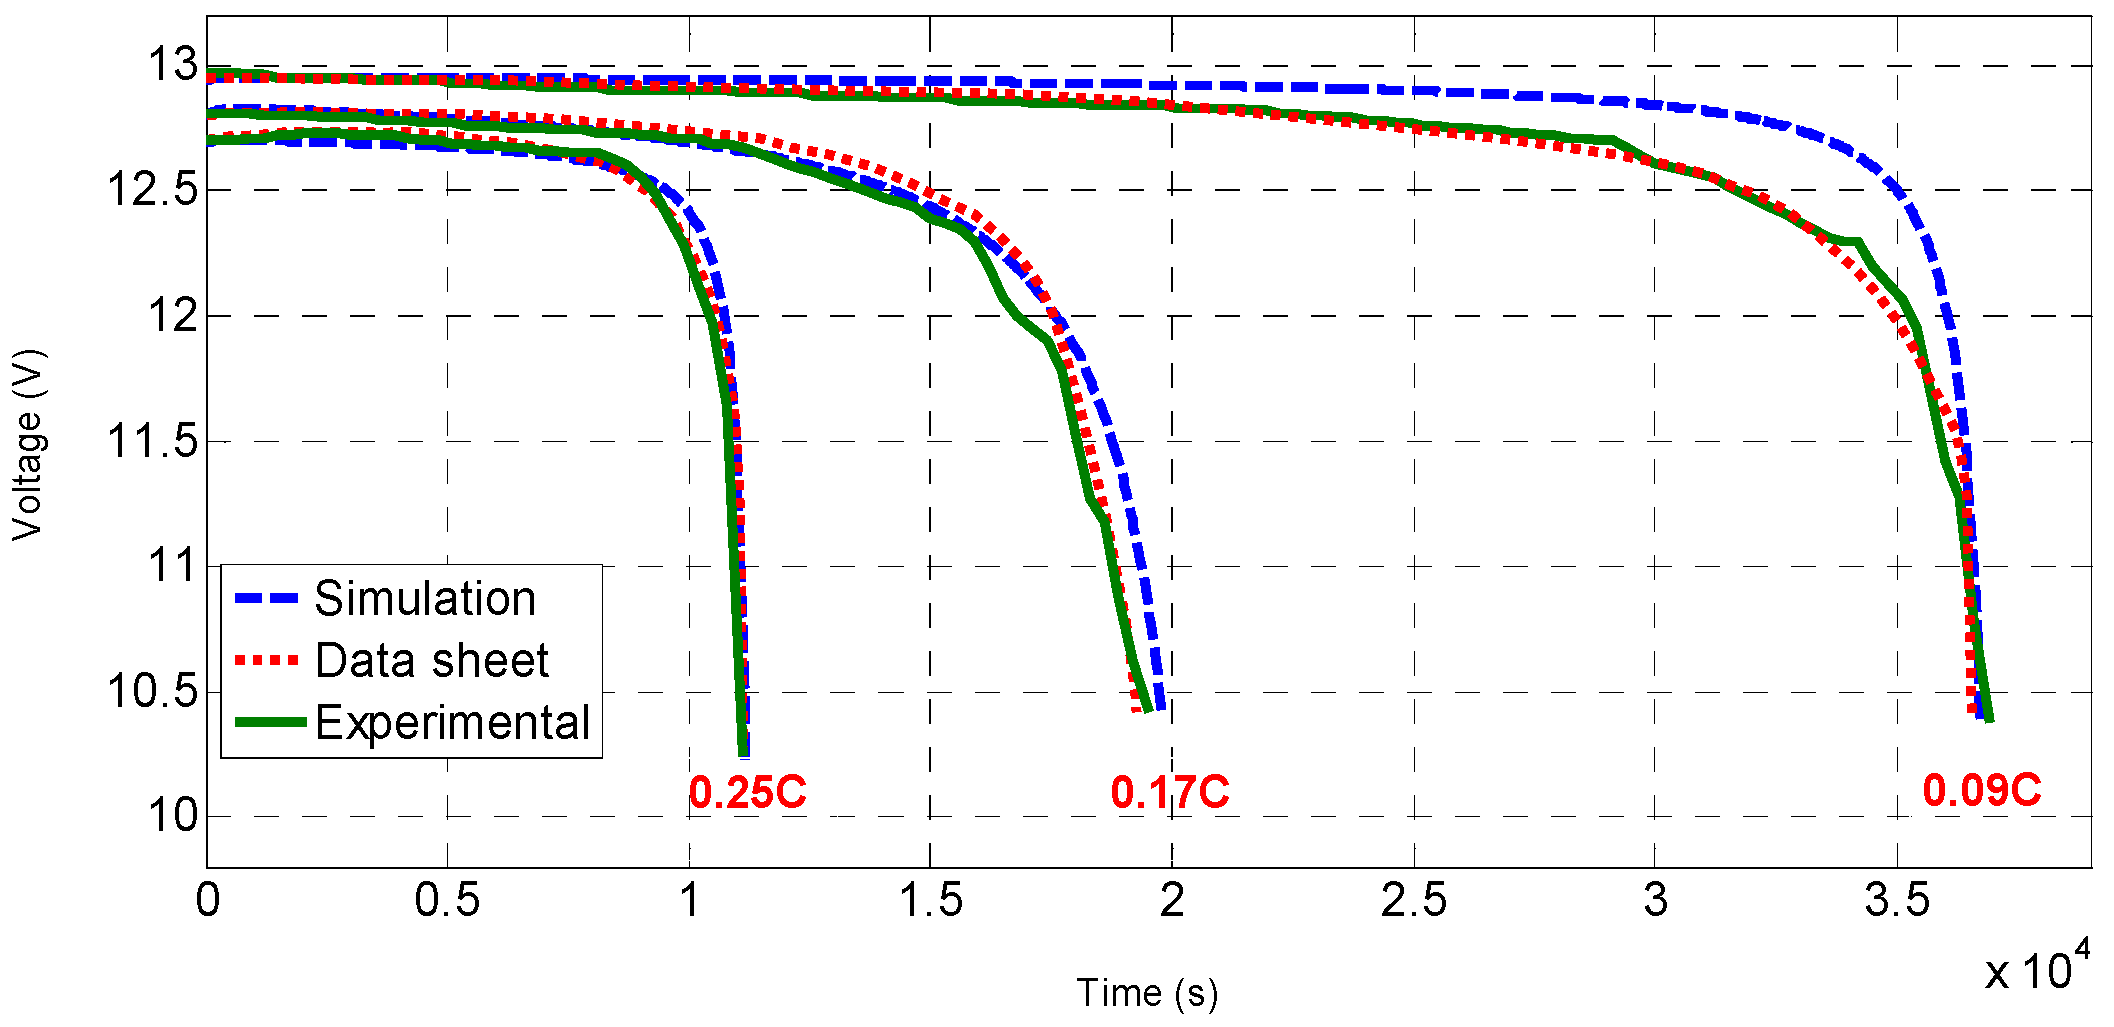
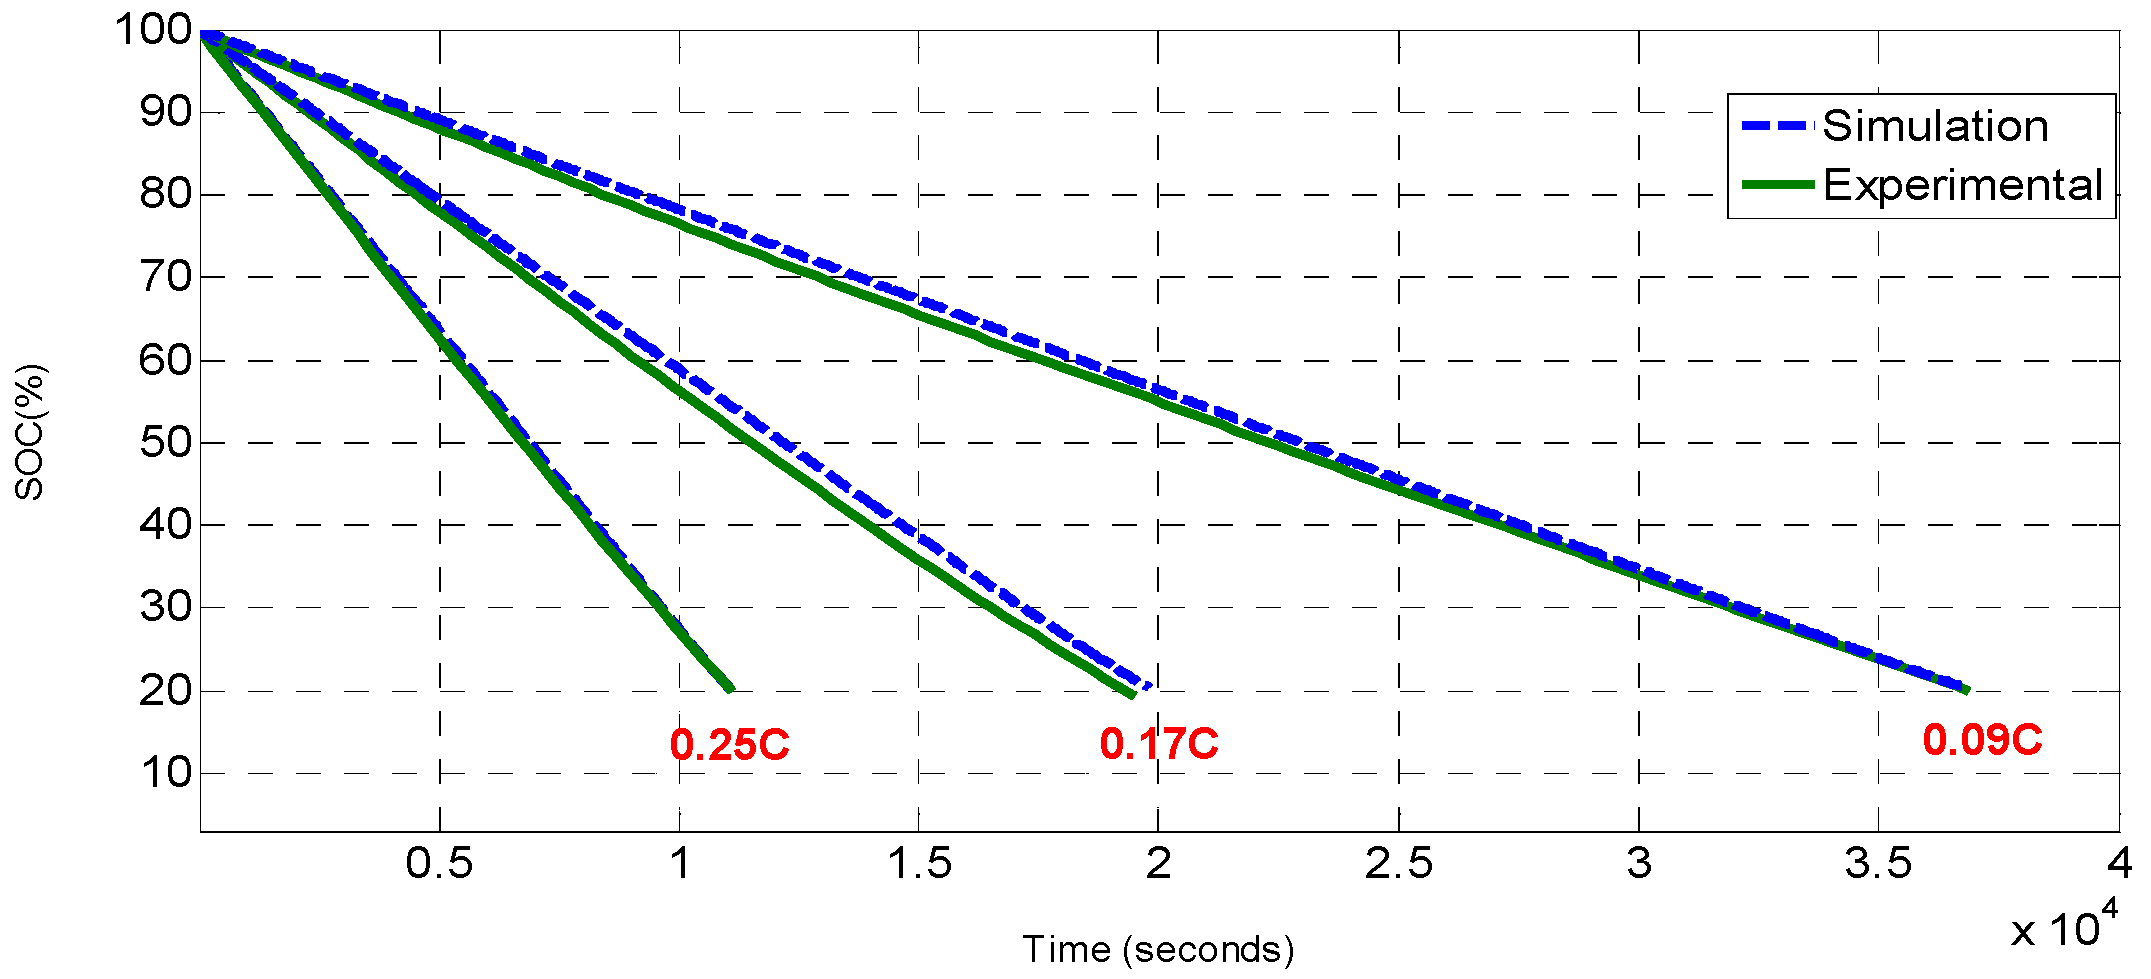
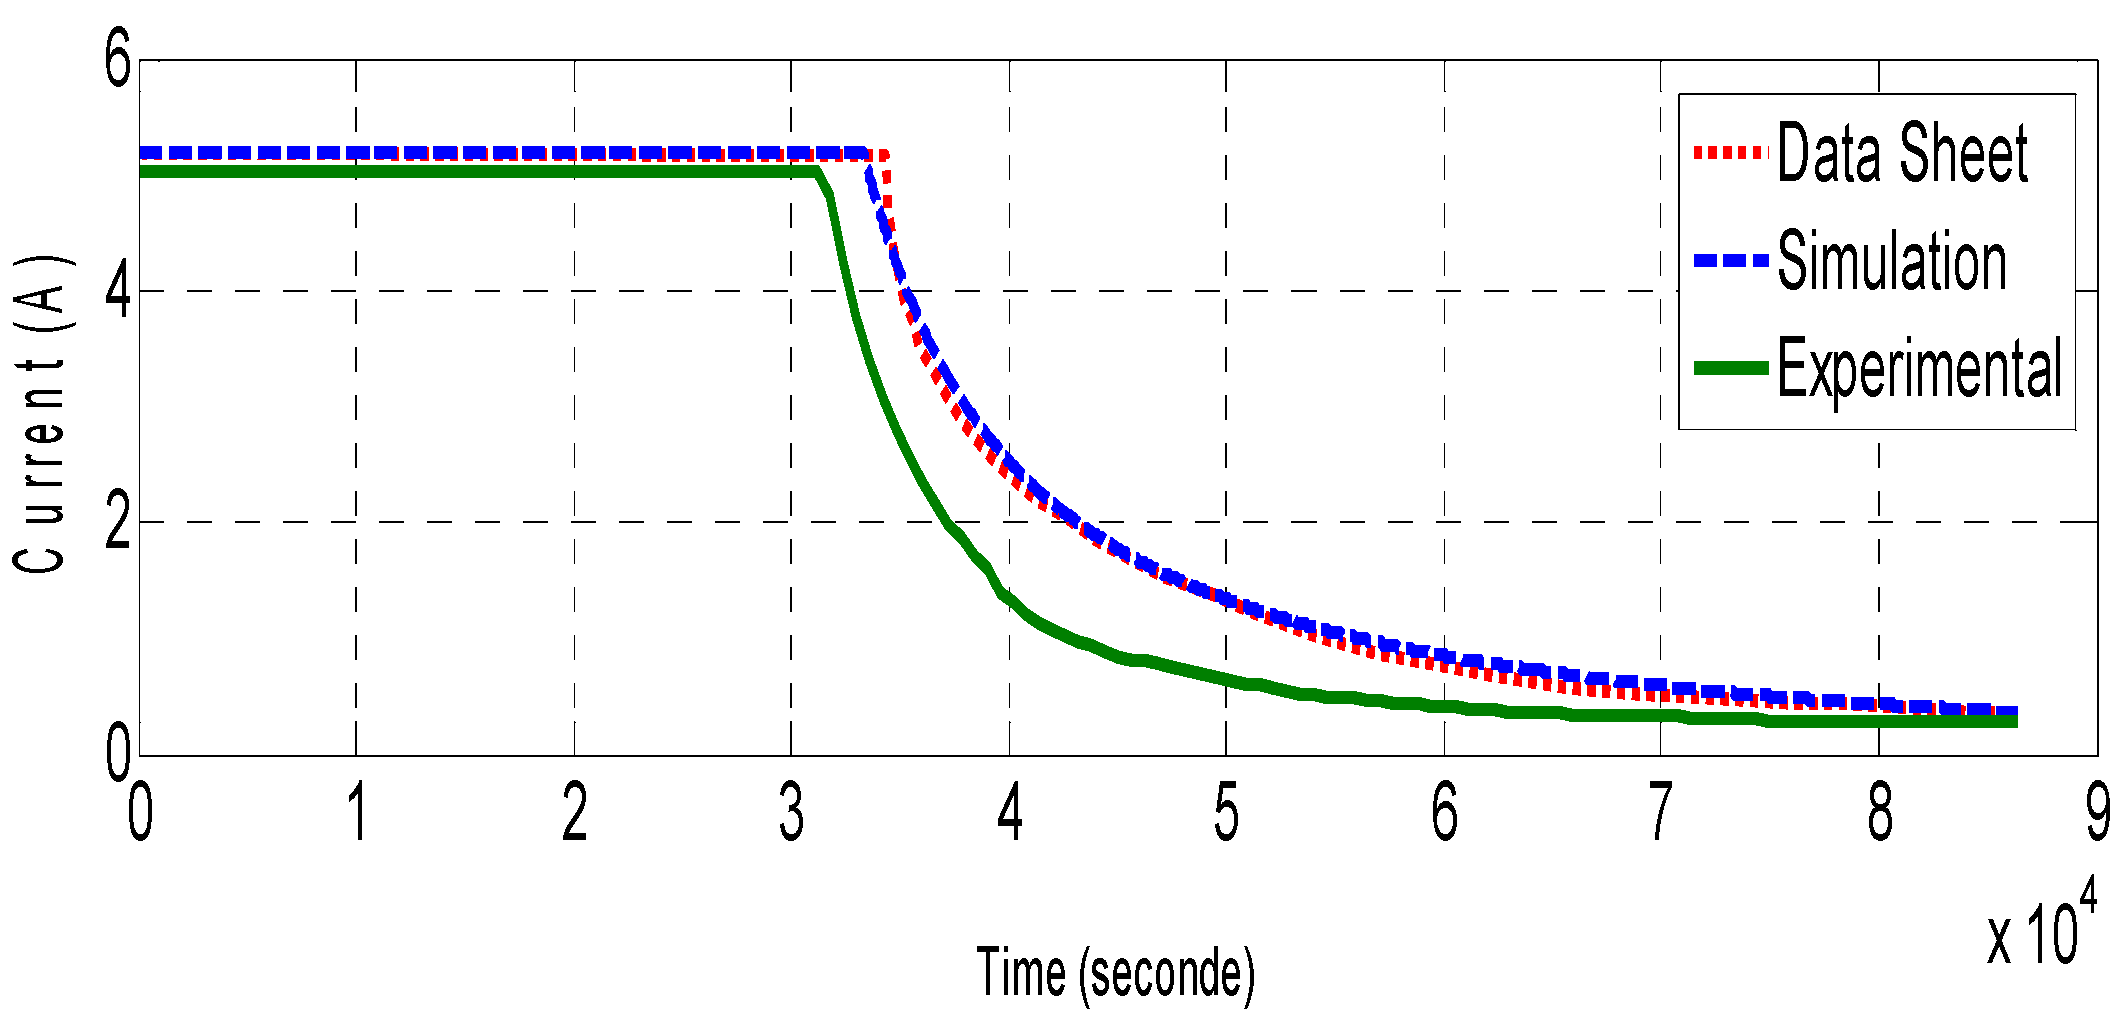
Discharging with constant C-rates: a variable resistor is connected (for adjustment to variable C-rates, that is to reach discharge current at 0.25 C, 0.17 C, and 0.09 C respectively) with the battery. Consequently, the voltage and the discharge current are measured after every 5 min by using a clamp meter. After 3.05, 5.41, and 10.25 h, respectively (corresponding to the associated C-rate), it reaches the lower permissible limit of discharge voltage (cut-off voltage) 10.10, 10.37, and 10.39 V each. Afterwards, the discharge resistance is disconnected. The discharge resistance equaled Rdisch = [0.96–1] Ω, [1.42–1.50] Ω, and [2.69–3] Ω, with the ambient temperature T = 26.7°, 28.6°, and 26.1 °C.
-
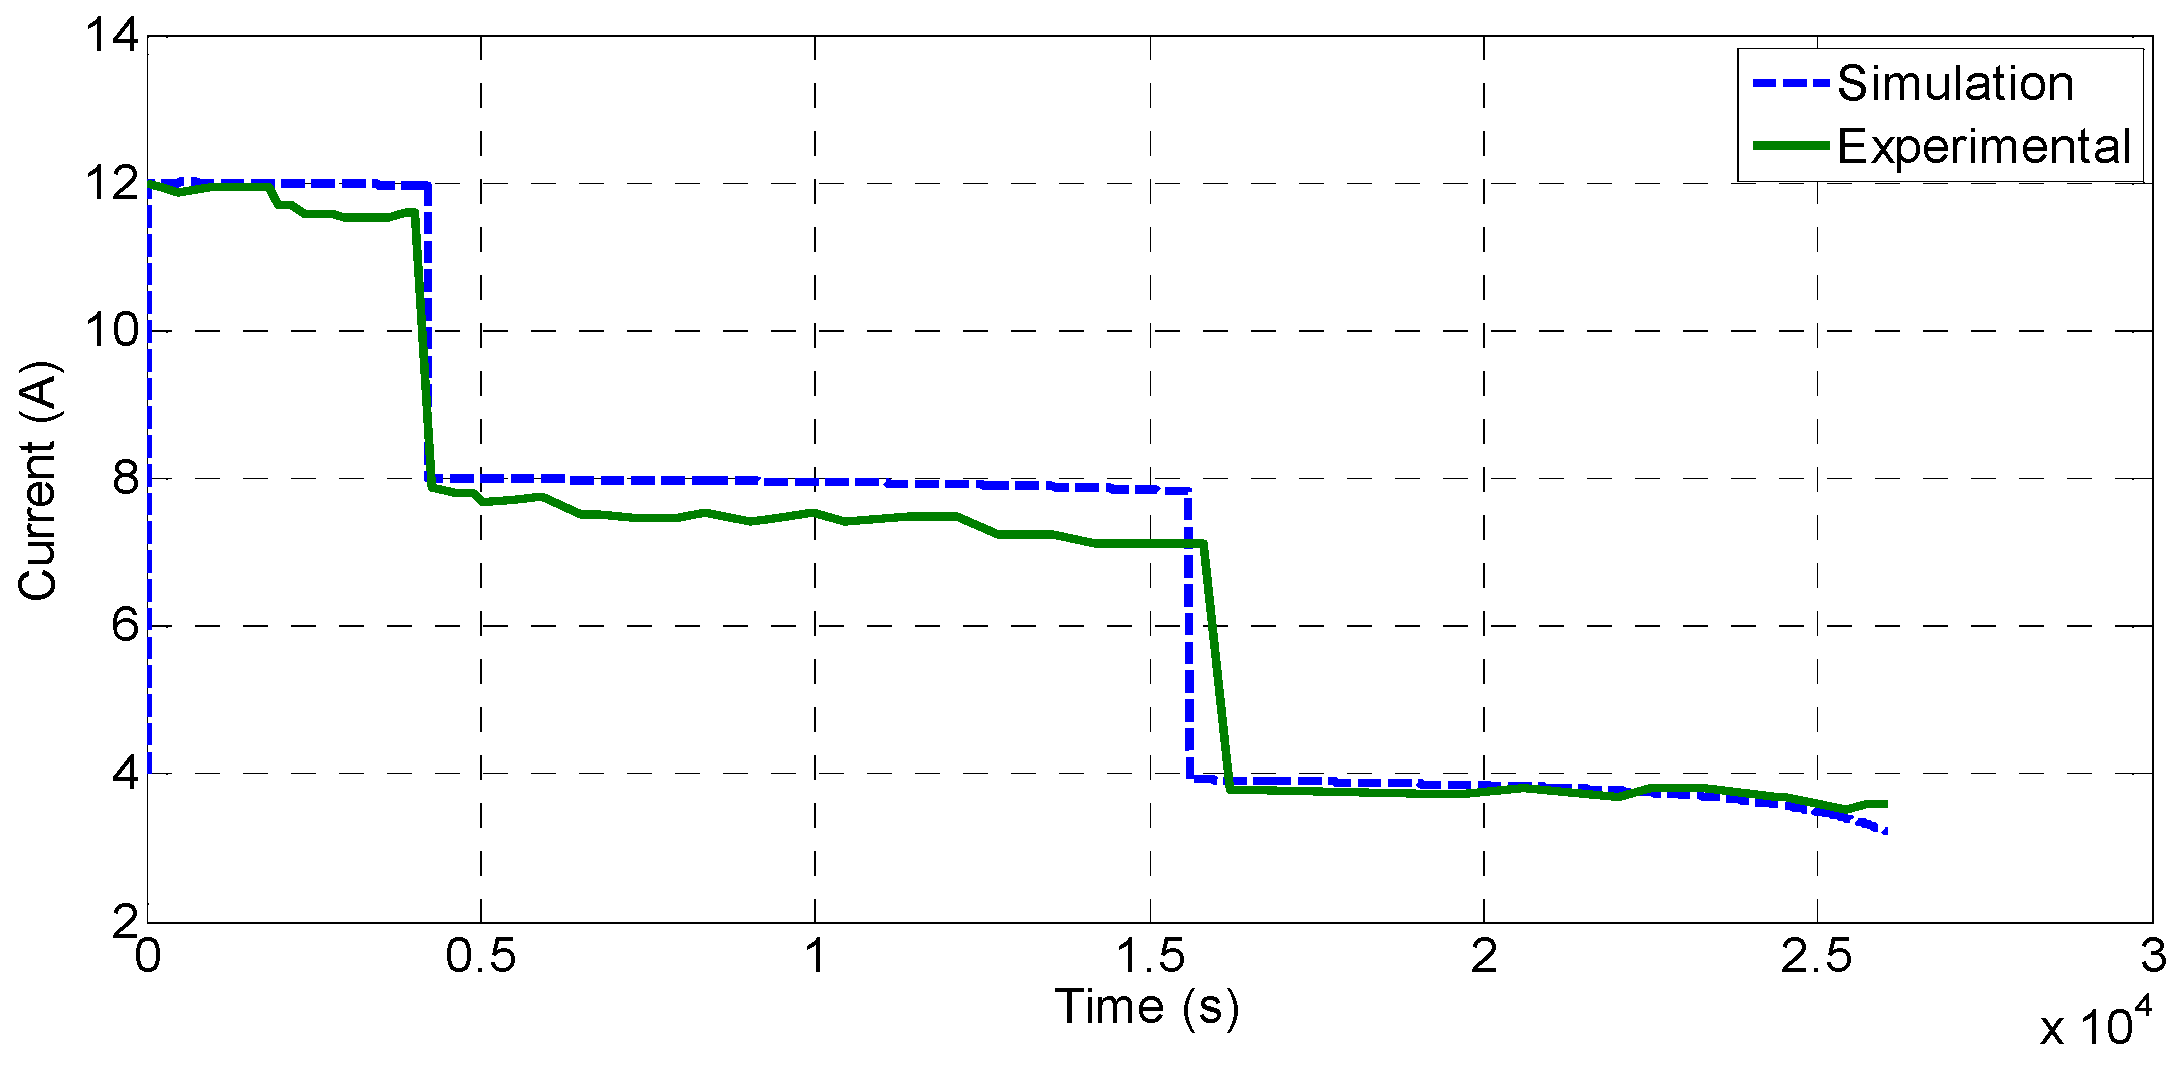
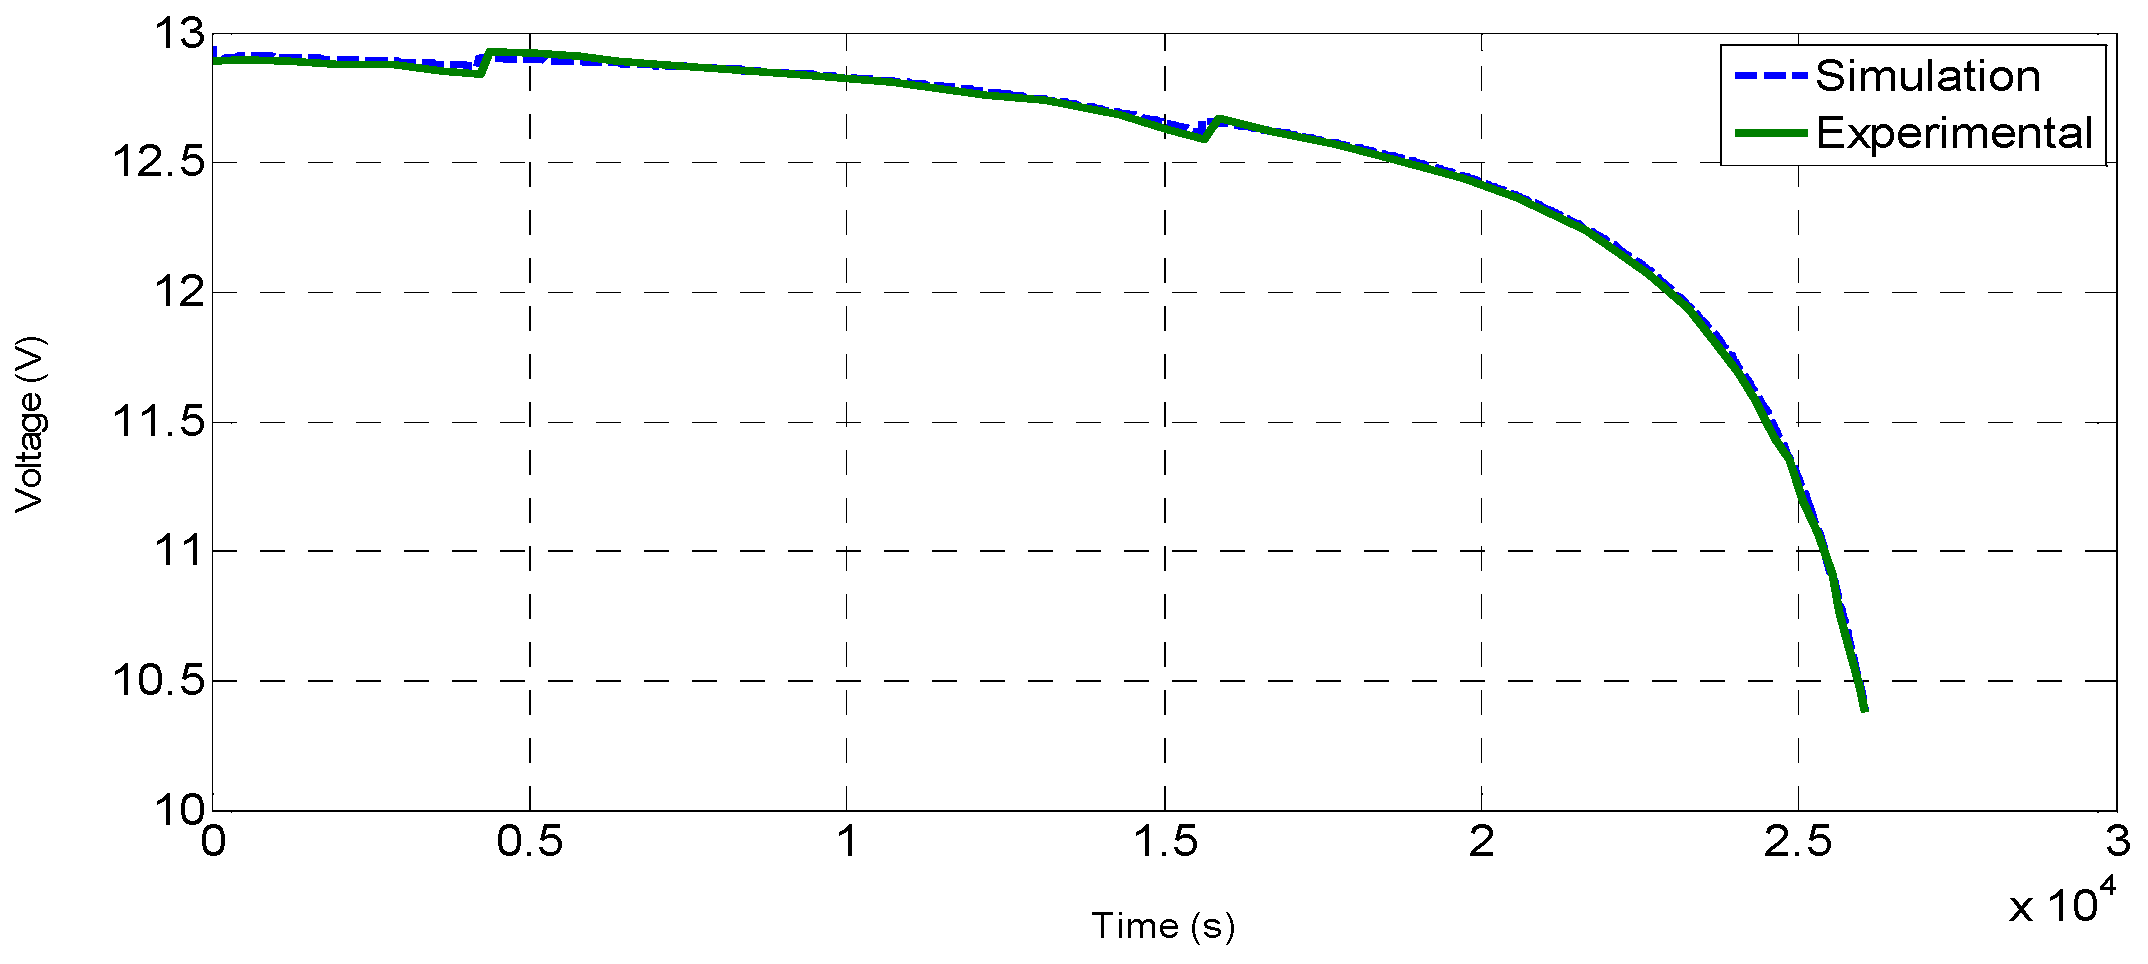
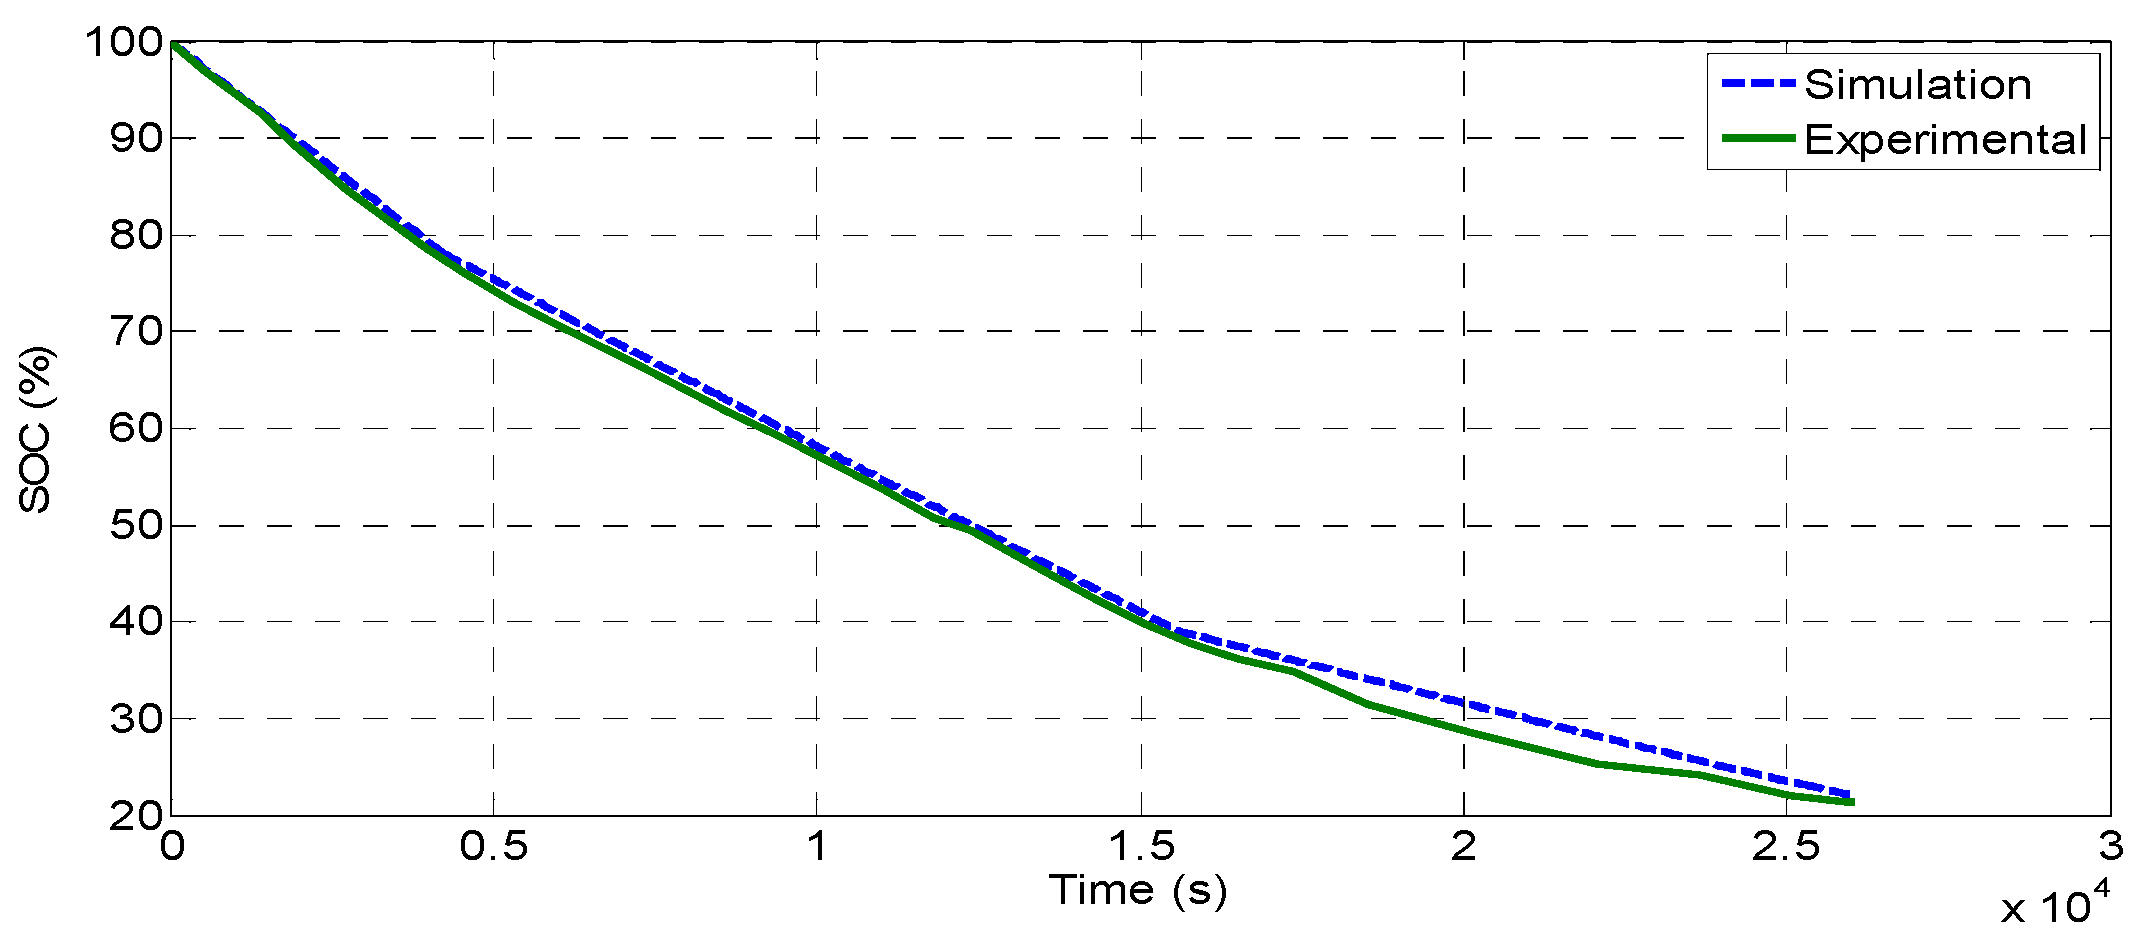
Discharging with variable C-rates: the variable resistor is connected (for adjustment to variable C-rates discharge current 0.23 C, 0.115 C, and 0.057 C, respectively. These values of C-rates correspond to having three resistances connected in parallel. The value of each resistance is 3.225 Ω. During the first period, the discharge is performed at 0.23 C until 1.11 h. After that, the first resistance is disconnected, then the discharge continues at 0.115 C until 4.44 h. At this point, the second resistance is also disconnected. The discharge is pursued then with 0.057 C until 7.23 h, and at this moment, even the last resistance is disconnected, and the experiment is stopped. The battery voltage and discharging current are measured every 5 min with a clamp meter during the whole experimental session. After 7.23 h, the end of discharge is reached (cut-off voltage) which is equal to 10.39 V. At this point, the discharge resistance is completely disconnected. It is also worth mentioning that the ambient temperature equaled T = 27.1 °C (approx.) during the experimental session.

6. Results and Discussion

As depicted in Figure 6: the discharge voltage at 0.25 C, 0.17 C, and 0.09 C decreases to 10.10 V, 10.37 V, and 10.39 V, respectively, during 3.05, 5.41, and 10.25 h. These values are called the cut-off voltages, i.e., when the battery discharge voltage has reached the lowest permissible value. At this point, the battery is disconnected to avoid permanent damage. The 10.10 V, 10.37 V, and 10.39 V values are not indicative of the total discharge (SOC = 0%) but correspond to the minimum SOC value in the vicinity of 20%, also known as depth of discharge (DoD) [49].
It can be observed that the experimental discharge curve is very close to the simulated one, except for the sensor’s noise and deviation in the collected points. This difference shows that battery power varies according to the operating conditions and user parameters (charging mode, ambient temperature, discharge current, etc.). It should be noted that the manufacturer-provided data normally correspond to ideal conditions (T = 25 °C, Idisch = 13 A, 8.84 A, and 4.68 A, respectively) and the battery’s aging status (SOH = 100%). which means a new battery. So, during the experiments, it is found that the 03 sets (datasheet, simulated, and experimental) are close, this indicates that the battery model used shows a very high precision in the discharge phase of the battery.
Figure 7 depicts the results corresponding to estimated SOC evolution with discharging at fixed C rates. It can be observed that the battery is initially fully charged (SOC0 = 100%) and that the battery charging status decreases to a minimum value (SOCmin = 20%) after 3.05, 5.41, and 10.25 h, respectively. This value must not exceed to prevent the battery from being permanently damaged, as depicted in [50] for the application of hybrid electric vehicles. The straight line is the SOC curve calculated by the Coulomb counting estimator, i.e., the battery is discharged at a constant discharge current (Idisch = 13 A, 8.84 A, and 4.68 A, respectively). This approach facilitates the battery’s SOC evolution over the entire discharge cycle (3.05 h, 5.41 h, and 10.25 h, respectively).
All the tests evidently reflect that the experimental SOC and the simulated ones are very close. This shows that this technique is very accurate and useful thanks to its simplicity of implementation and calculations. Additionally, it is easy to implement, since it only exploits the data received from current and voltage sensors.
Figure 8 exhibits the result of battery discharge at variable C rates using a handmade variable resistor (three equal resistors connected in parallel), where the total equivalent resistor equals Req1 = 1.075 ohms. At the beginning, all resistors are connected and a discharging rate of 0.23 C is applied from [0 to 1.11 h]. Then, one resistance is disconnected from the total equivalent resistors to obtain Req2 = 2.15 ohms, corresponding to a discharge rate of 0.115 C from [1.11 to 4.44 h]. Finally, a second resistance is disconnected, which means that only one resistance is kept connected, with a value of 3.225 ohms, corresponding to a discharging rate of 0.057 C from [4.44 to 7.23 h].
Therefore, it is noticed that the current is constant during each C-rates of the discharging range. This is a safe and effective method. Where the minimum value of discharging current is 2.90 A, which corresponds to a cutting voltage of 10.39 V.
Figure 9 illustrates that with the applied variable C-rates, the discharge voltage decreases to 10.39 V over the period of 7.23 h. From the presented curve, it can be noticed that the three ranges express the discharging process with the different C-rates: 0.23 C, 0.115 C, and 0.057 C, respectively. The two curves (simulated and experimental) are almost identical, exhibiting that the generic battery presents the real behavior of the battery pack during the discharging process with very high precision.
The evolution of estimated SOC under the influence of variable C rates is depicted in Figure 10. It can be observed that the battery is initially fully charged (SOC0 = 100%) and the battery charging status decreases after 7.23 h to its minimum threshold (SOC = 20%), corresponding to the recommended value of the lead–acid battery (SOCmin = 20%). Again, this value must not exceed to prevent the battery from being permanently damaged. Furthermore, the theoretical estimation matches the experimental findings.
The SOC curve calculated by the Coulomb counting estimator is nearly a straight line (in their specific regions), i.e., the discharging test is performed individually under variable discharge currents for sustained periods (Idisch = 12 A, 6 A then 3 A, respectively). It can be observed that the SOCexperimental and SOCsimulated are almost the same, which shows that this technique is accurate and useful.
Finally, Figure 11 exhibits the two curves (datasheets and simulation), depicting that the initial value of the battery charge current is equal to 5.5 A and 5.03 A. It can be noticed that the charging current stays constant for 3.50 h at a value of 5.5 A in datasheet/simulations, while 5.03 A in the experimental curve. Then the value decreases until 0.29 A in all the cases whether experimental or simulations. One can distinguish two areas on the curve where the first is from [0 to 3.20] h in the experimental curve and from [0 to 3.50] h in the simulation and datasheet curves. These curves are the representation of the charging process via constant current (CC) and by a constant voltage (CV). The only difference between the three curves (datasheet, simulation, and experimental) is in the zone of charge by a constant current and exactly in the initial value given, wherein the experimental test, it is set to a value of 5.03 A only (which is the maximum available power supply value). In contrast, the value of the datasheet and simulation is 5.5 A.
Figure 12 indicates the fact that the battery voltage at the start of this test is set to 11.6 V in the three curves (experimental, datasheets, and simulations). Moreover, the initial charge condition is SOC0 = 20% [44]. It can be observed that the charge voltage rises rapidly up to 14.7 V and stabilizes at this value, i.e., two curve areas are distinguished where the first is from [0 to 3] h in the experimental/datasheet curve, and from [0 to 2.5] h in the simulated curve, intended for the constant current (CC) charging mode [45]. The second distinguishable area is from [3 to 20] h intended for the charging mode using a constant voltage (CV) mode.
The only difference between the three curves (experimental, datasheet, and simulated) is in the zone of charge by a constant current (the duration of this phase is different as in the datasheet/experimental is 3 h and in simulations is 2.5 h). This is because the simulation parameters in the discharge phase are the same as for the charging phase. After all, the charging phase is dependent on numerous factors such as charging mode, initial SoC, ambient temperature, and mode of charging. This leads to a charge period of 24 h when the end-of-charge current is equal to 0.29 A to prevent overcharging the battery by turning off the DC power supply.
In Figure 13, the SOC0 equals 20% at time t = 0 and increases with the relation of charging up to 100%, i.e., the battery is fully charged.
There are two parts in the curve, from [0 to 3.5] h is the first portion, which corresponds to the constant current charging mode. It has almost a linear shape. This part is characterized by the rapid variation of the SOC as a time-dependent variable for instance at 3.5 h SOC (experimental) = 85%, SOC (datasheet) = 83% and SOC (simulation) = 80%. The second part is in the form of a nonlinear curve line. It corresponds to the charging mode at a constant voltage; it is characterized by the slow variation of the SOC. For example, during [3.5–24] h, the SOC (experimental) increases by 15%, SOC (datasheet) increases by 17%, and SOC (simulation) increased by 20%.
Hence, it can be said that the battery charge capacity is dependent on the charging mode, it is faster in CC mode and slower in CV mode, which is why the new charger is faster to gain more time, especially in the lead–acid batteries.
From Figure 13, the Coulomb counter approach provides a fair depiction of SOC during the entire charge; as a result, one can say that this method is independent of the battery’s model and technology.

7. Conclusions and Perspectives

This study presents a Coulomb counting technique-based battery state-of-charge estimator with constant and variable discharging current profiles for a real battery pack in a real-time environment. The following conclusions are drawn from this study:
In the charging mode, the battery model used in the MATLAB Simulink is less efficient. Regardless, it is widely used and has excellent battery economy when discharged at a constant current. That is the reason why it is also included for the sake of comparison.
The only short-coming of the Coulomb counting method is the difficulty of estimating the initial SOC. High-precision estimation sensors (for voltage and current) are also needed, so these instruments need to be periodically modified.
Lead–acid batteries are only suitable for short-range vehicles. They remain the cheapest form of battery and are likely to be used for these purposes. A lot of useful and small-scale EVs that do not require a long-range can be made via lead–acid batteries.
Most commercial-scale EVs require an extended traveling range; therefore, modern Li-ion batteries can serve the purpose. The proposed SOC estimator is expected to provide quick and reliable information, which can be then integrated into energy management.
It is concluded that constant current discharge is quicker, which is the approach used for fast charging, and it is shown in this work that the efficiency of the generic battery model is competitive, as its findings are close to experimental work. The Coulomb counter approach is useful for estimating the battery SOC; also, in this case, the discharge with variable discharge currents is always correct.
By using simple calculations and hardware requirements, the proposed method can therefore be systematically implemented in any portable devices as well as electric cars. In this research, the ampere-hour integral method is validated experimentally via a domestic lead–acid battery. It is worth mentioning here that the proposed method is generic in its implementation. Given that, the implementation and application of modern Li-ion batteries are reserved for future studies.

Author Contributions

Conceptualization, results analysis, managerial insights, and methodology are performed by B.Z.; H.B. was involved in writing original draft preparation. Formal analysis and investigations were performed by A.B.; M.B. was involved in writing the reviews and managing the references. Finally, M.I. performed language correction and general organization. All authors have read and agreed to the published version of the manuscript.

Funding

This work was not funded by any organization and/or society in any capacity.

Conflicts of Interest

The authors have no conflict of interest to declare that are relevant to the content of this article.

Abbreviations

SOCState of charge
AhAmpere hour
OCVOpen circuit voltage
ACAlternative current
SOHState of health
CCConstant current
CVConstant voltage
CNNominal capacity of the battery
ƞ Coulomb efficiency
I(τ)The current versus time (negative during charge and positive during discharge)
VbattThe battery voltage (V)
E0The constant battery voltage (V)
KThe polarization constant (V/(Ah)) or polarization resistance (Ω)
QThe battery capacity (Ah)
i t =∫Idt: actual battery charge (Ah)
AThe exponential voltage (V)
BThe exponential capacity (Ah) − 1
RThe internal resistance (Ω)
IThe battery current (A)
i*The filtered current (A)
IdisThe value of the current of discharge
SOC0Initial state of charge
SOCminMinimum state of charge
SOCexpExperimental state of charge
SOCthTheoretical state of charge
VchintInitial charge voltage
VchendEnd charge voltage
TchsumSimulation charge time
VdisintInitial discharge voltage
VdisendEnd discharge voltage
TdissumSimulation discharge time
VRLAValve regulated lead–acid battery
BMSBattery management system
VCUVehicle control unit
SOPState of power
RULRemaining useful life
DODDepth of discharge

References

  1. Yang, R.; Xiong, R.; He, H.; Chen, Z. A fractional-order model-based battery external short circuit fault diagnosis approach for all-climate electric vehicles application. J. Clean. Prod. 2018, 187, 950–959. [Google Scholar] [CrossRef]
  2. Rodrigues, S.; Munichandraiah, N.; Shukla, A. A review of state-of-charge indication of batteries by means of a.c. impedance measurements. J. Power Sources 2000, 87, 12–20. [Google Scholar] [CrossRef]
  3. Huet, F. A review of impedance measurements for determination of the state-of-charge or state-of-health of secondary batteries. J. Power Sources 1998, 70, 59–69. [Google Scholar] [CrossRef]
  4. Weng, C.; Sun, J.; Peng, H. A unified open-circuit-voltage model of lithium-ion batteries for state-of-charge estimation and state-of-health monitoring. J. Power Sources 2014, 258, 228–237. [Google Scholar] [CrossRef]
  5. Dubarry, M.; Svoboda, V.; Hwu, R.; Liaw, B.Y. Capacity loss in rechargeable lithium cells during cycle life testing: The importance of determining state-of-charge. J. Power Sources 2007, 174, 1121–1125. [Google Scholar] [CrossRef]
  6. Schmidt, J.P.; Chrobak, T.; Ender, M.; Illig, J.; Klotz, D.; Ivers-Tiffée, E. Studies on LiFePO4 as cathode material using impedance spectroscopy. J. Power Sources 2011, 196, 5349–5355. [Google Scholar] [CrossRef]
  7. He, H.; Xiong, R.; Guo, H. Online estimation of model parameters and state-of-charge of LiFePO4 batteries in electric vehicles. Appl. Energy 2012, 89, 413–420. [Google Scholar] [CrossRef]
  8. Zhang, Y.; Song, W.; Lin, S.; Feng, Z. A novel model of the initial state of charge estimation for LiFePO4 batteries. J. Power Sources 2014, 248, 1028–1033. [Google Scholar] [CrossRef]
  9. Wang, J.; Cao, B.; Chen, Q.; Wang, F. Combined state of charge estimator for electric vehicle battery pack. Control Eng. Pract. 2007, 15, 1569–1576. [Google Scholar] [CrossRef]
  10. Becherif, M.; Pera, M.; Hissel, D.; Jemei, S. Estimation of the lead-acid battery initial state of charge with experimental validation. In Proceedings of the 2012 IEEE Vehicle Power and Propulsion Conference, Seoul, Korea, 9–12 October 2012; pp. 469–473. [Google Scholar]
  11. Ng, K.S.; Moo, C.-S.; Chen, Y.-P.; Hsieh, Y.-C. Enhanced coulomb counting method for estimating state-of-charge and state-of-health of lithium-ion batteries. Appl. Energy 2009, 86, 1506–1511. [Google Scholar] [CrossRef]
  12. Chan, C.; Lo, E.; Weixiang, S. The available capacity computation model based on artificial neural network for lead–acid batteries in electric vehicles. J. Power Sources 2000, 87, 201–204. [Google Scholar] [CrossRef]
  13. Gu, W.B.; Wang, C.Y. Thermal-Electrochemical Modeling of Battery Systems. J. Electrochem. Soc. 2000, 147, 2910–2922. [Google Scholar] [CrossRef]
  14. Zhang, Y.; Xiong, R.; He, H.; Shen, W. Lithium-Ion Battery Pack State of Charge and State of Energy Estimation Algorithms Using a Hardware-in-the-Loop Validation. IEEE Trans. Power Electron. 2016, 32, 4421–4431. [Google Scholar] [CrossRef]
  15. Xiong, R.; He, H.; Sun, F.; Zhao, K. Evaluation on State of Charge Estimation of Batteries With Adaptive Extended Kalman Filter by Experiment Approach. IEEE Trans. Veh. Technol. 2012, 62, 108–117. [Google Scholar] [CrossRef]
  16. Plett, G.L. Extended Kalman filtering for battery management systems of LiPB-based HEV battery packs Part 2. Modeling and identification. J. Power Sources 2004, 134, 262–276. [Google Scholar] [CrossRef]
  17. Cuadras, A.; Kanoun, O. Soc li-ion battery monitoring with impedance spectroscopy. In Proceedings of the 2009 6th International Multi-Conference on Systems, Signals and Devices, SSD, Djerba, Taiwan, 23–26 March 2009. [Google Scholar]
  18. Chau, K.; Wu, K.; Chan, C. A new battery capacity indicator for lithium-ion battery powered electric vehicles using adaptive neuro-fuzzy inference system. Energy Convers. Manag. 2004, 45, 1681–1692. [Google Scholar] [CrossRef]
  19. Wang, Z.; Xu, J.; Wang, T. The online monitoring system software design and the SOC estimation algorithm research for power battery. In Proceedings of the 2013 IEEE International Conference on Vehicular Electronics and Safety, ICVES 2013, Dongguan, China, 28–30 July 2013; pp. 89–92. [Google Scholar]
  20. Lv, J.; Yuan, H.; Lv, Y. Battery state-of-charge estimation based on fuzzy neural network and improved particle swarm optimization algorithm. In Proceedings of the 2012 2nd International Conference on Instrumentation and Measurement, Computer, Communication and Control, Washington, DC, USA, 8–10 December 2012; pp. 22–27. [Google Scholar]
  21. Chemali, E.; Kollmeyer, P.J.; Preindl, M.; Ahmed, R.; Emadi, A.; Kollmeyer, P. Long Short-Term Memory Networks for Accurate State-of-Charge Estimation of Li-ion Batteries. IEEE Trans. Ind. Electron. 2018, 65, 6730–6739. [Google Scholar] [CrossRef]
  22. He, W.; Williard, N.; Chen, C.; Pecht, M. State of charge estimation for Li-ion batteries using neural network modeling and unscented Kalman filter-based error cancellation. Int. J. Electr. Power Energy Syst. 2014, 62, 783–791. [Google Scholar] [CrossRef]
  23. Kang, L.; Zhao, X.; Ma, J. A new neural network model for the state-of-charge estimation in the battery degradation process. Appl. Energy 2014, 121, 20–27. [Google Scholar] [CrossRef]
  24. Junping, W.; Quanshi, C.; Binggang, C. Support vector machine based battery model for electric vehicles. Energy Convers. Manag. 2006, 47, 858–864. [Google Scholar] [CrossRef]
  25. Li, I.-H.; Wang, W.-Y.; Su, S.-F.; Lee, Y.-S. A Merged Fuzzy Neural Network and Its Applications in Battery State-of-Charge Estimation. IEEE Trans. Energy Convers. 2007, 22, 697–708. [Google Scholar] [CrossRef]
  26. Xiong, R.; Shen, W. Advanced Battery Management Technologies for Electric Vehicles; John Wiley & Sons: Hoboken, NJ, USA, 2019; pp. 1–297. [Google Scholar]
  27. Yang, K.; Chen, Z.; He, Z.; Wang, Y.; Zhou, Z. Online estimation of state of health for the airborne Li-ion battery using adaptive DEKF-based fuzzy inference system. Soft Comput. 2020, 24, 18661–18670. [Google Scholar] [CrossRef]
  28. Lami, M.; Shamayleh, A.; Mukhopadhyay, S. Minimizing the state of health degradation of Li-ion batteries onboard low earth orbit satellites. Soft Comput. 2019, 24, 4131–4147. [Google Scholar] [CrossRef]
  29. Modi, S.; Bhattacharya, J.; Basak, P. Convolutional neural network–bagged decision tree: A hybrid approach to reduce electric vehicle’s driver’s range anxiety by estimating energy consumption in real-time. Soft Comput. 2020, 25, 2399–2416. [Google Scholar] [CrossRef]
  30. Iqbal, M.; Becherif, M.; Ramadan, H.S.; Badji, A. Dual-layer approach for systematic sizing and online energy management of fuel cell hybrid vehicles. Appl. Energy 2021, 300, 117345. [Google Scholar] [CrossRef]
  31. Kularatna, N. Dynamics, Models, and Management of Rechargeable Batteries; Academic Press: Cambridge, MA, USA, 2015. [Google Scholar]
  32. Iqbal, M.; Laurent, J.; Benmouna, A.; Becherif, M.; Ramadan, H.S.; Claude, F. Ageing-aware load following control for composite-cost optimal energy management of fuel cell hybrid electric vehicle. Energy 2022, 254, 124233. [Google Scholar] [CrossRef]
  33. Salazar, D.; Garcia, M. Estimation and Comparison of SOC in Batteries Used in Electromobility Using the Thevenin Model and Coulomb Ampere Counting. Energies 2022, 15, 7204. [Google Scholar] [CrossRef]
  34. González, I.; Ramiro, A.; Calderón, M.; Calderón, A.; González, J. Estimation of the state-of-charge of gel lead-acid batteries and application to the control of a stand-alone wind-solar test-bed with hydrogen support. Int. J. Hydrogen Energy 2012, 37, 11090–11103. [Google Scholar] [CrossRef]
  35. Lin, C.; Mu, H.; Xiong, R.; Shen, W. A novel multi-model probability battery state of charge estimation approach for electric vehicles using H-infinity algorithm. Appl. Energy 2016, 166, 76–83. [Google Scholar] [CrossRef]
  36. Wu, G.; Lu, R.; Zhu, C.; Chan, C. An improved Ampere-hour method for battery state of charge estimation based on temperature, coulomb efficiency model and capacity loss model. In Proceedings of the 2010 IEEE Vehicle Power and Propulsion Conference, Lille, France, 1–3 September 2010; pp. 1–4. [Google Scholar]
  37. Xiong, R.; Sun, F.; Chen, Z.; He, H. A data-driven multi-scale extended Kalman filtering based parameter and state estimation approach of lithium-ion polymer battery in electric vehicles. Appl. Energy 2014, 113, 463–476. [Google Scholar] [CrossRef]
  38. Telmoudi, A.J.; Soltani, M.; Ben Belgacem, Y.; Chaari, A. Modeling and state of health estimation of nickel–metal hydride battery using an EPSO-based fuzzy c-regression model. Soft Comput. 2019, 24, 7265–7279. [Google Scholar] [CrossRef]
  39. Sun, F.; Xiong, R.; He, H. Estimation of state-of-charge and state-of-power capability of lithium-ion battery considering varying health conditions. J. Power Sources 2014, 259, 166–176. [Google Scholar] [CrossRef]
  40. Zhang, Y.Z.; Xiong, R.; He, H.W.; Pecht, M. Validation and verification of a hybrid method for remaining useful life prediction of lithium-ion batteries. J. Clean. Prod. 2019, 212, 240–249. [Google Scholar] [CrossRef]
  41. Mohammed, N.; Saif, A.M. Programmable logic controller based lithium-ion battery management system for accurate state of charge estimation. Comput. Electr. Eng. 2021, 93, 107306. [Google Scholar] [CrossRef]
  42. Feng, F.; Lu, R.; Zhu, C. A Combined State of Charge Estimation Method for Lithium-Ion Batteries Used in a Wide Ambient Temperature Range. Energies 2014, 7, 3004–3032. [Google Scholar] [CrossRef] [Green Version]
  43. Zhang, S.; Guo, X.; Dou, X.; Zhang, X. A data-driven coulomb counting method for state of charge calibration and estimation of lithium-ion battery. Sustain. Energy Technol. Assessments 2020, 40, 100752. [Google Scholar] [CrossRef]
  44. Gismero, A.; Schaltz, E.; Stroe, D.-I. Recursive State of Charge and State of Health Estimation Method for Lithium-Ion Batteries Based on Coulomb Counting and Open Circuit Voltage. Energies 2020, 13, 1811. [Google Scholar] [CrossRef] [Green Version]
  45. Hinz, H. Comparison of Lithium-Ion Battery Models for Simulating Storage Systems in Distributed Power Generation. Inventions 2019, 4, 41. [Google Scholar] [CrossRef] [Green Version]
  46. Tremblay, O.; Dessaint, L.-A.; Dekkiche, A.-I. A Generic Battery Model for the Dynamic Simulation of Hybrid Electric Vehicles. In Proceedings of the IEEE Vehicle Power and Propulsion Conference, Arlington, TX, USA, 9–12 September 2007; pp. 284–289. [Google Scholar]
  47. Zine, B.; Marouani, K.; Becherif, M.; Yahmedi, S. Estimation of Battery Soc for Hybrid Electric Vehicle using Coulomb Counting Method. Int. J. Emerg. Electr. Power Syst. 2018, 19. [Google Scholar] [CrossRef]
  48. Baroody, R. UNLV Theses, Dissertations, Professional Papers, and Capstones; UNLV: Las Vegas, NV, USA, 2009. [Google Scholar]
  49. Ren, G.; Wang, H.; Chen, C.; Wang, J. An energy conservation and environmental improvement solution-ultra-capacitor/battery hybrid power source for vehicular applications. Sustain. Energy Technol. Assess. 2021, 44, 100998. [Google Scholar] [CrossRef]
  50. Coleman, M.; Lee, C.K.; Zhu, C.; Hurley, W.G. State-of-charge determination from EMF voltage estimation: Using impedance, terminal voltage, and current for lead-acid and lithium-ion batteries. IEEE Trans. Ind. Electron. 2007, 54, 2550–2557. [Google Scholar] [CrossRef]
Figure 1. Classification of SOC estimation methods [26].
Energies 15 08172 g001
Figure 2. Schematic diagram of a typical BMS [26].
Energies 15 08172 g002
Figure 3. Graphical description of the employed battery model.
Energies 15 08172 g003
Figure 4. Hysteresis effect associated with the lead–acid battery.
Energies 15 08172 g004
Figure 5. The test bench.
Energies 15 08172 g005
Figure 6. The discharge voltage vs. time at 0.25/0.17 and 0.09 C.
Energies 15 08172 g006
Figure 7. The SOC as a function of time at fixed C rates.
Energies 15 08172 g007
Figure 8. The discharge current as a function of time at variable C-rates.
Energies 15 08172 g008
Figure 9. The discharge voltage as a function of time at variable C-rates.
Energies 15 08172 g009
Figure 10. The SOC as a function of time at variable C rates.
Energies 15 08172 g010
Figure 11. The charging current as the function of time.
Energies 15 08172 g011
Figure 12. Charging voltage as the function of time.
Energies 15 08172 g012
Figure 13. The SOC as function of time.
Energies 15 08172 g013
Table 1. SOC estimation methods: benefits, drawbacks, accuracy, and robustness. Reprinted from Refs. [35,36].
MethodologyBenefitsDrawbacksPrecisionSturdiness
Method based on characteristic param
-
simpler implementation
-
lower computing burden
-
Real-time application
-
easily influenced by factors of uncertainty
-
standard OCV or information calibration is required
poorgood
Ampere-hour integral approach
-
simpler implementation
-
lower computational burden
-
Real-time application
-
exact initial value of SOC is required
-
use of a high precision sensor causes a cumulative error.
-
is affected by drift noise and ageing.
averagepoor
Model-driven estimation approach
-
high precision
-
closed loop regulation
-
Real-time application
-
Adaptive
-
requires model precision
-
computational complexity
-
divergence of predicted outcomes
excellentexcellent
Method of data-driven estimation
-
high precision
-
Suitable for nonlinear implementation
-
computational complexity
-
offline training
excellentpoor
Table 2. Battery parameters: discharge at variable C-rate.
C-Rates of Discharge0.25 C0.17 C0.09 CDifferent C-Rates
Nominal voltage (V)12121212
Rated capacity (Ah)52525252
Initial state-of-charge (%)100100100100
Max. capacity (Ah)40.199953.847.547.5
Fully charged voltage (V)12.712.812.912.9
Nominal discharge current (A)138.844.6812
Internal resistance (Ω)0.00550.00550.00550.0055
Capacity (Ah) @ nominal voltage38.244.804646
Exp. zone [Voltage(V), capacity(Ah)][12.7, 2.5][12.8, 1.9][12.9, 2.225][12.9, 2.225]
Table 3. Lead–acid battery parameters.
Cells per unit6
Voltage per unit12 V
Capacity 52 Ah @ 20 h-rate to 1.75 V per cell @25 °C (77 °F)
WeightApprox. 18 Kg (39.68 lbs.)
Maximum discharge current500 A (5 s)
Internal resistanceApprox. 5.5 mΩ
Operating temperature rangeDischarge: −15 °C~50 °C (5 °F~122 °F)
Charge: −15 °C~40 °C (5 °F~104 °F)
Storage: −15 °C~40 °C (5 °F~104 °F)
Float charging voltage13.5 to 13.8 VDC/unit Average at 25 °C (77 °F)
Maximum charging current limit15.6 A
Equalization and cycle service14.4 to 15.0 VDC/unit Average at 25 °C (77 °F)
Self dischargeBatteries can be stored for 6 months at 25 °C (77 °F).
Publisher’s Note: MDPI stays neutral with regard to jurisdictional claims in published maps and institutional affiliations.

