Abstract
This study quantitively estimates the energy and environmental impacts of China’s promotion of battery electric vehicles (BEVs) in the context of banning the sale of gasoline vehicles (GVs). Combining the population ecological growth model and the life cycle assessment method, the potential of BEVs promotion in reducing fossil energy (FE) consumption and greenhouse gas (GHG) emissions under different timings of banning GV sales was dynamically simulated and analyzed. The results show that the current life cycle FE consumption and GHG emissions of BEVs are approximately 40.1% and 26.6% lower than those of GVs, respectively. Based on the development of automobile technology and the national energy plan, replacing GVs with BEVs can reduce GHG emissions and FE consumption by up to 43.61–55.81% and 46.33–55.45%, respectively. Compared with the scenario without BEV promotion, if sales of GVs in China are banned between 2040 and 2060, the point at which the carbon peak of the automobile market will be reached will be advanced by approximately two years, and the corresponding carbon peak value will be reduced by approximately 13.58–28.79 million tons of CO2-eq (MtCO2e). In addition, the annual FE savings and GHG emission reductions will reach approximately 2.99–6.35 million TJ and 276.54–488.77 MtCO2e by 2050. This research work will not only help authorities, managers, and the public to better understand the environmental and energy impacts of promoting new energy vehicles, but also provide a forward-looking reference for formulating comprehensive, systematic, and reasonable industrial planning to better promote a green and sustainable transformation of the automotive sector and solve the relevant energy and environmental problems.
1. Introduction
A global consensus has been reached on speeding up the green and sustainable transformation of the transportation sector to alleviate the increasingly severe energy and environmental issues [1,2,3,4]. As a promising way to reduce FE consumption and GHG emissions, the promotion of new energy vehicles (NEVs) has become an irreversible global trend [5,6,7]. Countries and regions around the world are committing to developing electric vehicles and vehicles powered by other alternative fuels (e.g., compressed natural gas, liquified natural gas, hydrogen, methanol, methane, dimethyl ether, and bioethanol) [8,9,10,11,12].
The development of the NEVs industry is of great significance to China’s energy security and the structural adjustment of the automobile industry. Currently, China is the world’s second-largest oil consumer [13,14] and the largest oil importer [15,16]. In 2021, China’s net oil import was 513 million tons, and the corresponding oil import dependence was approximately 72.05% [17]. Huge oil consumption and a high degree of dependence on oil imports seriously threaten China’s national energy security. Since approximately half of China’s oil consumption is attributed to the use of automobiles, the development of NEVs is an important way to alleviate China’s energy problems.
At this critical moment in addressing the challenges of global climate change, the Chinese government has set a “dual carbon” goal of reaching a carbon peak by 2030 and becoming carbon neutral by 2060 [18,19]. Currently, GHG emissions from the transportation sector account for approximately 15% of China’s total GHG emissions, making it the third largest source of GHG emissions after industry and construction [20,21]. In the transportation sector, carbon emissions from automobiles account for approximately 75% [22]. Therefore, promoting the low-carbon development of the automobile industry is of great significance to achieving the goals of “carbon peak and carbon neutrality” [23,24].
Over the past decade, China has been pushing for the development of NEVs [25,26,27]. In 2021, China’s NEV sales reached 3.334 million, accounting for nearly half of the world’s total NEV sales [28]. More than 80% of the NEVs in China are BEVs [28]. From the perspective of market prospects and policy direction, BEVs will occupy a dominant position in China’s NEV market for the foreseeable future [29,30,31].
Currently, academic research in the field of NEVs mainly focuses on industrial theories and policies, development paths, consumer behavior, technological innovations in vehicles and fuels, and comparisons with conventional fossil fuel vehicles in terms of vehicle performance, energy consumption, and environmental impact [32,33,34,35,36]. In order to better solve the problems concerning energy conservation, emission reduction, and the battery health of electric vehicles, scholars have also conducted a series of in-depth studies on energy management strategies and have proposed a variety of optimal control methods [37,38,39]. In addition, research on the modeling, forecasting, and analysis of the production and sales of NEVs has also been widely carried out [40,41]. However, little effort has been devoted so far to discussing the long-term energy and environmental impacts of promoting NEVs. The market evolution of NEVs is closely related to the government’s overall industrial planning for NEVs, and its energy-saving and emission-reducing (ESER) potential also, in turn, depends on the energy structure and the technical level of vehicles and fuels.
Furthermore, the evolution of the NEVs industry is not isolated, but is rather a huge and complex system closely related to the national economy and people’s livelihoods. For example, the upstream of the automobile industry chain involves electronics, machinery, metallurgy, and the chemical industry, among others, and the downstream involves transportation, logistics, leasing, and other related services and consumption fields. Therefore, it is necessary to assess the energy and environmental impact of promoting NEVs from the perspective of a long-term time span, which is conducive to optimizing and improving the industrial planning and layout at the macro level.
In particular, due to increasing environmental pressure, many countries in the world have formulated a timetable for banning gasoline vehicle sales (BGVS) [42]. However, little is known about the impact of this policy on the dynamic growth trend of the NEV market, and the potential effects on energy and the environment are still unclear.
With this in mind, based on the development of vehicle technology and national energy planning, this study employs a population growth model and life cycle assessment (LCA) method to systematically and deeply analyze the impact of the promotion of BEVs on China’s FE consumption and GHG emissions. We attempt to answer the following two questions from the perspective of long-term dynamic development: what is the FE saving and GHG emission reduction potential of promoting BEVs, and how does the policy of BGVS contribute to the automobile industry’s carbon peak and carbon neutrality goals? This research work can not only help authorities, operators, and the public to better understand the environmental and energy impacts of promoting NEVs, but also provide a forward-looking reference for formulating more effective measures to promote the healthy and sustainable development of NEVs and solve the relevant energy and environmental problems.
2. Materials and Methods
This study aimed to quantitively estimate the ESER effect of China’s promotion of BEVs in the context of banning GV sales. First, the life cycle GHG emissions intensity (GHGEI) and FE consumption intensity (FECI) of BEV and GV were estimated and compared using the LCA method. Then, the changes in the market scale of BEVs and GVs under different BGVS scenarios were simulated by a population ecological growth model. Finally, combined with the FECI and GHGEI of BEV and GV, and the number of BEVs and GVs under different BGVS scenarios, the annual FE consumption and GHG emissions from China’s automobile market under different scenarios could be calculated. On this basis, the ESER effect of China’s promotion of BEVs in the context of banning GV sales is further analyzed and discussed.
2.1. LCA Method
The energy and environmental impact assessment for China’s BEV and GV industries in this study followed the standardized LCA framework and process provided by ISO [43,44]. The LCA modeling for BEV and GV was mainly based on the SimaPro 9.0 software and Ecoinvent 3.6 database. The system boundaries for LCA modeling are shown in Figure 1, which includes vehicle life cycle (VLC) and fuel life cycle (FLC). Considering that light-duty gasoline passenger cars account for 90% of China’s automobile market [31,45], they were selected as the research object in this study to analyze the ESER potential of replacing GVs with BEVs. Therefore, the analysis of FLC needs to consider both gasoline and electricity. For the VLC of BEV and GV, the main inventory data and processes are summarized in Appendix A, Appendix B and Appendix C.
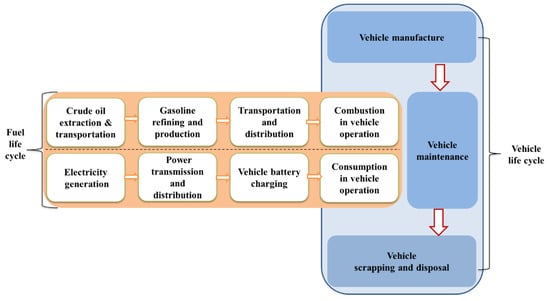
Figure 1.
System boundary of LCA modeling for BEVs and GVs.
2.2. The Calculation of the Life Cycle GHGEI and FECI of BEVs and GVs
In this study, the kilometer (km) is used as the functional unit for comparative analysis, and the corresponding measurement unit for the life cycle GHGEI and FECI of BEVs and GVs are g CO2-eq/km and MJ/km, as shown in Equations (1) and (2).
where i refers to the BEVs and GVs (i.e., vehicle type), FECI refers to the total life cycle (including FLC and VLC) FE consumption intensity of the vehicle, and GHGEI refers to the total life cycle (including FLC and VLC) GHG emissions intensity of the vehicle. FECVL and FECFL refer to the FE consumption from the VLC and FLC, respectively. GHGEVL and GHGEFL refer to the GHG emissions from the VLC and FLC, respectively. LVKT refers to the life cycle vehicle kilometers traveled (VKT). The average annual VKT and lifespan of Chinese passenger cars are approximately 150,00 km and 10 years [46], respectively, which means that the average LVKT for GVs and BEVs in China is approximately 150,000 km.
The FECVL and GHGEVL can be obtained by the LCA modeling of the VLC, and the FECFL and GHGEFL can be calculated by Equations (3) and (4).
where i refers to the BEVs and GVs (i.e., vehicle type), and j refers to the gasoline and electricity (i.e., fuel type). FEV represents the fuel economy of the GVs and BEVs (i.e., L/100 km for gasoline-powered vehicles and kWh/100 km for electricity-powered vehicles). The FECIF and GHGEIF refer to the FE consumption and GHG emission intensity of the FLC for the automotive fuel (i.e., gasoline and electricity). For gasoline in China, the FECIF and GHGEIF are set to 1.268 MJ/MJ and 2.964 kg CO2-eq/L, respectively [47]. For electricity, the FECIF and GHGEIF are obtained by Equations (5) and (6), respectively.
where GHGEIFP and FECIFP refer to the GHG emissions intensity (i.e., g CO2-eq/kWh) and FE consumption intensity (MJ//kWh) during power production, respectively. refers to the power loss rate during power transmission and distribution, and refers to the power loss rate of BEVs power battery during charging. In this study, and are set to 5.9% and 9.5%, respectively [48,49]. In addition, and in China can be obtained by Equations (7) and (8), respectively.
where refers to the type of power source, and refers to the proportion of the power source . Figure 2 presents China’s power generation structure in 2020. In addition, and are presented in Table 1.
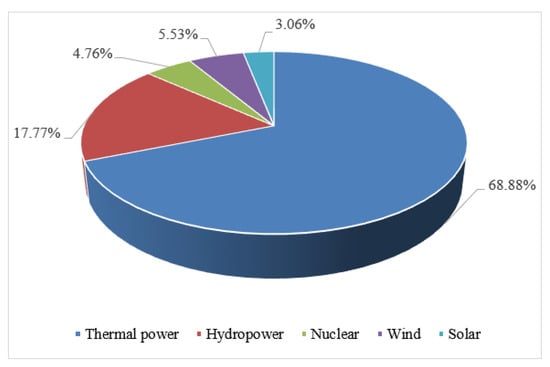
Figure 2.
China’s power generation structure in 2020 [50].

Table 1.
The FECIFP and GHGEIFP of power production in China [51,52].
Considering that the ESER effect of BEV depends on electricity production, two power development scenarios were used to further explore the ESER effect of promoting BEVs in China: the high-proportion thermal power (HPTP) scenario and the low-proportion thermal power (LPTP) scenario (see Figure 3).
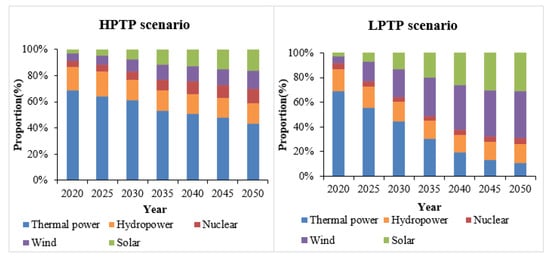
Figure 3.
China’s power development scenarios [53].
For the HPTP scenario, the proportion of CFTP is expected to drop to approximately 60% in 2030 and approximately 45% in 2050 [54,55]. As for the LPTP scenario, the proportion of CFTP will decrease to around 45% in 2030 and 11% in 2050 [56,57]. In addition, the FECIFP and of CFTP production in China will decrease to 8.79 MJ/kWh and 873.92 g CO2/kWh by 2030, and 8.13 MJ/kWh and 801.11 g CO2/kWh by 2050 [54,58].
For the current in China, the average of BEVs is 15 kWh/100 km, while the of GVs is approximately 7.8 L/100 km [59,60]. In addition, the of BEVs can be expected to decrease to 12.0 kWh/100 km in 2025, 10.0 kWh/100 km in 2030, and 6 kWh/100 km in 2050 [59,60], and the of GVs in 2020, 2030, and 2050 can be expected to decrease to 6.5, 5.8, and 4.0 L/100 km, respectively [59,60].
2.3. Population Growth Model and Simulation of Automobile Market Scale
This study employs the population ecological growth model to simulate the market evolution of BEVs and GVs in China. In population ecology, two typical population growth models are J-shaped and S-shaped. The J-shaped curve corresponds to the growth mode under ideal conditions. If the population is growing in an environment with abundant food (nutrients) and space conditions, no predators, and suitable climate, the population will grow continuously [61,62]. However, in reality, the resources and space in nature are limited. Therefore, the population cannot grow infinitely. When the population size reaches the maximum allowed by environmental conditions, it will stop growing, approximating an S-shaped growth curve [63,64]. The logistic curve, an S-shaped growth curve named by Pierre Francois Viller [63,64], has been widely used to study population growth, technology diffusion, and product promotion and has achieved good application effects [65,66,67]. Therefore, we use it to simulate the development trend of the BEV and GV markets in China.
In the study of the market diffusion of products, the differential equation for the logistic growth curve can be described as shown in Equation (9).
where refers to the market maximum capacity value, and refers to the value of the market scale at time . The growth rate of the market scale (i.e., ) is proportional to the product of the market scale (i.e., ) and the degree to which it is close to the saturation level (i.e., ). The proportional coefficient is denoted as .
x(t) can be solved by integrating the following Equation (9):
where B and C are positive constants, which can be determined by the initial conditions. Based on the actual data of China’s automobile market from 1985 to 2017 (see Appendix D), the nonlinear least square method (NLS) and SPSS 26.0 software were used to estimate the value of A, B, and C.
2.4. The Annual FE Consumption and GHG Emissions from China’s Automobile Market
The annual FE consumption (AFEC) and annual GHG emissions (AGHGE) from China’s automobile market can be estimated by Equations (11) and (12).
where refers to the market scale of BEVs or GVs, which can be calculated by the population growth model. VKT refers to the average annual vehicle kilometer traveled (i.e., 15,000 km). In addition, and can be obtained by Equations (1)–(8).
Based on the above methods and materials, the ESER effect of China’s promotion of BEVs under different scenarios can be compared and analyzed.
3. Results
3.1. The Life Cycle GHGEI and FECI of BEV and GV
The FECI and GHGEI of BEV and GV under China’s current electric power mix and vehicle fuel economy are presented in Figure 4. As for the FECI and GHGEI of GVs, the FLC and the VLC account for approximately 84% and 16%, respectively. For the full life cycle of BEV, the FECI and GHGEI from the VLC account for approximately 38%, while the FECI and GHGEI from the FLC account for approximately 62%. Although the additional battery equipment makes the FECI and GHGEI of BEVs during the VLC greater than that of GVs, the FECI and GHGEI of BEVs from FLC are significantly lower than those of GV. The FECI and GHGEI of BEV are approximately 2.17 MJ/km and 197.35 CO2-eq/km, respectively. Compared with GV, BEV could reduce the GHG emissions intensity by approximately 26.6%, a reduction of 71.52 g CO2-eq/km. As for FEC, the FECI of BEV is approximately 40.1% lower than that of GV, a decrease of 1.45 MJ/km.
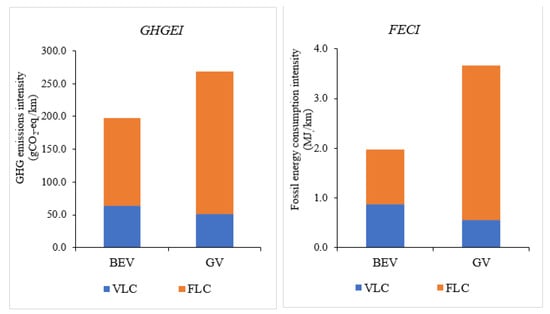
Figure 4.
FECI and GHGEI under the current power structure.
Based on the changes in vehicle fuel efficiency and China’s energy planning, the FECI and GHGEI of future BEVs and GVs were further calculated and compared. The detailed results are shown in Figure 5 and Figure 6. It can be seen that the potential of BEV in ESER will gradually increase.
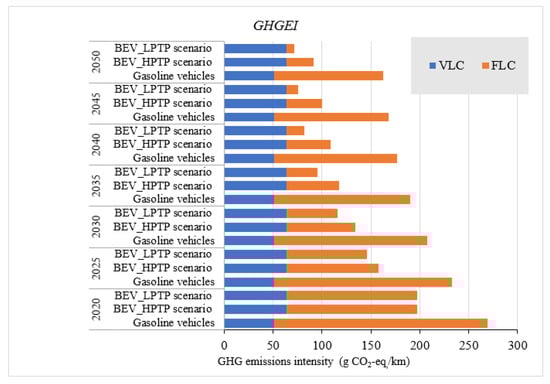
Figure 5.
GHGEI of BEVs and GVs under different scenarios.
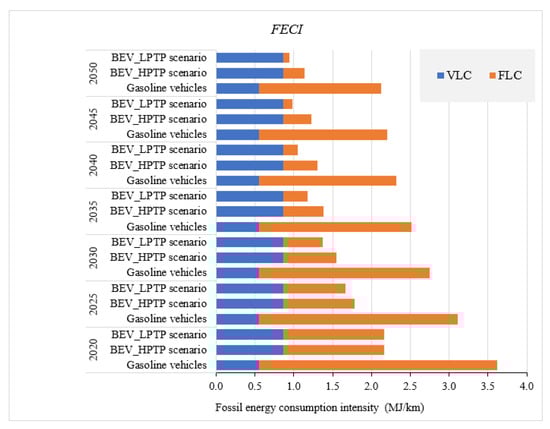
Figure 6.
FECI of BEVs and GVs under different scenarios.
For GVs, the GHGEI could be reduced to approximately 207.33 g CO2-eq/km by 2030 and 162.57 g CO2-eq/km by 2050, while the FECI could be reduced to 2.75 MJ/km by 2030 and 2.12 MJ/km by 2050.
Under the HPTP scenario, the GHGEI of BEV could be reduced to approximately 133.81 g CO2-eq/km (2030) and 91.67 g CO2-eq/km (2050), and the FECI could be reduced to approximately 1.55 MJ/km (2030) and 1.14 MJ/km (2050). This shows that compared with using GV, using BEV can reduce GHG emissions by up to 35.46% in 2030 and 43.61% in 2050, and can also reduce fossil energy consumption by up to 43.69% in 2030 and 46.33% in 2050.
Under the LPTP scenario, the GHGEI of BEVs is expected to drop to 115.61 and 71.84 g CO2-eq/km by 2030 and 2050, respectively. The FECI of BEVs would be 1.37 and 0.95 MJ/km by 2030 and 2050, respectively. In this case, using a BEV instead of a GV can reduce GHG emissions by up to 44.24% in 2030 and 55.81% in 2050 and reduce fossil energy consumption by up to 50.12% in 2030 and 55.45% in 2050.
In addition, it is worth noting that the proportion of the fuel life cycle will gradually decrease. For GVs, the share of the fuel life cycle will decline from around 80% in 2020 to around 70% in 2050. For the GHGEI of BEVs, the proportion of the fuel life cycle can be reduced from 67.87% in 2020 to 52.62% (low-proportion thermal power scenario) and 45.16% (HPTP scenario) in 2030, and to 30.84% (LPTP scenario) and 11.74% (HPTP scenario) in 2050. For the FECI of BEVs, the proportion of the fuel life cycle can be reduced from 60.00% in 2020 to 44.05% (LPTP scenario) and 36.83% (HPTP scenario) in 2030, and to 23.92% (LPTP scenario) and 8.33% (HPTP scenario) in 2050. It can be found that, from around 2030, VLC will become the primary source of the FC consumption and GHG emissions of BEVs.
3.2. Market Scale of BEVs and GVs
The estimated values of the parameters in the logistic equation are shown in Table 2. R2 and the adjusted R2 of the model are 0.986 and 0.951, respectively. All parameter values are significant at the 0.001 probability level (see Table 2). Table 3 and Figure 7 present the goodness-of-fit results for the obtained Logistic equation for China’s automobile market in this study.
Table 2.
Estimated values and goodness-of-fit of the logistic equations.
Table 3.
The comparison of actual and estimated values.
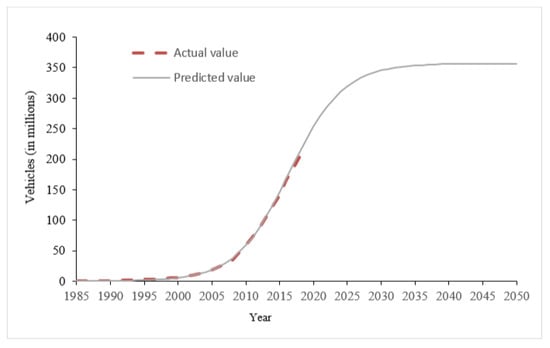
Figure 7.
The actual and predicted value of the overall scale of China’s automobile market.
As shown in Table 3, considering that the prediction errors are all within 5%, this model can be used to simulate the development trend of the GV and BEV markets (see Figure 7). In addition, it can also be found from Figure 7 that the overall scale of China’s automobile market (including GVs and BEVs) is expected to reach a maximum of 360 million vehicles.
Many countries across the world have formulated a timetable for BGVS [42]. Since China has not yet proposed a clear plan, in order to better explore the ESER potential of the promotion of BEVs, three scenarios were set up in this study, namely, banning GV sales in 2040, 2050, and 2060.
The market evolution of BEVs can be calculated and simulated based on the following assumptions: firstly, the maximum scale of China’s automobile market is approximately 360 million. Second, since the lifespan of passenger cars is approximately 10 years in China [46], it can be assumed that the market share of BEVs will reach around 90% 10 years after the ban on the sale of GVs. Third, there were approximately 5 million BEVs in China in 2020 (i.e., the initial value at t = 0) [68,69]. Fourth, according to China’s NEV Development Plan (2021–2035), the NEV sales will account for 20% of total new car sales in the entire automobile market [70]. Based on the given assumptions, we utilized the logistic equation (see Table 2 and Equation (10)) to estimate the changing trend of GVs and BEVs in the market scale under different BGVS scenarios in China, as shown in Figure 8.
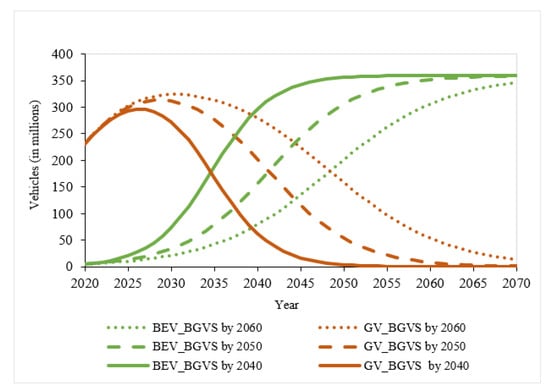
Figure 8.
Market evolution of BEVs and GVs in China.
If the sales of GVs are banned starting in 2060, the number of BEVs in China could reach 21.38 million in 2030, 79.38 million in 2040, and 201.26 million in 2050. If sales of GVs are banned starting from 2050 on, the market size of BEVs could rise to 33.93 million in 2030, 156.49 million in 2040, and 306.12 million in 2050. In particular, if China starts banning GV sales in 2040, the BEV market will reach 73 million by 2030 and 300 million by 2040. Under the scenario of banning GV sales from 2060 on, the market size of BEVs will exceed that of GVs around 2049. When the time points for BGVS are set to 2050 and 2040, this critical point can be advanced to 2042 and 2035, respectively.
3.3. The ESER Effect of China’s BEVs Promotion under Different BGVS Scenarios
Combined with the FECI and GHGEI of BEVs and GVs in Section 3.1 and the development trends for BEVs and GVs in Section 3.2, the annual FE consumption and GHG emissions from China’s automobile market under different scenarios can be calculated, as shown in Figure 9 and Figure 10.
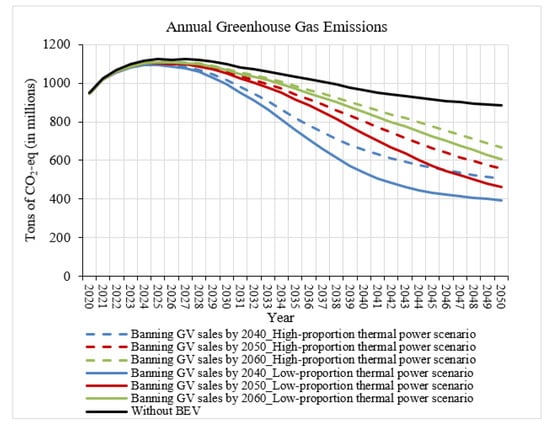
Figure 9.
Annual GHG emissions from China’s automobile market under different scenarios.
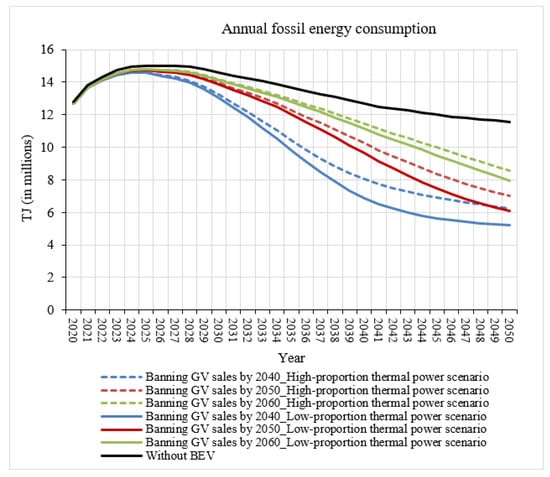
Figure 10.
Annual FE consumption of China’s automobile market under different scenarios.
As shown in Figure 9 and Figure 10, promoting BEV can significantly reduce FE consumption and GHG emissions from China’s automobile market. If sales of GVs are banned starting in 2060, under a high-proportion thermal power scenario, annual GHG emission reductions can reach 24.33 million tons of CO2-eq (MtCO2e) in 2030, 83.14 MtCO2e in 2040, and 214.94 MtCO2e in 2050. The FE consumption can also be reduced by 0.40 million TJ in 2030, 1.24 million TJ in 2040, and 2.99 million TJ in 2050. Furthermore, under the LPTP scenario, annual GHG emission reductions can reach 30.35 MtCO2e in 2030, 115.10 MtCO2e in 2040, and 276.54 MtCO2e in 2050. In addition, annual fossil energy consumption can be reduced by 0.46 million TJ in 2030, 1.56 million TJ in 2040, and 3.60 million TJ in 2050.
If the sale of GVs is banned from 2050 on, the annual reduction in fossil energy consumption by 2030 will reach 0.63 million TJ under the HPTP scenario and 0.72 million TJ under the LPTP scenario, and the annual GHG emissions reduction by 2030 can reach 38.47 MtCO2e under the HPTP scenario and 48.02 MtCO2e under the LPTP scenario. By 2040, the annual reduction in fossil energy consumption can reach 2.45 million TJ under the HPTP scenario and 3.06 million TJ under the LPTP scenario, and the annual reduction in GHG emissions can reach 163.48 MtCO2e under the HPTP scenario and 226.48 MtCO2e under the LPTP scenario. Furthermore, by 2050, the annual reduction in fossil energy consumption can reach 4.55 million TJ under the HPTP scenario and 5.47 million TJ under the LPTP scenario, and the annual reduction in GHG emissions can reach 326.72 MtCO2e under the HPTP scenario and 420.50 MtCO2e under the LPTP scenario.
In particular, if GV sales are banned from 2040 on in China, under the HPTP scenario, the annual reduction in GHG emissions can reach 82.86 MtCO2e, 309.52 MtCO2e, and 379.68 MtCO2e in 2030, 2040, and 2050, respectively. The annual fossil energy savings can reach 1.36 million TJ, 4.64 million TJ, and 5.29 million TJ in 2030, 2040, and 2050, respectively. Furthermore, under the LPTP scenario, the annual emissions reduction can reach 103.47 MtCO2e, 428.95 MtCO2e, and 488.77 MtCO2e in 2030, 2040, and 2050, respectively, and the annual fossil energy savings can reach 1.56 million TJ, 5.80 million TJ, and 6.35 million TJ in 2030, 2040, and 2050, respectively.
In addition, it can be found that without BEVs, the Chinese car market will reach its carbon peak in 2027, with a peak value of approximately 1124.23 MtCO2e (see Figure 9). In the scenario of the promotion of BEVs, if the ban on the sale of GVs in China is set between 2040 and 2060, the carbon peak will be reached in 2025, and the corresponding carbon peak value could be approximately 1095.45–1110.65 MtCO2e. Although the promotion of BEVs has no significant impact on the point in time at which the automobile market will reach its carbon peak, it can reduce the carbon peak value by approximately 13.58–28.79 MtCO2e. In particular, after reaching the carbon peak, the promotion of BEVs shows significant potential for reducing FE consumption and GHG emissions.
It can also be found that, although there are significant differences in FE consumption and GHG emissions under different time points of BGVS, the impact of different time points of banning GV sales on the peak time of carbon emissions is not significant.
4. Discussion
This study quantitively estimates the energy savings and emission reduction effect of the promotion of BEVs in the context of banning GV sales. Specifically, using the population ecological growth model, the development trend of China’s GV and BEV markets under different timings of banning GV sales was simulated. Combining national energy planning and automotive technology development, the GHG emission reduction and FE conservation potential of promoting BEVs was further estimated and discussed from the life cycle perspective, making a meaningful contribution to existing research in several ways.
First, existing studies on the field of NEVs mainly focuses on industrial policies and development strategies [25,71,72,73], consumer behavior and purchase willingness [74,75,76], vehicle and fuel technology [7,32], and comparisons with conventional fossil fuel vehicles in terms of vehicle performance, energy consumption, and environmental sustainability [47,49,52]. In order to better solve the problems concerning energy conservation, emission reduction, and the battery health of electric vehicles, scholars have also conducted a series of in-depth studies on energy management strategies and have proposed a variety of optimal control methods [37,38,39]. In addition, research on the modeling, forecasting, and analysis of the production and sales of NEVs has also been widely carried out [40,41]. However, little effort has been devoted to date to discussing the long-term energy and environmental impacts of promoting NEVs. This study empirically analyzes the impact of the promotion of NEVs on energy and the environment over a long time frame, making up for the deficiencies of the existing literature.
Secondly, although many countries in the world have formulated a timetable for BGVS [42], little is known about the dynamic growth trends of the new energy vehicle market and its corresponding energy and environmental impacts in the context of BGVS. This study first employs the population growth model to simulate the evolution of China’s automobile market under different BGVS scenarios and then estimates the ESER potential of promoting BEVs from the life cycle perspective. The findings can not only help authorities, managers, and the public to better understand the changing trends of the entire automobile market and the consequent environmental and energy impacts of BGVS, but also provide a forward-looking reference for formulating comprehensive, systematic, and reasonable industrial planning to better promote the sustainability of the automotive sector and solve the relevant energy and environmental problems.
Thirdly, the ESER effect of NEVs mainly depends on various factors, such as industrial policies, development strategies, power production, energy planning, and vehicle and fuel technology [77,78,79,80], while the ESER effect of NEVs also affects the development of related industries and technologies in turn. This study fully considers these influencing factors to explore the ESER potential of BEV promotion, which can provide a valuable reference for promoting healthy and sustainable development in all aspects.
BEVs show great ESER potential. Currently, compared with GVs, BEVs in China have lower GHGEI and FECI. Replacing GVs with BEVs can reduce GHG emissions by approximately 26.6% (71.54 g CO2-eq/km) and FE consumption by approximately 40.1% (1.45 MJ/km), respectively. With the continuous improvement of the proportion of green electricity and the efficiency of CFTP plants, the ESER effect of BEVs will gradually increase. By 2050, under the HPTP scenario, using a BEV instead of a GV will reduce GHG emissions by approximately 43.61% and FE consumption by approximately 46.33%. Especially in the LPTP scenario, the corresponding reduction rates of GHG emissions and FE consumption can reach 55.81% and 55.45%, respectively.
Under the scenario of banning GV sales from 2060 on, the market size of BEVs will exceed that of GVs around 2049. The annual FE savings and GHG emission reductions could reach approximately 0.40~0.46 million TJ and 24.33~30.35 MtCO2e by 2030 and 2.99~3.60 million TJ and 214.94~276.54 MtCO2e by 2050. If China bans GV sales from 2050 on, the market share of BEVs will exceed that of GVs around 2042. The annual ESER could reach approximately 0.63~0.72 million TJ and 38.47~48.02 MtCO2e by 2030, and 4.55~5.47 million TJ and 326.72~420.50 MtCO2e by 2050. In particular, if GV sales are banned from 2040 on, BEVs will start to dominate the automotive market around 2035. The annual ESER could reach approximately 1.36~1.56 million TJ and 82.86~103.47 MtCO2e by 2030, and 5.29~6.35 million TJ and 379.68~488.77 MtCO2e by 2050.
Compared with the scenario without BEV promotion, if the ban on the sale of GVs in China is set between 2040 and 2060, the time point at which the carbon peak of the automobile market will be reached will be advanced by approximately two years, and the corresponding carbon peak value will also be reduced by approximately 13.58–28.79 MtCO2e. Although the peak value and peak timing of carbon emissions in the automobile market are not significantly different between the different time points of BGVS, after reaching the carbon peak, the differences in the ESER effect under the different time points of BGVS will become increasingly significant.
Vigorously promoting NEVs is a potential way to alleviate the increasingly severe energy and environmental problems. In order to better promote the sustainable development of the NEV industry, it is necessary to constantly optimize and improve the overall industrial planning and layout and strengthen technological innovation to enhance industrial competitiveness. Since the ESER potential of BEVs mainly depends on the power structure and power production technology, effective plans and measures should be formulated and implemented, such as increasing the amount of clean electricity and reducing energy consumption and emissions from thermal power production. In addition, with the continuous improvement of automobile fuel economy and the green degree of the electricity grid, the VLF will surpass the FLF to become the primary source of FE consumption and GHG emissions of BEVs. Therefore, accelerating technological innovation to reduce vehicle weight, adopting more environmentally friendly and energy-saving materials, and optimizing manufacturing processes to improve the sustainability of VLC are also important paths to enhance the ESER potential of BEVs.
However, this study still has some limitations that need to be improved in the future. First, the road transportation sector is a complex and diversified system that includes many different types of vehicles, such as passenger cars, buses, heavy-duty trucks, and commercial vehicles. The specific process of promoting the green and sustainable transformation of the automobile industry also involves the substitution of traditional gasoline and diesel vehicles with diversified electric vehicles (e.g., BEV, PHEV, and FCEV) and other vehicles powered by alternative fuels (e.g., compressed natural gas, liquified natural gas, hydrogen, methanol, methane, dimethyl ether, and bioethanol). In this research work, only passenger cars were selected as the study object to analyze the ESER potential of BEVs replacing GVs. Therefore, a more systematic and comprehensive analysis of the ESER effect on the promotion of NEVs needs to be conducted in the future. In addition, this study did not pay attention to the advancement of vehicle manufacturing technology and the application of environmentally friendly and renewable materials, which can also reduce the energy and environmental impact of BEVs. Finally, this study did not take into account the FE-saving and GHG-reducing potential brought about by advances in power battery technology, which needs to be further supplemented in future studies.
Author Contributions
Conceptualization, Q.W. and S.S.; methodology, S.S.; software, S.S.; validation, Q.W. and S.S.; formal analysis, S.S.; investigation, Q.W.; resources, Q.W.; data curation, Q.W.; writing—original draft preparation, Q.W.; writing—review and editing, S.S.; visualization, Q.W.; supervision, S.S.; project administration, S.S.; funding acquisition, Q.W. All authors have read and agreed to the published version of the manuscript.
Funding
This research was funded by the Research Funds of Hebei University of Economics and Business (Grant number 2021YB10), Fundamental Research Funds for the Central Universities of China (Grant Number 00007745), and Statistics Bureau of Hebei Province (Grant Number 2022HL04). The APC was funded by 2021YB10.
Data Availability Statement
All data generated or analyzed during this study are included in this published article.
Conflicts of Interest
The authors declare no conflict of interest.
Appendix A
Table A1.
Inventory data for the vehicle life cycle of BEVs.
Table A1.
Inventory data for the vehicle life cycle of BEVs.
| Ecoinvent Unit Process | Unit | Value | |
|---|---|---|---|
| Vehicle manufacture | Glider | kg | 1046.5 |
| Powertrain | kg | 103.5 | |
| Lithium batteries | kg | 285.6 | |
| Vehicle maintenance | Maintenance of passenger cars (BEVs) | p | 1 |
| Scrapping and disposal | Dismantling of used BEVs | p | 1 |
| Treatment of used gliders | kg | 1046.5 | |
| Treatment of used powertrains for electric passenger cars | kg | 103.5 | |
| Treatment of used lithium batteries | kg | 285.6 |
Appendix B
Table A2.
Inventory data for the vehicle life cycle of GVs.
Table A2.
Inventory data for the vehicle life cycle of GVs.
| Ecoinvent Unit Process | Unit | Value | |
|---|---|---|---|
| Vehicle manufacture | Glider | kg | 913.16 |
| Internal combustion engine | kg | 320.84 | |
| Vehicle maintenance | Maintenance of passenger cars (GVs) | p | 1 |
| Scrapping and disposal | Treatment of used gliders | kg | 913.16 |
| Treatment of used internal combustion engines | kg | 320.84 | |
| Dismantling of used passenger cars with internal combustion engines | p | 1 |
Appendix C
Table A3.
Inventory data for lithium-ion battery production [81,82].
Table A3.
Inventory data for lithium-ion battery production [81,82].
| Material | Mass (Unit: kg) | FE Consumption (Unit: MJ/kg) | GHG Emissions (Unit: kg CO2-eq/kg) | |
|---|---|---|---|---|
| Electrode active material | Graphite | 43.03 | 15.02 | 272.30 |
| NMC | 68.99 | 31.48 | 448.59 | |
| Electrolyte material | Dimethyl carbonate | 11.86 | 1.31 | 47.60 |
| Ethylene carbonate | 11.90 | 1.65 | 34.08 | |
| Lithium hexafluorophosphate | 4.46 | 26.43 | 360.13 | |
| Electrode supportive material | Cu foil | 22.22 | 3.01 | 45.09 |
| N-Methyl-2-pyrrolidone | 92.91 | 2.48 | 82.09 | |
| Al foil | 9.56 | 17.87 | 288.16 | |
| Polyvinylidene fluoride | 5.80 | 11.47 | 183.21 | |
| Separator | Polyethylene membrane | 3.08 | 8.84 | 149.22 |
| Packaging | Al housing | 4.12 | 15.75 | 254.35 |
| Cu tab | 7.51 | 3.42 | 27.88 |
Appendix D
Table A4.
Historical data on the scale of China’s passenger car market.
Table A4.
Historical data on the scale of China’s passenger car market.
| Year | Vehicles (in Millions) | Year | Vehicles (in Millions) |
|---|---|---|---|
| 1985 | 0.2849 | 2004 | 14.8166 |
| 1986 | 0.3471 | 2005 | 18.4807 |
| 1987 | 0.4229 | 2006 | 23.3332 |
| 1988 | 0.6042 | 2007 | 28.7622 |
| 1989 | 0.7312 | 2008 | 35.0139 |
| 1990 | 0.8162 | 2009 | 45.7491 |
| 1991 | 0.9604 | 2010 | 59.3871 |
| 1992 | 1.1820 | 2011 | 73.2679 |
| 1993 | 1.5577 | 2012 | 88.3860 |
| 1994 | 2.0542 | 2013 | 105.0168 |
| 1995 | 2.4996 | 2014 | 123.3936 |
| 1996 | 2.8967 | 2015 | 140.9910 |
| 1997 | 3.5836 | 2016 | 165.9900 |
| 1998 | 4.2365 | 2017 | 184.6954 |
| 1999 | 5.3388 | 2018 | 205.5540 |
| 2000 | 6.2533 | 2019 | 226.3543 |
| 2001 | 7.7078 | 2020 | 243.9336 |
| 2002 | 9.6898 | 2021 | 262.4640 |
| 2003 | 12.1923 |
References
- Schneider, E. Germany’s Industrial strategy 2030, EU competition policy and the Crisis of New Constitutionalism. (Geo-)political economy of a contested paradigm shift. New Political Econ. 2022, 1–18. [Google Scholar] [CrossRef]
- Umar, M.; Ji, X.; Kirikkaleli, D.; Alola, A.A. The imperativeness of environmental quality in the United States transportation sector amidst biomass-fossil energy consumption and growth. J. Clean. Prod. 2021, 285, 124863. [Google Scholar] [CrossRef]
- Kopelias, P.; Demiridi, E.; Vogiatzis, K.; Skabardonis, A.; Zafiropoulou, V. Connected & autonomous vehicles—Environmental impacts—A review. Sci. Total Environ. 2020, 712, 135237. [Google Scholar] [CrossRef] [PubMed]
- Simsek, Y.; Lorca, Á.; Urmee, T.; Bahri, P.A.; Escobar, R. Review and assessment of energy policy developments in Chile. Energy Policy 2019, 127, 87–101. [Google Scholar] [CrossRef]
- Dzienis, A.M.; McCaleb, A. Motives behind Sino-Japanese strategic alliances in the new energy vehicles sector in the age of the Belt and Road Initiative. Asia Pac. Bus. Rev. 2022, 1–26. [Google Scholar] [CrossRef]
- Ahmadi, P. Environmental impacts and behavioral drivers of deep decarbonization for transportation through electric vehicles. J. Clean. Prod. 2019, 225, 1209–1219. [Google Scholar] [CrossRef]
- Conway, G.; Joshi, A.; Leach, F.; García, A.; Senecal, P.K. A review of current and future powertrain technologies and trends in 2020. Transp. Eng. 2021, 5, 100080. [Google Scholar] [CrossRef]
- Li, X.; Xiao, X.; Guo, H. A novel grey Bass extended model considering price factors for the demand forecasting of European new energy vehicles. Neural Comput. Appl. 2022, 34, 11521–11537. [Google Scholar] [CrossRef]
- Dahlgren, S. Biogas-based fuels as renewable energy in the transport sector: An overview of the potential of using CBG, LBG and other vehicle fuels produced from biogas. Biofuels 2022, 13, 587–599. [Google Scholar] [CrossRef]
- Sorlei, I.-S.; Bizon, N.; Thounthong, P.; Varlam, M.; Carcadea, E.; Culcer, M.; Iliescu, M.; Raceanu, M. Fuel Cell Electric Vehicles—A Brief Review of Current Topologies and Energy Management Strategies. Energies 2021, 14, 252. [Google Scholar] [CrossRef]
- Al-Enazi, A.; Okonkwo, E.C.; Bicer, Y.; Al-Ansari, T. A review of cleaner alternative fuels for maritime transportation. Energy Rep. 2021, 7, 1962–1985. [Google Scholar] [CrossRef]
- Vinoth Kanna, I.; Paturu, P. A study of hydrogen as an alternative fuel. Int. J. Ambient Energy 2020, 41, 1433–1436. [Google Scholar] [CrossRef]
- Wang, K.-H.; Su, C.-W.; Umar, M. Geopolitical risk and crude oil security: A Chinese perspective. Energy 2021, 219, 119555. [Google Scholar] [CrossRef]
- Pan, X.; Wang, L.; Dai, J.; Zhang, Q.; Peng, T.; Chen, W. Analysis of China’s oil and gas consumption under different scenarios toward 2050: An integrated modeling. Energy 2020, 195, 116991. [Google Scholar] [CrossRef]
- Wang, H.; Li, S. Asymmetric volatility spillovers between crude oil and China’s financial markets. Energy 2021, 233, 121168. [Google Scholar] [CrossRef]
- Wang, Y.; Yu, H.; Zhang, H.; Chen, T. Non-linear analysis of effects of energy consumption on economic growth in China: Role of real exchange rate. Econ. Model. 2021, 104, 105623. [Google Scholar] [CrossRef]
- National Bureau of Statistics of China. China Energy Statistical Yearbook 2021; National Bureau of Statistics of China: Beijing, China, 2022. [Google Scholar]
- Zhao, W. China’s goal of achieving carbon neutrality before 2060: Experts explain how. Natl. Sci. Rev. 2022, 9, nwac115. [Google Scholar] [CrossRef]
- Li, W.; Zhang, S.; Lu, C. Exploration of China’s net CO2 emissions evolutionary pathways by 2060 in the context of carbon neutrality. Sci. Total Environ. 2022, 831, 154909. [Google Scholar] [CrossRef]
- Fang, K.; Li, C.; Tang, Y.; He, J.; Song, J. China’s pathways to peak carbon emissions: New insights from various industrial sectors. Appl. Energy 2022, 306, 118039. [Google Scholar] [CrossRef]
- Peng, T.; Yuan, Z.; Ren, L.; Ou, X. Low-carbon development path of China’s transportation sector under carbon neutrality target. J. Automot. Eng. 2022, 4, 351–359. [Google Scholar]
- Zhao, F.; Liu, X.; Zhang, H.; Liu, Z. Automobile Industry under China’s Carbon Peaking and Carbon Neutrality Goals: Challenges, Opportunities, and Coping Strategies. J. Adv. Transp. 2022, 2022, 5834707. [Google Scholar] [CrossRef]
- Hepburn, C.; Qi, Y.; Stern, N.; Ward, B.; Xie, C.; Zenghelis, D. Towards carbon neutrality and China’s 14th Five-Year Plan: Clean energy transition, sustainable urban development, and investment priorities. Environ. Sci. Ecotechnology 2021, 8, 100130. [Google Scholar] [CrossRef]
- Tang, W.; Wu, P.; Zhang, Y.; Cao, X. Analysis on the Current Situation and Development Trend of China’s Electrification Level and Electric Energy Substitution under the Background of Carbon Neutral. IOP Conf. Ser. Earth Environ. Sci. 2021, 661, 12019. [Google Scholar] [CrossRef]
- Wang, X.; Huang, L.; Daim, T.; Li, X.; Li, Z. Evaluation of China’s new energy vehicle policy texts with quantitative and qualitative analysis. Technol. Soc. 2021, 67, 101770. [Google Scholar] [CrossRef]
- Li, J.; Jiao, J.; Xu, Y.; Chen, C. Impact of the latent topics of policy documents on the promotion of new energy vehicles: Empirical evidence from Chinese cities. Sustain. Prod. Consum. 2021, 28, 637–647. [Google Scholar] [CrossRef]
- Dong, F.; Liu, Y. Policy evolution and effect evaluation of new-energy vehicle industry in China. Resour. Policy 2020, 67, 101655. [Google Scholar] [CrossRef]
- National Bureau of Statistics of China. 2021 Statistical Bulletin on National Economic and Social Development; National Bureau of Statistics of China: Beijing, China, 2022. [Google Scholar]
- Bauer, G.S.; Zheng, C.; Shaheen, S.; Kammen, D.M. Leveraging Big Data and Coordinated Charging for Effective Taxi Fleet Electrification: The 100% EV Conversion of Shenzhen, China. IEEE Trans. Intell. Transp. Syst. 2022, 23, 10343–10353. [Google Scholar] [CrossRef]
- Feng, Y.; Yang, J.; Dong, Z. Fuel Selections for Electrified Vehicles: A Well-to-Wheel Analysis. World Electr. Veh. J. 2021, 12, 151. [Google Scholar] [CrossRef]
- National Bureau of Statistics of China. China Statistical Yearbook 2021; National Bureau of Statistics of China: Beijing, China, 2022. [Google Scholar]
- Cai, S.; Kirtley, J.L.; Lee, C.H.T. Critical Review of Direct-Drive Electrical Machine Systems for Electric and Hybrid Electric Vehicles. IEEE Trans. Energy Convers. 2022, 1–12. [Google Scholar] [CrossRef]
- Asghar, R.; Rehman, F.; Ullah, Z.; Qamar, A.; Ullah, K.; Iqbal, K.; Aman, A.; Nawaz, A.A. Electric vehicles and key adaptation challenges and prospects in Pakistan: A comprehensive review. J. Clean. Prod. 2021, 278, 123375. [Google Scholar] [CrossRef]
- Lin, B.; Shi, L. Do environmental quality and policy changes affect the evolution of consumers’ intentions to buy new energy vehicles. Appl. Energy 2022, 310, 118582. [Google Scholar] [CrossRef]
- Jiaqi, L.I.; Xiaoyuan, X.U.; Zheng, Y. A Review of Coupled Electricity and Hydrogen Energy System with Transportation System Under the Background of Large-Scale New Energy Vehicles Access. J. Shanghai Jiaotong Univ. 2022, 56, 253–266. [Google Scholar]
- König, A.; Nicoletti, L.; Schröder, D.; Wolff, S.; Waclaw, A.; Lienkamp, M. An Overview of Parameter and Cost for Battery Electric Vehicles. World Electr. Veh. J. 2021, 12, 21. [Google Scholar] [CrossRef]
- Alsharif, A.; Tan, C.W.; Ayop, R.; Dobi, A.; Lau, K.Y. A comprehensive review of energy management strategy in Vehicle-to-Grid technology integrated with renewable energy sources. Sustain. Energy Technol. Assess. 2021, 47, 101439. [Google Scholar] [CrossRef]
- Previti, U.; Brusca, S.; Galvagno, A.; Famoso, F. Influence of Energy Management System Control Strategies on the Battery State of Health in Hybrid Electric Vehicles. Sustainability 2022, 14, 12411. [Google Scholar] [CrossRef]
- Wang, Y.; Jiao, X.; Sun, Z.; Li, P. Energy Management Strategy in Consideration of Battery Health for PHEV via Stochastic Control and Particle Swarm Optimization Algorithm. Energies 2017, 10, 1894. [Google Scholar] [CrossRef]
- Zeng, B.; Li, H.; Mao, C.; Wu, Y. Modeling, prediction and analysis of new energy vehicle sales in China using a variable-structure grey model. Expert Syst. Appl. 2023, 213, 118879. [Google Scholar] [CrossRef]
- He, L.-Y.; Pei, L.-L.; Yang, Y.-H. An optimised grey buffer operator for forecasting the production and sales of new energy vehicles in China. Sci. Total Environ. 2020, 704, 135321. [Google Scholar] [CrossRef]
- Coltura Gasoline Vehicle Phaseout Advances around the World. Available online: https://www.coltura.org/world-gasoline-phaseouts (accessed on 5 September 2022).
- ISO International Standard 14044; Environmental Management Life Cycle Assessment-Requirements and Guidelines. ISO: Geneva, Switzerland, 2006.
- ISO International Standard 14040; Environmental Management-Life Cycle Assessment. Principles and Framework. ISO: Geneva, Switzerland, 2006.
- China Automobile Dealers Association. 2021 China Automobile Market Yearbook; China Automobile Dealers Association: Beijing, China, 2021. [Google Scholar]
- Sun, S.; Ertz, M. Environmental impact of mutualized mobility: Evidence from a life cycle perspective. Sci. Total Environ. 2021, 772, 145014. [Google Scholar] [CrossRef]
- Yang, L.; Yu, B.; Yang, B.; Chen, H.; Malima, G.; Wei, Y.-M. Life cycle environmental assessment of electric and internal combustion engine vehicles in China. J. Clean. Prod. 2021, 285, 124899. [Google Scholar] [CrossRef]
- Ding, N.; Liu, J.; Yang, J.; Yang, D. Comparative life cycle assessment of regional electricity supplies in China. Resour. Conserv. Recycl. 2017, 119, 47–59. [Google Scholar] [CrossRef]
- Qiao, Q.; Zhao, F.; Liu, Z.; He, X.; Hao, H. Life cycle greenhouse gas emissions of Electric Vehicles in China: Combining the vehicle cycle and fuel cycle. Energy 2019, 177, 222–233. [Google Scholar] [CrossRef]
- China National Energy Administration. China Electric Power Statistical Yearbook 2021; China Statistics Press: Beijing, China, 2021. [Google Scholar]
- Wang, L.; Wang, Y.; Du, H.; Zuo, J.; Yi Man Li, R.; Zhou, Z.; Bi, F.; Garvlehn, M.P. A comparative life-cycle assessment of hydro-, nuclear and wind power: A China study. Appl. Energy 2019, 249, 37–45. [Google Scholar] [CrossRef]
- Li, R.; Zhang, H.; Wang, H.; Tu, Q.; Wang, X. Integrated hybrid life cycle assessment and contribution analysis for CO2 emission and energy consumption of a concentrated solar power plant in China. Energy 2019, 174, 310–322. [Google Scholar] [CrossRef]
- Sun, S.; Wu, Q.; Yang, D. Energy and Environmental Impact of Banning the Sale of Traditional Fossil Fuel Vehicles; SCI-INDEX: Oxford, UK, 2022; pp. 1–6. [Google Scholar]
- Lugovoy, O.; Gao, S.; Gao, J.; Jiang, K. Feasibility study of China’s electric power sector transition to zero emissions by 2050. Energy Econ. 2021, 96, 105176. [Google Scholar] [CrossRef]
- Yang, X.J.; Hu, H.; Tan, T.; Li, J. China’s renewable energy goals by 2050. Environ. Dev. 2016, 20, 83–90. [Google Scholar] [CrossRef]
- Qiu, S.; Lei, T.; Wu, J.; Bi, S. Energy demand and supply planning of China through 2060. Energy 2021, 234, 121193. [Google Scholar] [CrossRef]
- Zhao, G.; Yu, B.; An, R.; Wu, Y.; Zhao, Z. Energy system transformations and carbon emission mitigation for China to achieve global 2 °C climate target. J. Environ. Manag. 2021, 292, 112721. [Google Scholar] [CrossRef]
- Khanna, N.Z.; Zhou, N.; Fridley, D.; Ke, J. Quantifying the potential impacts of China’s power-sector policies on coal input and CO2 emissions through 2050: A bottom-up perspective. Util. Policy 2016, 41, 128–138. [Google Scholar] [CrossRef]
- Lam, A.; Mercure, J.-F. Which policy mixes are best for decarbonising passenger cars? Simulating interactions among taxes, subsidies and regulations for the United Kingdom, the United States, Japan, China, and India. Energy Res. Soc. Sci. 2021, 75, 101951. [Google Scholar] [CrossRef]
- LIU, J.-L.; WANG, K.; XIAHOU, Q.-R.; LIU, F.-M.; ZOU, J.; KONG, Y. China’s long-term low carbon transition pathway under the urbanization process. Adv. Clim. Chang. Res. 2019, 10, 240–249. [Google Scholar] [CrossRef]
- Kang, B.; Deng, J.; Wang, Z.; Zhang, J. Transplantation of Icefish (Salangidae) in China: Glory or Disaster? Rev. Aquac. 2015, 7, 13–27. [Google Scholar] [CrossRef]
- Tsoularis, A.; Wallace, J. Analysis of logistic growth models. Math. Biosci. 2002, 179, 21–55. [Google Scholar] [CrossRef]
- Kint, J.; Constales, D.; Vanderbauwhede, A. Pierre-François Verhulst’s Final Triumph BT—The Logistic Map and the Route to Chaos: From the Beginnings to Modern Applications; Ausloos, M., Dirickx, M., Eds.; Springer: Berlin/Heidelberg, Germany, 2006; pp. 13–28. ISBN 978-3-540-32023-4. [Google Scholar]
- David, H.A.; Edwards, A.W.F. The Logistic Growth Curve BT—Annotated Readings in the History of Statistics; David, H.A., Edwards, A.W.F., Eds.; Springer: New York, NY, USA, 2001; pp. 65–67. ISBN 978-1-4757-3500-0. [Google Scholar]
- Harris, T.M.; Devkota, J.P.; Khanna, V.; Eranki, P.L.; Landis, A.E. Logistic growth curve modeling of US energy production and consumption. Renew. Sustain. Energy Rev. 2018, 96, 46–57. [Google Scholar] [CrossRef]
- Kucharavy, D.; De Guio, R. Application of S-shaped curves. Procedia Eng. 2011, 9, 559–572. [Google Scholar] [CrossRef]
- Debecker, A.; Modis, T. Poorly known aspects of flattening the curve of COVID-19. Technol. Forecast. Soc. Chang. 2021, 163, 120432. [Google Scholar] [CrossRef]
- Liu, D.; Xu, L.; Sadia, U.H.; Wang, H. Evaluating the CO2 emission reduction effect of China’s battery electric vehicle promotion efforts. Atmos. Pollut. Res. 2021, 12, 101115. [Google Scholar] [CrossRef]
- Hsieh, I.-Y.L.; Pan, M.S.; Green, W.H. Transition to electric vehicles in China: Implications for private motorization rate and battery market. Energy Policy 2020, 144, 111654. [Google Scholar] [CrossRef]
- Ministry of Industry and Information Technology of the People’s Republic of China. New Energy Vehicle Industry Development Plan (2021–2035); The Ministry of Industry and Information Technology of China: Beijing, China, 2020.
- Rostad Sæther, S. Mobility at the crossroads—Electric mobility policy and charging infrastructure lessons from across Europe. Transp. Res. Part A Policy Pract. 2022, 157, 144–159. [Google Scholar] [CrossRef]
- Almeida Neves, S.; Cardoso Marques, A.; Alberto Fuinhas, J. Technological progress and other factors behind the adoption of electric vehicles: Empirical evidence for EU countries. Res. Transp. Econ. 2019, 74, 28–39. [Google Scholar] [CrossRef]
- Bose Styczynski, A.; Hughes, L. Public policy strategies for next-generation vehicle technologies: An overview of leading markets. Environ. Innov. Soc. Transit. 2019, 31, 262–272. [Google Scholar] [CrossRef]
- Dong, Y. Analysis of Consumers’ Willingness to Accept of Government Subsidies for Electric Vehicles. Transp. Res. Procedia 2022, 61, 90–97. [Google Scholar] [CrossRef]
- Liu, R.; Ding, Z.; Jiang, X.; Sun, J.; Jiang, Y.; Qiang, W. How does experience impact the adoption willingness of battery electric vehicles? The role of psychological factors. Environ. Sci. Pollut. Res. 2020, 27, 25230–25247. [Google Scholar] [CrossRef] [PubMed]
- Salari, N. Electric vehicles adoption behaviour: Synthesising the technology readiness index with environmentalism values and instrumental attributes. Transp. Res. Part A Policy Pract. 2022, 164, 60–81. [Google Scholar] [CrossRef]
- Verma, S.; Dwivedi, G.; Verma, P. Life cycle assessment of electric vehicles in comparison to combustion engine vehicles: A review. Mater. Today Proc. 2021, 49, 217–222. [Google Scholar] [CrossRef]
- Lang, J.; Cheng, S.; Zhou, Y.; Zhao, B.; Wang, H.; Zhang, S. Energy and environmental implications of hybrid and electric vehicles in China. Energies 2013, 6, 2663–2685. [Google Scholar] [CrossRef]
- Cao, S. Comparison of the energy and environmental impact by integrating a H2 vehicle and an electric vehicle into a zero-energy building. Energy Convers. Manag. 2016, 123, 153–173. [Google Scholar] [CrossRef]
- Sun, X.; Li, Z.; Wang, X.; Li, C. Technology development of electric vehicles: A review. Energies 2019, 13, 90. [Google Scholar] [CrossRef]
- Crenna, E.; Gauch, M.; Widmer, R.; Wäger, P.; Hischier, R. Towards more flexibility and transparency in life cycle inventories for Lithium-ion batteries. Resour. Conserv. Recycl. 2021, 170, 105619. [Google Scholar] [CrossRef]
- Wang, S.; Yu, J. A comparative life cycle assessment on lithium-ion battery: Case study on electric vehicle battery in China considering battery evolution. Waste Manag. Res. 2020, 39, 156–164. [Google Scholar] [CrossRef]


Publisher’s Note: MDPI stays neutral with regard to jurisdictional claims in published maps and institutional affiliations. |
© 2022 by the authors. Licensee MDPI, Basel, Switzerland. This article is an open access article distributed under the terms and conditions of the Creative Commons Attribution (CC BY) license (https://creativecommons.org/licenses/by/4.0/).