Abstract
The energy sector is one of the most important sectors as it is the producer and supplier of fuel to run other industries and economies. This research aims to present an intertwined structure of risk exposure measuring the performance of the S&P Bombay Stock Exchange (BSE) Energy Index and selected companies from the constituents while taking into account two scenarios of risk, namely the COVID-19 pandemic and the Russia–Ukraine conflict, in a manner appropriate for energy stock investors, energy companies, and the economy through hedging against investment risk, diversification in operations securing the continuation of energy production, and the risk of fluctuating prices in the energy market, respectively. The research problem is observed as the requirement to choose the representative stocks of the S&P (BSE) Energy Index to evaluate their situations during the period of the two crisis scenarios and to provide the current risk exposure to India’s energy sector. The methodological approach was through the process of selecting the stock market, the reason behind selecting the energy sector, analyzing the crisis situation, and finally providing the risk exposure matrix. The COVID-19 pandemic affected the index and stocks only in the beginning when the market was scared psychologically. The Russia–Ukraine conflict is considered to measure the stock status showing the effect on the index and the effect on selected stocks showing a deviated performance. All ten companies representative of the S&P BSE Energy Index ranked in the increasing order of risk exposure comparatively and concludes a high potential growth and return.
1. Introduction
Everyone will experience crises at some point in their lives, but how they perceive them can vary. People make plans according to their abilities to maintain a smooth life and respond to crises as effectively as possible. Similarly, corporations and businesses strategize their vision based on their resources for growth and to maintain stability. There are countless other factors, both expected and unexpected, that continue to act as nuisances. These unexpected factors cause crises [1]. People who are affected by crises are often put in danger because of their lack of knowledge about crisis management. Dealing with crises is therefore one of the top priorities for policymakers, government employees, and executive staff today. Modern firms and businesses are more aware and familiar with the term “crisis” due to the impact on all of their stakeholders. Consequently, such businesses are better equipped to handle a crisis than an individual would be. They are better prepared to deal with problems that arise during such an event as they often maintain their own crisis management unit [2]. However, the inability to accurately predict the future prevents everyone from being perfect. As a result, more has to be done to be prepared for future challenges in crisis management.
There are several definitions of an economic crisis, but it can be generally understood as the generation of massive hitches, clashes, tensions, failures of normal production, and pushes towards change by the system. It is a sudden turning point that typically involves disruption or disorder and entails massive uncertainties that pose a real threat to the objectives and standards of society [3,4]. Additionally, the dynamics of the system determine the changes that are required in the system, and this is specifically true when the problems are technical, difficult to understand, and even more difficult to resolve. When threats manifest as danger and the system is pulled toward insecurity, it is said to be in a crisis [5]. An economic crisis is a term used to describe a situation in which currency strength and financial liquidity fall and take the form of a recession, economic depression, or stagflation. The government must intervene during crises with regulations in order to control social distress among the general populace of the nation, which has a spillover effect on other nations as well. The 2008 financial crisis demonstrated that an unregulated market can bring capitalism to its knees [6] and that the neoliberal doctrine’s detrimental effects can spread the crises.
Energy has been considered to be vital to life ever since it first began on earth and is still thought to be so today. It serves as the foundation for industrial growth and development and supplies the necessary fuel for the economy’s cyclical movement [7]. Nearly all social and everyday activities depend in some way or another on energy. Energy production is a large-scale setup that requires significant financial investments. Both renewable and non-renewable energy sources are produced and distributed by a large number of businesses. The industry transformation, technological advancements and implementations, resource exploration, production costs, and market acceptance with a sustainable price are just a few of the difficulties these businesses face [8]. Still, they are manageable because companies and independent institutions’ research and analysis teams continue to uncover new solutions such as additive manufacturing [9]. However, the major challenge is the economic crisis which is uncontrollable and shows an instant effect on the operations and market capitalization of a company. The uncertainty factor of an economic crisis increases when the problems are complex, hard to understand, and even harder to resolve as it is difficult to understand the root causes of an economic crisis.
India is a nation of entrepreneurs and innovators, and their contributions to the global development of all industries are widely spread. The presence of the country’s prospect in Asia is well noticed as the country has evolved as a production hub in alignment with the United Nations Sustainable Development Goals (UNSDGs) [10]. To continue as a production hub and for economic expansion, the country requires a high energy supply for its industries, opening up opportunities for tapping renewable energy. In terms of production and market capitalization on the stock market, the energy sector in India is one of the fastest-growing sectors [11]. The main draws for businesses to register as public entities in India’s stock market controlled by the Securities and Exchange Board of India (SEBI) [12] are considered to be the two most active exchanges, the Bombay Stock Exchange (BSE) [13] and National Stock Exchange (NSE) [14]. Investment in the Indian stock market via the NSE or BSE is profitable for both domestic and Foreign Institutional Investors (FIIs). Performance in the energy sector market is gauged using the Energy Sector Index in NSE [14] called NIFTY Energy [15] and the BSE’s S&P BSE Energy Index [16]. The Indian market for energy stocks has seen significant investment over the past ten years [16]. This may be due to the government’s commitment to providing the country with the energy it needs as well as the expansion of energy distribution to any location throughout the nation.
Life is entirely risky because the future is unknown. Nevertheless, everyone aspires to the best for themselves [17]. Risk cannot be completely eliminated, but it can be reduced or avoided before it becomes a problem [18]. Systematic and unsystematic risks are always present around business entities. By diversifying the business or switching to a different industry, unsystematic risk can be hedged. In the case of systematic risk, the company becomes a functioning part of the system, making its avoidance impossible. Business entities with economists, market analysts, and researchers, however, continue to evaluate the scenario to forecast the likelihood of risky occurrences. To keep an eye out for an alarming situation, the risk exposure of a sector or an entity can be evaluated. The accountable unit can assess the current situation and keep an eye out for deviations by actively monitoring the risk exposure chart [19]. A well-organized risk exposure evaluation can offer a roadmap for keeping the organization’s finances in line with local and global market conditions. Although systematic risk is what typically causes the economic crisis, it is a complex event that traps the entire market, and the impact on businesses or any sector, including the energy sector, cannot be denied.
Studies about economic crises and their effects on economies have been presented by researchers. The economic crisis as a concept was known to economists for years, and they have long expressed concern about maintaining a stable economy. As discussed above, the information on the concepts incorporated in this study and the literature section provide a detailed view of other researchers with underpinning reasons for economic crisis situations and their impacts. The performance analysis of the energy sector companies (Figure 1) is the focus of the current study. The theoretical underpinning is based on the rational choice theory which states that people will make their choices according to their self-interest and according to what will benefit them the most [20]. The fundamental tenet of rational choice theory is that individual choices will collectively result in aggregate social behavior. Based on this theory, this research states that during an economic crisis, people make decisions to safeguard their own interests and such behavior ultimately impacts the way the market behaves. This research, thus, utilizes the rational choice theory to understand the behavior of individuals in economic crises.
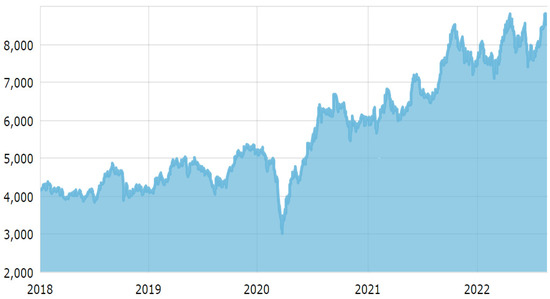
Figure 1.
S&P BSE Energy Index Performance 1 January 2018–24 August 2022. Source: https://www.bseindia.com/sensex/code/90 (accessed on 24 August 2022) [17].
The world has been gripped by a series of crises, with the COVID-19 pandemic [21,22] and the armed conflict between Russia and Ukraine [23,24] presenting unexpected circumstances. Since it fuels the industries that keep the economy alive, the energy sector has always been seen as the most important. The health of a company and its ability to survive at the moment depend on the value of its stocks, whereas, the collapse of the economy serves as a backdrop in case energy-producing companies go under. This theory leads to the primary aim of the research, which is to present an intertwined structure of risk exposure measuring the performance of S&P BSE Energy companies during the COVID-19 pandemic and the Russia–Ukraine conflict crisis in a manner appropriate for energy stock investors, energy companies, and the economy through hedging against investment risk, diversification in operations securing the continuation of energy production, and the risk of fluctuating prices in the energy market, respectively.
Here the research problem is observed as the requirement to choose the representative stocks of the S&P BSE Energy Index to evaluate their situations during the period of the COVID-19 pandemic and the Russia–Ukraine conflict as two crisis scenarios and to provide the current risk exposure to India’s energy sector. For this purpose, the following research questions have been formulated: Does economic crisis show an impact on S&P BSE Energy companies? What is the current state of the S&P BSE Energy companies? What is the risk exposure of S&P BSE Energy companies? In addition to the primary goal, a few secondary goals are also stated to achieve the primary goal in a step-by-step fashion. They include observing the key stocks contributing to the S&P BSE Energy Index, framing a quantified measurement assessing the crisis impact on S&P BSE Energy companies, and developing the risk exposure assessment matrix specific to energy companies of the S&P BSE Energy Index.
This study is an analytical investigation using quantitative analysis and secondary data to reach a noteworthy conclusion from the obtained result. The study’s data range from 1 January 2018 to 24 August 2022, taking into account the crisis condition to determine the study’s impact. Based on the financial results of the past four consecutive quarters, the risk exposure is examined. This research has set the scope to conceptually assess the economic crisis and risk, whereas the energy sector stocks are chosen as the industrial scope, and the S&P BSE Energy Index is the market for a focused study. The study is provided in five sections, each of which includes all of the planned information. However, if necessary, subsections present further in-depth discussions. The introduction, which is the first section, summarizes the entire research in a simple manner with a theoretical underpinning. The literature review in the second section offers a thorough overview of the chosen topics and scope with subsections. The third section presents the methodological approach, detailing the conceptualization process and approaches that are used. The fourth section includes the analysis and findings, which provide empirical support for the study’s validity. Finally, conclusions and policy implications are provided as the fifth section in the continuation of this research series.
2. Background Conceptualization
To generate a larger knowledge base on “what works” in the energy sector, impact assessment and risk exposure evaluation have to be mainstreamed across a spectrum of development interventions. Although industries dominated by “hard infrastructure”, such as energy, account for significantly greater development expenditure, the number of impact studies on these sectors has remained far more restricted [25]. At the same time, energy investments have become considerably more sophisticated over the years as the focus has shifted more toward environmental and social purposes. Along with these developments has come a growing number of behavioral implications, which can be examined with the use of impact assessments. In spite of this, conducting impact assessments in the energy sector presents unique challenges. For instance, many energy projects, such as power plants or transmission lines, are “small-n” interventions, such that there are insufficient numbers of units for conducting conventional statistical analysis [25]. This assessment is designed to overcome these obstacles and give insights to orient future impact studies on the energy industry of India.
2.1. Energy Sector in India
India has a significant presence in the energy sector on the international stage as the country has contributed more than 10% of the rise in the world’s energy consumption since 2000 [26]. India’s energy consumption has increased by more than 60% on a per capita basis since 2000, despite significant variations between socioeconomic levels and geographical regions of the nation [26]. Coal, oil, and solid biomass together provide more than 80% of India’s energy requirements, with coal continuing to be the dominant fuel in the energy mix [27]. Cooking fuel made mostly of fuelwood, known as biomass, is still commonly utilized in the country, although its contribution to the energy mix is falling [28]. Modern renewable energy sources, which include natural gas, have begun to gain footing; particularly, solar photovoltaic (PV) has grown dramatically [29].
The demand for energy services has enormous potential in India [30], because of the country’s increasing economic level and the pressures of urbanization and industrialization [31]. However, there are also substantial uncertainties over how demand growth will be satisfied as India is resource-constrained, with the exception of solar, coal, and wind [32]. The affordability of energy is a significant problem in India because of its extremely dense population, relatively high levels of water stress, land use restrictions, structural poverty, and other socioeconomic variables [33]. Despite the country being among the world’s top energy consumers, it uses far less energy on average than people in other countries [34]. India’s yearly CO2 emissions are the third highest in the world, yet emissions per person are among the lowest in the world [35].
2.2. Economic Crises
When macroeconomic agents such as households, government, firms, and banks do not work in tandem and in sync with each other, it can inevitably cause an economic crisis [36]. Aggregate economic outcomes are fundamentally impacted by the direct interaction between agents and how that interaction is structured. The relationship between the behavior of individuals and the behavior of aggregate variables will be different when agents are directly connected to and affect one another than it is in an anonymous market scenario [37,38]. Macroeconomic behavior cannot be understood without considering the extent to which the choices and behaviors of particular households, governments, businesses, or firms are impacted by the networks of connections that bind them to other agents. It is, therefore, feasible to identify efficient crisis early warning systems. For instance, credit and income are predictors of crises as during expansions, credit increases, raising the average level of leverage and increasing the vulnerability of the system to local shocks [36]. Changes in public debt lower the likelihood of crises, as public debt supports aggregate demand, softening the amplitude of declines in income and net worth [38]. Hence, agent-based macroeconomic models can provide some insights into the understanding of the circumstances that may give rise to economic crises, helping to define the theoretical foundation for identifying early warning indications for crises.
2.2.1. India Economic Crises
India witnessed unheard-of 8% annual GDP growth from 2003–2004 to 2013–2014, with the country witnessing the highest investment rates and export growth rates during this period of time. India added 7.5 million new non-agricultural jobs annually [38]. The global financial crisis (GFC) caused a precipitous drop in GDP growth to 3.1% in 2008–2009, followed by a brief recovery in 2009–2011 on the back of concerted fiscal and monetary policy initiatives that were not sustainable and led to a new recession in 2011–2014 [39]. The growth rate slowed to 7% and fell further after the demonetization of 86% of the country’s currency in late 2016 [36,37,38,39,40]. This sharply reduced jobs in the unorganized sector, and the consumption demand started falling, with GDP growth slowing until the commencement of the COVID-19 pandemic. The Indian economy has been experiencing a cyclical slowdown since 2017–2018, with growth slowing to 3.7% in 2019–2020 [40].
2.2.2. Scars of COVID-19 Pandemic
The COVID-19 pandemic has impacted countries throughout the globe both economically [41,42] and financially [43,44]. The pandemic also extended to stock markets, causing them to collapse with huge losses [45]. The lack of preparedness was one of the reasons for the devastating impact of COVID-19 [46,47]. The pandemic’s cliff effects and scarring compounded the cyclical decline that had already begun in the Indian economy before the pandemic broke out. During the height of the first wave, India’s GDP fell by as much as 23.8% in the first quarter of 2020–2021, making it one of the gloomiest recessions [48]. The country’s panel data projections for the financial years 2019–2020 to 2021–2022 showcase a decrease in investment count of around 50% compared to the counterfactual forecast of a rise of 38% over the same time [49]. The severity of the shutdown was identified as the primary cause of the worst possible economic impact on India. The country took extreme measures to stop the spread of the virus, including imposing one of the world’s strictest lockdowns [50].
The energy demand saw a significant influence due to the severe lockdown implemented in the country. The abrupt closure of businesses and transportation infrastructure created a gap of roughly 40% in the country’s energy demand [51]. In comparison to 2019, the average daily energy usage in all of India decreased by 1000 GW, leading to a net revenue loss of INR 25,000 to INR 30,000 crores for distribution companies [52]. The market clearance during the pandemic was much lower in terms of volume and price when compared to other similar global events such as the global financial crisis, suggesting a negative impact on investor sentiment [53]. In addition, transmission and distribution (T&D) companies suffered heavy losses [54].
2.3. Russia–Ukraine Conflict Creating Crisis
The major effects of the war between Russia and Ukraine include rising oil prices, weakened financial markets, and stronger international sanctions against Russia. Russia enjoys substantial exposure to both the United Kingdom (UK) and the European Union (EU). Russia’s top import partners include nations such as China, the US, Germany, France, and Italy [55]. The gross domestic product (GDP) proportion of Russia worldwide was predicted by the International Monetary Fund (IMF) to be 1.6% in 2022, whereas it was anticipated that the economic production of Ukraine would make up 0.2% of global output production [56]. Despite the fact that the combined economies of Ukraine and Russia are minor in comparison to the global economy, they have a crucial role, notably in the fields of energy. The conflict has a major effect on commodity prices and consequently household expenditure. This rise in commodity prices would cost more due to disruptions and sanctions further bolstering their already high prices and creating inflation in the world economy [57].
Russia is a significant supplier of palladium, which is used in engine exhaust to decrease pollutants. It accounts for 40% of worldwide mining output and 10% of the world’s supply of platinum. About 15% of the titanium sponge used in airplanes is produced in Russia and Ukraine. Approximately 13% of the world’s fertilizer supply comes from Russia. In addition to the current supply chain issues, disruptions to the worldwide supply of these commodities have the potential to severely disrupt some industries and extend shortages, such as those for vehicles. Russia’s involvement in the conflict may have indirect repercussions on the rest of the countries because it is one of the biggest producers and exporters of oil and energy in the world. If fresh international sanctions are placed on Russia as a result of a military war, the penalties may affect Russia’s capacity to export oil and gas, which would cause energy prices to rise [58]. Energy exporters are among the few beneficiaries of the conflict in Ukraine, but this conflict raises questions about the monetary policymakers’ plan since it will simultaneously hurt growth and drive up inflation at a time when it is already high. In the short term, higher rates will not be able to offset the war’s price increases, but they may make any decline in confidence and activity worse. For policy-relevant horizons, less activity over the longer term will assist in reducing the second-round impacts on prices; thus, monetary policy may not need to react as much to the conflict itself.
2.4. Risk Exposure
Risk is the probability or threat of damage, injury, liability, loss, or any other negative occurrence that is caused by external and/or internal vulnerabilities and may be avoided through pre-emptive action. The risk to which a business is exposed results from fluctuations and uncertainty regarding its profitability, along with the volatility of the dividend policy [59]. The method for allocating risk among market participants and the interpretation of market information is of utmost significance in this case. Fluctuations in the profitability of a firm are one of the factors that affect how much its stock price changes. Consequently, the risk exposure can be analyzed from the perspective of total risk, i.e., from the perspective of the profitability of businesses and from the rate of returns. From profitability ratios and rates of return, systematic risk is derived, which is measured using sensitivity measures and can be estimated using standard deviation-based risk metrics and by applying downside risk measures [60].
Downside risk, or the likelihood of obtaining returns below the assumed rate of return, is a new concept brought about by risk aversion [61]. The semi-variance or semi-deviation of returns serves as the primary indicator of the overall downside risk. While asymmetric distributions offer a far more practical measure than a variance, symmetric distributions’ semi-variance, belonging to the group of asymmetric measures known as lower partial moments (LPMs), is at least as suitable a risk indicator as variance [62]. Bawa [63] demonstrated that semi-variance is a suitable indicator of overall risk for investors with diminishing risk aversion.
A literature review was performed to address the topic of risk in the stock market, which is frequently measured using the capital asset pricing model (CAPM) developed by Sharpe [64], Lintner [65], and Mossin [66]. Hogan and Warren [67] showed the persistence of the downside capital asset pricing model (CAPM) with the conventional CAPM. Harlow and Rao [68] adopted a general approach to the conventional CAPM as an all-encompassing strategy in which they assumed that the average rate of return was the threshold rate of return. The CAPM derives from the equilibrium theory, according to which investors maximize an expected utility function based on the mean and variance of returns from their portfolio, and the return distributions are normally distributed [69]. However, some might consider variance as an inappropriate indicator of risk as the majority of rate-of-return distributions are neither symmetric nor normal [70]. Furthermore, investors also view any deviations above (below) the threshold (such as expected value) as a profit (loss) because they are typically unevenly risk-averse [71].
2.4.1. Types of Risk
Risk is a combination of systematic and unsystematic risk. Unsystematic risk is determined by the activities of a company, i.e., internal factors such as management, availability of raw materials, liquidity, and bankruptcy. On the other hand, systematic risk is determined by external forces such as the nature and economy of a given market. This literature review deals with systematic risk, which is the basic economic concept for the understanding of financial crises. According to Summer [72], systemic financial risk has no unified definition. De-Bandt and Hartmann [73] state that any notion of systemic financial risk should take into account widespread occurrences in the banking and financial sectors as well as payment and settlement systems. Systemic risk, according to the European Central Bank, is the possibility of an institution failing to fulfill its obligations, which could lead to other participants failing to fulfill their obligations as well and having wider effects because of liquidity and credit restrictions, ultimately putting the stability of the financial system at risk [74]. The systematic risk of publicly traded corporations is gauged by the beta coefficient (market-based beta) proposed by Sharpe [65]. Since they are based on stock prices, Sharpe’s model betas are only applicable to businesses that are listed on an equity market (rates of return). Hill and Stone [75] were the first to suggest the accounting-based beta, and it is calculated similarly to how a market-based beta is calculated.
Systematic risk can be further classified into market risk, credit risk, operational risk, and legal risk. Market risk is the risk of loss as a result of changes in the value of an asset held by a company. Credit risk is the risk of a financial loss if the company that is associated with a financial institution ceases to repay its liability. Operational risk is the risk of loss as a result of faulty systems, inadequate controls, human error, or poor management/ corporate governance. Legal risk is the risk related to the possibility of incurring losses as a result of the conduct of business activities outside the legal framework and includes the inability to enforce the terms of a contract. Szymczyk et al. [76] examined whether investors could have seen any signs of liquidity risk in US mutual funds since the beginning of the COVID-19 pandemic and found that the proposed model may be an effective tool for selecting high-yield funds against liquidity risk. Magwedere and Marozva [43] examined the relationship between liquidity and the credit risk of South African-domiciled banks within the context of the COVID-19 pandemic and found a positive relationship between them. Musa et al. [44] examined whether companies with good corporate governance practices were more resilient during the COVID-19 pandemic and found that companies with higher levels of corporate governance would have their financial variables deteriorate significantly more compared to companies with low levels of compliance.
2.4.2. Risk Assessment
Solvency ratios and capitalization are connected in firm-wide risk assessment. For public firms, it is crucial to demonstrate to rating agencies that they have enough cash to support their credit rating. As a crucial component of corporate value, capitalization is examined by equity analysts. Beyond rules and ratings, a technique for raising shareholder value is an accurate risk assessment and the associated relationship to capital. Risk assessment, therefore, serves as the foundation for all facets of efficient risk management since it is the primary input for management choices on the global placement of risks in an unpredictable environment.
Value-at-risk (VaR), a structural model of the profit and loss (P&L) distribution generated by mapping positions to risk factors and marking to market or model daily, and the risk metric of a lower percentile of the P&L distribution, has been used extensively for market risk assessment [77]. However, the effectiveness of VaR models has come under scrutiny. Berkowitz and O’Brien [78] demonstrate that structural models have trouble predicting changes in P&L volatility and are overly cautious in their VaR estimations. Reduced-form VaR forecasts using the generalized autoregressive conditional heteroscedasticity (GARCH) models are better able to capture time-variability in P&L volatility [79,80]. Burns [81] examined the application of various GARCH models for reduced-form VaR forecasting and found that more reactive GARCH models provide better forecasts than more persistent ones.
2.5. Stock Market
A stock market, also known as an equity market or share market, is a collection of stock exchanges where investors buy and sell stocks, which represent ownership stakes in corporations [82]. These securities may be listed on a public stock exchange or only traded privately, such as shares of private corporations that are offered to investors through equity crowdfunding platforms. A variety of variables affect the price of securities; some are industry- or business-specific, while others are related to the environment in which the firm operates. Factors such as macroeconomic variables; domestic and international economic, social, or political events; market attitudes and expectations about the direction of future economic development; and announcements of monetary and fiscal policy are all thought to have an impact on how stock values move [83]. The stock market evaluates the progress of all economic sectors while capitalizing on the present and future benefits of growth potential. As they nearly quickly reflect every move made by economic and political actors, stock markets may be seen as a country’s beating heart to gauge the health of the economy. There are several stock exchanges around the world (e.g., New York Stock Exchange (NYSE), London Stock Exchange). This study will focus on the Indian stock market.
2.5.1. India Stock Market
The Bombay Stock Exchange (BSE) and the National Stock Exchange (NSE) are the two stock exchanges where the majority of trade in the Indian stock market occurs. The BSE was first established in 1875, whereas the NSE was established in 1992 and began trading in 1994 [84]. The BSE is the more established stock market, while the NSE has the most volume; however, the trading system, trading hours, and settlement procedure are identical for both exchanges, and nearly all of India’s notable companies are listed on both exchanges. Both exchanges compete with each other, which leads to reduced costs, market efficiency, and innovation. The existence of arbitrageurs maintains a fairly narrow range between the prices on the two stock exchanges. The spot equity market uses a T + 2 rolling day for settlement in India [85]. As a result, a deal made on Monday would be completed by Wednesday. Both the exchanges work from Monday to Friday, between 9:55 a.m. and 3:30 p.m., Indian Standard Time (plus 5.5 h GMT), and each exchange has a clearing house that acts as a central counterparty and takes all settlement risk [86]. Deliveries of shares are done in dematerialized form.
The Sensitive Index (Sensex) and Nifty are the two important indices for the Indian stock market. Sensex, which was created in 1986, is the oldest market index for equities and includes shares of 30 firms listed on the BSE [85]. Standard & Poor’s CNX Nifty index is another option, which was created in 1996 and comprises 50 listed companies on the NSE [85]. The Securities and Exchange Board of India (SEBI), a standalone organization established in 1992, is in charge of developing, regulating, and overseeing the stock market as a whole in the country. SEBI works to establish market regulations that are in accordance with industry standards and has extensive authority to penalize market players for violations.
2.5.2. Bombay Stock Exchange (BSE)
This study will focus on BSE since it is a more established stock exchange in India and the oldest stock market in Asia [87]. BSE was initially established as the Native Share & Stock Brokers’ Association headquartered in Mumbai, India. Brokers and dealers used to congregate under banyan trees to do business in the past. The Securities Contracts (Regulation) Act officially recognized the Bombay Stock Exchange as an exchange in 1957 [88]. BSE’s On-Line Trading System (BOLT), a fully automated trading platform, has completely replaced the open outcry system and was introduced by the BSE in 1995 [89]. The Exchange transitioned from being only a group of brokers in 2005 to becoming a corporate company. A board of directors leads the Exchange’s administrative structure, which also includes a governing council and management that oversees day-to-day operations. The BSE became India’s first listed stock exchange in 2017 [90]. Today, the BSE offers a reliable and open market for trading in stocks, foreign exchange, debt instruments, derivatives, and mutual funds. The largest SME platform in India, BSE SME, has listed more than 250 firms and is expanding steadily [87]. Indian Clearing Corporation Limited, a wholly owned subsidiary of BSE, serves as the primary counterparty to all deals made on the BSE trading platform. It also offers full novation, ensuring the payment of all legitimately made trades. The S&P BSE SENSEX, a popular equity index offered by BSE, is traded on major exchanges throughout the world, including the EUREX and those of the BRICS countries (Brazil, Russia, China, and South Africa).
3. Methodological Approach
This section discusses the methodology adopted to complete the research process. The quest is to reach the goal through quantifiable outcomes, which has shaped this section. Here, specifically to this research, the methodological approach has kept the commitment to tracking applied methods, the selection process of the stock market, the criteria for selecting the energy sector, the formation of an index, the selection of companies representing the energy sector, economic crisis impact assessment, and know-how of the risk exposure assessment [91]. The main theme of the research is to measure the impact of crisis situations, specifically the COVID-19 situation and the Russia–Ukraine conflict, on energy sector companies. The measurement is based on the stock valuation and the market capitalization of some selected companies representing the energy sector in the stock market of India. Risk exposure is assessed by developing a risk exposure matrix based on some selected criteria, which can be a threat to the sector. The matrix provides the risk exposure of those selected companies incorporated in the study.
3.1. Methods Adopted
The research adopted a descriptive research design to keep the study quantifiable. A longitudinal study was conducted using five years of data from January 2018 to August 2022. Stock market data were collected from secondary sources, which are publicly available and accessible freely. However, the data were modified as per the requirement to process the desired information. A selection of top ten companies as of August 2022 from the S&P BSE Energy was incorporated in the study, and these companies act as the sample representation of the industry. The selection process of these companies is discussed in the following section. S&P BSE Energy Index and selected companies are self-explanatory for the available data which can be accessed as they are in the form without any adjustments or manipulations. Technical analysis was performed to analyze the trend and impact, which will keep the results more accurate with their precision values. The risk exposure matrix was based on the company’s performance. The energy sector key indicator evaluation was also included to create the matrix. This matrix provides a map of the chances to be stuck in a risk situation for a company.
The rationality behind the selection of these methods is presented in two parts as impact assessment and risk exposure prediction are the most basic requirements for any company [19]. Risk exposure analysis can provide the effect based on the magnitude of cause and intensity of the situation as the independent variable, which means that the magnitude of the dependent variable can be derived from the independent variable. Further, the risk exposure prediction is based on two criteria, namely impact/severity (insignificant—1, minor—2, moderate—3, major—4, catastrophic—5), and likelihood/probability (very Likely—1, likely—2, possible—3, unlikely—4, very unlikely—5), framed on two axes forming a 5 × 5 matrix quantifying the chances of occurrence of future risk.
3.2. Stock Market Selection Process
The stock market is the place where buyers and sellers meet to trade for shares of publicly held companies listed in that particular exchange. The “stock market” and “stock exchange” are both interchangeably used for the same purpose and sense in formal trading. There are many stock exchanges worldwide, and almost every country has one national-level stock exchange and several state-level or locally governed exchanges.
National-level recognized exchanges attract investments from international investors and traders called foreign financial institutions (FFIs). They also provide companies with a wider window to increase their wealth and market capitalization. As per the latest record of 2022, the major 21 stock exchanges from the world are ranked (Table 1) and include the presence of India. Ranks 8 and 9 are secured by the Bombay Stock Exchange (BSE) and the National Stock Exchange (NSE), both from India. The vision of India to grow to a USD 5 trillion economy by 2024–2025 has provided a tremendous impetus for the stock exchanges to grow both domestic as well as foreign investments. Both BSE and NSE are comparable to each other, but the global market is more focused on BSE to see the country’s stock market performance. The BSE holds a market capitalization of USD 3.96 trillion, with the listing of all leading companies operationalized in the country.

Table 1.
World Major Stock Exchanges Ranked by Market Capitalization.
3.3. Sector Selection Criteria
BSE carries a wide variety of sectoral classifications. Overall, 19 categories are included—S&P BSE Basic Materials, S&P BSE Consumer Discretionary Goods & Services, S&P BSE Energy, S&P BSE Fast Moving Consumer Goods, S&P BSE Finance, S&P BSE Healthcare, S&P BSE Industrials, S&P BSE Information Technology, S&P BSE Telecom, S&P BSE Utilities, S&P BSE Auto, S&P BSE BANKEX, S&P BSE Capital Goods, S&P BSE Consumer Durables, S&P BSE Metals, S&P BSE Oil & Gas, S&P BSE Power, S&P BSE Realty, and S&P BSE TECK (Figure 2). This sector or industry categorization is based on the type of operations and listing in the stock exchange after the permission obtained from the Securities Exchange Board of India (SEBI) through a very organic process. The above-mentioned 19 sectors are dependent on each other directly or indirectly for their operations, but almost all companies depend upon energy sector companies for their requirements [93]. So, the greater the effect on energy companies is, the greater the direct effect on other companies will be. The criteria chosen for the sectoral selection are as follows: (1) the most desired sector [94], (2) dependency of other industries on the sector [95], (3) the fastest growing sector [96], (4) a more lucrative sector witnessing startup/expansion/investment from other sectors [97], and (5) the fastest transforming sector [98].
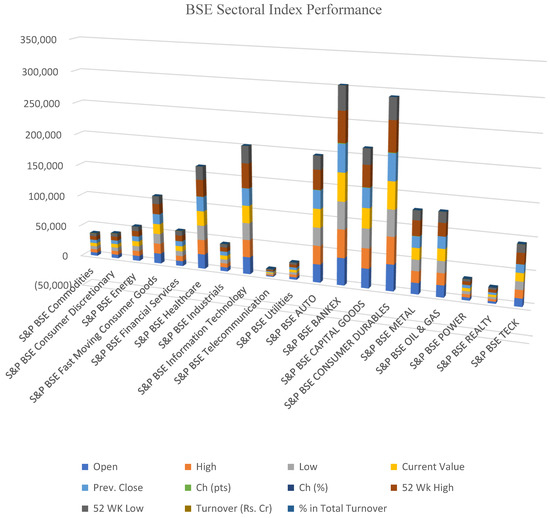
Figure 2.
BSE Sectoral Index Performance. Source: https://www.bseindia.com/Sensex/IndexHighlight.html?type=4 (accessed on 2 October 2022 [93].
The sectoral representation (Figure 2) shows a clear depiction of 19 sectors based on their performances. The indicators are opening price, day high value, day low value, closing value, previous day closing value, change in points, change in percentage, 52-week high value, 52-week low value, turnover, and the percentage of total turnover and are the base information for any interpretation. S&P BSE Energy shows comparatively better performance, although this is not the best among sectors. This is very natural since other sectors are also vital in the economy, providing financial support and production. However, the data can be extracted for meaningful interpretations as per the requirement during analysis and generation of results solving the framed research problem.
3.4. S&P BSE Energy Index Company Selection
The S&P BSE Energy Index comprises twenty-seven companies representing the industry [17]. All these companies are leading the energy sector ranked based on their market capitalization (Table 2) [99]. Reliance Industries Ltd. is ranked 1st with market capitalization of INR 16.10 trillion, and Asian Energy Services Ltd. is ranked 27th with a sum of INR 2.78 billion market capitalization. The index is formed based on the tracking of performance of companies, and best performers are selected for the sectoral representation. The difference in market capitalization is clearly visible among the representative companies, which shows the inclusion based on a high variation maintaining a higher contribution from the sector [99].
Table 2.
S&P BSE Energy Index Companies.
This sector majorly includes companies from Oil & Gas, Metal Products & Mining, and Chemical & Petrochemical, with 90.57%, 8.58%, and 0.86%, respectively, of free-float market capitalization [100]. These rankings are based on the current date data. However, these rankings continuously change with the performance of specific companies. Currently, many companies are adding renewable energy generation to their portfolio, but a separate listing of companies is not available. Since the S&P BSE Energy Index has already selected the representative companies, this study also focuses on these companies for analysis. The S&P BSE Energy Index itself is considered to draw the main understanding of the study and further conclusions as the outcome of the research.
3.5. Aspects of Economic Crisis and Risk Exposure Evaluation
This research considers two aspects of economic crisis, namely COVID-19 and the Russia–Ukraine conflict. These two situations have affected almost all industries around the globe. This research assesses the impact of these two crisis situations on the S&P BSE Energy Index. These two situations arose one after another within the gap of a very short time. COVID-19 blocked the flow of the economy with the government imposition of lockdowns for more than three years. As the COVID-19 crisis was winding down, the Russia–Ukraine conflict turned ugly and erupted into a war. Now this war has continued for more than two hundred days; it dragged down European economies, and at the same time, its effect is seen throughout the world economy. The analysis of this research is based on interpreting the S&P BSE Energy Index performance during these two crisis situations. For this purpose, the scenario analysis presented for this specific period looks at the movement of the S&P BSE Energy Index and some of the representative companies’ reactions to the situation in the stock market. The energy sector is the provider of fuel to all industries, so the downfall of the energy sector will drag down all industries. It may have a better performance, because other industries are depending on it, or it may also face the same challenges as other industries affected by the system. Analysis of this situation can lead to a clear understanding of the performance of the S&P BSE Energy Index during crises. This will further represent the base for the analysis of risk situations and assessment of risk exposure (Figure 3). The matrix can be 3 × 3 or more [101] for different cases. This risk exposure assessment matrix is based on 5 × 5, where Risk = Impact X Probability can be measured by calculating the respective values. This study applies this matrix to assess the risk exposure of the S&P BSE Energy Index and the representative companies [101].
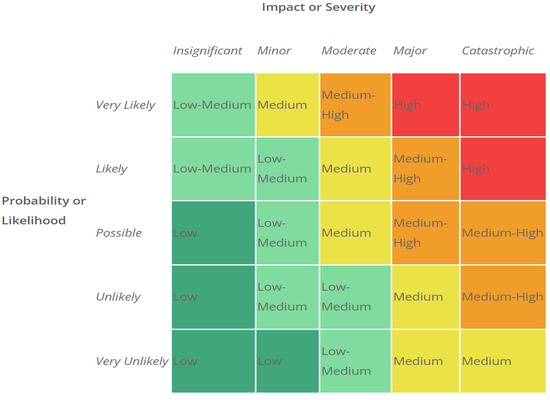
Figure 3.
Risk Exposure Assessment Matrix. Source: http://apppm.man.dtu.dk/index.php/Impact_and_Probability_in_Risk_Assessment (accessed on 1 October 2022). [101].
4. Analysis and Results
An analytical view of the secondary data available is drawn with a critical understanding in this section, leading to the results derived. This section is broadly presented in three subsections: COVID-19, Russia–Ukraine conflict, and the risk exposure assessment. All analysis is based on secondary data, which are interpreted with logical reasoning and evident support. Furthermore, an additional paragraph summarizes the result outcomes based on the analysis of three subsections. The main theme of this section is the assessment of the movement of the S&P BSE Energy Index and representative companies during crises. The S&P BSE Energy Index holds Reliance Industries Ltd., Adani Total Gas Limited, Oil & Natural Gas Corp Ltd., Coal India Ltd., Coal India Ltd., Indian Oil Corp Ltd., Bharat Petroleum Corp Ltd., Gail India Ltd., Gujarat Gas Ltd., Hindustan Petroleum Corp Ltd., and Petronet LNG Ltd. (Table 2) respectively arranged from the 1st rank to 10th rank based on their market capitalization. These companies are considered as the sample representative of the industry for analyzing the situation during the time of crisis. A similar method is applied for the analysis of both crisis scenarios. However, the month and year of the crisis scenario are different in both cases. Results are drawn by interpreting the analysis aligned with the aim of the study.
4.1. COVID-19 Situation Impact on S&P BSE Energy Index
The S&P BSE Energy Index is presented in Figure 4, showing the Index performance for the period of 30 January 2020–30 January 2022. India imposed a nationwide lockdown in March 2020 to combat the spread of the virus, which was further extended to May 2020. As demonstrated (Figure 5), the S&P BSE Energy Index fell from 5000 to 3000 during this same time period, which had an impact on the Index’s performance. This fall can be attributed to the decrease in industrial energy demand due to the countrywide strict lockdown. However, the market started growing slowly and recovered soon to showcase a growth trajectory visible in the Index performance, which soared from around 5000 in June 2020 to above 8000 in November 2021. This trend can be attributed to the rise in demand for energy and power demand from hospitals, essential services, and the residential sector. It is clearly visible that the S&P BSE Energy Index was affected only in the beginning because of the emotional and psychological panic of investors. Further, it kept recovering and reached another high level on a continuous growth trend. Government and private parties were in the push to provide essential services. India is a vast country, where the energy sector is the basic fuel for the economy.
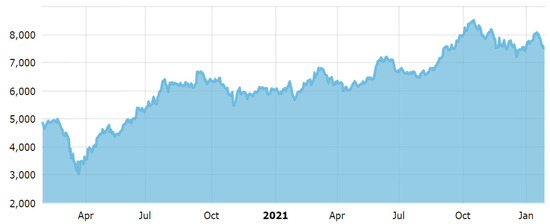
Figure 4.
S&P BSE Energy Index Performance January 2020–January 2022. Source: https://www.bseindia.com/sensex/code/90 (accessed on 24 August 2022) [17].
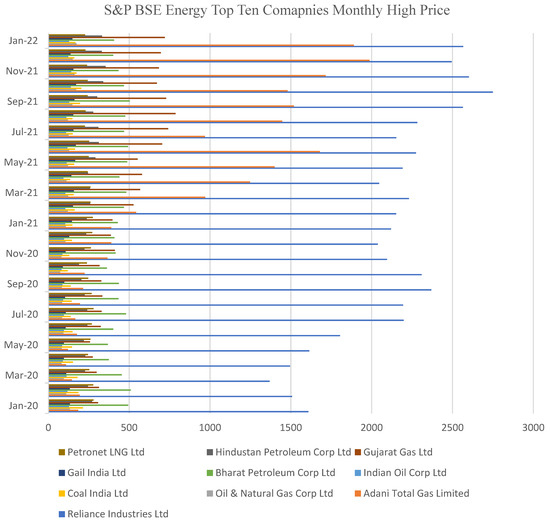
Figure 5.
S&P BSE Energy Index Top Ten Companies’ Monthly Performance January 2020–January 2022. Source: https://www.bseindia.com/markets/equity/EQReports/StockPrcHistori.aspx?expandable=7&scripcode=542066&flag=sp&Submit=G (accessed on 11 October 2022) [102].
The S&P BSE Energy Index is presented in Figure 5, showing the Index performance for the period of 30 January 2020–30 January 2022. India imposed a nationwide lockdown in March 2020 to combat the spread of the virus, which was further extended to May 2020. As demonstrated (Figure 5), the S&P BSE Energy Index fell from 5000 to 3000 during this same time period and had an impact on the Index’s performance. This fall can be attributed to the decrease in industrial energy demand due to the countrywide strict lockdown. However, the market started growing slowly and recovered soon to showcase a growth trajectory visible in the Index performance, which soared from around 5000 in June 2020 to above 8000 in November 2021. This trend can be attributed to the rise in demand for energy and power demand from hospitals, essential services, and the residential sector. It is clearly visible that the S&P BSE Energy Index was affected only in the beginning because of the emotional and psychological panic of investors. Further, it kept recovering and reached another high level on a continuous growth trend. Government and private parties were in the push to provide essential services. India is a vast country, where the energy sector is the basic fuel for the economy.
4.2. Russia–Ukraine Conflict Impact on S&P BSE Energy Index
The energy sector throughout the world is facing severe impacts due to the Russia–Ukraine conflict, and the S&P BSE Energy Index is no exception. The S&P BSE Energy Index performance (Figure 6) has seen constant fluctuations ever since the conflict started and was at its lowest on 24 February at 7112.85. The BSE Energy Index performance recovered slowly and reached a high of 8794.95 in April; however, it again fell to 7416.05 in June. The Index again recovered in August and reached the peak of 8882.62 but started to fall again towards September. Overall, there is a constant fluctuation in the BSE Energy Index performance when observed over the time period from the start of the conflict between Russia and Ukraine to the present time. These fluctuations can be attributed to the fact that India is one of the many countries that are heavily reliant on energy imports from Russia. The energy supply chain from Russia is disrupted as a result of sanctions and other limitations. India, a country with a shortage of both oil and natural gas, finds it more challenging due to the growing prices and shortage of supply to fulfill its energy demands.
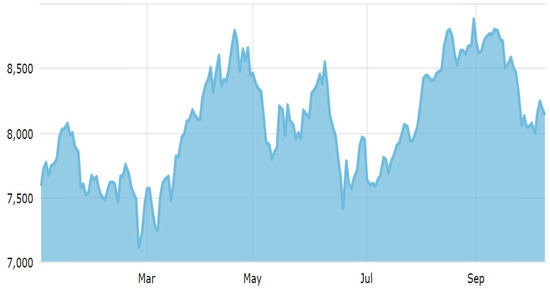
Figure 6.
S&P BSE Energy Index Performance January 2022–October 2022. Source: https://www.bseindia.com/sensex/code/90 (accessed on 24 August 2022) [17].
The monthly performance of the top 10 companies from the S&P BSE Energy Index during the period January 2022–October 2022 (Figure 7) shows how these companies have performed during the same time period when the conflict between Russia–Ukraine is still ongoing. The monthly high price of the top 10 companies fell when the war started in February 2022 and has been falling ever since. For instance, Gujarat Gas Ltd. started with a high price of INR 721.15 in January, which fell to its lowest of INR 503.40 in August. Bharat Petroleum Corp. Ltd. started at a high of INR 406.75 in January 2022 and fell to its lowest of INR 314.80 in October 2022. Indian Oil Corp Ltd. started at a high of INR 128 in January 2022 and fell to 68.15 in October 2022. Adani Total Gas Ltd. is, however, and exception as it has witnessed an increase in its monthly high from INR 1890 in January 2022 to 3816.30 in August 2022. Indian energy companies have been forced to progressively raise fuel prices in order to reduce their potential losses as a result of the current geopolitical crisis. Due to import restrictions and Western sanctions on Russia, India’s energy systems are under pressure, and even a sizable state-owned organization, namely Oil and Natural Gas Corp. Ltd. (ONGC), which holds interests in Russian oil and gas reserves, has had difficulty shipping and trading its equity oil.
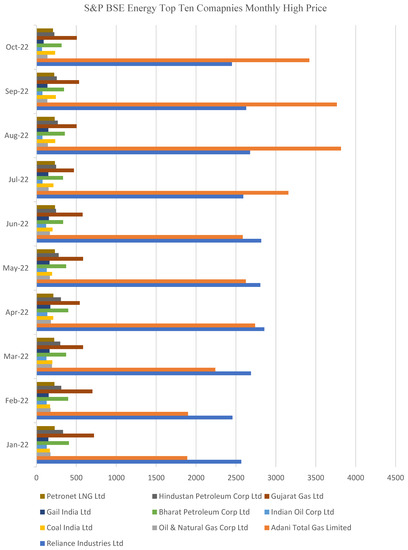
Figure 7.
S&P BSE Energy Index Top Ten Companies’ Monthly Performance January 2022–October 2022. Source: https://www.bseindia.com/markets/equity/EQReports/StockPrcHistori.aspx?expandable=7&scripcode=542066&flag=sp&Submit=G (accessed on 11 October 2022) [102].
4.3. S&P BSE Energy Index Risk Exposure Assessment
The risk exposure of the S&P BSE Energy Index and the top ten companies representing the sector is assessed and presented in Figure 8, providing the trend of probability or likelihood and the impact or severity for these companies based on their high price fluctuations responding to the different scenarios. The current analysis is specifically limited to the above-said scenarios of the COVID-19 crisis and the Russia–Ukraine conflict. Based on the data trend, S&P BSE Energy Index and the representative companies are placed in a specific block of the matrix as per the cross section of these two dimensions. The interpretations (Figure 4) of exposure are written (Figure 8) justifying the current situation of stocks. There are 25 blocks representing the 5 × 5 matrix. Each stock has been placed in a specific block based on its performance. Altogether, companies are placed mostly in the low-risk zone, except for a few stocks in a comparatively challenging situation entering a higher risk. The S&P BSE Energy Index is also in the higher probability zone, reflecting a moderate impact. Still, the S&P BSE Energy Index is affected and shows a medium risk exposure.
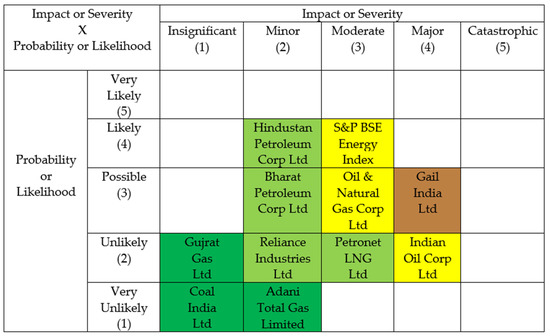
Figure 8.
S&P BSE Energy Index and Top Ten Companies’ Risk Exposure. Source: Author’s contribution.
All ten companies representative of S&P BSE Energy Index can be ranked as (1) Coal India Ltd. < (2) Gujrat Gas Ltd. < (3) Adani Total Gas Limited < (4) Reliance Industries Ltd. < (5) Bharat Petroleum Corp Ltd. < (6) Hindustan Petroleum Corp Ltd. < (7) Petronet LNG Ltd. < (8) Oil & Natural Gas Corp Ltd. < (9) Indian Oil Corp Ltd. < (10) Gail India Ltd. (Figure 8) in the increasing order of risk exposure comparatively. The major criteria considered are price fluctuation, general performance, COVID-19 situation, Russia–Ukraine conflict, market capitalization, business internationalization, and sectoral investment and diversification. The rankings (Table 2) do not show a similar trend in the risk exposure matrix. The reason behind this is that the profile and portfolio structure of companies make them decide their risk appetite. However, the S&P BSE Energy Index itself is in the yellow zone of risk exposure because the major companies of this sector have diversified business in other sectors too.
Analysis has provided the critical evaluation of the S&P BSE Energy Index and the top ten companies from the sector. Both scenarios are presented, and the first scenario was the COVID-19 situation. During the pandemic, the S&P BSE Energy Index and its constituent companies were affected only in the beginning, which brought the index down, and the monthly high price came down with many fluctuations. However, the pandemic could not stop the recovery and the bouncing back of the energy sector. The energy stocks regained the positive move and reached new heights. The second scenario is the Russia–Ukraine conflict, which has impacted the S&P BSE Energy Index and its stocks with very high volatility with everyday fluctuations. The reason is that Russia is one of the major suppliers of crude oil and gas to the world market, and at the same time Ukraine has many products and services for the world. India is one of the countries having very strong diplomatic and commercial trade ties with both countries. This conflict has affected the energy stocks of the S&P BSE. The risk exposure provides an overall understanding of the current status of stocks and of whether they are at risk. The stocks of Reliance Industries Ltd., Adani Total Gas Limited, Oil & Natural Gas Corp Ltd., Coal India Ltd., Coal India Ltd., Indian Oil Corp Ltd., Bharat Petroleum Corp Ltd., Gail India Ltd., Gujarat Gas Ltd., Hindustan Petroleum Corp Ltd., and Petronet LNG Ltd. (Table 2) are fundamentally strong, and their ranking justifies their worthiness for investors.
5. Conclusions and Policy Implications
The results demonstrate that the economic crisis had an impact on S&P BSE Energy companies. The answer to the research question is provided according to two different scenarios. For the first scenario, the COVID-19 pandemic, the S&P BSE Energy Index performance (Figure 4) and the performance of the top ten companies from the Index (Figure 6) were assessed. The COVID-19 pandemic affected the Index and stocks only in the beginning when the market was scared psychologically; very shortly after, it started to drive fast to touch new heights and kept growing. This finding validates the rational choice theory as demonstrated by the way the stock market reacted to the initial phase of COVID-19 when the psychological fear of people determined the social behavior in reaction to the crisis. The second scenario of the Russia–Ukraine conflict, which is still ongoing, shows a deviated performance compared to the effect of the COVID-19 pandemic as the stocks are fluctuating too much. A stronger effect can be observed in this situation, which is preventing the stocks and Index from growing.
The current state of the S&P BSE Energy companies demonstrates that the sector was not much affected by COVID-19 and provided investment opportunities when the stock prices were low. Overall, the Indian energy sector and stocks are sound and internally performing with their production and supplies, but sustainability on the criteria of high price is a challenging question. The current risk exposure (Figure 8) is observed through the matrix for the index, and the top ten companies are placed according to their current exposure based on their performances. The research concludes that the stock market is driven by external factors which mostly trigger the emotion of investors and other stakeholders. Energy stocks are the fuel running the economy and industries, which continue production and supply on a priority basis. The S&P BSE Energy Index and its top ten contributors are stocks that attract investment from all types of investors. The risk is very low with most of these stocks, and the future is bright. The energy sector is one of the least affected sectors compared to other sectors. Energy stocks are currently at a lower price, providing opportunities for investors. They have the potential to benefit in a dual way, through price rise profitability and a high dividend yield on investment.
The process applied to solve the aforesaid research problem must be accommodated with the relevant discussion [103]. The research has a wide range of contributions for researchers, companies, government, and investors, providing a summarized view of the reaction of an energy index and energy stocks to an economic crisis. The risk exposure of S&P BSE Energy companies demonstrated through the matrix and the order of risk exposure in the ascending order for selected top ten companies are the main contribution of this research for the stakeholders. This research has major policy implications. Governments can develop a strategic response to the crisis focusing on two priority areas: competition and restoring long-term growth. As part of this strategic response, the government can create policies that can help the stock market cope better with the likely impact of the downturn on the drivers of long-term economic growth. Investors can better understand the market and how it reacts in specific situations of economic crises, and the findings of this research help them better manage their risk profile.
Researchers can further investigate based on the future recommendations of this research. The study can contribute to future studies leading to drawing a structure for the risk reaction of stocks. Many studies can use this outcome as their base for finding other sector situations and the reaction of stocks. Other stock markets also represent a good opportunity for analysis and finding a comparative result. This can lead to the choice of a specific stock market or a specific sector. The continuation of the study will detail the Europe energy crisis and the future of energy sector companies and stock values in Europe and Poland [104,105]. Methods of examining the statistical regularities of the structure, dynamics, and interdependencies (descriptive statistics); selected econometric models and time series analysis; and selected methods of verification of statistical hypotheses depending on the statistical data stock prices of energy companies from select European stock exchanges or selected companies for different stock exchanges can be a case study based on companies with high capitalization and sectoral indices. Other techniques of analysis such as multi-criteria decision making (MCDM) can be applicable. Decision making trial and evaluation laboratory (DEMATEL) [106], technique for order performance by similarity to ideal solution (Topsis) [107], and cognitive [108,109] methods can be better applied to draw more accurate results. A similar assessment may have a divergent view to navigate a new research problem.
Author Contributions
Conceptualization, M.T.-L.; methodology, U.S.S. and G.A.S.; validation, I.B. and M.T.-L.; formal analysis, U.S.S.; investigation, G.A.S.; resources, M.T.-L.; data curation, U.S.S.; writing—original draft preparation, G.A.S.; writing—review and editing, U.S.S., M.T.-L., G.A.S. and I.B.; visualization, I.B.; project administration, M.T.-L.; funding acquisition, I.B. and M.T.-L. All authors have read and agreed to the published version of the manuscript.
Funding
This research received no external funding. The APC was funded by the University of Szczecin.
Institutional Review Board Statement
Our research is based on the secondary data from open sources. This research is not applied to humans as such to harm anyone. This is our individual selection of the area and topic of research. We take the responsibility for the implementation of the research.
Informed Consent Statement
Not applicable.
Data Availability Statement
Data are not available for public access but can be available upon individual request for usage in future research.
Conflicts of Interest
The authors declare no conflict of interest.
References
- Dullien, S.; Kotte, D.J.; Márquez, A.; Priewe, J. The Financial and Economic Crisis of 2008–2009 and Developing Countries; Conférence des Nations Unies sur le Commerce et le Développement, Ed.; United Nations: New York, NY, USA, 2010; ISBN 978-92-1-112818-5. [Google Scholar]
- Mikušová, M.; Horváthová, P. Prepared for a Crisis? Basic Elements of Crisis Management in an Organisation. Econ. Res. Ekon. Istraživanja 2019, 32, 1844–1868. [Google Scholar] [CrossRef]
- Lehmann, K. Crisis? What (Type) of Crisis? The Overlapping Problems of the European Union. Rev. Sociol. Polit. 2014, 22, 33–48. [Google Scholar] [CrossRef]
- Hadziahmetovic, A.; Halebic, J.; Colakovic–Prguda, N. Economic Crisis: Challenge for Economic Theory and Policy. EJEF 2018, 6, 48–55. [Google Scholar] [CrossRef]
- Parnell, D.; Widdop, P.; May, A.; Fitzpatrick, D. The Impact of Global Economic Downturn on Sport Management. J. Glob. Sport Manag. 2021, 1–6. [Google Scholar] [CrossRef]
- Nützenadel, A. The Financial Crisis of 2008—Experience, Memory, History. J. Mod. Eur. Hist. 2021, 19, 3–7. [Google Scholar] [CrossRef]
- Lundgren, T.; Marklund, P.-O.; Zhang, S. Industrial Energy Demand and Energy Efficiency—Evidence from Sweden. Resour. Energy Econ. 2016, 43, 130–152. [Google Scholar] [CrossRef]
- Schuh, G.; Gudergan, G.; Feige, B.A.; Buschmeyer, A.; Krechting, D. Business Transformation in the Manufacturing Industry—How Information Acquisition, Analysis, Usage and Distribution Affects the Success of Lifecycle-Product-Service-Systems. Procedia CIRP 2015, 30, 335–340. [Google Scholar] [CrossRef][Green Version]
- Verhoef, L.A.; Budde, B.W.; Chockalingam, C.; García Nodar, B.; van Wijk, A.J.M. The Effect of Additive Manufacturing on Global Energy Demand: An Assessment Using a Bottom-up Approach. Energy Policy 2018, 112, 349–360. [Google Scholar] [CrossRef]
- Take Action for the Sustainable Development Goals—United Nations Sustainable Development. Available online: https://www.un.org/sustainabledevelopment/sustainable-development-goals/ (accessed on 30 May 2022).
- Power Sector in India: Market Size, Industry Analysis, Govt Initiatives|IBEF (Govt. Trust). Available online: https://www.ibef.org/industry/power-sector-india (accessed on 25 August 2022).
- SEBI|Details of Stock Exchanges. Available online: https://www.sebi.gov.in/stock-exchanges.html (accessed on 25 August 2022).
- BSE (Formerly Bombay Stock Exchange)—LIVE Stock/Share Market Updates from Asia’s Premier Stock Exchange. Get All the Current Stock/Share Market News; Real-Time Information to Investors on S&P BSE SENSEX, Stock Quotes, Indices, Derivatives and Corporate Announcements. Available online: https://www.bseindia.com/ (accessed on 25 August 2022).
- NSE—National Stock Exchange of India Ltd.: Live Share/Stock Market News & Updates, Quotes-Nseindia.Com. Available online: https://www.nseindia.com/ (accessed on 25 August 2022).
- NIFTY Energy. Available online: https://www.niftyindices.com/indices/equity/thematic-indices/nifty-energy (accessed on 25 August 2022).
- BSE Sensex—Live Sensex and Stock Values. Available online: https://www.bseindia.com/sensex/code/90 (accessed on 24 August 2022).
- The Global Risks Report 2022, 17th ed.; World Economic Forum: Geneva, Switzerland, 2022; ISBN 978-2-940631-09-4.
- Yousfi, M.; Dhaoui, A.; Bouzgarrou, H. Risk Spillover during the COVID-19 Global Pandemic and Portfolio Management. JRFM 2021, 14, 222. [Google Scholar] [CrossRef]
- Singh, U.S. Risk Analysis and Mitigation Plan for Steel Tube Manufacturing Company; LAP LAMBERT Academic Publishing: Saarbrücken, Germany, 2013; ISBN 978-3-659-42875-3. [Google Scholar]
- Wittek, R. Rational Choice Theory. In Theory in Social and Cultural Anthropology: An Encyclopedia; Sage: Thousand Oaks, CA, USA, 2013; pp. 688–690. ISBN 978-1-4129-9963-2. [Google Scholar]
- Mou, J. Research on the Impact of COVID19 on Global Economy. IOP Conf. Ser. Earth Environ. Sci. 2020, 546, 032043. [Google Scholar] [CrossRef]
- Li, Z.; Farmanesh, P.; Kirikkaleli, D.; Itani, R. A Comparative Analysis of COVID-19 and Global Financial Crises: Evidence from US Economy. Econ. Res. Ekon. Istraživanja 2022, 35, 2427–2441. [Google Scholar] [CrossRef]
- Mbah, R.E.; Wasum, D. Russian-Ukraine 2022 War: A Review of the Economic Impact of Russian-Ukraine Crisis on the USA, UK, Canada, and Europe. ASSRJ 2022, 9, 144–153. [Google Scholar] [CrossRef]
- Prohorovs, A. Russia’s War in Ukraine: Consequences for European Countries’ Businesses and Economies. JRFM 2022, 15, 295. [Google Scholar] [CrossRef]
- Asian Development Bank. Impact Evaluation of Energy Interventions: A Review of the Evidence; Asian Development Bank: Manila, Philippines, 2019. [Google Scholar]
- International Energy Agency. India Energy Outlook 2021; OECD: Paris, France, 2021; ISBN 978-92-64-97691-7. [Google Scholar]
- Rohit, A.K.; Rangnekar, S. An Overview of Energy Storage and Its Importance in Indian Renewable Energy Sector: Part II—Energy Storage Applications, Benefits and Market Potential. J. Energy Storage 2017, 13, 447–456. [Google Scholar] [CrossRef]
- Gould, C.F.; Jha, S.; Patnaik, S.; Agrawal, S.; Zhang, A.T.; Saluja, S.; Nandan, V.; Mani, S.; Urpelainen, J. Variability in the Household Use of Cooking Fuels: The Importance of Dishes Cooked, Non-Cooking End Uses, and Seasonality in Understanding Fuel Stacking in Rural and Urban Slum Communities in Six North Indian States. World Dev. 2022, 159, 106051. [Google Scholar] [CrossRef]
- Akter, S.; Bagchi, K. Is Off-Grid Residential Solar Power Inclusive? Solar Power Adoption, Energy Poverty, and Social Inequality in India. Energy Res. Soc. Sci. 2021, 82, 102314. [Google Scholar] [CrossRef]
- Power-Infographic-August-2022.Pdf. Available online: https://www.ibef.org/industry/power-sector-india/infographic (accessed on 12 September 2022).
- Sudhakara Reddy, B.; Nathan, H.S.K. Energy in the Development Strategy of Indian Households—the Missing Half. Renew. Sustain. Energy Rev. 2013, 18, 203–210. [Google Scholar] [CrossRef]
- Murad, S.M.W.; Salim, R.; Kibria, M.G. Asymmetric Effects of Economic Policy Uncertainty on the Demand for Money in India. J. Quant. Econ. 2021, 19, 451–470. [Google Scholar] [CrossRef]
- Pelz, S.; Urpelainen, J. Measuring and Explaining Household Access to Electrical Energy Services: Evidence from Rural Northern India. Energy Policy 2020, 145, 111782. [Google Scholar] [CrossRef]
- Jackson, R.B.; Quéré, C.L.; Andrew, R.M.; Canadell, J.G.; Korsbakken, J.I.; Liu, Z.; Peters, G.P.; Zheng, B. Global Energy Growth Is Outpacing Decarbonization. Environ. Res. Lett. 2018, 13, 120401. [Google Scholar] [CrossRef]
- Ortega-Ruiz, G.; Mena-Nieto, A.; García-Ramos, J.E. Is India on the Right Pathway to Reduce CO2 Emissions? Decomposing an Enlarged Kaya Identity Using the LMDI Method for the Period 1990–2016. Sci. Total. Environ. 2020, 737, 139638. [Google Scholar] [CrossRef] [PubMed]
- Catullo, E. Chapter 5—Early Warning Indicator for Crises in an Agent-Based Macromodel. In Introduction to Agent-Based Economics; Gallegati, M., Palestrini, A., Russo, A., Eds.; Academic Press: Cambridge, MA, USA, 2017; pp. 105–124. ISBN 978-0-12-803834-5. [Google Scholar]
- Stiglitz, J.E. The Current Economic Crisis and Lessons for Economic Theory. East. Econ. J. 2009, 35, 281–296. [Google Scholar] [CrossRef]
- Mehrotra, S.; Parida, J.K. Stalled Structural Change Brings an Employment Crisis in India. Ind. J. Labour Econ. 2021, 64, 281–308. [Google Scholar] [CrossRef] [PubMed]
- Reserve Bank of India—Publications. Available online: https://m.rbi.org.in/scripts/PublicationsView.aspx?id=21035 (accessed on 14 August 2022).
- Upadhyay, R.K. Causes and the Nature of the Slowdown in the Indian Economy. Available online: https://ssrn.com/abstract=3492974 (accessed on 21 October 2019).
- Feruś, A. Development of the Payment Cards Market in Poland in the Era of the Covid-19 Pandemic. Folia Oeconomica Stetin. 2022, 22, 46–62. [Google Scholar] [CrossRef]
- Machová, R.; Korcsmáros, E.; Marča, R.; Esseová, M. An International Analysis of Consumers’ Consciousness During the Covid-19 Pandemic in Slovakia and Hungary. Folia Oeconomica Stetin. 2022, 22, 130–151. [Google Scholar] [CrossRef]
- Magwedere, M.R.; Marozva, G. The Nexus Between Bank Credit Risk and Liquidity: Does the Covid-19 Pandemic Matter? A Case of the Oligopolistic Banking Sector. Folia Oeconomica Stetin. 2022, 22, 152–171. [Google Scholar] [CrossRef]
- Musa, H.; Rech, F.; Yan, C.; Musova, Z. The Deterioration of Financial Ratios During the Covid-19 Pandemic: Does Corporate Governance Matter? Folia Oeconomica Stetin. 2022, 22, 219–242. [Google Scholar] [CrossRef]
- Fatih, C. What Can SVAR Models Tell Us About the Impact of Public Expenditure Shocks on Macroeconomic Variables in Algeria? A Slight Hint to the COVID-19 Pandemic. Folia Oeconomica Stetin. 2021, 21, 21–37. [Google Scholar] [CrossRef]
- Msomi, T.S.; Olarewaju, O.M.; Ngcobo, X. Sustaining South African Small and Medium-Sized Enterprises Through Monetary Access and Literacy in the COVID-19 ERA. Folia Oeconomica Stetin. 2021, 21, 57–75. [Google Scholar] [CrossRef]
- Hála, M.; Cvik, E.D.; Pelikánová, R.M. Logistic Regression of Czech Luxury Fashion Purchasing Habits During the Covid-19 Pandemic—Old for Loyalty and Young for Sustainability? Folia Oeconomica Stetin. 2022, 22, 85–110. [Google Scholar] [CrossRef]
- Bora, N.; Barua, N. Rescuing the Covid Stricken Economy: A Look at State Intervention in India. J. Soc. Sci. 2020, 48, 943–955. [Google Scholar]
- Chakrabarty, M.; Mukherjee, S. A Pandemic and Economic Slowdown: The Case of India. Appl. Econ. 2022, 54, 2214–2230. [Google Scholar] [CrossRef]
- Ritchie, H.; Mathieu, E.; Rodés-Guirao, L.; Appel, C.; Giattino, C.; Ortiz-Ospina, E.; Hasell, J.; Macdonald, B.; Beltekian, D.; Roser, M. Coronavirus Pandemic (COVID-19). Our World Data. 2020. Available online: https://ourworldindata.org/coronavirus/country/india (accessed on 21 September 2022).
- Pradhan, S.; Ghose, D.; Shabbiruddin. Present and Future Impact of COVID-19 in the Renewable Energy Sector: A Case Study on India. Energy Sources Part A Recovery Util. Environ. Eff. 2020, 1–11. [Google Scholar] [CrossRef]
- Shafiullah, G.; Raju, K.; Mudgal, V.; Arif, M.; Jamal, T.; Subramanian, S.; Srirajabalaguru, V.; Reddy, S.; Subramaniam, U.; Elavarasan, R. COVID-19: Impact Analysis and Recommendations for Power and Energy Sector Operation. Appl. Energy 2020, 279, 115739. [Google Scholar]
- Sahu, S.K.; Manaloor, V.; Bagchi, P. An Empirical Analysis of the Impact of COVID-19 on the Power Sector of India. Energy Res. Lett. 2022, 3, 32617. [Google Scholar] [CrossRef]
- Shekhar, J.; Suri, D.; Somani, P.; Lee, S.J.; Arora, M. Reduced Renewable Energy Stability in India Following COVID-19: Insights and Key Policy Recommendations. Renew. Sustain. Energy Rev. 2021, 144, 111015. [Google Scholar] [CrossRef]
- Boungou, W.; Yatié, A. The Impact of the Ukraine–Russia War on World Stock Market Returns. Econ. Lett. 2022, 215, 110516. [Google Scholar] [CrossRef]
- Umar, Z.; Polat, O.; Choi, S.-Y.; Teplova, T. The Impact of the Russia-Ukraine Conflict on the Connectedness of Financial Markets. Financ. Res. Lett. 2022, 48, 102976. [Google Scholar] [CrossRef]
- Lo, G.-D.; Marcelin, I.; Bassène, T.; Sène, B. The Russo-Ukrainian War and Financial Markets: The Role of Dependence on Russian Commodities. Financ. Res. Lett. 2022, 50, 103194. [Google Scholar] [CrossRef]
- Adekoya, O.B.; Oliyide, J.A.; Yaya, O.S.; Al-Faryan, M.A.S. Does Oil Connect Differently with Prominent Assets during War? Analysis of Intra-Day Data during the Russia-Ukraine Saga. Resour. Policy 2022, 77, 102728. [Google Scholar] [CrossRef]
- Konrad, S.; Karol, W. Corporate Dividend Policy in the Context of the SARS-CoV-2 Pandemic. In Sustainable Economic Development and Advancing Education Excellence in the era of Global Pandemic, Proceedings of the 36th International Business Information Management Association Conference (IBIMA), Granada, Spain, 4–5 November 2020; Soliman, K.S., Ed.; Inter-national Business Information Management Association (IBIMA): Granada, Spain, 2020; pp. 13013–13022. [Google Scholar]
- Rutkowska-Ziarko, A. Market and Accounting Measures of Risk: The Case of the Frankfurt Stock Exchange. Risks 2022, 10, 14. [Google Scholar] [CrossRef]
- Ling, A.; Sun, J.; Wang, M. Robust Multi-Period Portfolio Selection Based on Downside Risk with Asymmetrically Distributed Uncertainty Set. Eur. J. Oper. Res. 2020, 285, 81–95. [Google Scholar] [CrossRef]
- Chiu, W.H. Risk Aversion, Downside Risk Aversion and Paying for Stochastic Improvements. Geneva Risk Insur. Rev. 2012, 37, 1–26. [Google Scholar] [CrossRef]
- Bawa, V.S. Optimal Rules for Ordering Uncertain Prospects. J. Financ. Econ. 1975, 2, 95–121. [Google Scholar] [CrossRef]
- Sharpe, W.F. Capital Asset Prices: A Theory of Market Equilibrium Under Conditions of Risk. J. Financ. 1964, 19, 425–442. [Google Scholar] [CrossRef]
- Lintner, J. The Valuation of Risk Assets and the Selection of Risky Investments in Stock Portfolios and Capital Budgets. Rev. Econ. Stat. 1965, 47, 13. [Google Scholar] [CrossRef]
- Mossin, J. Equilibrium in a Capital Asset Market. Econometrica 1966, 34, 768–783. [Google Scholar] [CrossRef]
- Hogan, W.W.; Warren, J.M. Toward the Development of an Equilibrium Capital-Market Model Based on Semivariance. J. Financ. Quant. Anal. 1974, 9, 1–11. [Google Scholar] [CrossRef]
- Harlow, W.V.; Rao, R.K.S. Asset Pricing in a Generalized Mean-Lower Partial Moment Framework: Theory and Evidence. J. Financ. Quant. Anal. 1989, 24, 285–311. [Google Scholar] [CrossRef]
- Rutkowska-Ziarko, A.; Markowski, L. Accounting and Market Risk Measures of Polish Energy Companies. Energies 2022, 15, 2138. [Google Scholar] [CrossRef]
- Harlow, W.V. Asset Allocation in a Downside-Risk Framework. Financ. Anal. J. 1991, 47, 28–40. [Google Scholar] [CrossRef]
- Blake, D.; Wright, D.; Zhang, Y. Target-Driven Investing: Optimal Investment Strategies in Defined Contribution Pension Plans under Loss Aversion. J. Econ. Dyn. Control 2013, 37, 195–209. [Google Scholar] [CrossRef]
- Summer, M. Banking Regulation and Systemic Risk. Open Econ. Rev. 2003, 14, 43–70. [Google Scholar] [CrossRef]
- De Bandt, O.; Hartmann, P. Systemic Risk: A Survey; Working Paper Series; European Central Bank: Main, Germany, 2000. [Google Scholar]
- Financial Stability Review; European Central Bank: Main, Germany, 2022; p. 125.
- Hill, N.C.; Stone, B.K. Accounting Betas, Systematic Operating Risk, and Financial Leverage: A Risk-Composition Approach to the Determinants of Systematic Risk. J. Financ. Quant. Anal. 1980, 15, 595–637. [Google Scholar] [CrossRef]
- Szymczyk, Ł.; Horne, R.V.; Perez, K. Modeling Distress in US High Yield Mutual Funds Before and During the Covid-19 Pandemic. Folia Oeconomica Stetin. 2022, 22, 263–286. [Google Scholar] [CrossRef]
- Alexander, C. The Present and Future of Financial Risk Management. J. Financ. Econom. 2005, 3, 3–25. [Google Scholar] [CrossRef]
- Berkowitz, J.; O’Brien, J. How Accurate Are Value-at-Risk Models at Commercial Banks? J. Financ. 2002, 57, 1093–1111. [Google Scholar] [CrossRef]
- Adenomon, M.O.; Ojo, R.O. Autoregressive Distributed Lag Modeling of the Effects of Some Macroeconomic Variables on Economic Growth in Nigeria. Folia Oeconomica Stetin. 2020, 20, 1–19. [Google Scholar] [CrossRef]
- Obalade, A.A.; Ebiwonjumi, A.; Adaramola, A.O. Var Modelling of Dynamics of Poverty, Unemployment, Literacy and Per Capita Income in Nigeria. Folia Oeconomica Stetin. 2019, 19, 73–88. [Google Scholar] [CrossRef]
- Burns, P. The Quality of Value at Risk Via Univariate GARCH 2002. Burns Statistic Working Paper. Available online: https://papers.ssrn.com/sol3/papers.cfm?abstract_id=443540 (accessed on 13 October 2022).
- Campbell, J.Y.; Ramadorai, T.; Ranish, B. Do the Rich Get Richer in the Stock Market? Evidence from India. Am. Econ. Rev. Insights 2019, 1, 225–240. [Google Scholar] [CrossRef]
- Singh, D. Causal Relationship Between Macro-Economic Variables and Stock Market: A Case Study for India. Pak. J. Soc. Sci. 2010, 30, 263–274. [Google Scholar]
- Dutta, G.; Jha, P.; Laha, A.K.; Mohan, N. Artificial Neural Network Models for Forecasting Stock Price Index in the Bombay Stock Exchange. J. Emerg. Mark. Financ. 2006, 5, 283–295. [Google Scholar] [CrossRef]
- Khan, A.Q.; Ikram, S.; Mehtab, M. Testing Weak Form Market Efficiency of Indian Capital Market: A Case of National Stock Exchange (NSE) and Bombay Stock Exchange (BSE). Afr. J. Mark. Manag. 2011, 13, 115–127. [Google Scholar]
- Mushinada, V.N.C.; Veluri, V.S.S. Investors Overconfidence Behaviour at Bombay Stock Exchange. Int. J. Manag. Financ. 2018, 14, 613–632. [Google Scholar] [CrossRef]
- Bombay Stock Exchange (BSE) Company Overview. Available online: https://www.bseindia.com/static/about/Company_Overview.html (accessed on 1 September 2022).
- Yalawar, Y. Bombay Stock Exchange: Rates of Return and Efficiency. Indian Econ. J. 1988, 35, 1–68. [Google Scholar]
- Razdan, A. Scaling in the Bombay Stock Exchange Index. Pramana J. Phys. 2002, 58, 537–544. [Google Scholar] [CrossRef]
- Berkman, H.; Eleswarapu, V.R. Short-Term Traders and Liquidity: A Test Using Bombay Stock Exchange Data. In Proceedings of the WFA and the APFA/PACAP Conferences. J. Financ. Econ. 1998, 47, 339–355. [Google Scholar] [CrossRef]
- Azad, S.; Singh, U. A Study on the Effect of Pricing Strategy on Customer Retention in Kurdistan. Int. J. Supply Chain Manag. 2019, 8, 98–112. [Google Scholar]
- Largest Stock Exchange Operators by Market Cap 2022. Available online: https://www.statista.com/statistics/270126/largest-stock-exchange-operators-by-market-capitalization-of-listed-companies/ (accessed on 31 October 2022).
- Indices|Stock/Share Market Indices|Live Equity Indices|Index Watch|BSE. Available online: https://www.bseindia.com/Sensex/IndexHighlight.html?type=4 (accessed on 2 October 2022).
- Raźniak, P.; Dorocki, S.; Rachwał, T.; Winiarczyk-Raźniak, A. The Role of the Energy Sector in the Command and Control Function of Cities in Conditions of Sustainability Transitions. Energies 2021, 14, 7579. [Google Scholar] [CrossRef]
- Magnusson, F.L.; Bengtsson, O.W. (Eds.) Energy in Europe: Economics, Policy and Strategy; Nova Science Publishers: New York, NY, USA, 2008; ISBN 978-1-60456-829-5. [Google Scholar]
- Mahbub, T.; Ahammad, M.F.; Tarba, S.Y.; Mallick, S.M.Y. Factors Encouraging Foreign Direct Investment (FDI) in the Wind and Solar Energy Sector in an Emerging Country. Energy Strategy Rev. 2022, 41, 100865. [Google Scholar] [CrossRef]
- Pappas, D.; Chalvatzis, K.J. Energy and Industrial Growth in India: The Next Emissions Superpower? Energy Procedia 2017, 105, 3656–3662. [Google Scholar] [CrossRef]
- Schaeffer, G.J. Energy Sector in Transformation, Trends and Prospects. Procedia Comput. Sci. 2015, 52, 866–875. [Google Scholar] [CrossRef]
- Companies Ranked by Market Cap—CompaniesMarketCap.Com. Available online: https://companiesmarketcap.com/ (accessed on 1 October 2022).
- Indices Watch—S&P BSE Energy. Available online: https://www.bseindia.com/sensex/IndicesWatch_Sector.aspx?iname=ENERGY&index_Code=90 (accessed on 1 October 2022).
- Impact and Probability in Risk Assessment—Apppm. Available online: http://apppm.man.dtu.dk/index.php/Impact_and_Probability_in_Risk_Assessment (accessed on 1 October 2022).
- Stock Prices. Available online: https://www.bseindia.com/markets/equity/EQReports/StockPrcHistori.aspx?expandable=7&scripcode=542066&flag=sp&Submit=G (accessed on 11 October 2022).
- Singh, U.S.; Rutkowska, M.; Bartoszczuk, P. Renewable Energy Decision Criteria on Green Consumer Values Comparing Poland and India Aligned with Environment Policy for Sustainable Development. Energies 2022, 15, 5046. [Google Scholar] [CrossRef]
- Rutkowska, M.; Bartoszczuk, P.; Singh, U.S. Management of GREEN Consumer Values in Renewable Energy Sources and Eco Innovation in INDIA. Energies 2021, 14, 7061. [Google Scholar] [CrossRef]
- Bartoszczuk, P.; Singh, U.S.; Rutkowska, M. An Empirical Analysis of Renewable Energy Contributions Considering GREEN Consumer Values—A Case Study of Poland. Energies 2022, 15, 1027. [Google Scholar] [CrossRef]
- Piwowarski, M.; Miłaszewicz, D.; Łatuszyńska, M.; Nermend, K. Multi-Criteria Assessment of the Company’s Location Selection: A Dynamic Approach. ERSJ 2019, XXII, 215–230. [Google Scholar] [CrossRef]
- Nermend, K.; Piwowarski, M.; Borawski, M. Decision Making Methods in Comparative Studies of Complex Economic Processes Management. EIJS 2020, 652–664. [Google Scholar] [CrossRef]
- Mateusz, P.; Danuta, M.; Małgorzata, Ł.; Mariusz, B.; Kesra, N. TOPSIS and VIKOR Methods in Study of Sustainable Development in the EU Countries. Procedia Comput. Sci. 2018, 126, 1683–1692. [Google Scholar] [CrossRef]
- Mateusz Piwowarski; Uma Shankar Singh; Kesra Nermend the Cognitive Neuroscience Methods in the Analysis of the Impact of Advertisements in Shaping People’s Health Habits. Eur. Res. Stud. J. 2019, XXI, 457–471.


Publisher’s Note: MDPI stays neutral with regard to jurisdictional claims in published maps and institutional affiliations. |
© 2022 by the authors. Licensee MDPI, Basel, Switzerland. This article is an open access article distributed under the terms and conditions of the Creative Commons Attribution (CC BY) license (https://creativecommons.org/licenses/by/4.0/).