
Assessment of Greenhouse Gas Emissions from Hydrogen Production Processes: Turquoise Hydrogen vs. Steam Methane Reforming

 ,
,  , ,
, , 
Abstract
:1. Introduction
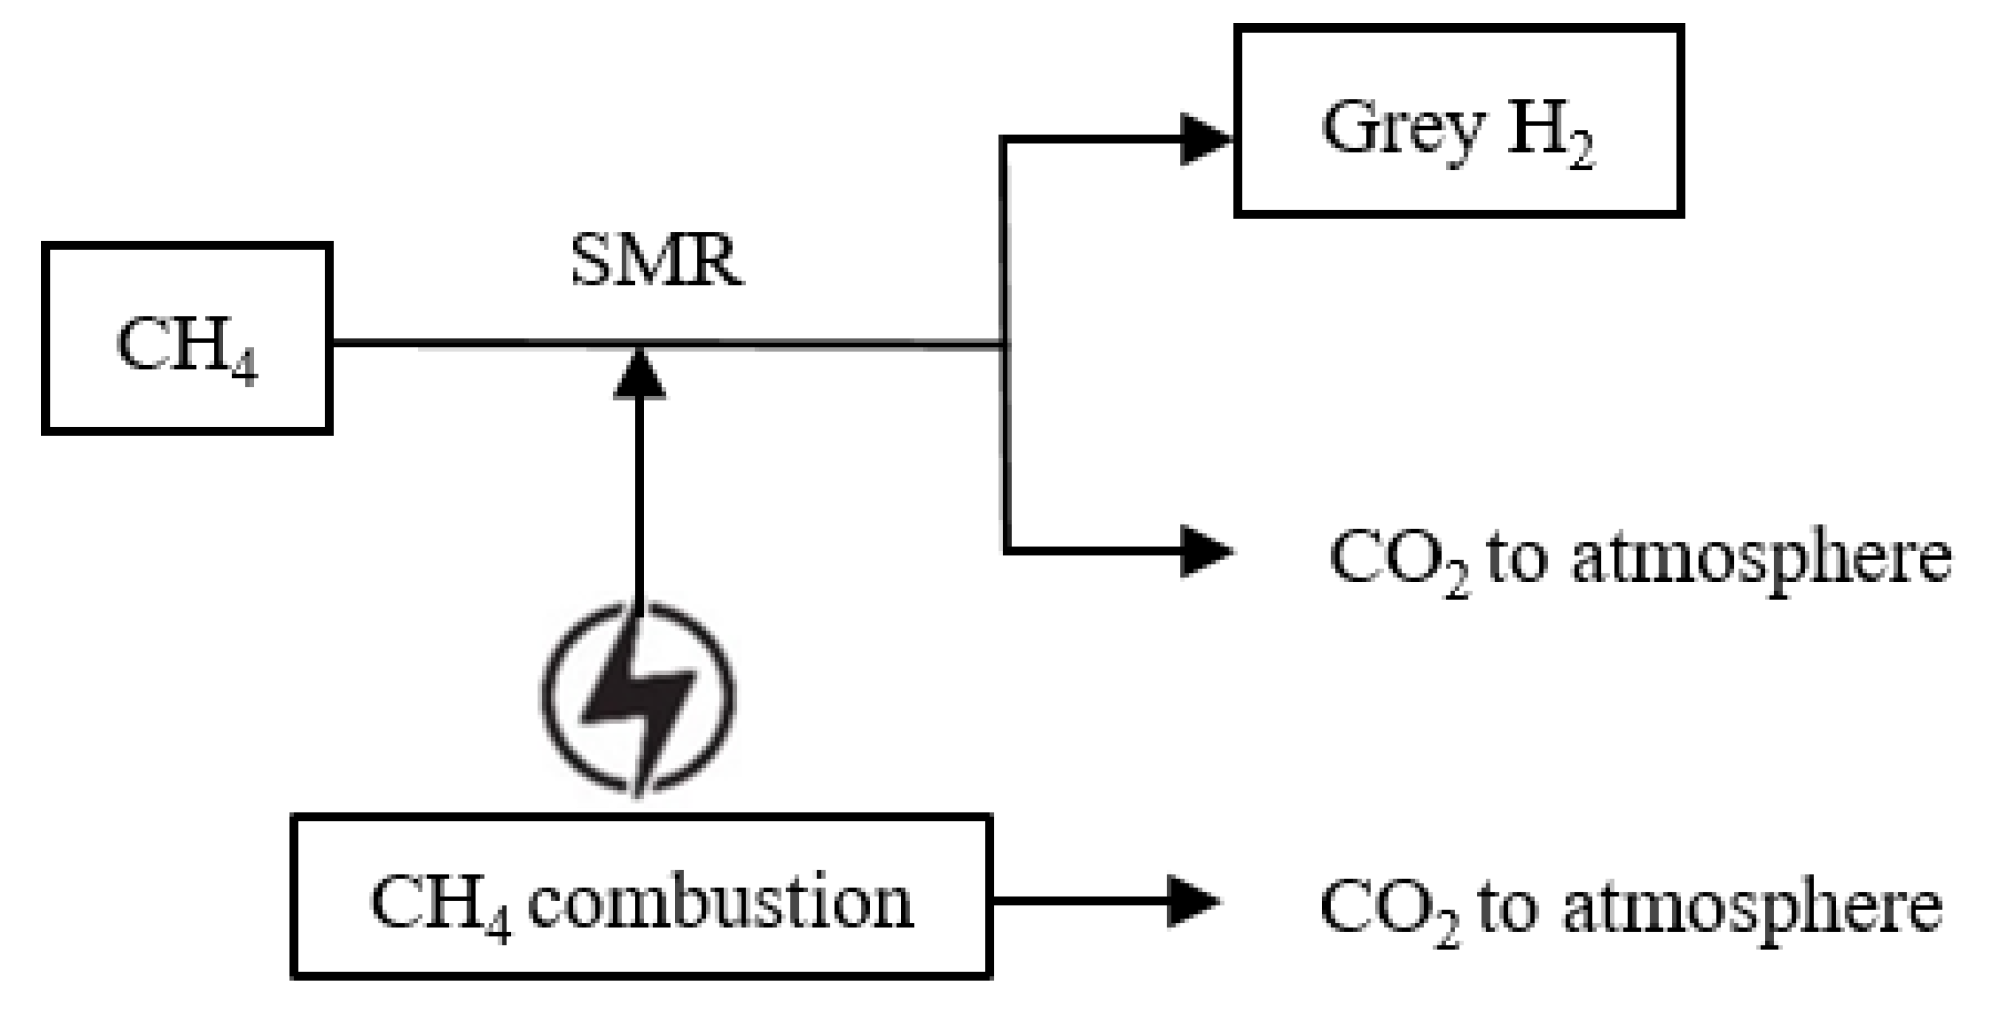
2. Emission Assessment of Grey Hydrogen (SMR Process)
2.1. Heat Source of SMR
2.2. Indirect Upstream Emissions by Grey Hydrogen
2.3. Fugitive Methane Emissions (FME) by Grey Hydrogen
3. Emission Assessment of Blue Hydrogen (SMR Process)
3.1. CO2 Capture of Blue Hydrogen and Flue-Gas Capture (FGC)
3.2. Heat Source of CO2 and Flue-Gas Capture Facility of Blue Hydrogen
3.3. Indirect Upstream Emissions and FME by Blue Hydrogen
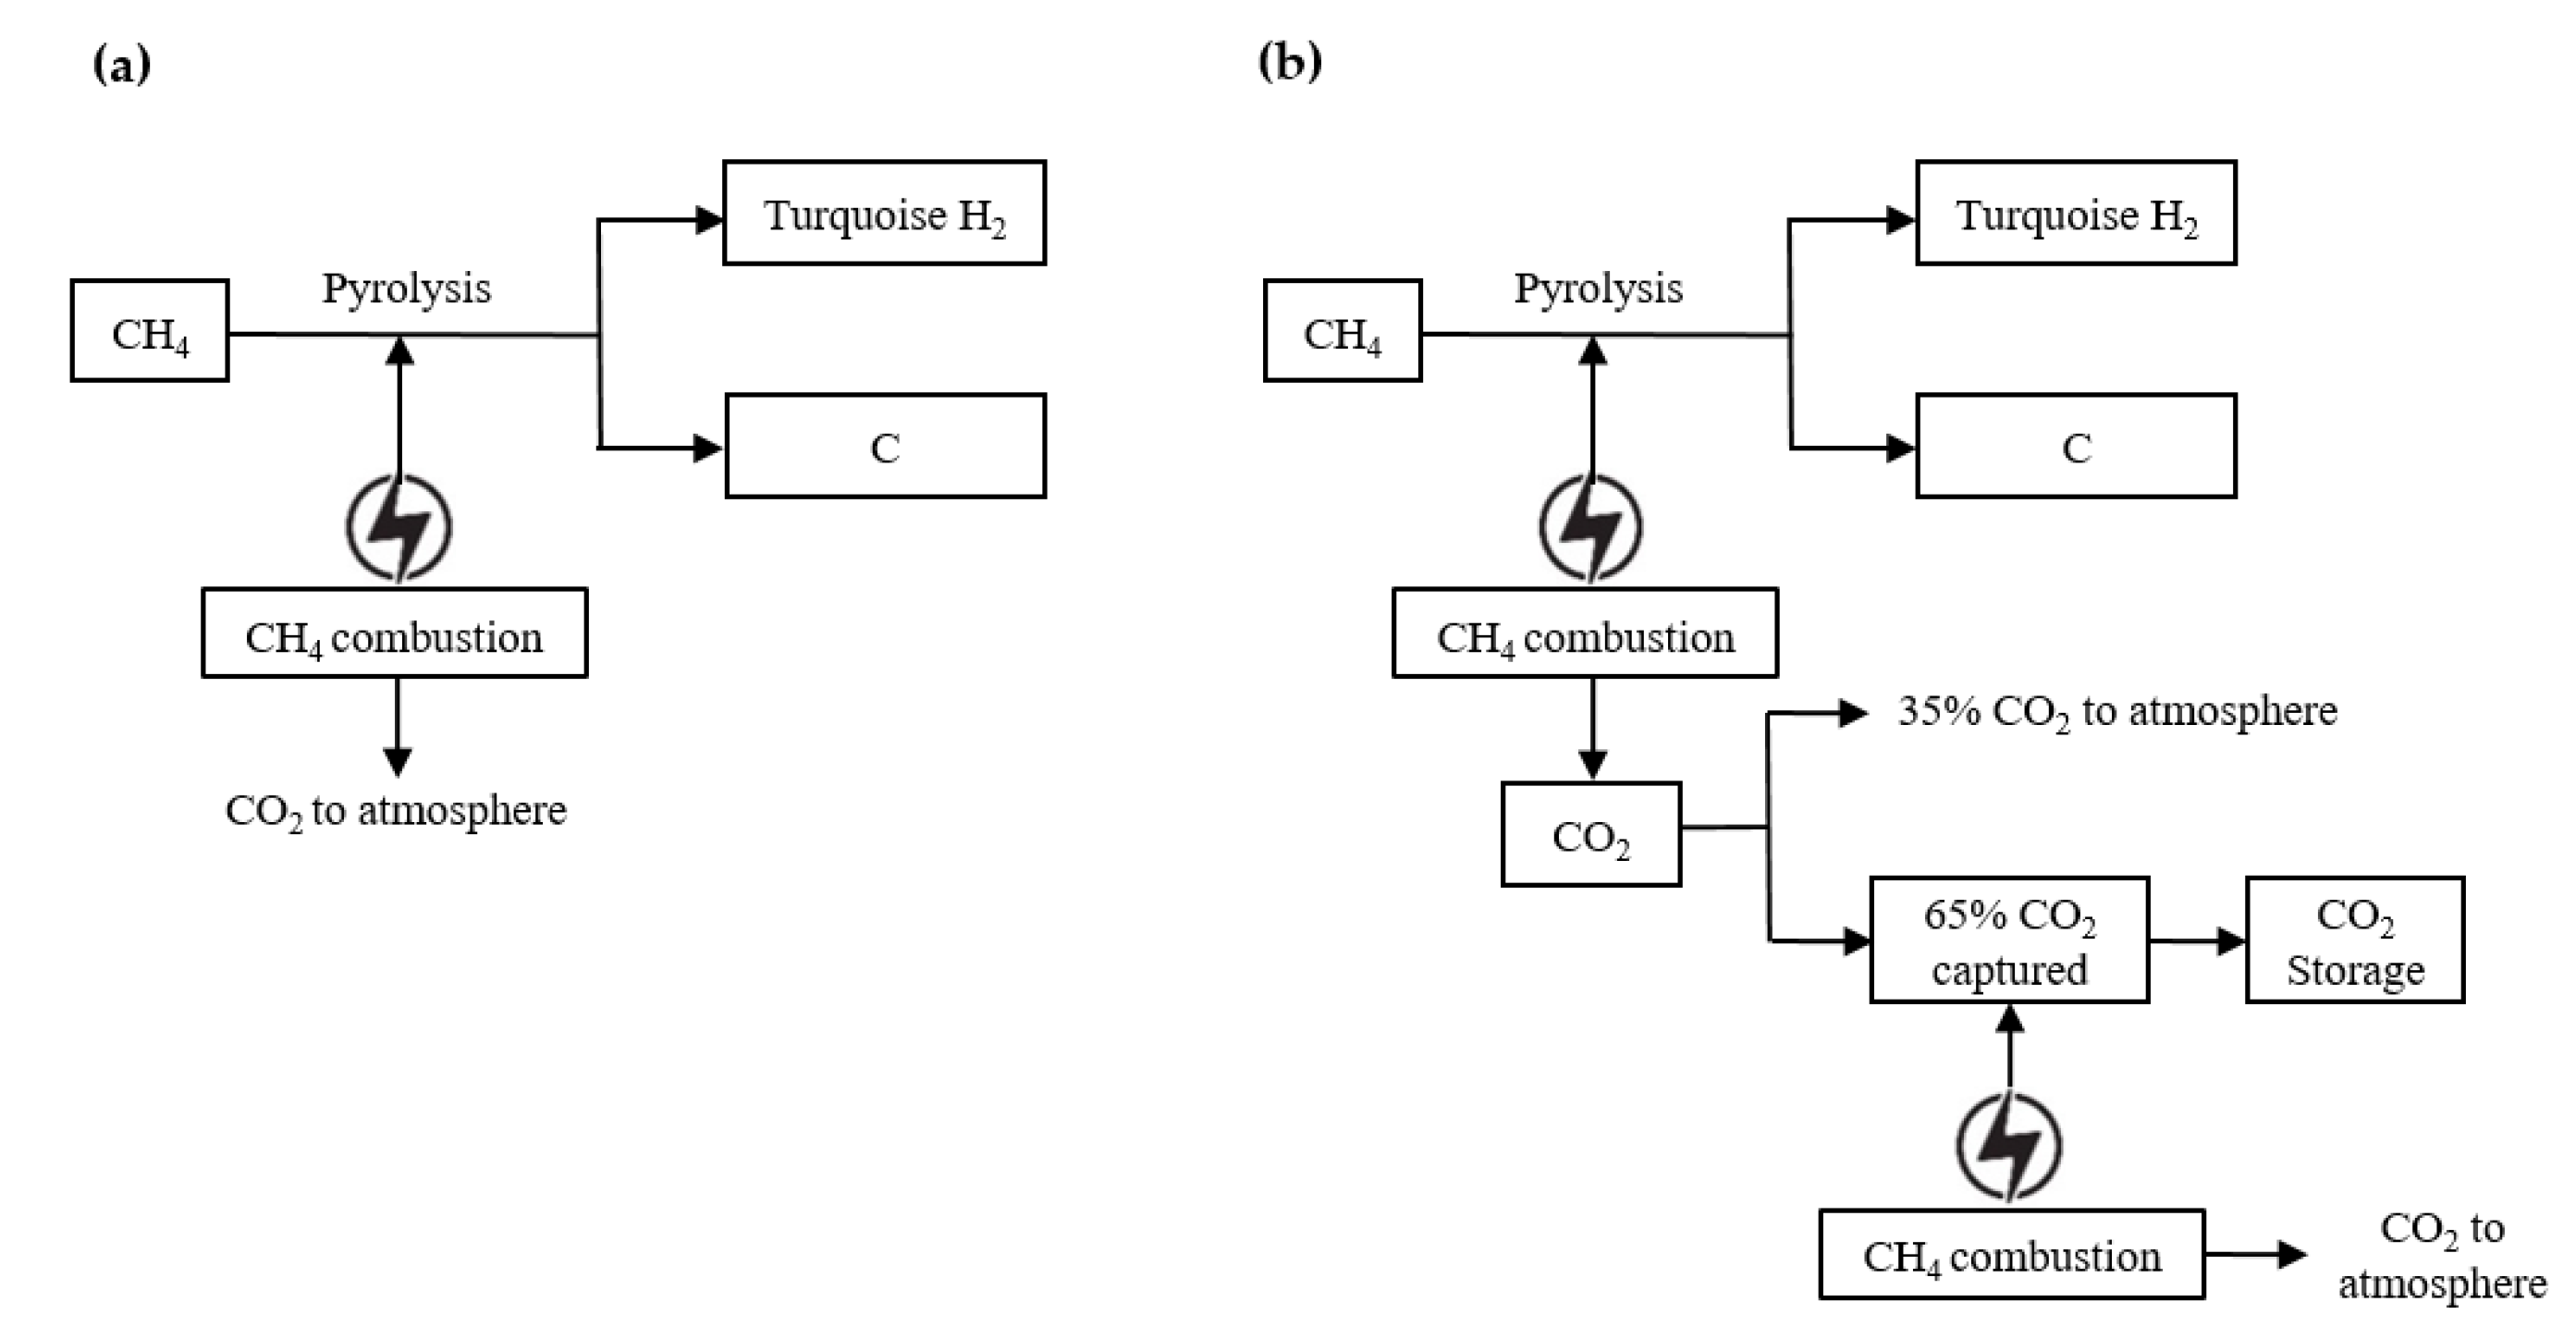
4. Emission Assessment of Turquoise Hydrogen (NG-NG)
4.1. Heat Source of Turquoise Hydrogen (NG-NG)
4.2. Heat Source of Flue-Gas Capture Facility of Turquoise Hydrogen (NG-NG)
4.3. Indirect Upstream Emissions and FME by Turquoise Hydrogen (NG-NG)
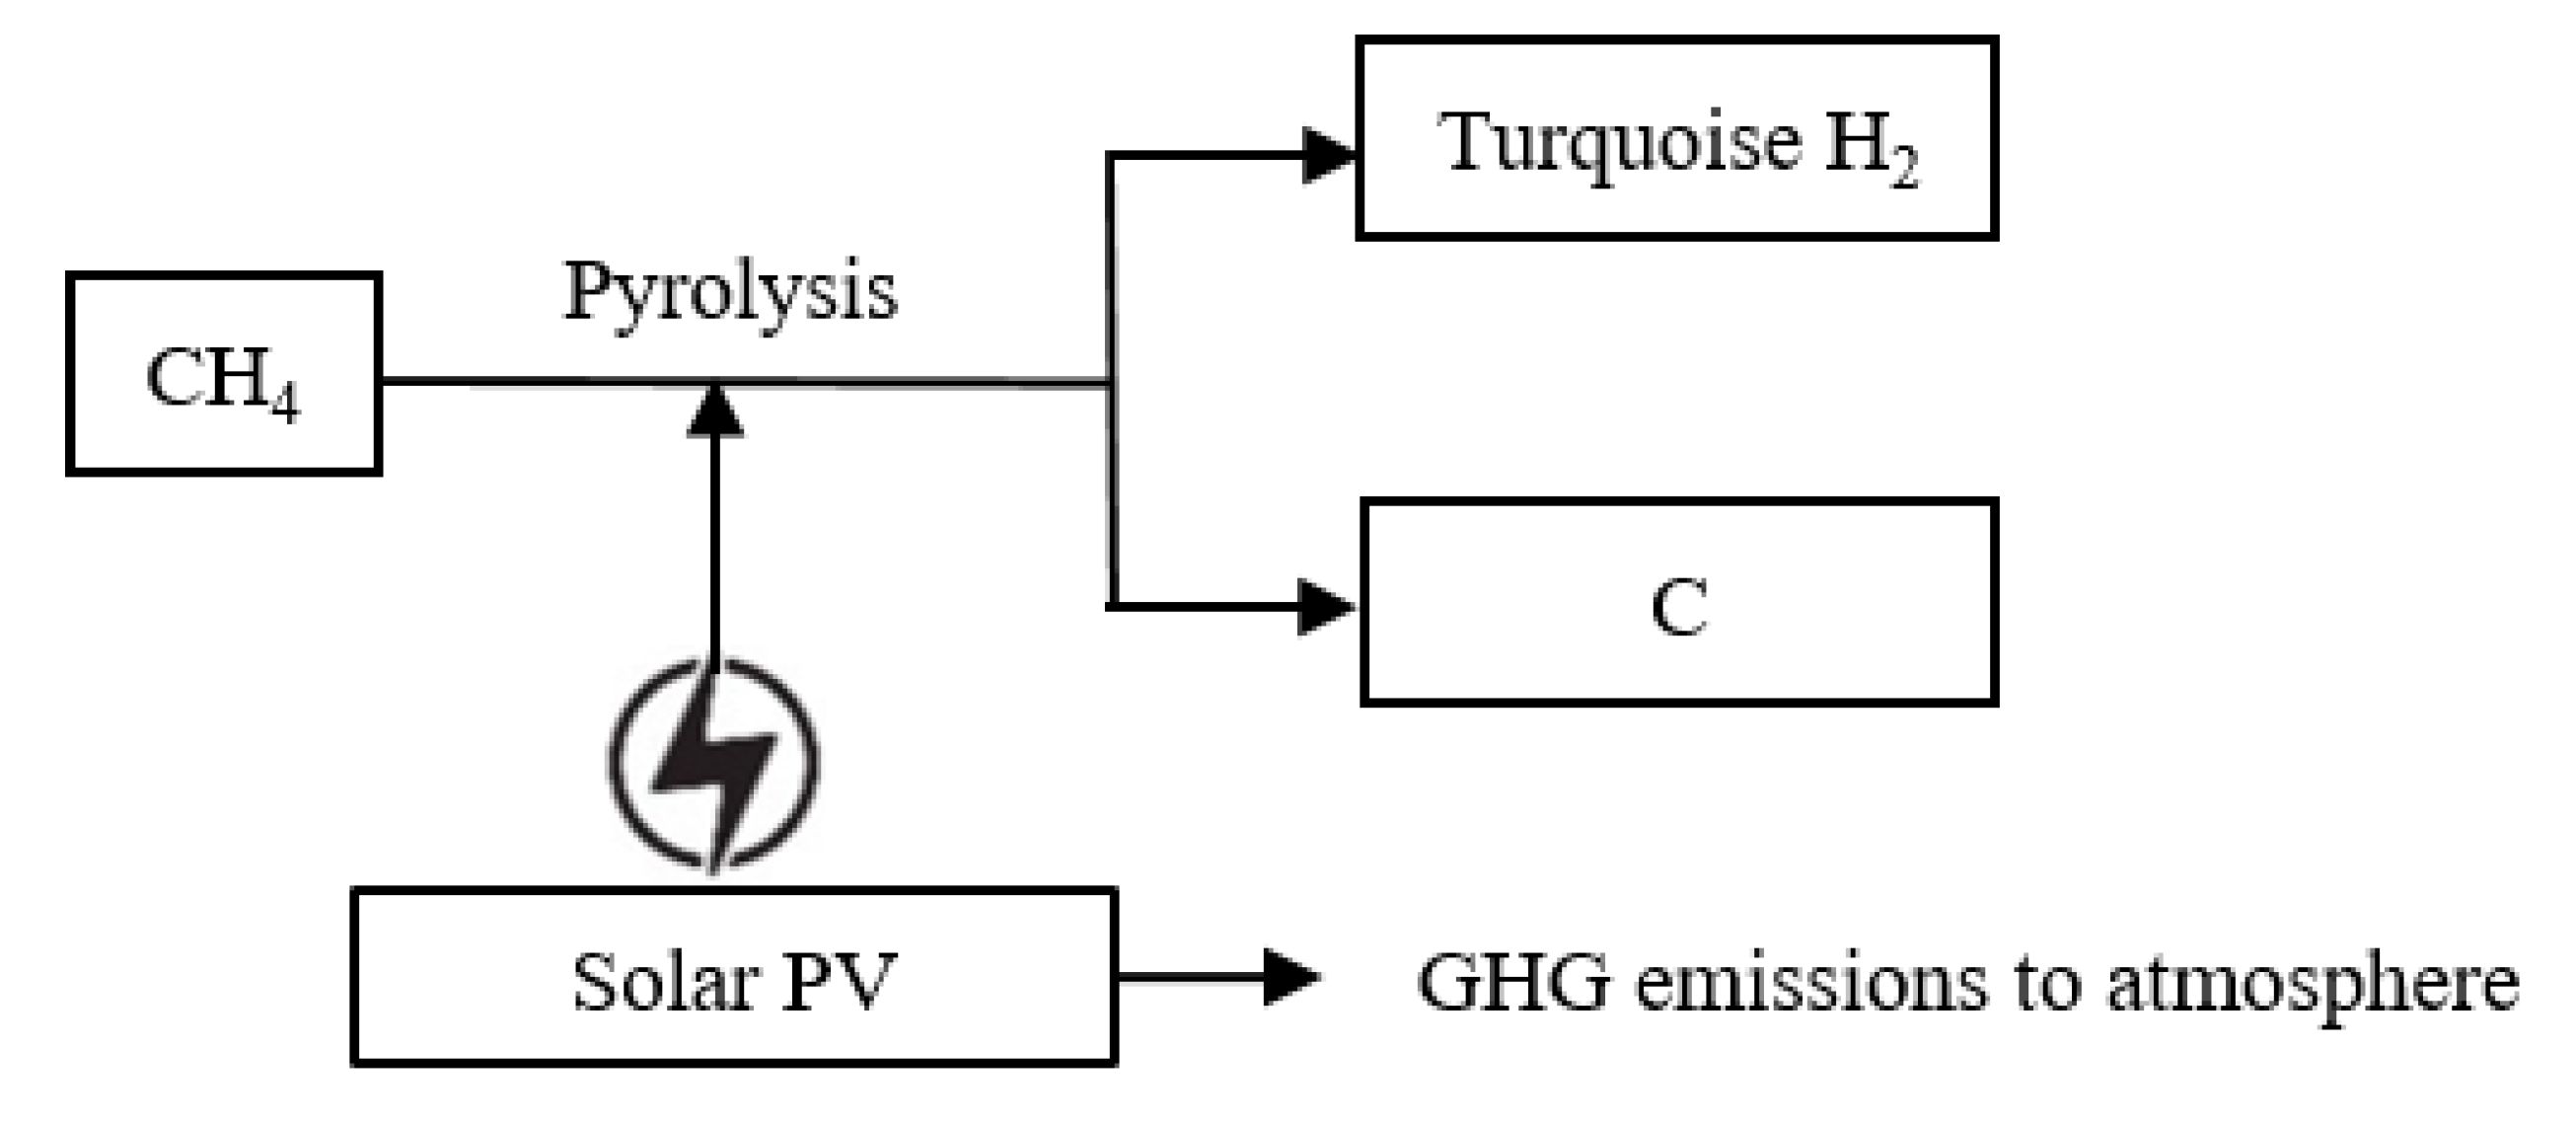
5. Emission Assessment of Turquoise Hydrogen (NG-RE)
5.1. Heat Source of Turquoise Hydrogen (NG-RE)
5.2. Indirect Upstream Emissions from Turquoise Hydrogen (NG-RE)
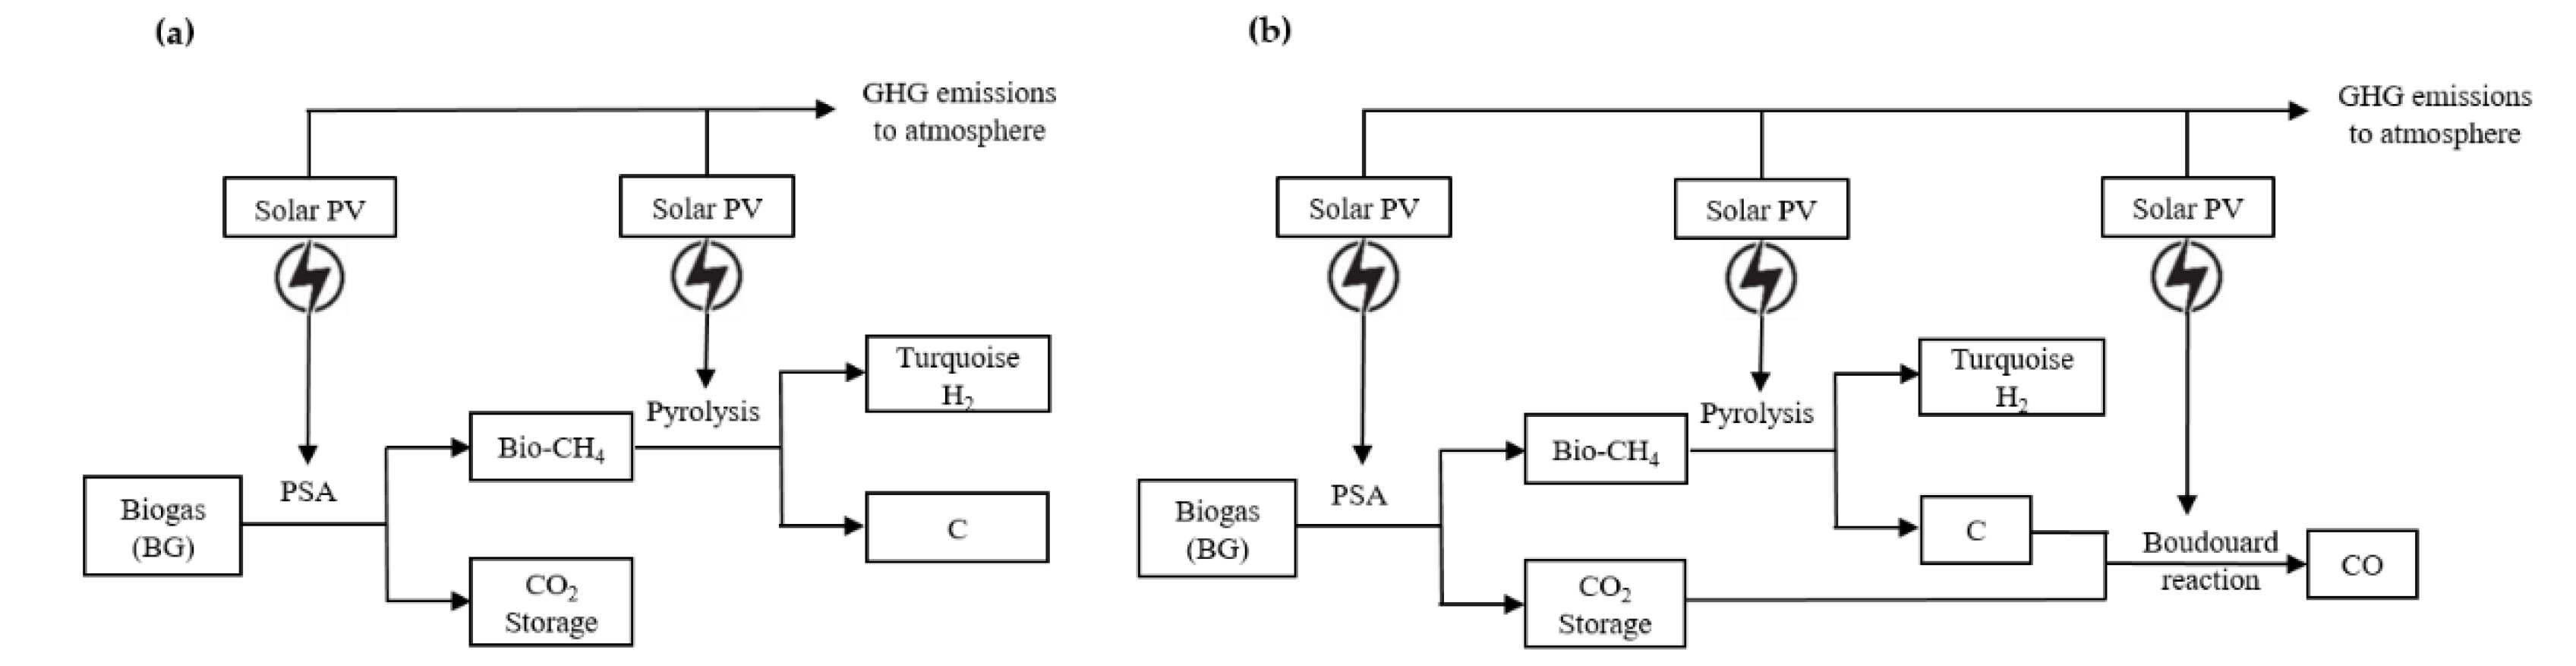
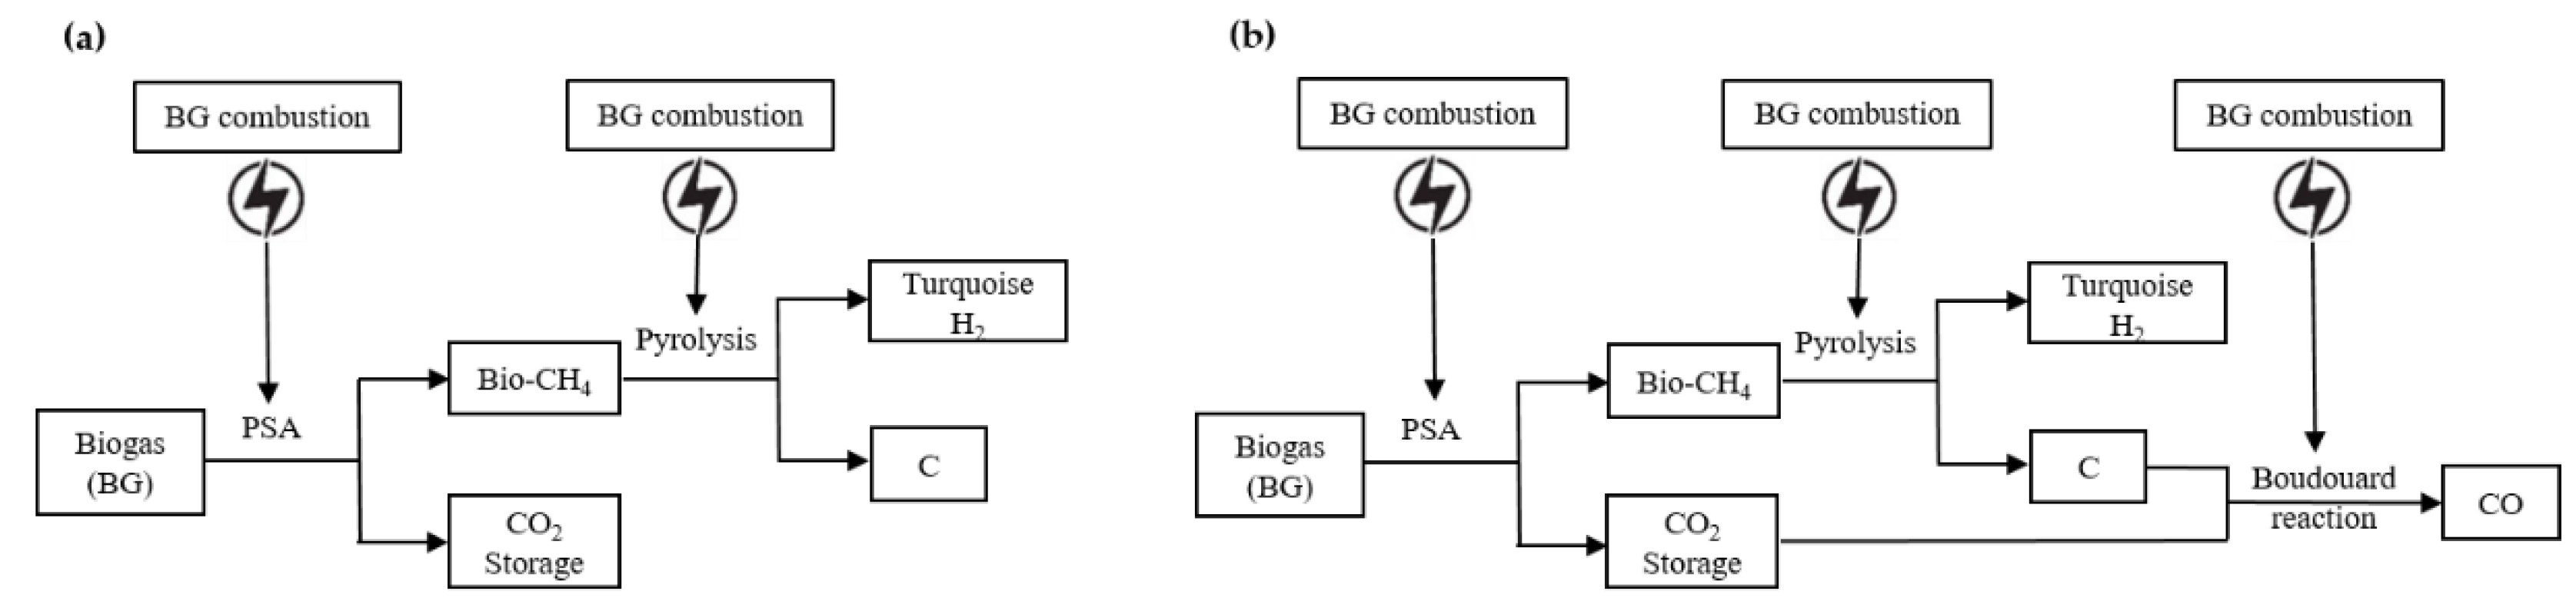
6. Emission Assessment of Turquoise Hydrogen (BG-RE)
6.1. Heat Source of Turquoise Hydrogen (BG-RE)
6.2. FME from Turquoise Hydrogen (BG-RE)
7. Emission Assessment of Turquoise Hydrogen (BG-BG)
7.1. Heat Source of Turquoise Hydrogen (BG-BG)
7.2. FME from Turquoise Hydrogen (BG-BG)
8. Energy Requirements of Hydrogen Production Processes
9. Emission Index
10. Discussion
Author Contributions
Funding
Conflicts of Interest
Abbreviations
| BG | Biogas |
| BG-RE | Biogas as a feedstock and renewable energy as a heat source |
| BG-RE Boud | Biogas as a feedstock and renewable energy as a heat source with a Boudouard reaction |
| BG-BG | Biogas as both a feedstock and a heat source |
| BG-BG Boud | Biogas as both a feedstock and a heat source with a Boudouard reaction |
| Bio-CH4 | Bio-methane |
| Blue FGC | Blue hydrogen with flue-gas capture |
| Boud | Boudouard reaction |
| CCS | Carbon capture and storage |
| FGC | Flue-gas capture |
| FME | Fugitive methane emission |
| GHG | Greenhouse gas |
| GCV | Gross calorific value |
| NG | Natural gas |
| NG-NG | Natural gas as both a feedstock and a heat source |
| NG-NG FGC | Natural gas as both a feedstock and a heat source with flue-gas capture |
| NG-RE | Natural gas as a feedstock and renewable energy as a heat source |
| PFD | Process flow diagram |
| PSA | Pressure swing adsorption |
| RE | Renewable energy |
| SMR | Steam methane reforming |
| Greek letters | |
| ΔH0 | Standard heat of reaction (kJ/mol) |
References
- Nadaleti, W.C.; de Souza, E.G.; Lourenço, V.A. Green Hydrogen-Based Pathways and Alternatives: Towards the Renewable Energy Transition in South America’s Regions—Part B. Int. J. Hydrogen Energy 2022, 47, 1–15. [Google Scholar] [CrossRef]
- Ajanovic, A.; Sayer, M.; Haas, R. The Economics and the Environmental Benignity of Different Colors of Hydrogen. Int. J. Hydrogen Energy 2022, 47, 24136–24154. [Google Scholar] [CrossRef]
- Hydrogen Colours Codes. Available online: https://www.h2bulletin.com/knowledge/hydrogen-colours-codes/ (accessed on 8 September 2022).
- Abbas, H.F.; Wan Daud, W.M.A. Hydrogen Production by Methane Decomposition: A Review. Int. J. Hydrogen Energy 2010, 35, 1160–1190. [Google Scholar] [CrossRef]
- Nikolaidis, P.; Poullikkas, A. A Comparative Overview of Hydrogen Production Processes. Renew. Sustain. Energy Rev. 2017, 67, 597–611. [Google Scholar] [CrossRef]
- Msheik, M.; Rodat, S.; Abanades, S. Methane Cracking for Hydrogen Production: A Review of Catalytic and Molten Media Pyrolysis. Energies 2021, 14, 3107. [Google Scholar] [CrossRef]
- Ashik, U.P.M.; Wan Daud, W.M.A.; Abbas, H.F. Production of Greenhouse Gas Free Hydrogen by Thermocatalytic Decomposition of Methane—A Review. Renew. Sustain. Energy Rev. 2015, 44, 221–256. [Google Scholar] [CrossRef] [Green Version]
- The Royal Society Options for Producing Low-Carbon Hydrogen at Scale Policy Briefing. Available online: https://royalsociety.org/~/media/policy/projects/hydrogen-production/energy-briefing-green-hydrogen.pdf (accessed on 8 September 2022).
- Lee, S.; Kim, H.S.; Park, J.; Kang, B.M.; Cho, C.H.; Lim, H.; Won, W. Scenario-Based Techno-Economic Analysis of Steam Methane Reforming Process for Hydrogen Production. Appl. Sci. 2021, 11, 6021. [Google Scholar] [CrossRef]
- Innovation Insights Brief 2019 New Hydrogen Economy-Hope or Hype? World Energy Council. Available online: https://www.worldenergy.org/assets/downloads/WEInnovation-Insights-Brief-New-Hydrogen-Economy-Hype-or-Hope.pdf (accessed on 7 September 2022).
- Kaczmarczyk, R. Thermodynamic Analysis of the Effect of Green Hydrogen Addition to a Fuel Mixture on the Steam Methane Reforming Process. Energies 2021, 14, 6564. [Google Scholar] [CrossRef]
- Soltani, R.; Rosen, M.A.; Dincer, I. Assessment of CO2 Capture Options from Various Points in Steam Methane Reforming for Hydrogen Production. Int. J. Hydrogen Energy 2014, 39, 20266–20275. [Google Scholar] [CrossRef]
- Ramadan, M.M.; Wang, Y.; Tooteja, P. Analysis of Hydrogen Production Costs across the United States and over the next 30 Years. arXiv 2022, arXiv:2206.10689. [Google Scholar] [CrossRef]
- Global Status of CCS 2020, Global CCS Institute. Available online: https://www.globalccsinstitute.com/wp-content/uploads/2021/03/Global-Status-of-CCS-Report-English.pdf (accessed on 7 September 2022).
- IPCC Carbon Dioxide Capture and Storage. Available online: https://www.ipcc.ch/site/assets/uploads/2018/03/srccs_wholereport-1.pdf (accessed on 7 September 2022).
- Sgouridis, S.; Carbajales-Dale, M.; Csala, D.; Chiesa, M.; Bardi, U. Comparative Net Energy Analysis of Renewable Electricity and Carbon Capture and Storage. Nat. Energy 2019, 4, 456–465. [Google Scholar] [CrossRef] [Green Version]
- Korányi, T.I.; Németh, M.; Beck, A.; Horváth, A. Recent Advances in Methane Pyrolysis: Turquoise Hydrogen with Solid Carbon Production. Energies 2022, 15, 6342. [Google Scholar] [CrossRef]
- Swartbooi, A.; Kapanji-Kakoma, K.K.; Musyoka, N.M. From Biogas to Hydrogen: A Techno-Economic Study on the Production of Turquoise Hydrogen and Solid Carbons. Sustainability 2022, 14, 11050. [Google Scholar] [CrossRef]
- Diab, J.; Fulcheri, L.; Hessel, V.; Rohani, V.; Frenklach, M. Why Turquoise Hydrogen Will Be a Game Changer for the Energy Transition. Int. J. Hydrogen Energy 2022, 47, 25831–25848. [Google Scholar] [CrossRef]
- Parkinson, B.; Tabatabaei, M.; Upham, D.C.; Ballinger, B.; Greig, C.; Smart, S.; McFarland, E. Hydrogen Production Using Methane: Techno-Economics of Decarbonizing Fuels and Chemicals. Int. J. Hydrogen Energy 2018, 43, 2540–2555. [Google Scholar] [CrossRef]
- Sánchez-Bastardo, N.; Schlögl, R.; Ruland, H. Methane Pyrolysis for Zero-Emission Hydrogen Production: A Potential Bridge Technology from Fossil Fuels to a Renewable and Sustainable Hydrogen Economy. Ind. Eng. Chem. Res. 2021, 60, 11855–11881. [Google Scholar] [CrossRef]
- Alhamdani, Y.A.; Hassim, M.H.; Ng, R.T.L.; Hurme, M. The Estimation of Fugitive Gas Emissions from Hydrogen Production by Natural Gas Steam Reforming. Int. J. Hydrogen Energy 2017, 42, 9342–9351. [Google Scholar] [CrossRef]
- Ishikawa, S.; Hoshiba, S.; Hinata, T.; Hishinuma, T.; Morita, S. Evaluation of a Biogas Plant from Life Cycle Assessment (LCA). Int. Congr. Ser. 2006, 1293, 230–233. [Google Scholar] [CrossRef]
- Lahijani, P.; Zainal, Z.A.; Mohammadi, M.; Mohamed, A.R. Conversion of the Greenhouse Gas CO2 to the Fuel Gas CO via the Boudouard Reaction: A Review. Renew. Sustain. Energy Rev. 2015, 41, 615–632. [Google Scholar] [CrossRef]
- Howarth, R.W.; Jacobson, M.Z. How Green Is Blue Hydrogen? Energy Sci. Eng. 2021, 9, 1676–1687. [Google Scholar] [CrossRef]
- Hydrogen|H2—PubChem. Available online: https://pubchem.ncbi.nlm.nih.gov/compound/Hydrogen (accessed on 2 September 2022).
- Steinberg, M. Fossil Fuel Decarbonization Technology for Mitigating Global Warming. Int. J. Hydrogen Energy 1999, 24, 771–777. [Google Scholar] [CrossRef] [Green Version]
- Sánchez-Bastardo, N.; Schlögl, R.; Ruland, H. Methane Pyrolysis for CO2-Free H2 Production: A Green Process to Overcome Renewable Energies Unsteadiness. Chemie-Ingenieur-Technik 2020, 92, 1596–1609. [Google Scholar] [CrossRef]
- Santoro, R.L.; Howarth, R.H.; Ingraffea, A.R. Indirect Emissions of Carbon Dioxide from Marcellus Shale Gas Development. In A Technical Report from the Agriculture; Energy, & Environment Program at Cornell University: New York, NY, USA, 2011. [Google Scholar]
- Primary Sources of Methane Emissions|US EPA. Available online: https://www.epa.gov/natural-gas-star-program/primary-sources-methane-emissions (accessed on 11 October 2022).
- Tyner, D.R.; Johnson, M.R. A Techno-Economic Analysis of Methane Mitigation Potential from Reported Venting at Oil Production Sites in Alberta. Environ. Sci. Technol. 2018, 52, 12877–12885. [Google Scholar] [CrossRef] [PubMed] [Green Version]
- Howarth, R. Methane and Climate Change. In Environmental Impacts from the Development of Unconventional Oil and Gas Reserves; Stolz, J., Bain, D., Griffin, M., Eds.; Cambridge University Press: Cambridge, UK, 2022; pp. 132–149. [Google Scholar] [CrossRef]
- Plant, G.; Kort, E.A.; Floerchinger, C.; Gvakharia, A.; Vimont, I.; Sweeney, C. Large Fugitive Methane Emissions from Urban Centers Along the U.S. East Coast. Geophys. Res. Lett. 2019, 46, 8500–8507. [Google Scholar] [CrossRef] [Green Version]
- Howarth, R.W. Methane Emissions from Fossil Fuels: Exploring Recent Changes in Greenhouse-Gas Reporting Requirements for the State of New York. J. Integr. Environ. Sci. 2020, 17, 69–81. [Google Scholar] [CrossRef]
- IEA. Energy Statistics Data Browser; IEA: Paris, France, 2022; Available online: https://www.iea.org/data-and-statistics/data-tools/energy-statistics-data-browser (accessed on 2 September 2022).
- Methane and Climate Change—Methane Tracker 2021—Analysis—IEA. Available online: https://www.iea.org/reports/methane-tracker-2021/methane-and-climate-change (accessed on 11 November 2022).
- Zagashvili, Y.; Kuzmin, A.; Buslaev, G.; Morenov, V. Small-Scaled Production of Blue Hydrogen with Reduced Carbon Footprint. Energies 2021, 14, 5194. [Google Scholar] [CrossRef]
- Bauer, C.; Treyer, K.; Antonini, C.; Bergerson, J.; Gazzani, M.; Gencer, E.; Gibbins, J.; Mazzotti, M.; McCoy, S.T.; McKenna, R.; et al. On the Climate Impacts of Blue Hydrogen Production. Sustain. Energy Fuels 2021, 6, 66–75. [Google Scholar] [CrossRef]
- Quest CO2 Capture Ratio Performance, Quest Carbon Capture and Storage (CCS) Project, Government of Alberta. Available online: https://open.alberta.ca/dataset/f74375f3-3c73-4b9c-af2b-ef44e59b7890/resource/c36cf890-3b27-4e7e-b95b-3370cd0d9f7d/download/energy-quest-CO2-capture-ratio-performance-2019.pdf (accessed on 2 September 2022).
- Jacobson, M.Z. The Health and Climate Impacts of Carbon Capture and Direct Air Capture. Energy Environ. Sci. 2019, 12, 3567–3574. [Google Scholar] [CrossRef]
- Kennedy, G. WA Parish Post-Combustion CO2 Capture and Sequestration Demonstration Project (Final Technical Report); Petra Nova Power Holdings LLC: Houston, TA, USA, 2020. [Google Scholar] [CrossRef]
- David Schlissel Boundary Dam 3 Coal Plant Achieves Goal of Capturing 4 Million Metric Tons of CO2 But Reaches the Goal Two Years Late. Available online: https://ieefa.org/wp-content/uploads/2021/04/Boundary-Dam-3-Coal-Plant-Achieves-CO2-Capture-Goal-Two-Years-Late_April-2021.pdf (accessed on 2 September 2022).
- Silva, M.; Raadal, H.L. Life Cycle GHG Emissions of Renewable and Non-Renewable Electricity Generation Technologies Part of the RE-Invest Project. Available online: https://reinvestproject.eu/wp-content/uploads/2019/11/OR_RE-INVEST_Life-cycle-GHG-emissions-of-renewable-and-non-renewable-electricity.pdf (accessed on 2 September 2022).
- Vitázek, I.; Klúčik, J.; Uhrinová, D.; Mikulová, Z.; Mojžiš, M. Thermodynamics of Combustion Gases from Biogas. Res. Agric. Eng 2016, 62, 8–13. [Google Scholar] [CrossRef] [Green Version]
- Beil, M.; Beyrich, W. Biogas Upgrading to Biomethane. Biogas. Handb. Sci. Prod. Appl. 2013, 342–377. [Google Scholar] [CrossRef]
- Kohlheb, N.; Wluka, M.; Bezama, A.; Thrän, D.; Aurich, A.; Müller, R.A. Environmental-Economic Assessment of the Pressure Swing Adsorption Biogas Upgrading Technology. Bioenergy Res. 2021, 14, 901–909. [Google Scholar] [CrossRef]
- Carbon Monoxide|Linde Gas. Available online: https://www.linde-gas.com/en/products_and_supply/packaged_chemicals/product_range/carbon_monoxide.html (accessed on 11 October 2022).
- Vo, T.T.Q.; Rajendran, K.; Murphy, J.D. Can Power to Methane Systems Be Sustainable and Can They Improve the Carbon Intensity of Renewable Methane When Used to Upgrade Biogas Produced from Grass and Slurry? Appl. Energy 2018, 228, 1046–1056. [Google Scholar] [CrossRef]
- Bakkaloglu, S.; Lowry, D.; Fisher, R.E.; France, J.L.; Brunner, D.; Chen, H.; Nisbet, E.G. Quantification of Methane Emissions from UK Biogas Plants. Waste Manag. 2021, 124, 82–93. [Google Scholar] [CrossRef] [PubMed]
- Global Biomethane Market 2021—Cedigaz. Available online: https://www.cedigaz.org/global-biomethane-market-2021/ (accessed on 2 September 2022).
- Bradbury, J.A.; Obeiter, M.; Draucker, L.; Wang, W.; Stevens, A. Clearing the Air: Reducing Upstream Greenhouse Gas Emissions from U.S. Natural GAS Systems, World Resources Institute. Available online: https://files.wri.org/d8/s3fs-public/clearing_the_air_full_version.pdf (accessed on 11 November 2022).


| Compounds | Molecular Weight (g/mol) | Density (kg/m3) at Standard State | Gross Calorific Value (MJ/kg) |
|---|---|---|---|
| CH4 | 16.04 | 0.66 | 53.6 |
| C | 12.01 | 2267 | 32.8 |
| H2 | 2.02 | 0.085 | 141.87 |
| CO2 | 44.01 | 1.87 | - |
| CO | 28.01 | 1.14 | 10.1 |
| Grey H2 | Blue H2 | Turquoise H2 | |||||||||
|---|---|---|---|---|---|---|---|---|---|---|---|
| NG-NG | NG-RE | BG-RE | BG-BG | ||||||||
| FGC 1 | FGC 1 | Boud 2 | Boud 2 | ||||||||
| 1. SMR/Pyrolysis process | BG consumed (g BG/MJ) | 88.89 | 88.89 | 88.89 | 88.89 | ||||||
| CH4 consumed (g CH4/MJ) | 14.02 | 14.02 | 14.02 | 28.05 | 28.05 | 28.05 | |||||
| CO2 produced (g CO2/MJ) | 38.47 | 38.47 | 38.47 | ||||||||
| Fugitive CH4 emissions (g CH4/MJ) | 0.49 | 0.49 | 0.49 | 0.98 | 0.98 | 0.98 | 0.56 | 0.56 | 0.56 | 0.56 | |
| Fugitive CH4 emissions (g CO2eq/MJ) | 42.33 | 42.33 | 42.33 | 84.67 | 84.67 | 84.67 | 48.39 | 48.39 | 48.39 | 48.39 | |
| Direct CO2 emissions (g CO2/MJ) | 38.47 | 5.77 | 5.77 | ||||||||
| CO2 capture rate | 85% | 85% | |||||||||
| Carbon produced (g C/MJ) | 21.00 | 21.00 | 21.00 | 21.00 | 21.00 | 21.00 | 21.00 | ||||
| 2. Heat source of PSA | BG consumed (g BG/MJ) | 5.80 | 5.80 | ||||||||
| CO2 produced (g CO2/MJ) | |||||||||||
| Fugitive CH4 emissions (g CH4/MJ) | 0.04 | 0.04 | |||||||||
| Fugitive CH4 emissions (g CO2eq/MJ) | 3.16 | 3.16 | |||||||||
| GHG emissions from solar PV (g CO2eq/MJ) | 1.82 | 1.82 | |||||||||
| 3. Heat source of SMR/Pyrolysis | BG consumed (g BG/MJ) | 10.05 | 10.05 | ||||||||
| CH4 consumed (g CH4/MJ) | 3.36 | 3.36 | 3.36 | 3.05 | 3.05 | ||||||
| CO2 produced (g CO2/MJ) | 9.23 | 9.23 | 9.23 | 8.37 | 8.37 | ||||||
| Fugitive CH4 emissions (g CH4/MJ) | 0.12 | 0.12 | 0.12 | 0.11 | 0.11 | 0.06 | 0.06 | ||||
| Fugitive CH4 emissions (g CO2eq/MJ) | 10.15 | 10.15 | 10.15 | 9.21 | 9.21 | 5.47 | 5.47 | ||||
| GHG emissions from solar PV (g CO2eq/MJ) | 3.14 | 3.14 | 3.14 | ||||||||
| Direct CO2 emissions (g CO2/MJ) | 9.23 | 9.23 | 3.23 | 8.37 | 2.93 | 0.00 | |||||
| Flue-gas capture rate | 65% | 65% | |||||||||
| 4. Boudouard reaction | CO2 consumed (g CO2/MJ) | 60.22 | 60.22 | ||||||||
| CO produced (g CO/MJ) | 76.65 | 76.65 | |||||||||
| 5. Heat source of Boudouard reaction | BG consumed (g BG/MJ) | 18.13 | |||||||||
| Fugitive CH4 emissions (g CH4/MJ) | 0.11 | ||||||||||
| Fugitive CH4 emissions (g CO2eq/MJ) | 9.87 | ||||||||||
| GHG emissions from solar PV (g CO2eq/MJ) | 5.68 | ||||||||||
| 6. Heat source of CO2/flue-gas capture facility | CH4 consumed (g CH4/MJ) | 2.98 | 3.83 | 0.77 | |||||||
| CO2 produced (g CO2/MJ) | 8.17 | 10.51 | 2.12 | ||||||||
| Fugitive CH4 emissions (g CH4/MJ) | 0.10 | 0.13 | 0.027 | ||||||||
| Fugitive CH4 emissions (g CO2eq/MJ) | 9.00 | 11.57 | 2.33 | ||||||||
| Direct CO2 emissions (g CO2/MJ) | 8.17 | 10.51 | 2.12 | ||||||||
| Summary of the process | Indirect upstream CO2 emissions (g CO2/MJ) | 3.58 | 4.19 | 4.37 | 6.40 | 6.56 | 5.77 | ||||
| Total BG consumed (g BG/MJ) | 88.89 | 88.89 | 104.74 | 122.87 | |||||||
| Total CH4 consumed (g CH4/MJ) | 17.39 | 20.37 | 21.22 | 31.10 | 31.87 | 28.05 | |||||
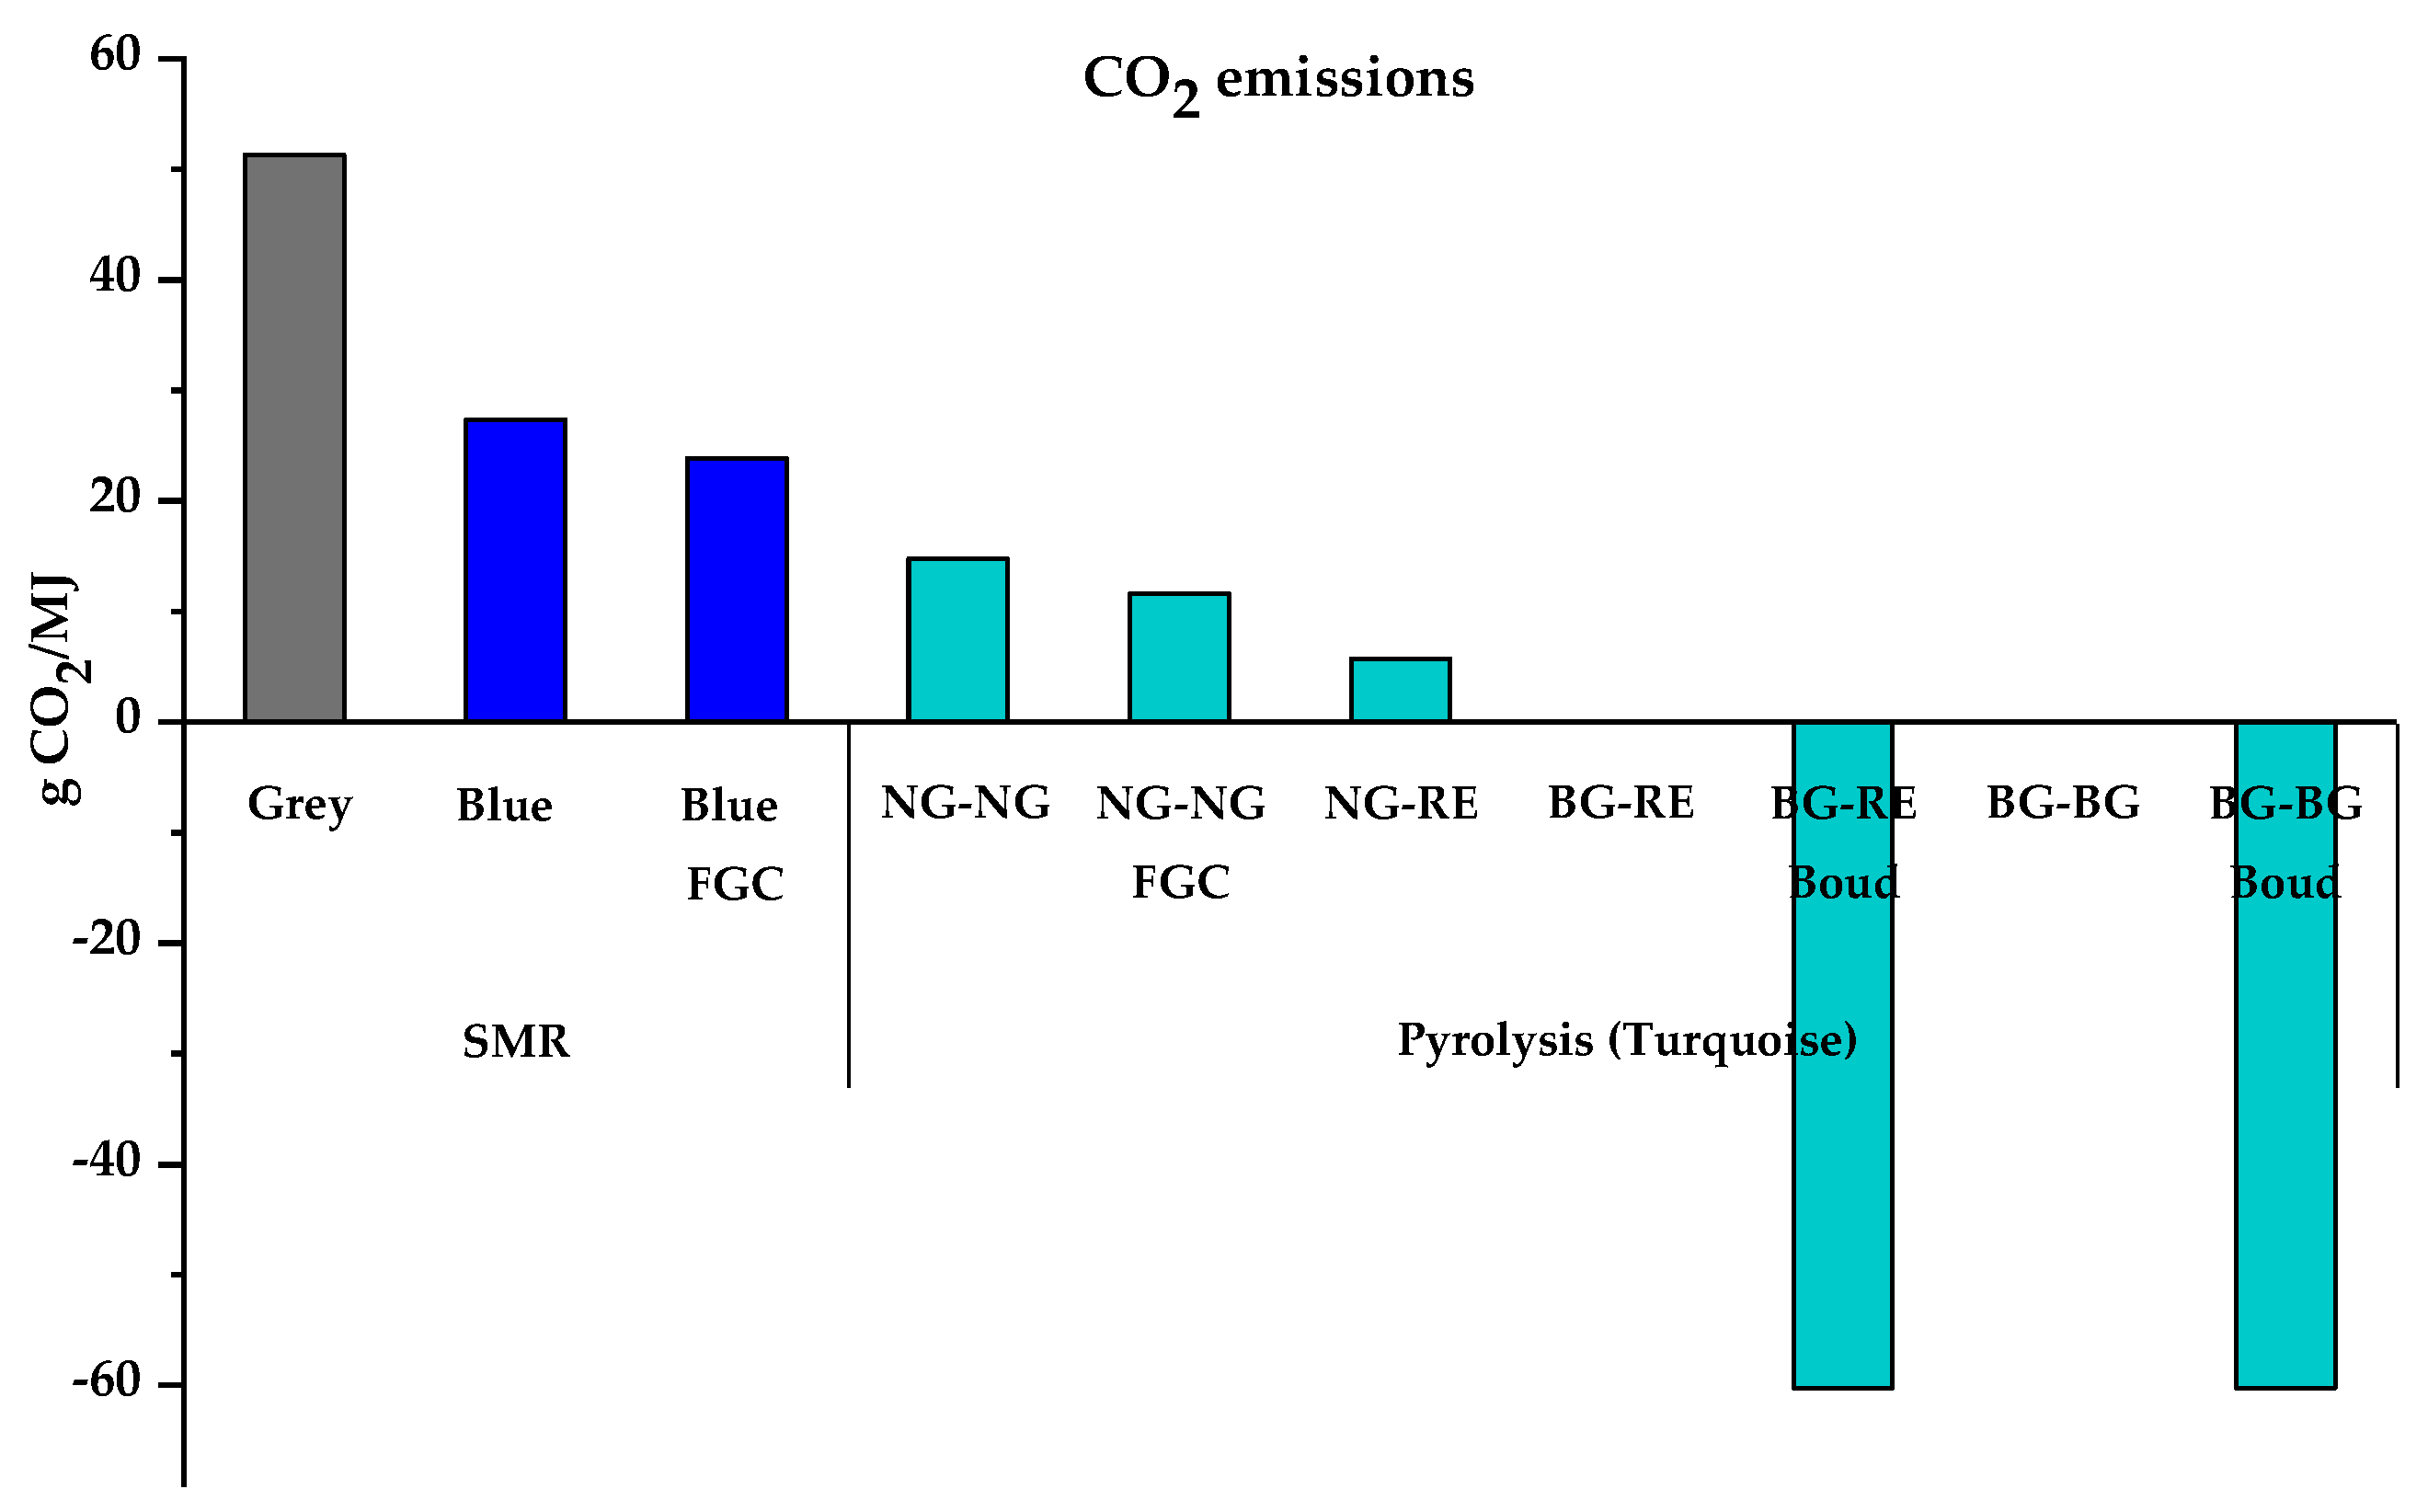
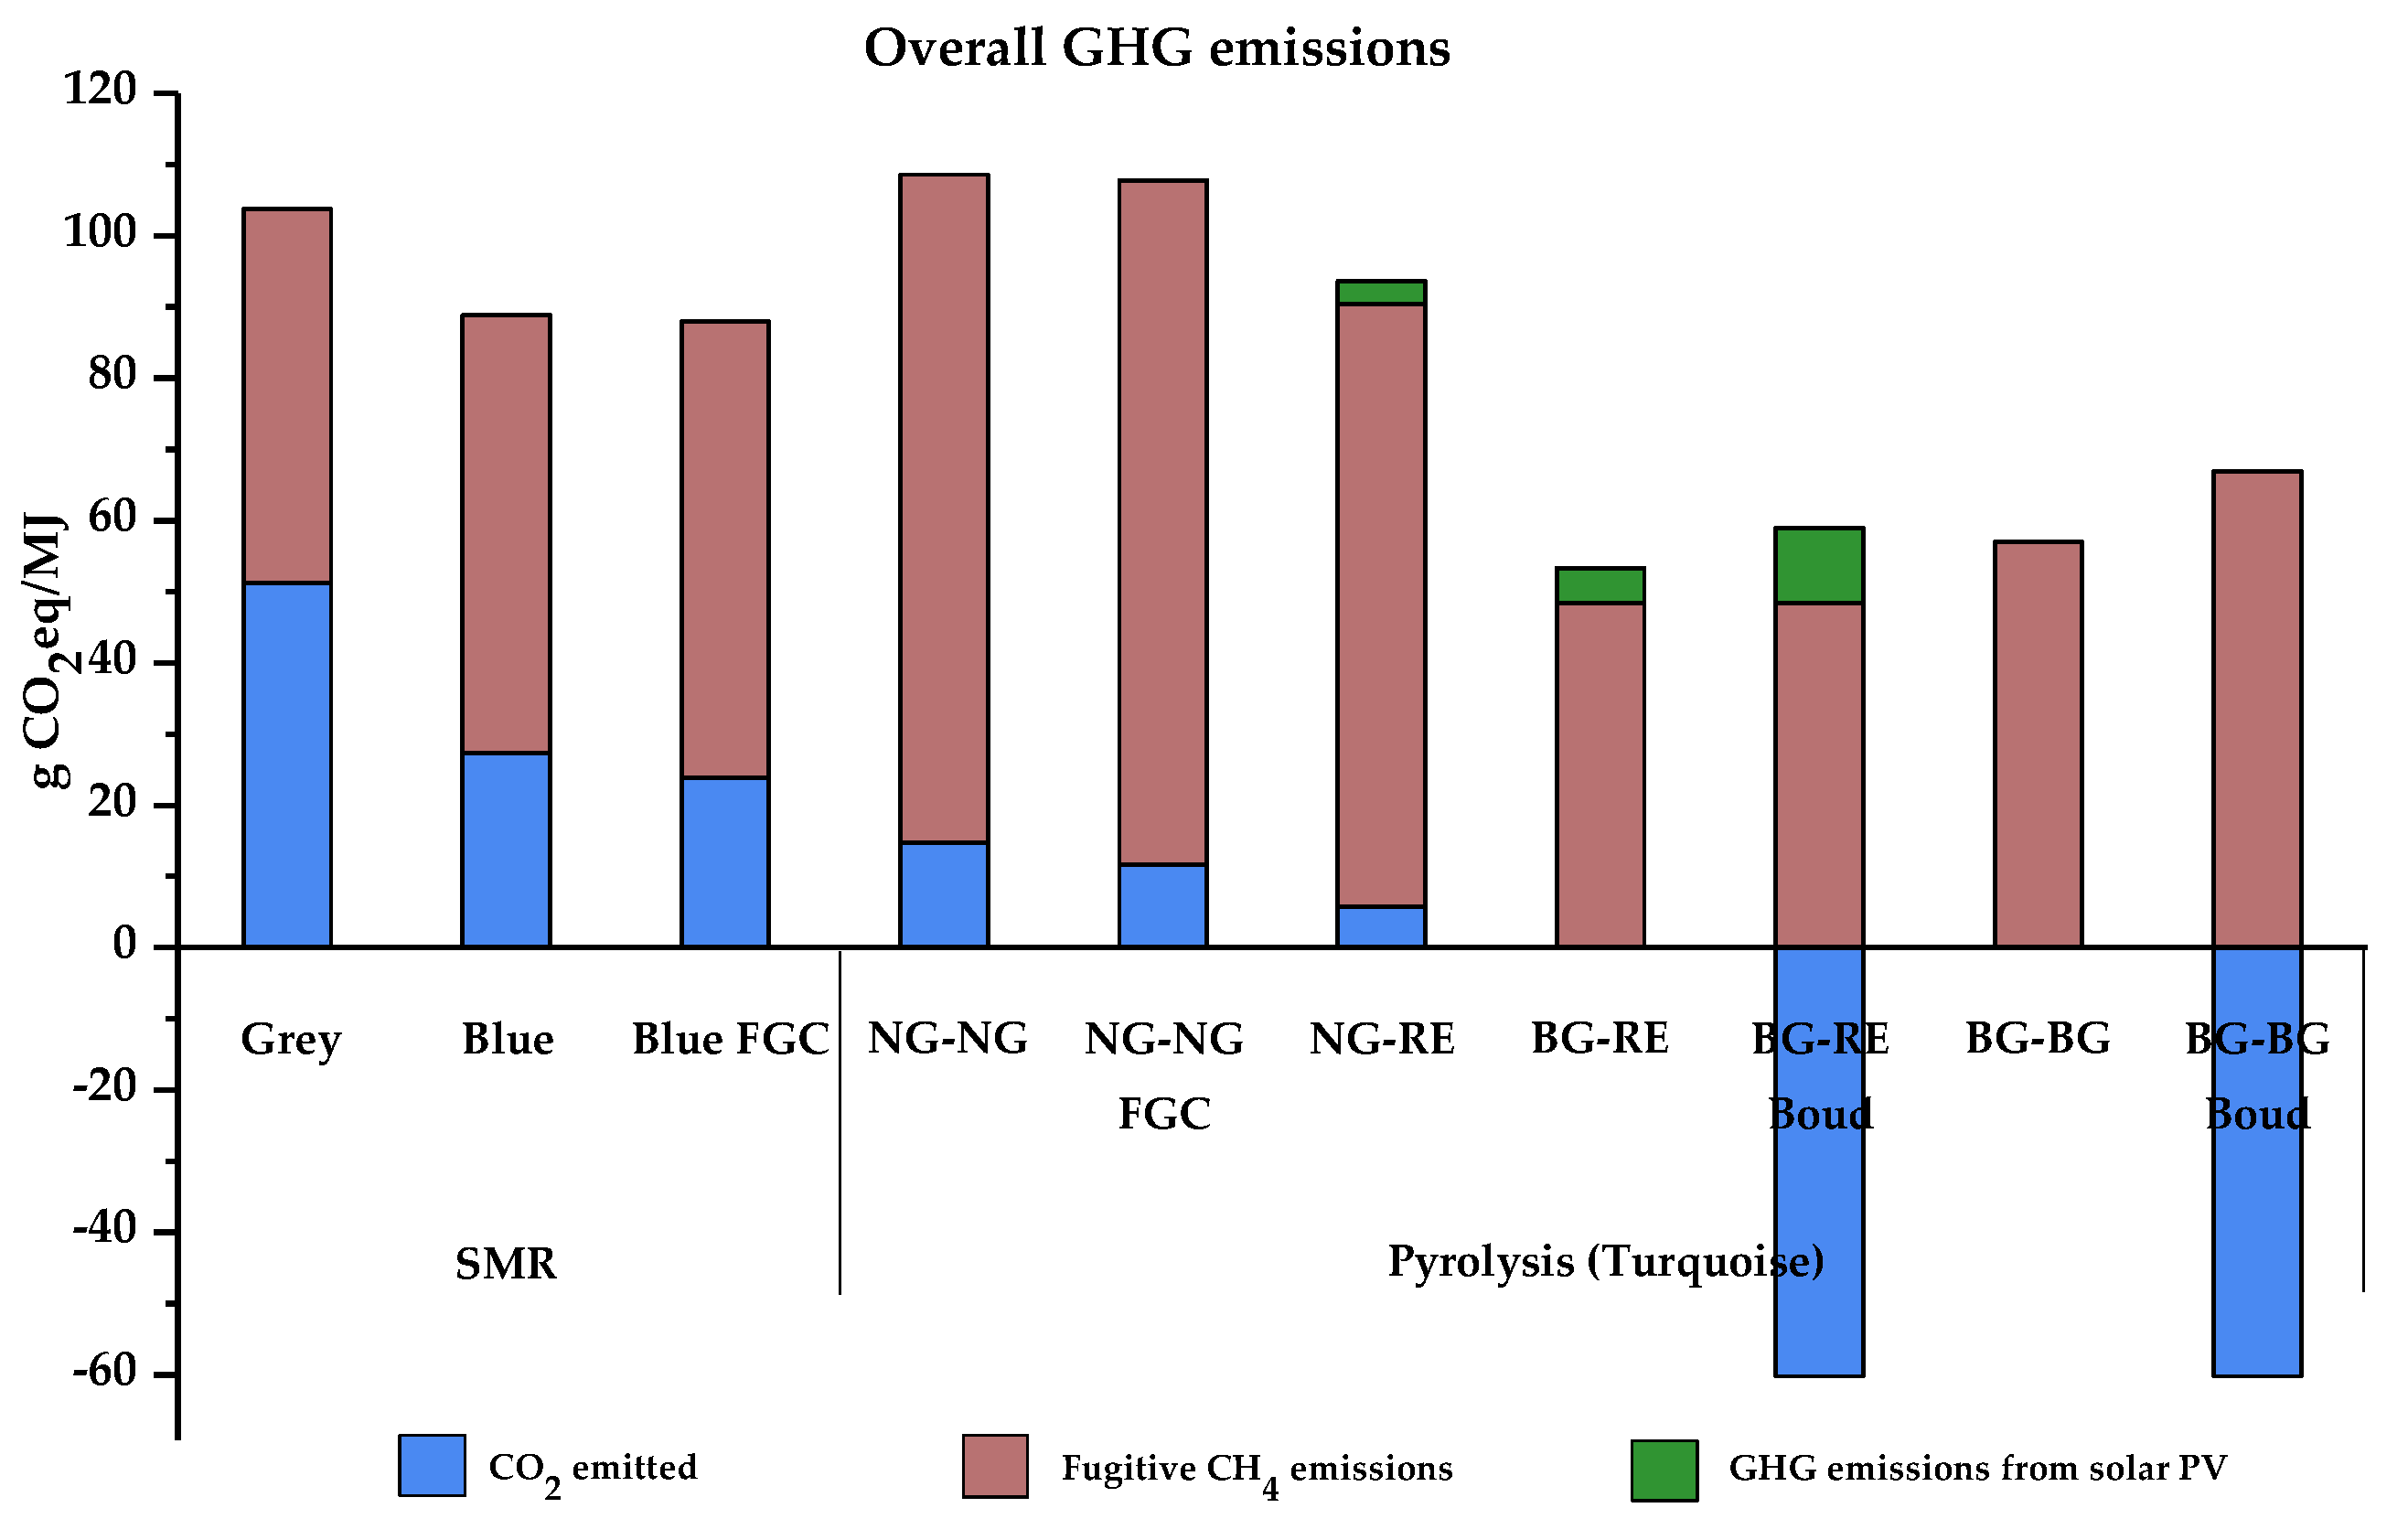
| Total CO2 emitted (g CO2/MJ) | 51.28 | 27.36 | 23.88 | 14.76 | 11.61 | 5.77 | −60.22 | −60.22 | |||
| Total fugitive CH4 emissions (g CO2eq/MJ) | 52.49 | 61.48 | 64.06 | 93.87 | 96.21 | 84.67 | 48.39 | 48.39 | 57.02 | 66.89 | |
| Total GHG emissions from solar PV (g CO2eq/MJ) | 3.14 | 4.96 | 10.63 | ||||||||
| Overall emissions (g CO2eq/MJ) | 103.76 | 88.85 | 87.94 | 108.64 | 107.81 | 93.58 | 53.35 | −1.19 | 57.02 | 6.67 | |
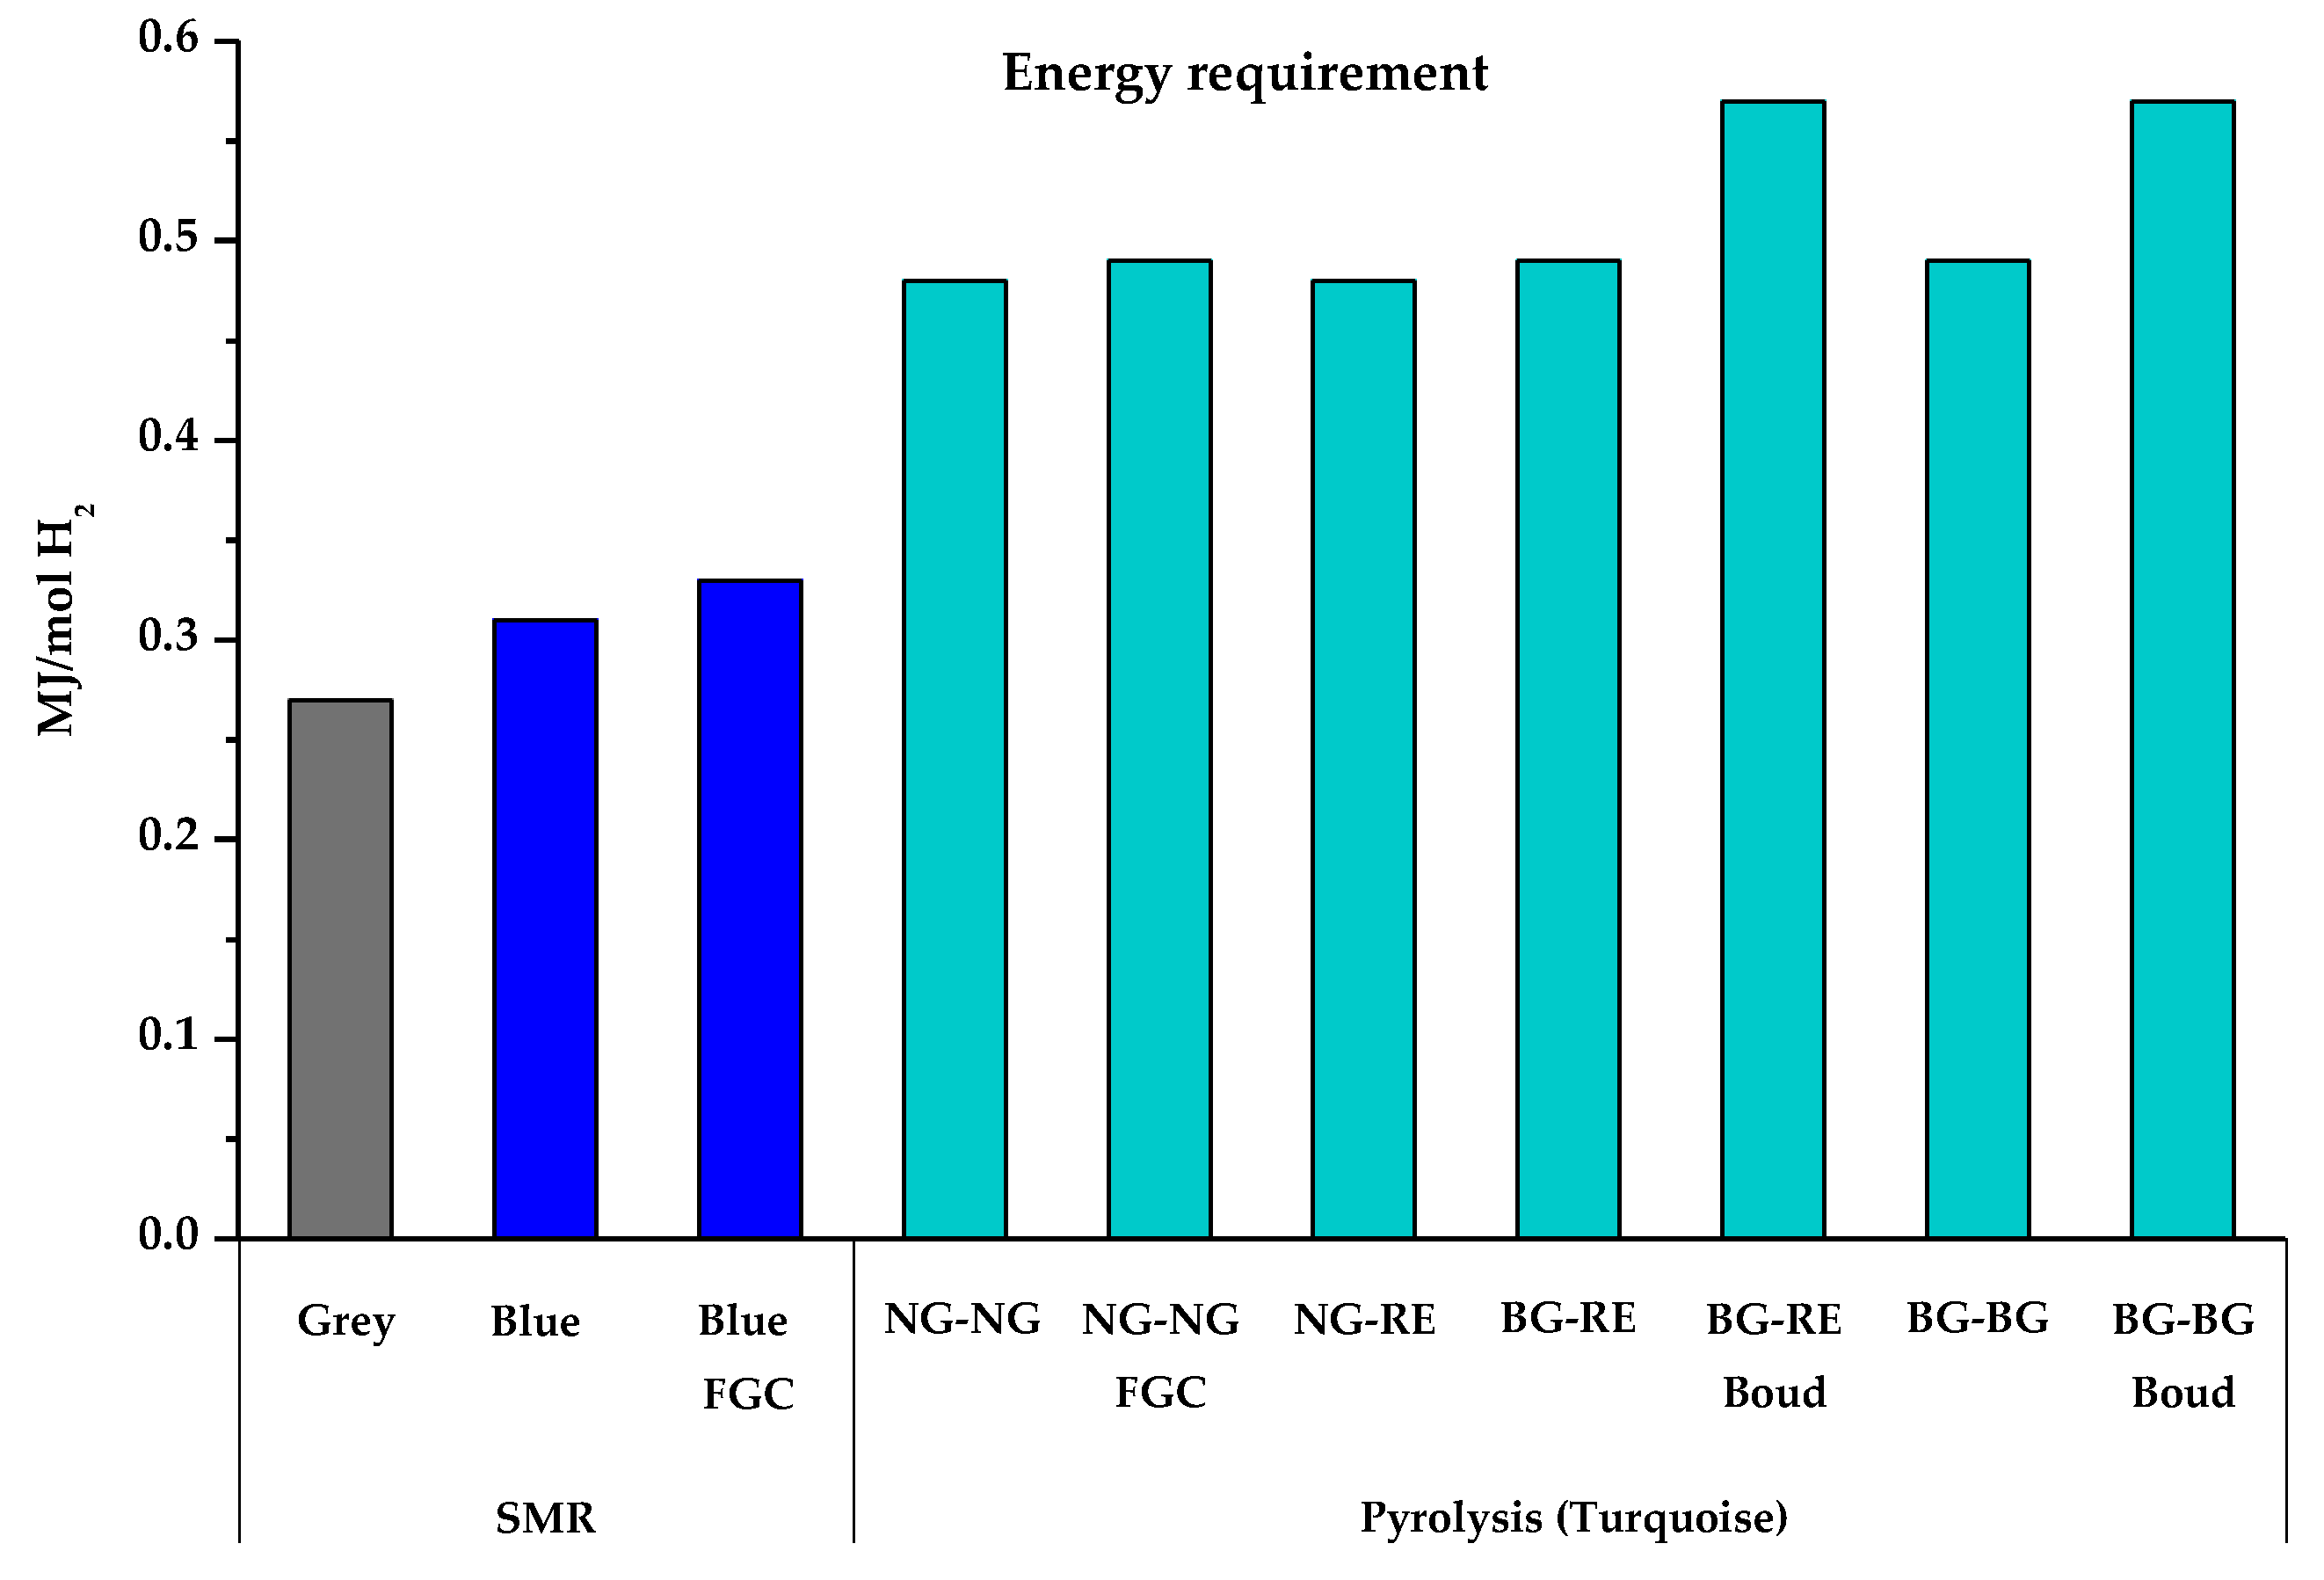
| Energy required for the process (MJ/mol H2) | 0.27 | 0.31 | 0.33 | 0.48 | 0.49 | 0.48 | 0.49 | 0.57 | 0.49 | 0.57 | |
| Equations | No. |
|---|---|
| (3.5 mol H2/MJ) × (1 mol CO2/4 mol H2) × (44.01 g/mol CO2) = 38.47 g CO2/MJ | (2) |
| (3.5 mol H2/MJ) × (1 mol CH4/4 mol H2) × (16.04 g/mol CH4) = 14.02 g CH4/MJ | (3) |
| (0.60 kWh/m3 H2) × (3.6 MJ/kWh) × (2.02 g/mol H2)/(0.085 × 1000 g/m3 H2) = 0.052 MJ/mol H2 | (4) |
| (0.052 MJ/mol H2) × (3.5 mol H2/MJ)/((53.6/1000) MJ/g CH4) = 3.36 g CH4/MJ | (5) |
| (0.21 mol CH4/MJ) × (1 mol CO2/1 mol CH4) × (44.01 g/mol CO2) = 9.23 g CO2/MJ | (6) |
| 7.5% × (47.70 g CO2/MJ) = 3.58 g CO2/MJ | (7) |
| (3.4% of NG production) × (159.60 EJ/154.58 EJ) = 3.5% of NG consumption | (8) |
| (3.5% of NG consumption) × (14.02 g CH4/MJ) = 0.49 g CH4/MJ | (9) |
| (3.5% of NG consumption) × (3.36 g CH4/MJ) = 0.12 g CH4/MJ | (10) |
| (0.49 g CH4/MJ) × (86 g CO2eq/g CH4) = 42.33 g CO2eq/MJ | (11) |
| (0.12 g CH4/MJ) × (86 g CO2eq/g CH4) = 10.15 g CO2eq/MJ | (12) |
| (100–85%) × (38.47 g CO2/MJ) = 5.77 g CO2/MJ | (13) |
| (100–65%) × (9.23 g CO2/MJ) = 3.23 g CO2/MJ | (14) |
| (25%) × [(38.47 g CO2/MJ) − (5.77 g CO2/MJ)] = 8.17 g CO2/MJ | (15) |
| (39%) × [(9.23 g CO2/MJ) − (3.23 g CO2/MJ)] = 2.34 g CO2/MJ | (16) |
| (8.17 g CO2/MJ) × (16.04 g CH4/44.01g CO2) × (1 mol CH4/1 mol CO2) = 2.98 g CH4/MJ | (17) |
| (10.51 g CO2/MJ) × (16.04 g CH4/44.01g CO2) × (1 mol CH4/1 mol CO2) = 3.83 g CH4/MJ | (18) |
| 7.5% × (55.87 g CO2/MJ) = 4.19 g CO2/MJ | (19) |
| 7.5% × (58.21 g CO2/MJ) = 4.37 g CO2/MJ | (20) |
| (3.5% of NG consumption) × (2.98 g CH4/MJ) × (86 g CO2eq/g CH4) = 9.00 g CO2eq/MJ | (21) |
| (3.5% of NG consumption) × (3.83 g CH4/MJ) × (86 g CO2eq/g CH4) = 11.57 g CO2eq/MJ | (22) |
| (CH4 → 2H2 + C,→ ΔH0 = 37.4 kJ/mol H2 | (23) |
| (3.5 mol H2/MJ) × (1 mol C/2 mol H2) = 1.75 mol C/MJ | (24) |
| (3.5 mol H2/MJ) × (1 mol CH4/2 mol H2) × (16.04 g/mol CH4) = 28.05 g CH4/MJ | (25) |
| (0.54 kWh/m3 H2) × (3.6 MJ/kWh) × (2.02 g/mol H2) / (0.085 × 1000 g/m3 H2) = 0.047 MJ/mol H2 | (26) |
| (0.047 MJ/mol H2) × (3.5 mol H2/MJ)/((53.6 /1000) MJ/g CH4) = 3.05 g CH4/MJ | (27) |
| ((3.05 g CH4/MJ)/(16.04 g/mol CH4)) × (1 mol CO2/1 mol CH4) × (44.01 g/mol CO2) = 8.37 g CO2/MJ | (28) |
| (100–65%) × (8.37 g CO2/MJ) = 2.93 g CO2/MJ | (29) |
| (39%) × [(8.37 g CO2/MJ) − (2.93 g CO2/MJ)] = 2.12 g CO2/MJ | (30) |
| (2.12 g CO2/MJ) × (16.04 g CH4/44.01g CO2) × (1 mol CH4/1 mol CO2) = 0.77 g CH4/MJ | (31) |
| (28.05 g CH4/MJ) × (44.01 g CO2/16.04 g CH4) = 76.94 g CO2/MJ | (32) |
| 7.5% × (85.31 g CO2/MJ) = 6.40 g CO2/MJ | (33) |
| 7.5% × (87.43 g CO2/MJ) = 6.56 g CO2/MJ | (34) |
| (3.5% of NG consumption) × (28.05 g CH4/MJ) × (86 g CO2eq/g CH4) = 84.67 g CO2eq/MJ | (35) |
| (3.5% of NG consumption) × (3.05 g CH4/MJ) × (86 g CO2eq/g CH4) = 9.21 g CO2eq/MJ | (36) |
| (3.5% of NG consumption) × (0.77 g CH4/MJ) × (86 g CO2eq/g CH4) = 2.33 g CO2eq/MJ | (37) |
| (0.54 kWh/m3 H2) × (2.02 g/mol H2)/(0.085 × 1000 g/m3 H2) = 0.013 kWh/mol H2 | (38) |
| (3.5 mol H2/MJ) × (0.013 kWh/mol H2) × (69.25 g CO2eq/kWh) = 3.14 g CO2eq/MJ | (39) |
| (0.043 m3 CH4/MJ)/(57% vol) = 0.075 m3 BG/MJ | (40) |
| (0.075 m3 BG/MJ) × (43% vol) = 0.032 m3 CO2/MJ | (41) |
| (69.25 g CO2eq/kWh) × (0.35 kWh/m3 BG) × (0.075 m3 BG/MJ) = 1.82 g CO2eq/MJ | (42) |
| (69.25 g CO2eq/kWh) × (0.54 kWh/m3 H2) × (0.084 m3 H2/MJ) = 3.14 g CO2eq/MJ | (43) |
| C + CO2 → 2CO,→ ΔH0 = 172.5 kJ/mol CO2 | (44) |
| (69.25 g CO2eq/kWh) × (2.54 kWh/m3 CO2) × (0.032 m3 CO2/MJ) = 5.68 g CO2eq/MJ | (45) |
| (2% of bio-methane production) × (3.96 bcm/3.95 bcm) = 2% of bio-methane consumption | (46) |
| (2% of NG consumption) × (28.05 g CH4/MJ) = 0.56 g CH4/MJ | (47) |
| (0.35 kWh/m3 BG) × (3.6 MJ/kWh) × (0.075 m3 BG/MJ)/((16.27/1000) MJ/g BG) = 5.8 g BG/MJ | (48) |
| ((5.8 g BG/MJ)/(1.187 × 1000 g/m3 BG)) × (57% vol) × ((0.66 × 1000 g/m3)) = 1.83 g CH4/MJ | (49) |
| (0.047 MJ/mol H2) × (3.5 mol H2/MJ)/((16.27/1000) MJ/g BG) = 10.05 g BG/MJ | (50) |
| (2.54 kWh/m3 CO2) × (3.6 MJ/kWh) × (44.01 g/mol CO2)/(1.87 × 1000 g/m3 CO2) = 0.22 MJ/mol CO2 | (51) |
| (0.22 MJ/mol CO2) × (1.37 mol CO2/MJ)/((16.27 /1000) MJ/g BG) = 18.14 g BG/MJ | (52) |
| ((14.02 g CH4/MJ) + (3.36 g CH4/MJ) + (3.83 g CH4/MJ)) × ((53.6/1000) MJ/g CH4)) = 1.14 MJ | (53) |
| (1.14 MJ)/(3.5 mol H2) = 0.33 MJ/mol H2 | (54) |
| ((28.05 g CH4/MJ) × ((53.6/1000) MJ/g CH4)) + ((0.013 kWh/mol H2) × (3.6 MJ/kWh) × (3.5 mol H2/MJ)) = 1.67 MJ | (55) |
| (1.67 MJ)/(3.5 mol H2) = 0.48 MJ/mol H2 | (56) |
| ((88.89 g BG/MJ) × ((16.27/1000) MJ/g BG)) + ((0.35 kWh/m3 BG) × (3.6 MJ/kWh) × (0.075 m3 BG /MJ)) + ((0.54 kWh/m3 H2) × (3.6 MJ/kWh) × (0.084 m3 H2 /MJ)) + ((2.54 kWh/m3 CO2) × (3.6 MJ/kWh) × (0.032 m3 CO2/MJ)) = 2.00 MJ | (57) |
| (2.00 MJ)/(3.5 mol H2) = 0.57 MJ/mol H2 | (58) |
| ((88.89 g BG/MJ) + (5.80 g BG/MJ) + (10.05 g BG/MJ) + (18.13 g BG/MJ)) × ((16.27/1000) MJ/g BG)) = 2.00 MJ | (59) |
| (2.00 MJ)/(3.5 mol H2) = 0.57 MJ/mol H2 | (60) |
| CH4 (% vol) | 57% |
| CO2 (% vol) | 43% |
| Molar mass (kg/mol) | 28.067 |
| Density (kg/m3) | 1.187 |
| Calorific value (MJ/kg) | 16.27 |
| Emission Index (kg CO2/kg H2) | |||||
|---|---|---|---|---|---|
| SMR | Pyrolysis (Turquoise H2) | ||||
| Grey H2 | 7.27 | NG-NG | 2.09 | BG-RE | 0.00 |
| Blue H2 | 3.88 | NG-NG FGC | 1.65 | BG-RE Boud | −8.54 |
| Blue H2 FGC | 3.39 | NG-RE | 0.82 | BG-BG | 0.00 |
| BG-BG Boud | −8.54 | ||||
Publisher’s Note: MDPI stays neutral with regard to jurisdictional claims in published maps and institutional affiliations. |
© 2022 by the authors. Licensee MDPI, Basel, Switzerland. This article is an open access article distributed under the terms and conditions of the Creative Commons Attribution (CC BY) license (https://creativecommons.org/licenses/by/4.0/).
Share and Cite
Ingale, G.U.; Kwon, H.-M.; Jeong, S.; Park, D.; Kim, W.; Bang, B.; Lim, Y.-I.; Kim, S.W.; Kang, Y.-B.; Mun, J.; et al. Assessment of Greenhouse Gas Emissions from Hydrogen Production Processes: Turquoise Hydrogen vs. Steam Methane Reforming. Energies 2022, 15, 8679. https://doi.org/10.3390/en15228679
Ingale GU, Kwon H-M, Jeong S, Park D, Kim W, Bang B, Lim Y-I, Kim SW, Kang Y-B, Mun J, et al. Assessment of Greenhouse Gas Emissions from Hydrogen Production Processes: Turquoise Hydrogen vs. Steam Methane Reforming. Energies. 2022; 15(22):8679. https://doi.org/10.3390/en15228679
Chicago/Turabian StyleIngale, Gayatri Udaysinh, Hyun-Min Kwon, Soohwa Jeong, Dongho Park, Whidong Kim, Byeingryeol Bang, Young-Il Lim, Sung Won Kim, Youn-Bae Kang, Jungsoo Mun, and et al. 2022. "Assessment of Greenhouse Gas Emissions from Hydrogen Production Processes: Turquoise Hydrogen vs. Steam Methane Reforming" Energies 15, no. 22: 8679. https://doi.org/10.3390/en15228679
APA StyleIngale, G. U., Kwon, H.-M., Jeong, S., Park, D., Kim, W., Bang, B., Lim, Y.-I., Kim, S. W., Kang, Y.-B., Mun, J., Jun, S., & Lee, U. (2022). Assessment of Greenhouse Gas Emissions from Hydrogen Production Processes: Turquoise Hydrogen vs. Steam Methane Reforming. Energies, 15(22), 8679. https://doi.org/10.3390/en15228679