Article

Research on Size Optimization of Wave Energy Converters Based on a Floating Wind-Wave Combined Power Generation Platform

1
Department of Engineering, Poly Changda Engineering Co., Ltd., Guangzhou 510620, China
2
School of Naval Architecture, Ocean and Energy Power Engineering, Wuhan University of Technology, Wuhan 430063, China
3
Sanya Science and Education Innovation Park of Wuhan University of Technology, Sanya 572025, China
*
Author to whom correspondence should be addressed.
Energies 2022, 15(22), 8681; https://doi.org/10.3390/en15228681
Submission received: 20 October 2022 / Revised: 10 November 2022 / Accepted: 16 November 2022 / Published: 18 November 2022
(This article belongs to the Special Issue Wind and Wave Energy Resource Assessment and Combined Utilization)

Abstract

:
Wind energy and wave energy often co-exist in offshore waters, which have the potential and development advantages of combined utilization. Therefore, the combined utilization of wind and waves has become a research hotspot in the field of marine renewable energy. Against this background, this study analyses a novel integrated wind-wave power generation platform combining a semi-submersible floating wind turbine foundation and a point absorber wave energy converter (WEC), with emphasis on the size optimization of the WEC. Based on the engineering toolset software ANSYS-AQWA, numerical simulation is carried out to study the influence of different point absorber sizes on the hydrodynamic characteristics and wave energy conversion efficiency of the integrated power generation platform. The well-proven CFD software STAR CCM+ is used to modify the heaving viscosity damping of the point absorber to study the influence of fluid viscosity on the response of the point absorber. Based on this, the multi-body coupled time-domain model of the integrated power generation platform is established, and the performance of the integrated power generation platform is evaluated from two aspects, including the motion characteristics and wave energy conversion efficiency, which provides an important reference for the design and optimization of the floating wind-wave power generation platform.

1. Introduction

In recent years, the integration of floating wind turbines and Wave Energy Converters (WECs) onto a single platform for combined utilization has become a research hotspot. Some European countries first launched a series of ocean energy projects, such as Poseidon P37, W2Power and WindWavefloat, aiming at promoting the development and application of the combined utilization platform of wind and wave energies and exploring the various combination forms of WECs integrated with offshore wind turbines. Peiffer et al. [1] proposed a hybrid integrated platform consisting of the WindFloat three-column semi-submersible floating platform and a point absorber WEC. Additionally, Aubault et al. [2] proposed a concept that integrates the Oscillating Water Column (OWC) WECs with the WindFloat floating wind turbine. Their studies show that by adding WEC to WindFloat, the mooring and power infrastructure can be shared, and the overall economic cost can be effectively reduced. Soulard and Babarit [3] proposed a hybrid platform that combines a 5 MW wind turbine with floating Oscillating Surge Wave Energy Converters (OSWECs) and preliminarily evaluated its response and power generation using both the frequency-domain and time domain approaches. Their studies prove that the power generation time–history curve of the combined platform is smoother than that of the single platform. Muliawan et al. [4] and Luan et al. [5] proposed the Spar-Torus Combination (STC) concept and the Semi-submersible Flap Combination (SFC) concept, respectively. Their research shows that the integration of WECs onto the floating wind turbine foundation can improve the overall power generation and reduce the dynamics of the wind turbine foundation to a certain extent. Gaspar et al. [6] investigated the concept of using WECs to compensate for the dynamics of a hybrid wind-wave power generation platform. Their research shows that the ballast water system of the platform assisted by the WECs can expand the working sea-state range to a certain extent.
The aforementioned studies show that the WEC can cooperate well with the floating wind turbine. Further, in the aspect of WEC design, based on the SFC concept [5], Michailides et al. [7] further investigated the influence of the number of flap-type WECs on the stability, motion, and internal load of the combined power generation platform. The results show that the combined operation of the rotating flaps can increase the overall power generation without greatly affecting the response of the semi-submersible wind turbine foundation. For the STC concept, Wan et al. [8] and Muliawan et al. [9] further studied the responses of the STC platform under extreme sea-states, which provided an important reference for the design of WEC to be integrated with a Spar-type floating wind turbine. Hallak et al. [10] studied the linear hydrodynamic interaction of a hybrid power generation platform combining DeepCWind semi-submersible platform with conical point absorbers. Their results show that the mechanical coupling of the combined platform can amplify the heave response of the platform. Thus, a more realistic physical model should be considered in the power take-off (PTO) system design, such as the selection of the stiffness and damping of the PTO system. Wang et al. [11] proposed a marine energy structure composed of a 5 MW bracket-free semi-submersible floating wind turbine and a pendulum WEC. They determined its reasonable draft, size, and PTO damping coefficient by numerical simulations and also studied the influence of viscosity on the dynamics of the coupled system. González et al. [12] performed parametric studies to investigate the rigid body dynamics of a hybrid platform consisting of a semi-submersible foundation and a point absorber WEC. Their research shows that the relatively slender point absorber and larger heave plate of the semi-submersible foundation can effectively reduce the dynamics of the hybrid system. Sun et al. [13] carried out basin tests to evaluate the concept of combining a semi-submersible floating wind turbine platform with six cone-bottom point absorber WECs. Their results show that the point absorbers should be staggered, and the energy conversion efficiency of multiple point absorbers is higher than that of a single point absorber in the low wave period range. Hu et al. [14] applied the frequency-domain hydrodynamic model with viscosity correction to optimize the size and layout of the WECs in a combined wind-wave power generation platform. Lee et al. [15] investigated the coupled dynamics of the floating platform with multiple WECs by considering multi-body hydrodynamic interactions. Hantoro et al. [16] applied both numerical and experimental methods to investigate the relation between the response of the trimaran-type pontoon array WEC and its pendulum system. This study shows that the differences in array arrangement and wave period affect the pitching motions of the pontoon. Similar to the concept proposed by Peiffer et al. [1], Chen et al. [17] proposed an integrated wind-wave power generation platform with a point absorber WEC placed inside the semi-submersible wind turbine foundation. This concept aims to benefit from the near-trapping effects caused by the multiple columns of the semi-submersible foundation to enhance the wave power generation of the point absorber WEC, which uses the relative heaving motions between the foundation and WEC to generate electricity with the PTO system placed on the foundation. Following this concept, Chen et al. [18] established a dynamic coupling method between AQWA and Fast to perform a fully coupled analysis of the integrated wind-wave power generation platform, which confirmed the feasibility and advantages of this concept. However, none of the above studies has systematically analyzed and optimized the size of WEC to be integrated with a floating wind turbine. Based on the concept proposed by Chen et al. [17], this study aims to optimize the size of the WEC based on frequency-domain hydrodynamic analyses. In this study, the well-proven hydrodynamic software ANSYS-AQWA is used to carry out frequency-domain hydrodynamic analyses of the multi-body system. The influence of the size of the point absorber WEC on the hydrodynamic characteristics and wave energy conversion efficiency of the integrated wind-wave power generation platform is studied. On this basis, CFD software STAR CCM+ is used to correct the heaving damping viscosity of the point absorber WEC. In addition, a multi-body coupled time-domain model, considering only the heaving motions of the integrated platform, is also established in ANSYS-AQWA. The responses and wave power generation efficiency of the integrated platform are explored in both regular and irregular waves. Compared with a single WEC, it may be concluded that the dynamic and hydrodynamic coupling effects of the integrated platform can improve the WEC’s power generation efficiency within a certain wave frequency range, and it makes up the research gap of Chen et al. [17,18] in the optimization of WEC size. Besides, this study can provide an important reference for the design and optimization of a floating wind-wave power generation platform.

2. Mathematical Model

The analyzed integrated platform is based on an OC4 semi-submersible floating wind turbine foundation, as reported by Robertson et al. [19] and Cheng et al. [20]. The particulars of the semi-submersible foundation are summarized in Table 1 [19,20]. Based on the concept by Chen et al. [17,18], a point absorber WEC is placed in the center of the semi-submersible platform, and the PTO system is placed directly above the point absorber, as shown in Figure 1. Figure 1a shows the hydrodynamic model of the integrated platform, in which the connecting members of the semi-submersible foundation that have little effect on the hydrodynamic interaction are omitted to simplify the frequency-domain hydrodynamic analysis. The PTO system is demonstrated in Figure 1b. Under the wave action, the point absorber and the semi-submersible platform would move vertically, and the mechanical energy of this relative vertical motion is converted into electrical energy by the PTO system. In the following discussions, for simplicity, the point absorber WEC and the semi-submersible foundation are designated as “floater” and “platform”, respectively.

2.1. Frequency-Domain Model

Considering the coupling effect of floater (point absorber) and platform (semi-submersible foundation) through a linear PTO system and only the heaving motion of the hybrid system, the hydrodynamic coupling model in the frequency-domain has the following expression:
ω 2 M 33 + A 33 ( ω ) A 39 ( ω ) A 93 ( ω ) M 99 + A 99 ( ω ) i ω B 33 ( ω ) + B p t o + B v B 39 ( ω ) B p t o B 93 ( ω ) B p t o B 99 ( ω ) + B p t o + C 33 + K p t o K p t o K p t o C 99 + K p t o x 3 ( i ω ) x 9 ( i ω ) = f 3 e x c i ω f 9 e x c i ω
where, M 33 , A 33 ( ω ) , B 33 ( ω ) , C 33 , x 3 ( i ω ) and f 3 e x c i ω are rigid mass matrix, added mass, radiation damping, hydrostatic restoring force stiffness matrix, response amplitude operator (RAO) and wave exciting force of the floater in the heave direction, respectively; M 99 , A 99 ( ω ) , B 99 ( ω ) , C 99 , x 9 ( i ω ) and f 9 e x c i ω are rigid mass matrix, added mass, radiation damping, hydrostatic restoring force stiffness matrix, RAO and wave exciting force of the platform in the heave direction; A 39 ( ω ) and A 93 ( ω ) are the coupling term of added mass between the floater and platform; B 39 ( ω ) and B 93 ( ω ) are the coupling term of radiation damping between the floater and platform; B p t o , K p t o and B v are the PTO damping, PTO stiffness and viscous damping of the floater in heave mode of motion, respectively.
The viscous damping of the floater in heave model of motion can be generally obtained according to the free attenuation curve [18]. The attenuation coefficient can be calculated based on the following equation:
κ = ln X 1 ln X N + 1 2 π N
where, N is the number of motion attenuation and X i is the amplitude of the i th motion.
After calculating the free attenuation coefficient, the total damping coefficient in the heave mode of motion can be obtained:
B v i s = 2 κ C 33 M 33 + A 33
Tom [21] proved in the experiment that the change in wave frequency has little influence on the viscous effect. Therefore, the total damping coefficient at the natural frequency can be calculated by Eq. (3). Combined with Tom’s conclusion, the additional viscous damping can be approximated: [22]
B v = B v i s B n
where, B n is the radiation damping of the floater at the resonance frequency.
The frequency-generating power of WEC can be expressed as:
P a v e = 1 2 B p t o ω 2 x 3 ( i ω ) x 9 ( i ω ) 2

2.2. Time-Domain Model

The simplified schematic diagram of the floating wind-wave combined platform is shown in Figure 1. Based on Cummins equation which describes the time-domain motion of the floating body [23], a simplified time-domain model considering only heave motions and the PTO system of the integrated platform can be established in ANSYS-AQWA:
M 33 + A 33 ( ) A 93 ( ) A 39 ( ) M 99 + A 99 ( ) x ¨ 3 x ¨ 9 + 0 t K 33 t τ x ˙ 3 τ d τ 0 t K 39 t τ x ˙ 9 τ d τ 0 t K 93 t τ x ˙ 3 τ d τ 0 t K 99 t τ x ˙ 9 τ d τ + B p t o + B v B p t o B p t o B p t o x ˙ 3 x ˙ 9 + C 33 + K p t o K p t o K p t o C 99 + K p t o x 3 x 9 = f 3 ( t ) f 9 ( t ) + 0 f m ( t )
where A ( ) is the approximate added damping coefficient; K t is impulse response functions; x is the displacement of the floater in the heave direction; f ( t ) and f m ( t ) are, respectively, the wave exciting force matrix and the mooring load matrix; Subscripts 3 and 9 refer to the degree of freedom in the heave of the floater and platform respectively.
Among them, the infinite frequency added mass and approximate damping coefficient of the floating body can be obtained by frequency-domain analysis software ANSYS-AQWA. And then, based on the conversion relationship between the hydrodynamic coefficient and impulse response function proposed by Ogilvie [24], the infinite frequency added mass coefficient is calculated according to Equations (7) and (8).
K ( t ) = 2 π 0 B ( ω ) cos ( ω t ) d ω
A = A ( ω ) + 1 ω 0 K ( t ) sin ω t d t
According to the time–history curve of speed, the average generated power can be calculated as follows [25]:
P a v e = 1 t p 0 t p B p t o x ˙ 3 2 τ d τ
where, t p is the calculation duration of multiple exercise cycles.

3. Hydrodynamic Analysis in Frequency-Domain

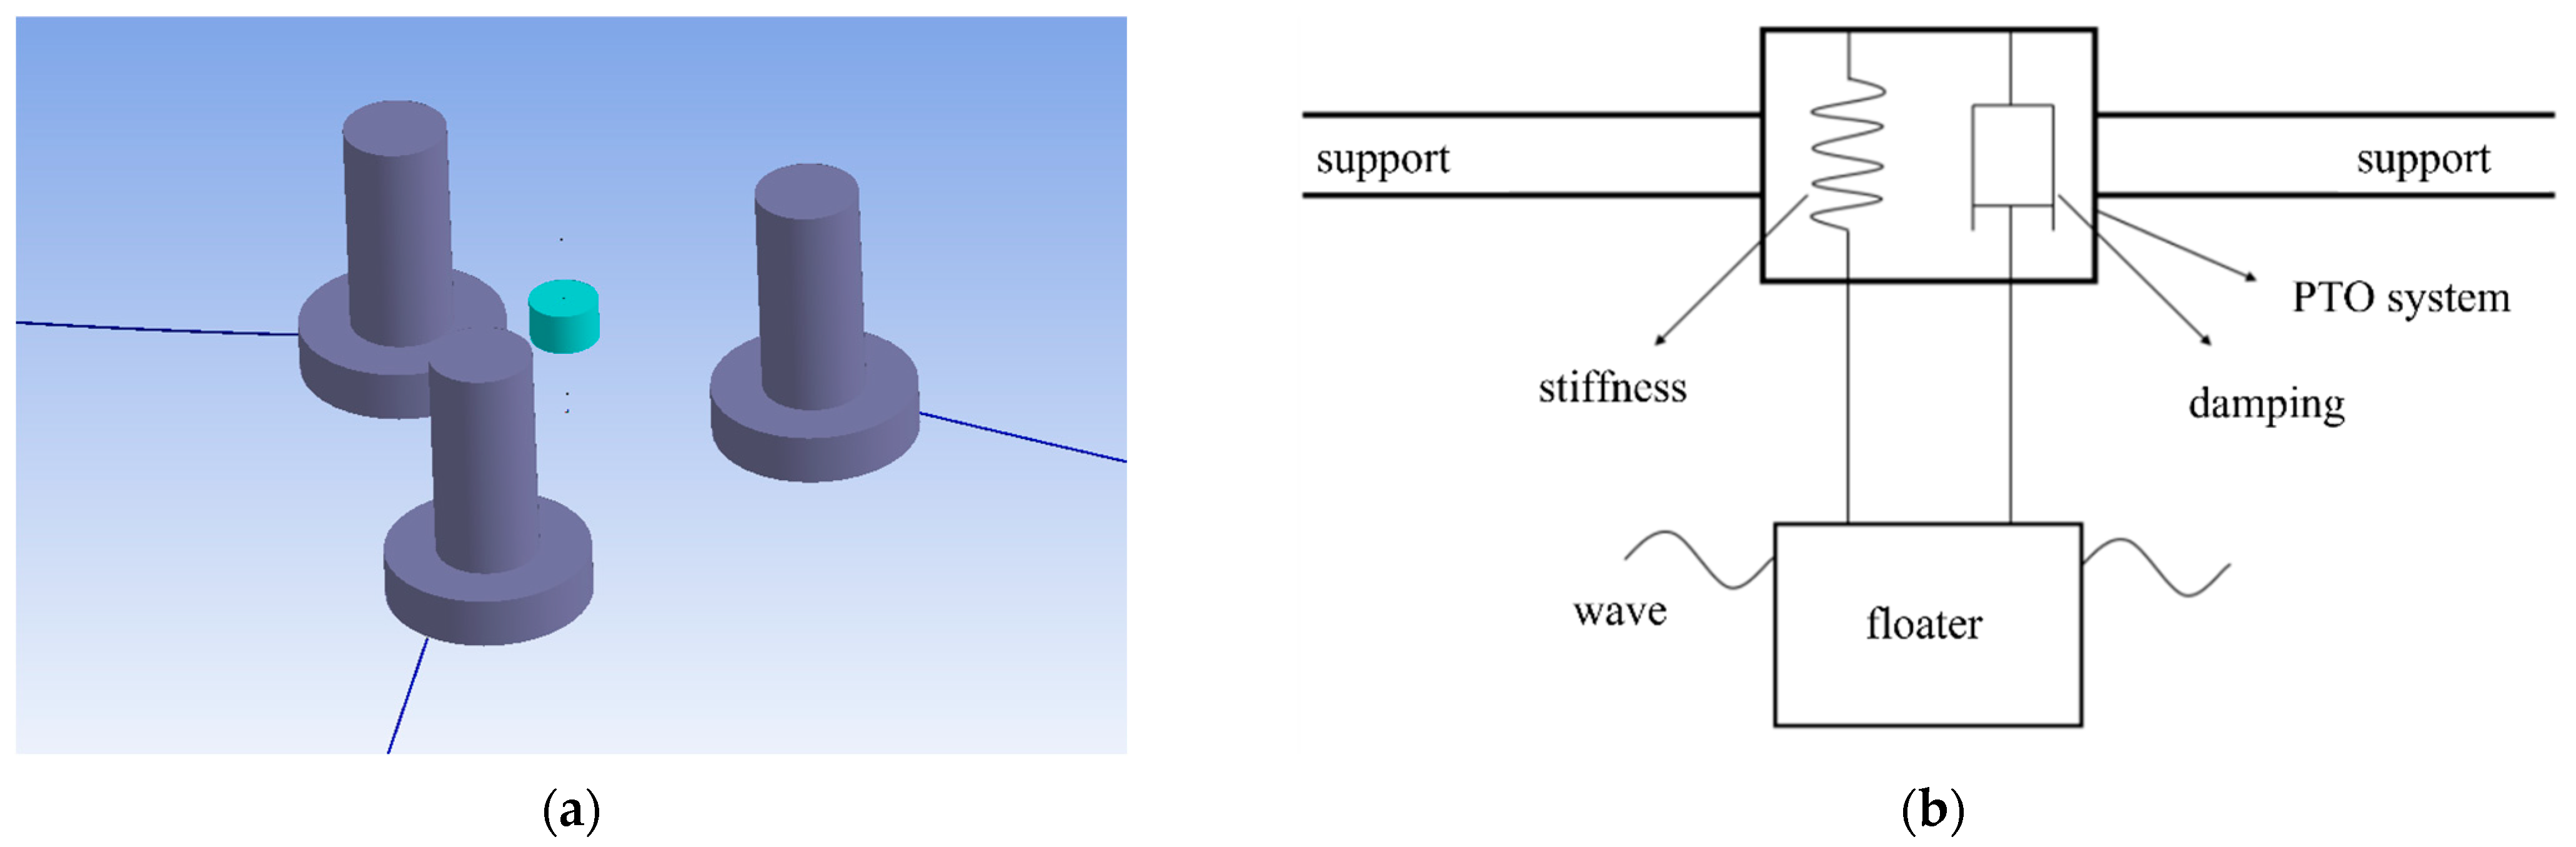
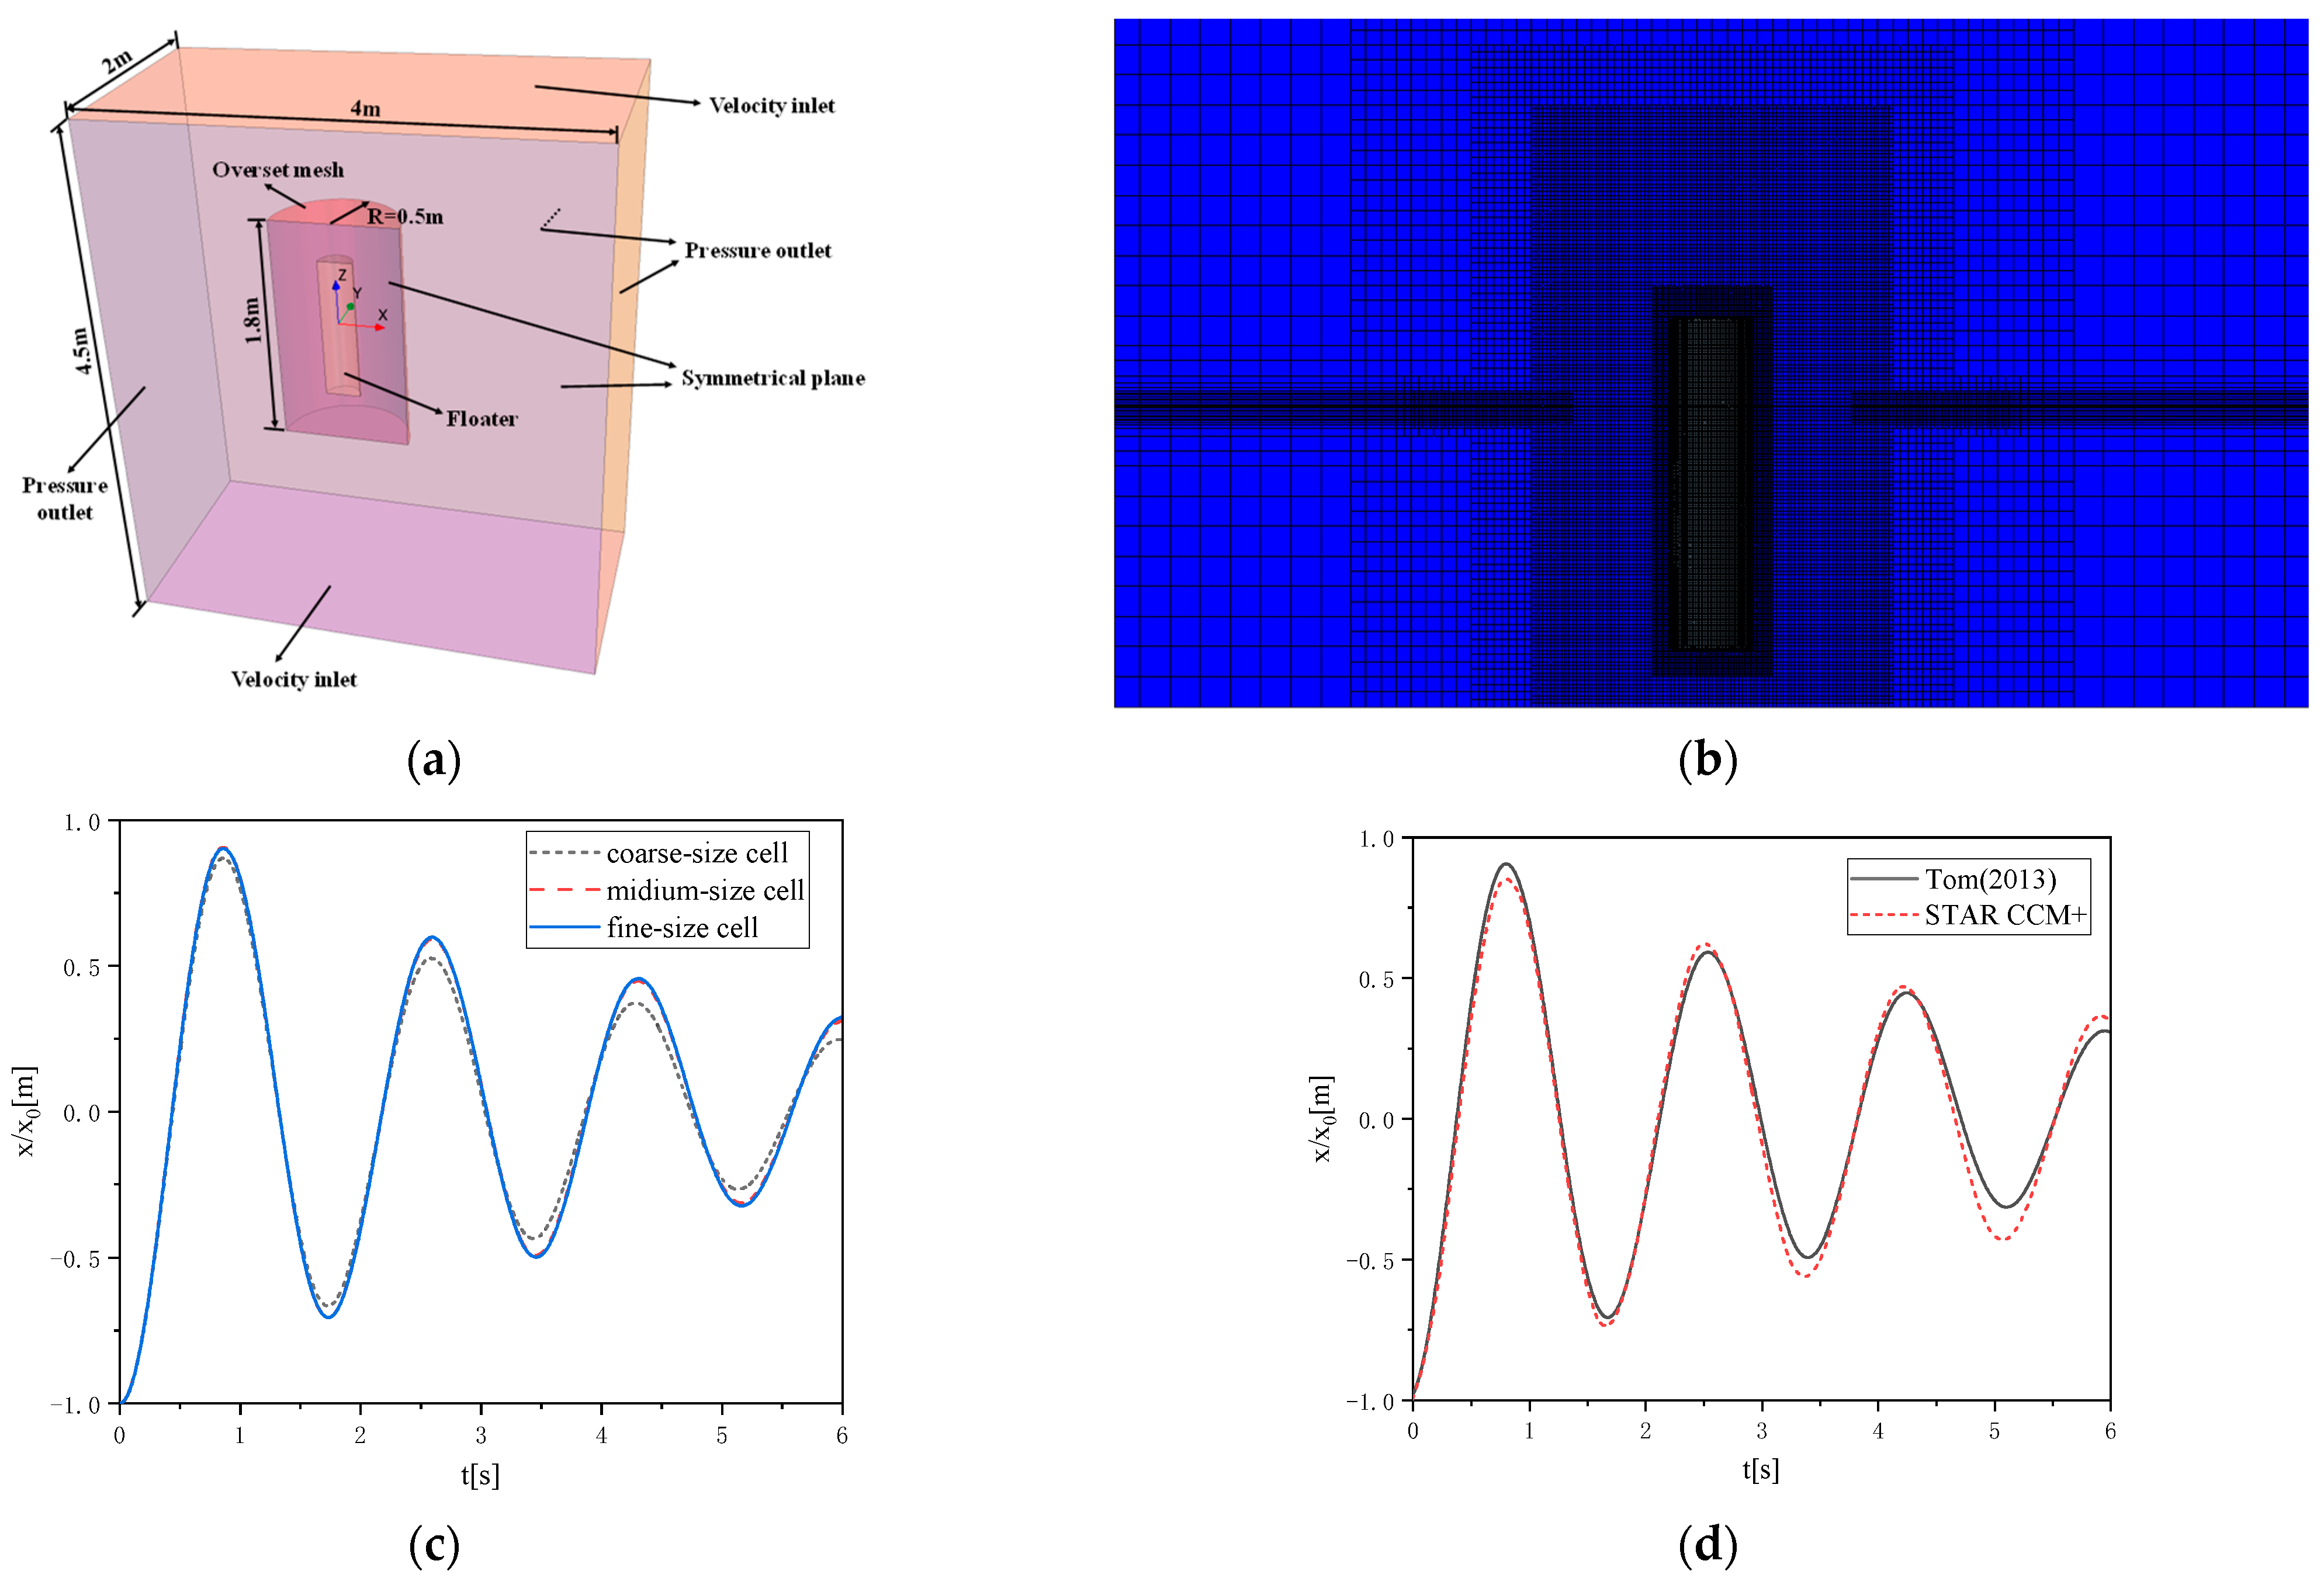
3.1. Viscosity Correction for Hydrodynamic Calculation

To calculate the viscosity coefficient of the floater, CFD software STAR CCM+ is used to carry out the free decay test. According to the test results and based on the viscosity correction method [22], the viscosity coefficient of the floater falling freely from a certain height on the water surface is calculated. In the experiment, a simplified three-dimensional model of an oscillating float is adopted. Because of the symmetry of the model, only half of the model is used for the calculation to improve the calculation efficiency. In this study, it is necessary to simulate the real motion of the oscillating floater for a long time and a long distance, and based on the consideration of simulation accuracy, the physical model adopts the K-ε turbulence model and uses overlapping mesh technology to capture the motion trajectory of the floater. The volume of fluid (VOF) method is used to capture the liquid level change at the interface between water and air because the floater is in the two-phase flow of water and air. The calculation domain used in this study includes the background area of the simulated water area and the overlapping area of simulated floater motion, in which the background area is a cuboid with enough width and depth, and the overlapping area is obtained by subtracting the float itself from the smaller cylinder that wraps the float. The flow field information is transmitted between them by linear interpolation. When setting boundary conditions in the region of the background, the top and bottom are taken as velocity inlets, the middle and longitudinal sections of the float are divided into symmetrical planes, and the other boundaries are all pressure outlets. During the simulation, the waves generated by the movement of the float will spread all around. To eliminate the influence of wave reflection on the results, damping to eliminate wave are set on the plane with the boundary condition of the pressure outlet. When meshing, the grids near the float and the free surface are properly encrypted, which makes the simulation results more accurate.
To verify the accuracy of the numerical simulation results, the free decay test is carried out on the cylindrical floater studied by Tom [21] and Chen [18,26]. The diameter of the cylindrical floater is 0.273 m, and the draft is 0.6123 m. The calculation domain and boundary conditions are set, as shown in Figure 2a. To eliminate the influence of cell size on simulation results, three sets of cells, coarse (1.43 million cells), medium (1.95 million cells) and fine (2.85 million cells), are selected for mesh convergence analysis, with the medium-sized cell set as shown in Figure 2b. The comparison of the simulation results of three sets of cells is shown in Figure 2c, and the result shows that the difference between the medium-sized cell and the fine-sized cell is very small, which indicates that the cell has converged. Therefore, on the premise of ensuring calculation accuracy and improving calculation efficiency, the medium-sized cell is used for the subsequent numerical simulation. Then, the CFD numerical simulation results are compared with the experimental data, as shown in Figure 2d. The result shows that the numerical simulation is accurate.
To calculate the response of more accurately, it is necessary to consider the viscous effect in ANSYS-AQWA. Simplify the floater into a cylinder with a draft of 3 m, and then CFD-free decay tests are carried out for four groups of floaters with different radii, and the viscous damping of the floaters is calculated according to Equations (2)–(4). Relevant parameters are shown in Table 2.
The calculated viscous damping of floaters with different radii is introduced into ANSYS-AQWA as a linear floater damping term, and then the free attenuation motion of floaters with different radii is calculated, and the motion results under the inviscid correction are compared with the STAR CCM+ calculation results, such as Figure 3. The free attenuation motion characteristics of the revised floaters with different radii are basically consistent with the CFD method, which verifies the accuracy of the viscosity correction results.

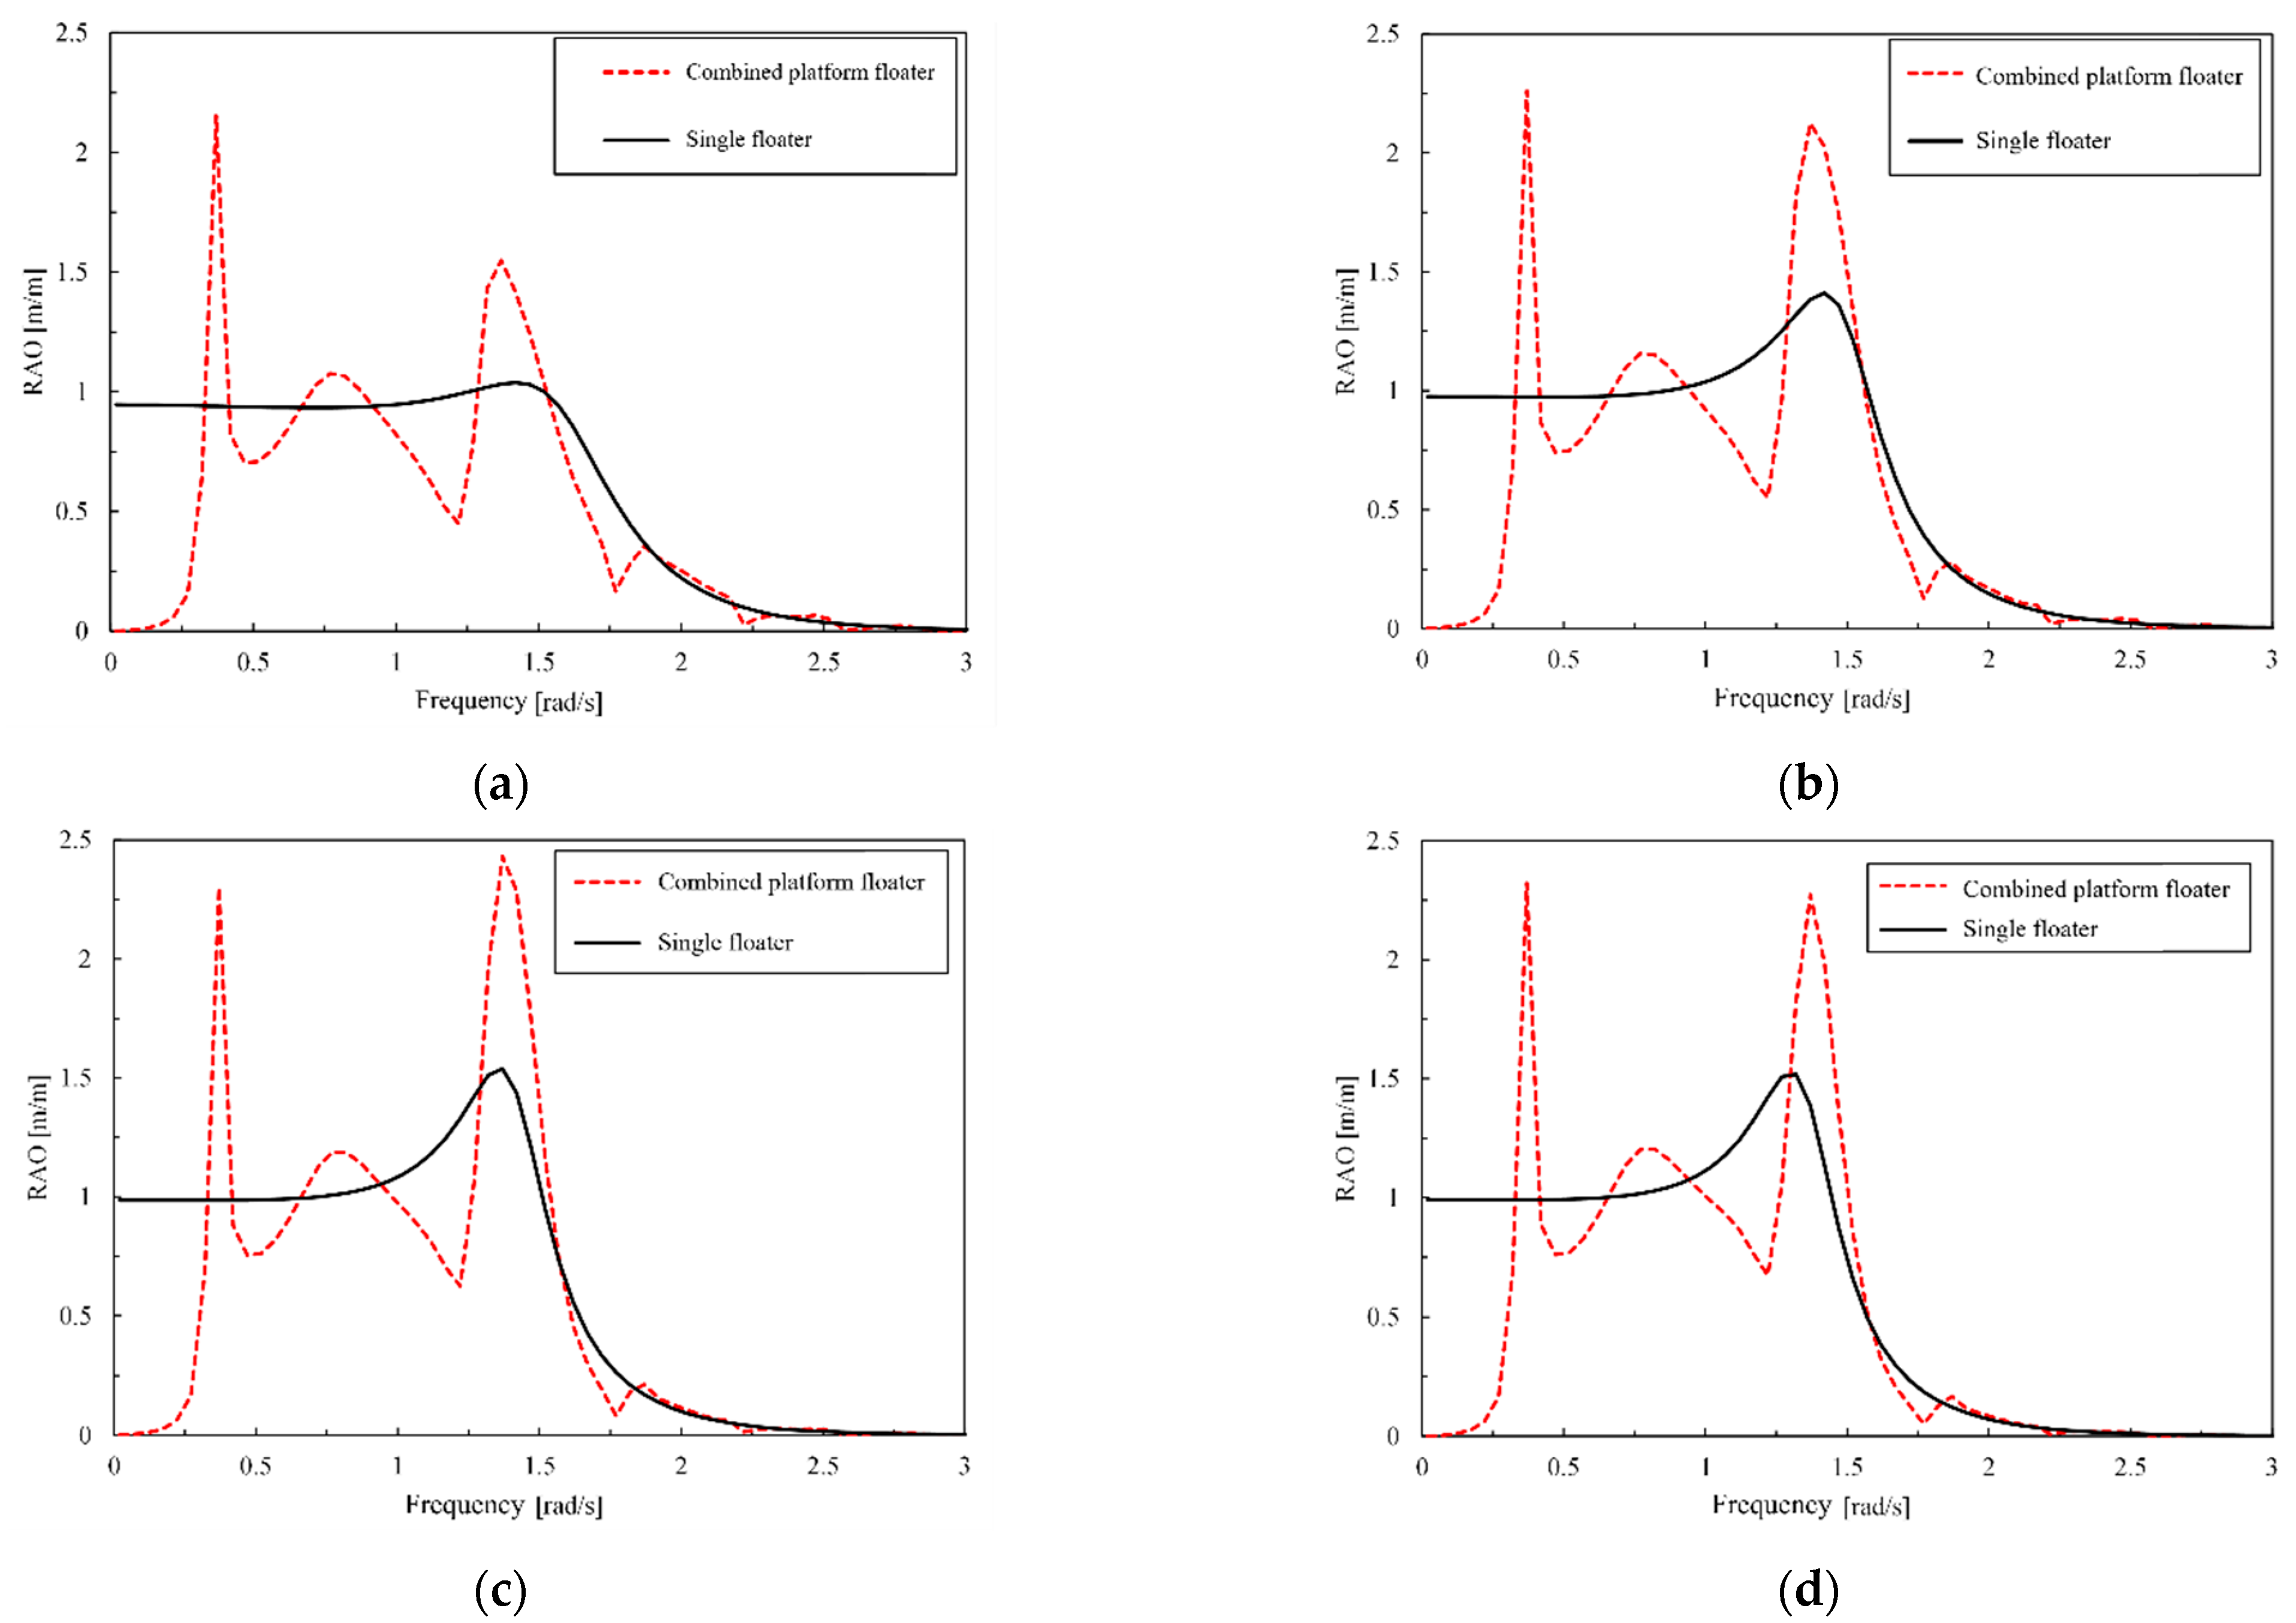
3.2. Floater RAO in Free-Floating State

For the point absorber WEC device, the heave RAO of the floater is a key index to evaluate the power generation efficiency of the floater. In this study, four groups of floaters with different radii are respectively combined with the semi-submersible platform foundation, and five wave directions of 0, 45, 90, 135 and 180 are selected, such as shown in Figure 4a, taking 0 wave direction as an example, the heave RAO values of the floater and the platform under different radii are compared, as shown in Figure 4b, the semi-submersible platform foundation RAO is almost the same under different floater radii, so only the platform RAO curve with a radius of 2 m is displayed. The platform motion amplitude and resonance frequency are smaller than those of the floater, and the peak period of RAO is around 20 s, exceeding the normal wave period. When the radius of the floater is 2 m in the platform, the amplitude of heave RAO is the largest and decreases with the increase of floater radius.
To explore the performance improvement of different-size floaters in the combined platform under different wave directions, the vertical heave RAO of four groups of size floaters in different wave directions was compared with that of a single floater, such as Figure 5 shown. When the radius of the floater is 2 m and 3 m, the floater RAO in the combined power generation platform is higher than that of a single floater at 0 and 180 degrees, and it is lower at 45 and 90 degrees, but it is almost the same as that of a single floater at 135 degrees. When the radius of the floater is 4 m, the floaters of the combined platform with five different waves are all higher than that of a single floater, while when the radius is 5 m, the RAO value of the heave of only 135 wave direction is slightly lower than that of a single floater. Among them, the four kinds of radius floaters under the combined platform have the best performance under 0 wave direction, which is consistent with the results in the literature [17], so 0 wave direction is taken as the subsequent calculation condition.

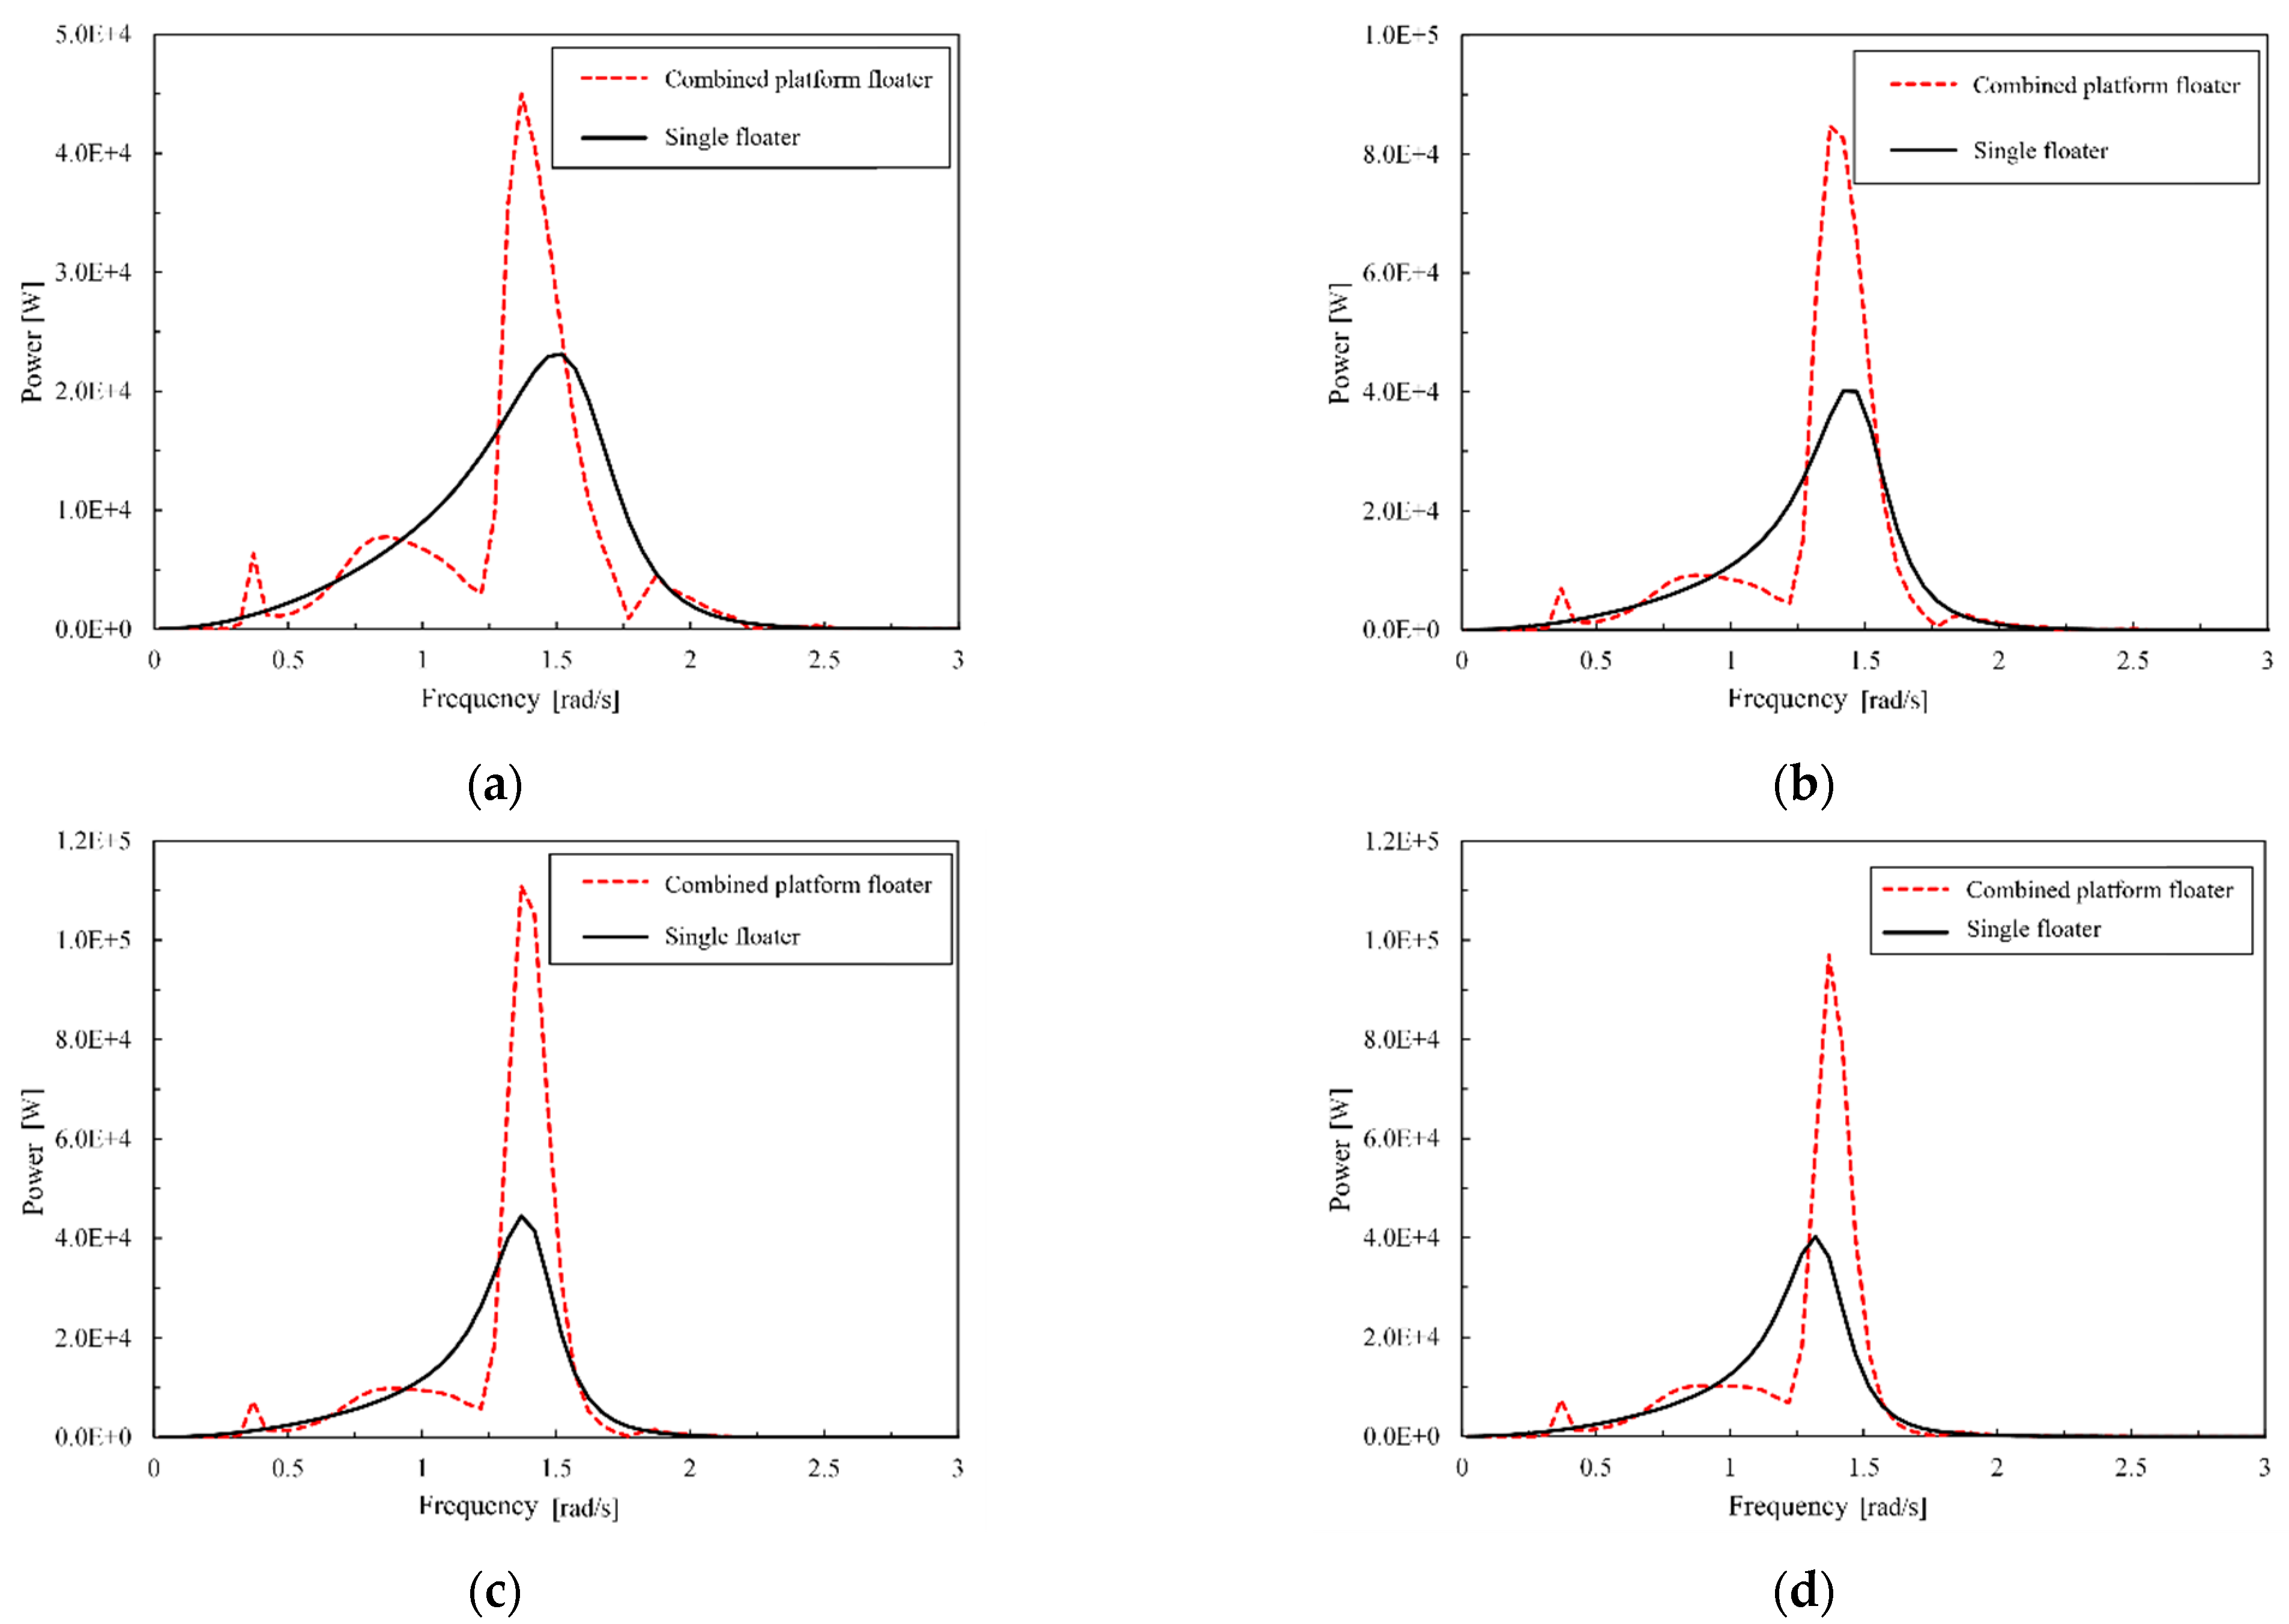
3.3. RAO and Average Power of the Floater in Free-Floating State

ANSYS-AQWA is used to calculate the hydrodynamic coefficient, considering the coupling effect of the PTO system between the floater and the semi-submersible platform foundation, choosing KPTO= 10 kN and BPTO= 20 kN·s/m, the frequency-domain motion amplitude of the floater’s actual power generation can be calculated according to Equation (5), and compared with the motion amplitude and power generation of a single point absorber under the same PTO system, the RAO values under the radius of four groups of floaters and the average power generation in frequency-domain can be obtained, such as Figure 6 and Figure 7 shown. The result shows that under the four groups of floater radii when the RAO value of the floater in the united platform is at a lower frequency, a higher peak value appears because it is close to the resonance frequency of the platform foundation, but the corresponding power generation at this frequency is still low, and the maximum power generation is obtained when the frequency is 1.37 rad/s. At the same time, compared with a single floater, the floater RAO and power generation of the combined power generation platform with four groups of floater radii are significantly improved compared with a single floater.

4. Response Analysis in Time-Domain

To further explore the influence of different sizes of floaters on the overall performance of the combined power generation platform, ANSYS-AQWA is used to further carry out time-domain analysis and analyzes the response and power generation efficiency of point absorbers in the combined power generation platform from two aspects of regular waves and irregular waves, respectively. In ANSYS-AQWA, the Fender module is used to establish a connection between the joint platform and the point absorber to simulate the PTO system, and external forces are applied to the floater and the platform to keep the initial balance, such as shown in Figure 8a, PTO parameters are also selected as KPTO= 10 kN and BPTO= 20 kN·s/m, To verify the accuracy of time-domain simulation, taking a floater with a radius of 4 m as an example, the average power at different calculation frequencies in time-domain and the generated power in frequency-domain are compared and analyzed under the condition of only considering heave motion, such as shown in Figure 8b, the comparison results are basically consistent, which verifies the accuracy of the analysis method. On this basis, further consider the mooring system of the semi-submersible platform foundation and the mooring parameters reference [19,20], as shown in Table 3. Therefore, the response and power generation efficiency under the condition of regular wave and irregular wave are analyzed, respectively.

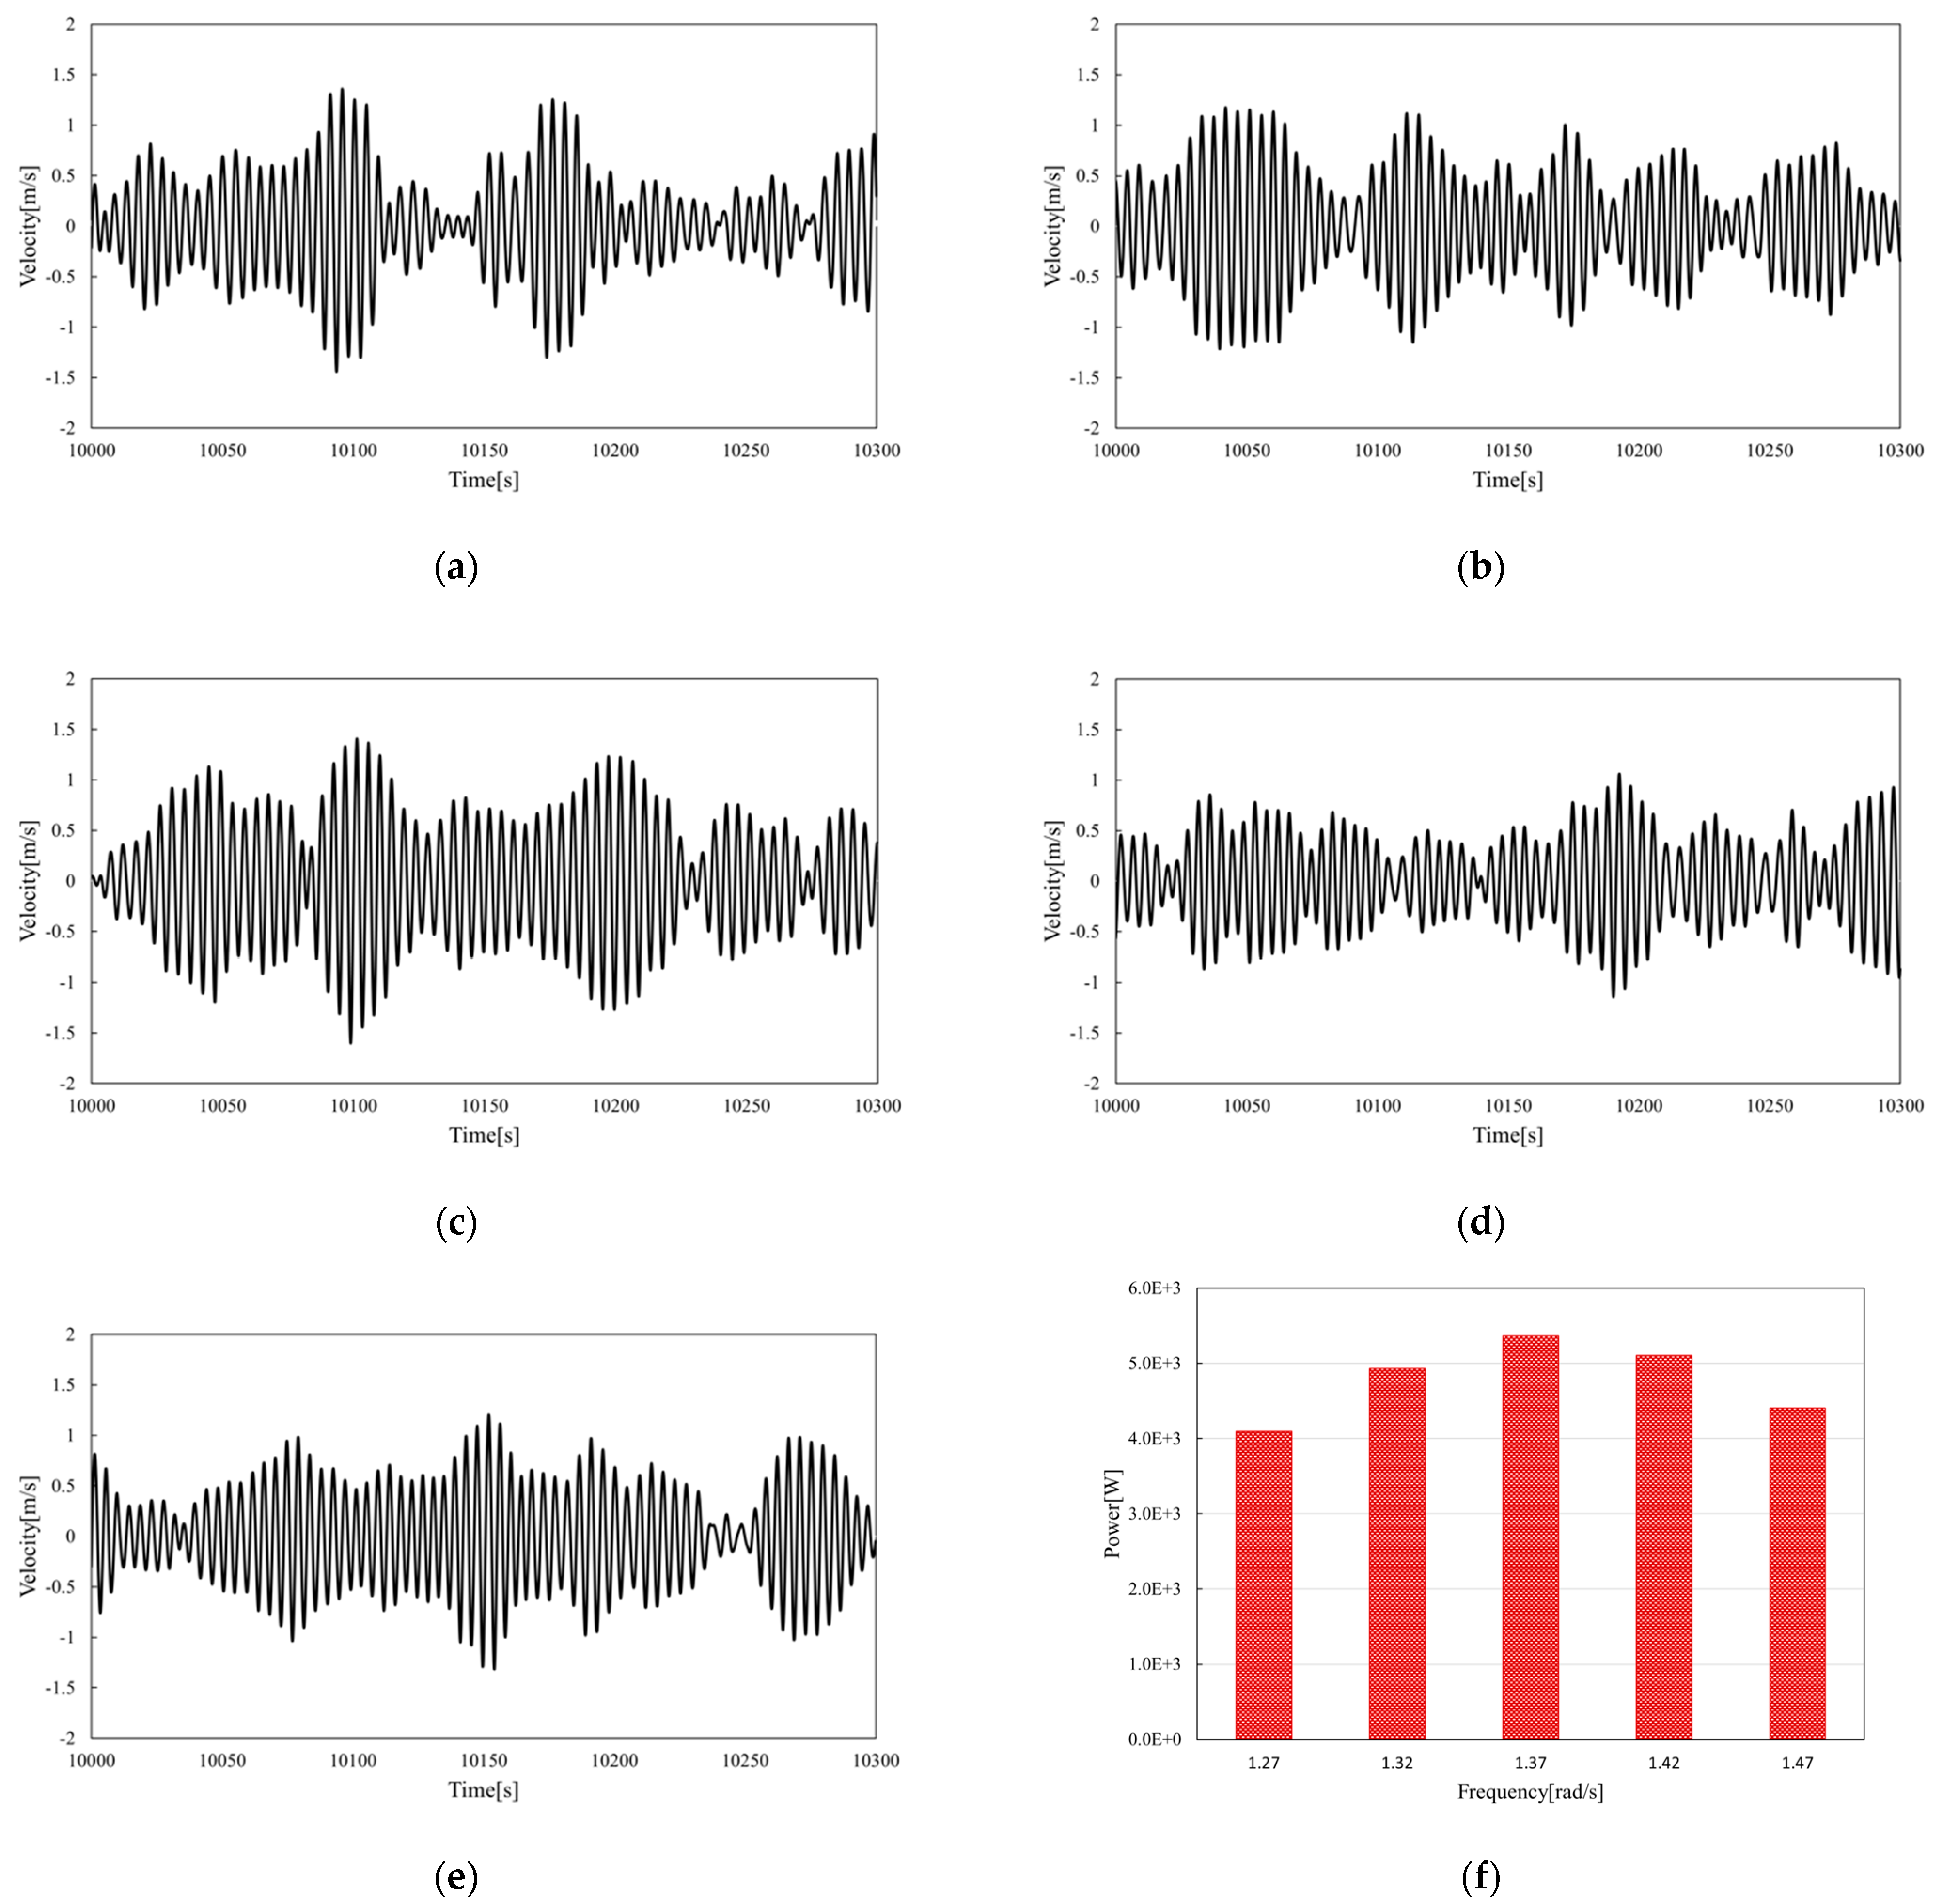
4.1. Analysis of Dynamic Response and Wave Energy Conversion Efficiency of Combined Platform under Regular Waves

According to the four groups of floater radii, to verify whether the generated power of the United platform reaches the maximum value at the resonance frequency of 1.37 rad/s, firstly, under the condition of 0 wave direction regular wave with the amplitude of 1 m, the floaters of the combined platform are analyzed at 1.22 rad/s, 1.27 rad/s, 1.32 rad/s, 1.37 rad/s, 1.42 rad/s and 1.47 rad. The floaters in the combined platform all reach the maximum motion amplitude when the frequency is 1.37 rad/s, which proves the accuracy of calculating the resonance frequency in the frequency-domain.
Based on the above conclusions, the responses of the floater and the single floater in the combined power generation platform at the resonance frequency of 1.37 rad/s are further compared and analyzed. As shown in Figure 9, the displacement of the floater in the combined power generation platform is larger than that of the single floater under four groups of floater radii, which verifies the results of the frequency-domain analysis. At the same time, when the radius is 4 m, the response of a single floater and combined power generation floater is greater than that of other floaters. Then, the velocity and power generation in the combined platform with different floater radii are further compared. As shown in Figure 10 and Figure 11, in this PTO system, the response and power generation first increase and then decrease with the floater radius. The maximum value is 1.25 × 10⁵ W when the radius is 4 m. Meanwhile, the power generation of a single floater also increases first and then decreases with the radius of the floater, and the maximum is 4.57 × 10⁴ W when the radius is 4 m. Meanwhile, the power generation of the floater in the combined power generation platform is significantly higher than that of a single floater with the same radius.

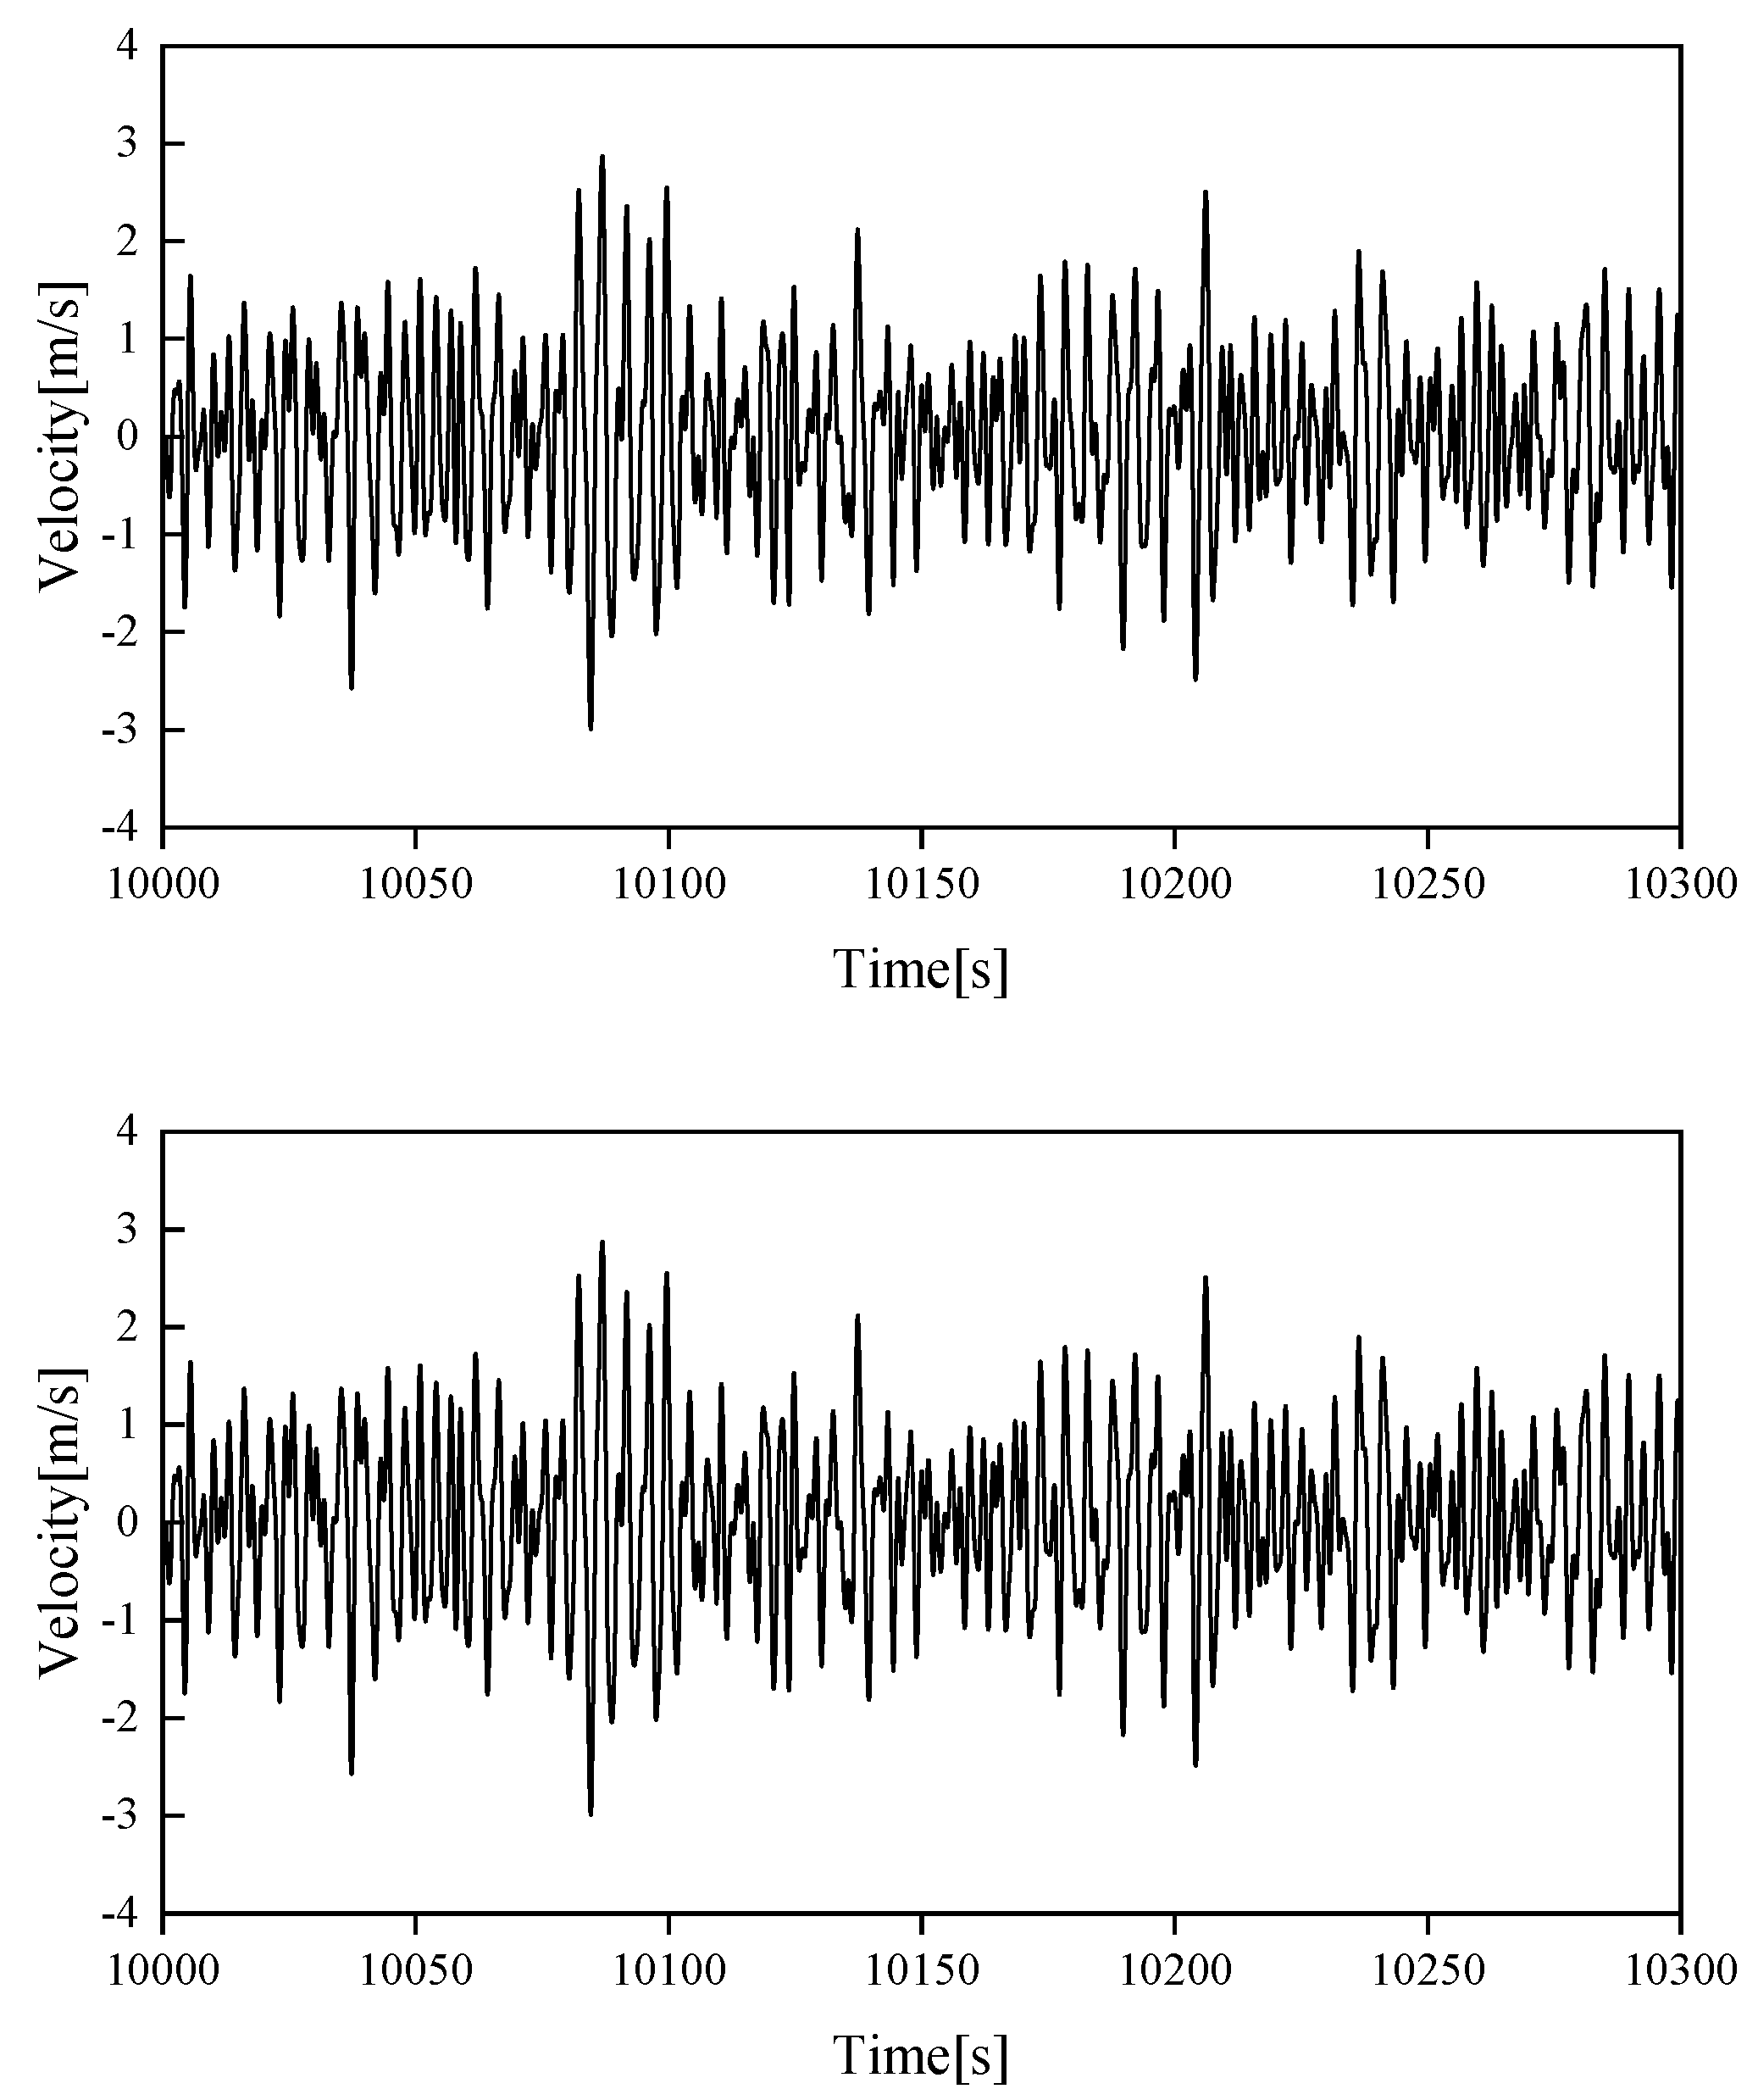
4.2. Analysis of Dynamic Response and Wave Energy Conversion Efficiency of Combined Platform under Irregular Waves

To more truly simulate the power generation performance of the combined power generation platform under the actual sea-states and further consider the irregular wave conditions, the JONSWAP wave spectrum is selected by its universality, with the meaningful wave height of 1 m, spectral peak factor of 3.3 and the wave direction of 0, and the corresponding frequencies of the peak periods are calculated under five working conditions of 1.27 rad/s, 1.32 rad/s, 1.37 rad/s, 1.42 rad/s and 1.47 rad/s, respectively. Three-hour Z-direction wave surface elevation velocity chronogram based on the JONSWAP spectrum is shown in Figure 12. Among them, when the radius is 4 m, the comparison of floater speed and power generation in the combined power generation platform is shown in Figure 13. When the frequency corresponding to the peak period is 1.37 rad/s, the movement speed and power generation of the floating platform are significantly improved compared with other frequencies. Therefore, it can be considered that the wind-wave combined platform proposed in this study can reach the maximum power generation when the wave frequency is 1.37 rad/s.
Further, the frequency corresponding to the best peak period of 1.37 rad/s is selected to compare the power generation of the floater with that of a single floater in the combined power generation platform, as shown in Figure 14. The movement speed of the floater of the combined platform is higher than that of the single floater, and the average power generation of four groups of floaters with a radius of 4 m can also reach the maximum power generation, which is also significantly higher than that of the single floater. This further verifies the results of regular wave time-domain.

5. Conclusions

In this study, the semi-submersible foundation is combined with the floater WEC to realize the combined utilization of wind energy and wave energy. The free decay test is carried out by STAR CCM+, and the frequency-domain calculation results of ANSYS-AQWA are effectively corrected. By comparing five typical wave directions and different wave frequencies, the optimal sea states of the combined device for WEC are determined. By analyzing the RAO of floaters with different radii and calculating the power generation, the optimal structure size of floaters is determined. According to the data analysis, the following conclusions are drawn as follows:
  • The viscous damping of the point absorber has a great influence on the response of the floater itself. The viscous correction method adopted in this study provides linear damping, which makes up for the ignorance of the viscous effect of fluid in ANSYS-AQWA.
  • When the wave direction is 0°, and the wave frequency is 1.37 rad/s, the floating wind-wave combined platform achieves the highest power generation efficiency among the sea-stated considered in this study.
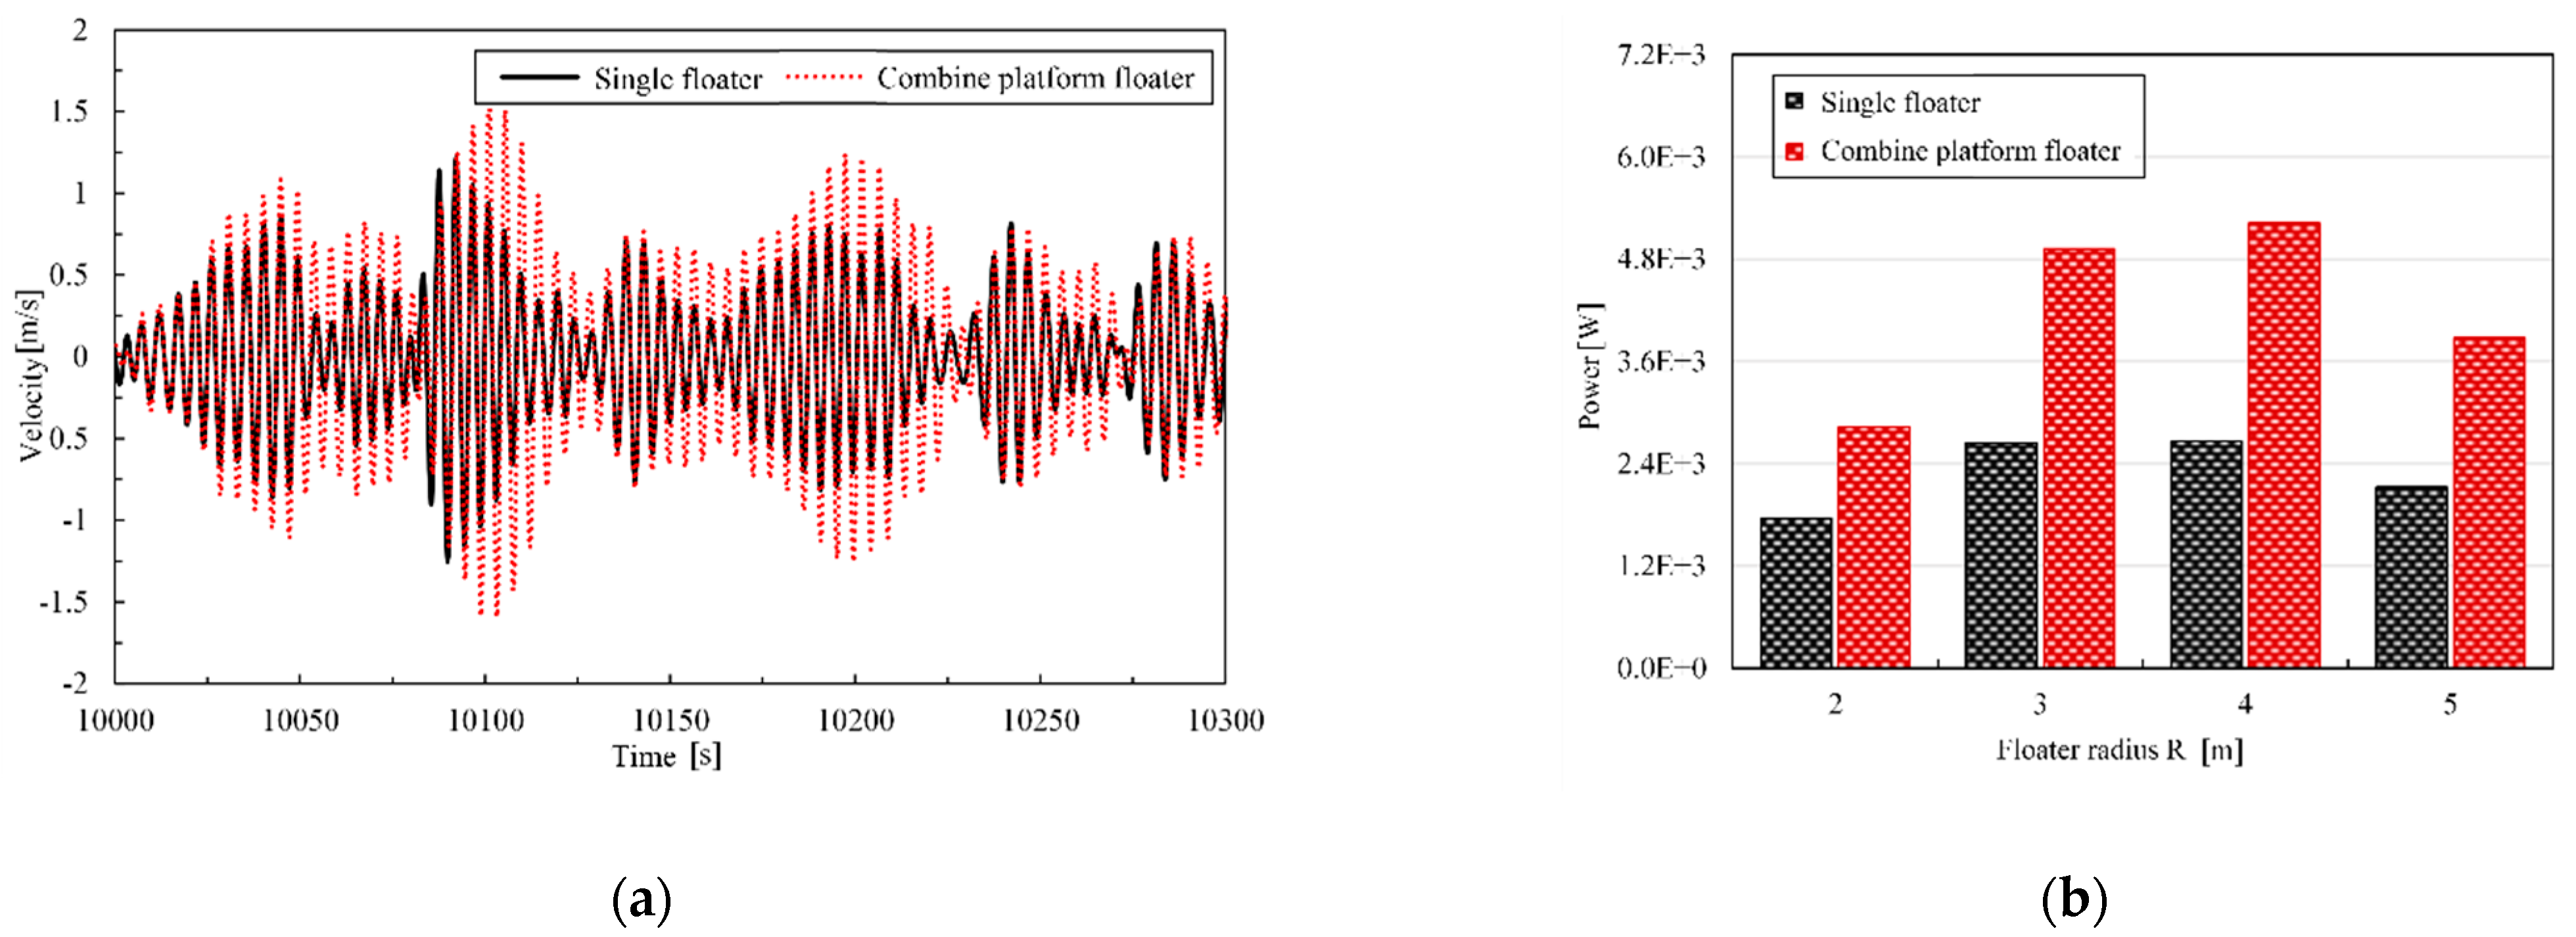
  • Under the configuration of PTO stiffness and damping in this research, the point absorber with a radius of 4 m has the most obvious effect on improving the WEC efficiency of the combined plant.
  • Compared with the single point absorber, the floating wind-wave combined platform proposed in this study has a significant increase in power generation, and the foundation response of the semi-submersible platform is not affected by the point absorber, which is of great significance for improving the overall power generation efficiency and reducing the combined power generation cost.
However, there are still many shortcomings in this study. This study only aims at the size design and optimization of the oscillating floating-point absorber. In a further study, WECs such as oscillating water column type or overtopping type will be considered, and the difference in power generation of different WECs will be compared. At the same time, to improve the overall power generation of the combined platform, the array combination of several floaters to realize high-power output will also be studied in the follow-up work. Since this study does not cut down the unreal wave elevation due to the suspending standing waves’ effect, the following work will consider including viscosity correction to the semi-submersible foundation based on the method provided by Chen et al. [27] and Liu et al. [28], which will make the coupling analysis result of the combined power generation platform more reasonable. In addition, the survivability of the combined power generation platform under extreme sea states will also be studied.

Author Contributions

X.Z.: methodology, software, investigation, data curation, writing—original draft. B.L.: methodology, software, investigation, data curation. Z.H.: data curation, investigation, and software. J.D.: data curation, investigation, and software. P.X.: writing—review and editing. M.C.: supervision, writing—review and editing, and funding acquisition. All authors have read and agreed to the published version of the manuscript.

Funding

This research was funded by the National Natural Science Foundation of China, grant number 52171275. and the Natural Science Foundation of Hainan Province, China, grant number 520MS072.

Conflicts of Interest

The authors declare no conflict of interest.

References

  1. Peiffer, A.; Roddier, D.; Aubault, A. Design of a point absorber inside the WindFloat structure. In Proceedings of the International Conference on Offshore Mechanics and Arctic Engineering, Rotterdam, The Netherlands, 19–24 June 2011; Volume 44373, pp. 247–255. [Google Scholar]
  2. Aubault, A.; Alves, M.; Sarmento, A.; Roddier, D.; Peiffer, A. Modeling of an oscillating water column on the floating foundation WindFloat. In Proceedings of the International Conference on Offshore Mechanics and Arctic Engineering, Rotterdam, The Netherlands, 19–24 June 2011; Volume 44373, pp. 235–246. [Google Scholar]
  3. Soulard, T.; Babarit, A. Numerical assessment of the mean power production of a combined wind and wave energy platform. In Proceedings of the International Conference on Ocean, Offshore and Arctic Engineering (OMAE), Rio de Janeiro, Brazil, 1–6 July 2012; Volume 44946, pp. 413–423. [Google Scholar]
  4. Muliawan, M.J.; Karimirad, M.; Moan, T.; Gao, G. STC (Spar-Torus Combination): A combined spar-type floating wind turbine and large point absorber floating wave energy convertor—Promising and challenging. In Proceedings of the International Conference on Offshore Mechanics and Arctic Engineering, Rotterdam, The Netherlands, 19–24 June 2011; American Society of Mechanical Engineers: New York, NY, USA, 2012; Volume 44946, pp. 667–676. [Google Scholar]
  5. Luan, C.; Michailides, C.; Gao, Z.; Moan, T. Modeling and analysis of a 5 MW semi-submersible wind turbine combined with three flap-type wave energy convertors. In Proceedings of the International Conference on Offshore Mechanics and Arctic Engineering, San Francisco, CA, USA, 8–13 June 2014; American Society of Mechanical Engineers: New York, NY, USA; Volume 45547, p. V09BT09A028. [Google Scholar]
  6. Gaspar, J.F.; Kamarlouei, M.; Thiebaut, F.; Guedes Soares, C. Compensation of a hybrid platform dynamics using wave energy converters in different sea state conditions. Renew. Energy 2021, 177, 871–883. [Google Scholar] [CrossRef]
  7. Michailides, C.; Luan, C.; Gao, Z.; Moan, T. Effect of flap type wave energy converters on the response of a semi-submersible wind turbine in operational conditions. In Proceedings of the International Conference on Offshore Mechanics and Arctic Engineering, San Francisco, CA, USA, 8–13 June 2014; Volume 45547, p. V09BT09A014. [Google Scholar]
  8. Wan, L.; Gao, Z.; Moan, T.; Lugni, C. Comparative experimental study of the survivability of a combined wind and wave energy converter in two testing facilities. Ocean. Eng. 2016, 111, 82–94. [Google Scholar] [CrossRef] [Green Version]
  9. Muliawan, M.J.; Karimirad, M.; Gao, Z.; Moan, T. Extreme responses of a combined spar-type floating wind turbine and floating wave energy converter (STC) system with survival modes. Ocean. Eng. 2013, 65, 71–82. [Google Scholar] [CrossRef]
  10. Hallak, T.S.; Karmakar, D.; Guedes Soares, C. Hydrodynamic performance of semi-submersible FOWT combined with point-absorber WECs. In Developments in Maritime Technology and Engineering; CRC Press: London, UK, 2021; pp. 577–585. [Google Scholar]
  11. Wang, Y.; Zhang, L.; Michailides, C.; Wan, L.; Shi, W. Hydrodynamic Response of a Combined Wind–Wave Marine Energy Structure. J. Mar. Sci. Eng. 2020, 8, 253. [Google Scholar] [CrossRef] [Green Version]
  12. González, I.T.; Ricci, P.; Lara, M.J.S.; Morán, G.P.; Papo, F.B. Design, modelling and analysis of a combined semi-submersible floating wind turbine and wave energy point-absorber. In Proceedings of the ASME 2013 32st International Conference on Ocean, Offshore and Arctic Engineering, Nantes, France, 9–15 June 2013; pp. 1–11. [Google Scholar]
  13. Sun, K.; Yi, Y.; Zheng, X.; Cui, L.; Zhao, C.; Liu, M.; Rao, X. Experimental investigation of semi-submersible platform combined with point-absorber array. Energy Convers. Manag. 2021, 245, 114623. [Google Scholar] [CrossRef]
  14. Hu, J.; Zhou, B.; Vogel, C.; Liu, P.; Willden, R.; Sun, K.; Zang, J.; Geng, J.; Jin, P.; Cui, L.; et al. Optimal design and performance analysis of a hybrid system combing a floating wind platform and wave energy convertors. Appl. Energy 2020, 269, 114998. [Google Scholar] [CrossRef]
  15. Lee, H.; Poguluri, S.K.; Bae, Y.H. Performance analysis of multiple wave energy convertors placed on a floating platform in the frequency-domain. Energies 2018, 11, 406. [Google Scholar] [CrossRef] [Green Version]
  16. Hantoro, R.; Septyaningrum, E.; Hudaya, Y.R.; Utama, I.K.A.P. Stability analysis for trimaran pontoon array in wave energy converter–pendulum system (WEC-PS). Brodogr. Teor. I Praksa Brodogr. I Pomor. Teh. 2022, 73, 59–68. [Google Scholar] [CrossRef]
  17. Chen, M.; Wang, R.; Xiao, P.; Zhu, L.; Li, F.; Sun, L. Numerical analysis of a floating semi-submersible wind turbine integrated with a point absorber wave energy convertor. In Proceedings of the The 30th International Ocean and Polar Engineering Conference, Virtual, 12 October 2020. [Google Scholar]
  18. Chen, M.; Xiao, P.; Zhou, H.; Li, C.B.; Zhang, X. Fully Coupled Analysis of an Integrated Floating Wind-Wave Power Generation Platform in Operational Sea-states. Front. Energy Res. 2022, 10, 931057. [Google Scholar] [CrossRef]
  19. Robertson, A.; Jonkman, J.; Masciola, M.; Song, H.; Goupee, A.; Coulling, A.; Luan, C. Definition of the Semisubmersible Floating System for Phase II of OC4; NREL/TP-5000-60601; National Renewable Energy Lab. (NREL): Golden, CO, USA, 2014. [Google Scholar]
  20. Cheng, P.; Huang, Y.; Wan, D. A numerical model for fully coupled aero-hydrodynamic analysis of floating offshore wind turbine. Ocean. Eng. 2019, 173, 183–196. [Google Scholar] [CrossRef]
  21. Tom, N.M. Design and Control of a Floating Wave-Energy Convertor Utilizing a Permanent Magnet Linear Generator; UC Berkeley: Berkeley, CA, USA, 2013. [Google Scholar]
  22. Sun, K.; Xie, G.; Zhou, B. Type selection and hydrodynamic performance analysis of wave energy convertors. J. Harbin Eng. Univ. 2021, 42, 8–14. [Google Scholar]
  23. Cummins, W.E. The Impulse Response Function and Ship Motions; David Taylor Model Basin Washington DC: Washington, DC, USA, 1962. [Google Scholar]
  24. Ogilvie, T.F. Recent progress toward the understanding and prediction of ship motions. In Proceedings of the 5th ONR Symp. on Naval Hydrodynamics, Bergen, Norway, 10–12 September 1964. [Google Scholar]
  25. Folley, M. Numerical Modelling of Wave Energy Converters: State-of-the-Art Techniques for Single Devices and Arrays; Academic Press: London, UK, 2016; Volume 23. [Google Scholar]
  26. Chen, M.; Xiao, P.; Zhang, Z.; Sun, L.; Li, F. Effects of the end-stop mechanism on the nonlinear dynamics and power generation of a point absorber in regular waves. Ocean. Eng. 2021, 242, 110123. [Google Scholar] [CrossRef]
  27. Chen, M.; Guo, H.; Wang, R.; Tao, R.; Cheng, N. Effects of gap resonance on the hydrodynamics and dynamics of a multi-module floating system with narrow gaps. J. Mar. Sci. Eng. 2021, 9, 1256. [Google Scholar] [CrossRef]
  28. Liu, H.; Chen, M.; Han, Z.; Zhou, H.; Li, L. Feasibility Study of a Novel Open Ocean Aquaculture Ship Integrating with a Wind Turbine and an Internal Turret Mooring System. J. Mar. Sci. Eng. 2022, 10, 1729. [Google Scholar] [CrossRef]
Figure 1. Schematic diagram of floating wind-wave combined power generation platform: (a) hydrodynamic model in ANSYS-AQWA; (b) simplified model of PTO system [17,18].
Energies 15 08681 g001
Figure 2. Validation of the numerical calculation results of STAR CCM+: (a) calculation domain and boundary conditions in STAR CCM+; (b) mesh generation in STAR CCM+; (c) comparison of simulation results of cells with different sizes; (d) comparison between numerical calculation and experimental data [21].
Energies 15 08681 g002
Figure 3. Attenuation motion of floaters with different radii before and after viscosity correction compared with STAR CCM+: (a) R = 2 m; (b) R = 3 m; (c) R = 4 m; (d) R = 5 m.
Energies 15 08681 g003
Figure 4. Comparison of device layout with floater RAO with different radii: (a) overall mooring layout; (b) RAO of floater with different radii floating freely in 0 wave direction.
Energies 15 08681 g004
Figure 5. Comparison of RAO with different waves floater: (a) R = 2 m; (b) R = 3 m; (c) R = 4 m; (d) R = 5 m.
Energies 15 08681 g005
Figure 6. Comparison of RAO under different floater radii: (a) R = 2 m; (b) R = 3 m; (c) R = 4 m; (d) R = 5 m.
Energies 15 08681 g006
Figure 7. Comparison of power generation under different floater radii: (a) R = 2 m; (b) R = 3 m; (c) R = 4 m; (d) R = 5 m.
Energies 15 08681 g007
Figure 8. Frequency-domain vs. time-domain verification: (a) ANSYS-AQWA time-domain simulation; (b) Frequency-domain and time-domain power comparison.
Energies 15 08681 g008
Figure 9. Motion amplitude of four groups of floater radii under regular waves with different frequencies: (a) R = 2 m & R = 3 m; (b) R = 4 m & R = 5 m.
Energies 15 08681 g009
Figure 10. Displacement comparison of floaters with different sizes under regular waves: (a) R = 2 m & R = 3 m; (b) R = 4 m & R = 5 m.
Energies 15 08681 g010
Figure 11. Comparison of velocity and power generation of floaters with different sizes under regular waves: (a) floater velocity comparison; (b) power comparison.
Energies 15 08681 g011
Figure 12. Three-hour Z-direction wave surface elevation velocity chronogram based on the JONSWAP spectrum.
Energies 15 08681 g012
Figure 13. Comparison of velocity and power generation of floaters with different sizes under irregular waves: (a) ω = 1.27 rad/s; (b) ω = 1.32 rad/s; (c) ω = 1.37 rad/s; (d) ω = 1.42 rad/s; (e) ω = 1.47 rad/s; (f) power comparison.
Energies 15 08681 g013
Figure 14. Comparison of velocity and power generation of floaters with different sizes under irregular waves: (a) floater velocity comparison; (b) power comparison.
Energies 15 08681 g014
Table 1. Particulars of OC4 semi-submersible floating wind turbine foundation [19,20].
Geometric ParameterValue
Draft of platform SWL (m)20
Elevation of upper columns above SWL (m)12
Spacing between offset columns (m)50
Length of upper columns (m)26
Length of base columns (m)6
Diameter of base column (m)6.5
Diameter of upper columns (m)12
Table 2. Basic parameters for viscosity correction of floaters with different radii.
Radius
(m)
Quality
(Kg)
Hydrostatic Stiffness
(N/m)
Viscous Damping
(Ns/m)
Damping Correction Coefficient
23.76 × 1041.26 × 1050.38 × 1040.0229
38.46 × 1042.83 × 1051.15 × 1040.0291
41.50 × 1055.05 × 1052.02 × 1040.0272
52.35 × 1057.89 × 1052.97 × 1040.0244
Table 3. Mooring System Properties [19,20].
Geometric ParameterValue
Number of Mooring Lines3
Angle Between Adjacent Lines120°
Depth to Anchors Below SWL200 m
Depth to Fairleads Below SWL14 m
Radius to Anchors from Platform Centerline837.6 m
Radius to Fairleads from Platform Centerline40.868 m
Unstretched Mooring Line Length835.5
Mooring Line Diameter0.0766 m
Equivalent Mooring Line Mass Density113.35 kg/m
Equivalent Mooring Line Mass in Water108.63 kg/m
Equivalent Mooring Line Extensional Stiffness753.6 MN
Hydrodynamic Drag Coefficient for Mooring Lines1.1
Hydrodynamic Added-Mass Coefficient for Mooring Lines1.0
Seabed Drag Coefficient for Mooring Lines1.0
Structural Damping of Mooring Lines2.0%
Publisher’s Note: MDPI stays neutral with regard to jurisdictional claims in published maps and institutional affiliations.

