How Does Energy Consumption and Economic Development Affect Carbon Emissions? A Multi-Process Decomposition Framework
Abstract
:1. Introduction
- (i).
- Overcoming the defect that the traditional decomposition analysis method cannot study the heterogeneity-related factors. From a methodological perspective, considering the production heterogeneity, an extension of the traditional PDA method is constructed. This is able to yield additional insights about the change of heterogeneity in the components driving changes in carbon emissions.
- (ii).
- Few studies have discussed the influencing factors from the “process” perspective. This study constructs a new decomposition framework and systematically decomposes the influencing factors of carbon emission changes from different stages. The identification of process contribution can make the responsibility of carbon emission reduction clearer.
- (iii).
- To the best of our knowledge, few studies have accurately identified the transmission mechanism between energy consumption, economic output, and carbon emissions. This study measures all-around their internal relationships. This can help policy makers to formulate more balanced emission reduction policies from multiple dimensions of energy consumption and economic development. Additionally, the research paradigm of this study can also be used to explore changes in specific indicators in other fields. Especially for those decision-making units with significant heterogeneity (time and space) characteristics.
2. Methodology
2.1. Production Technology
2.2. Multi-Process Decomposition Framework
3. Data Description
4. Results and Analysis
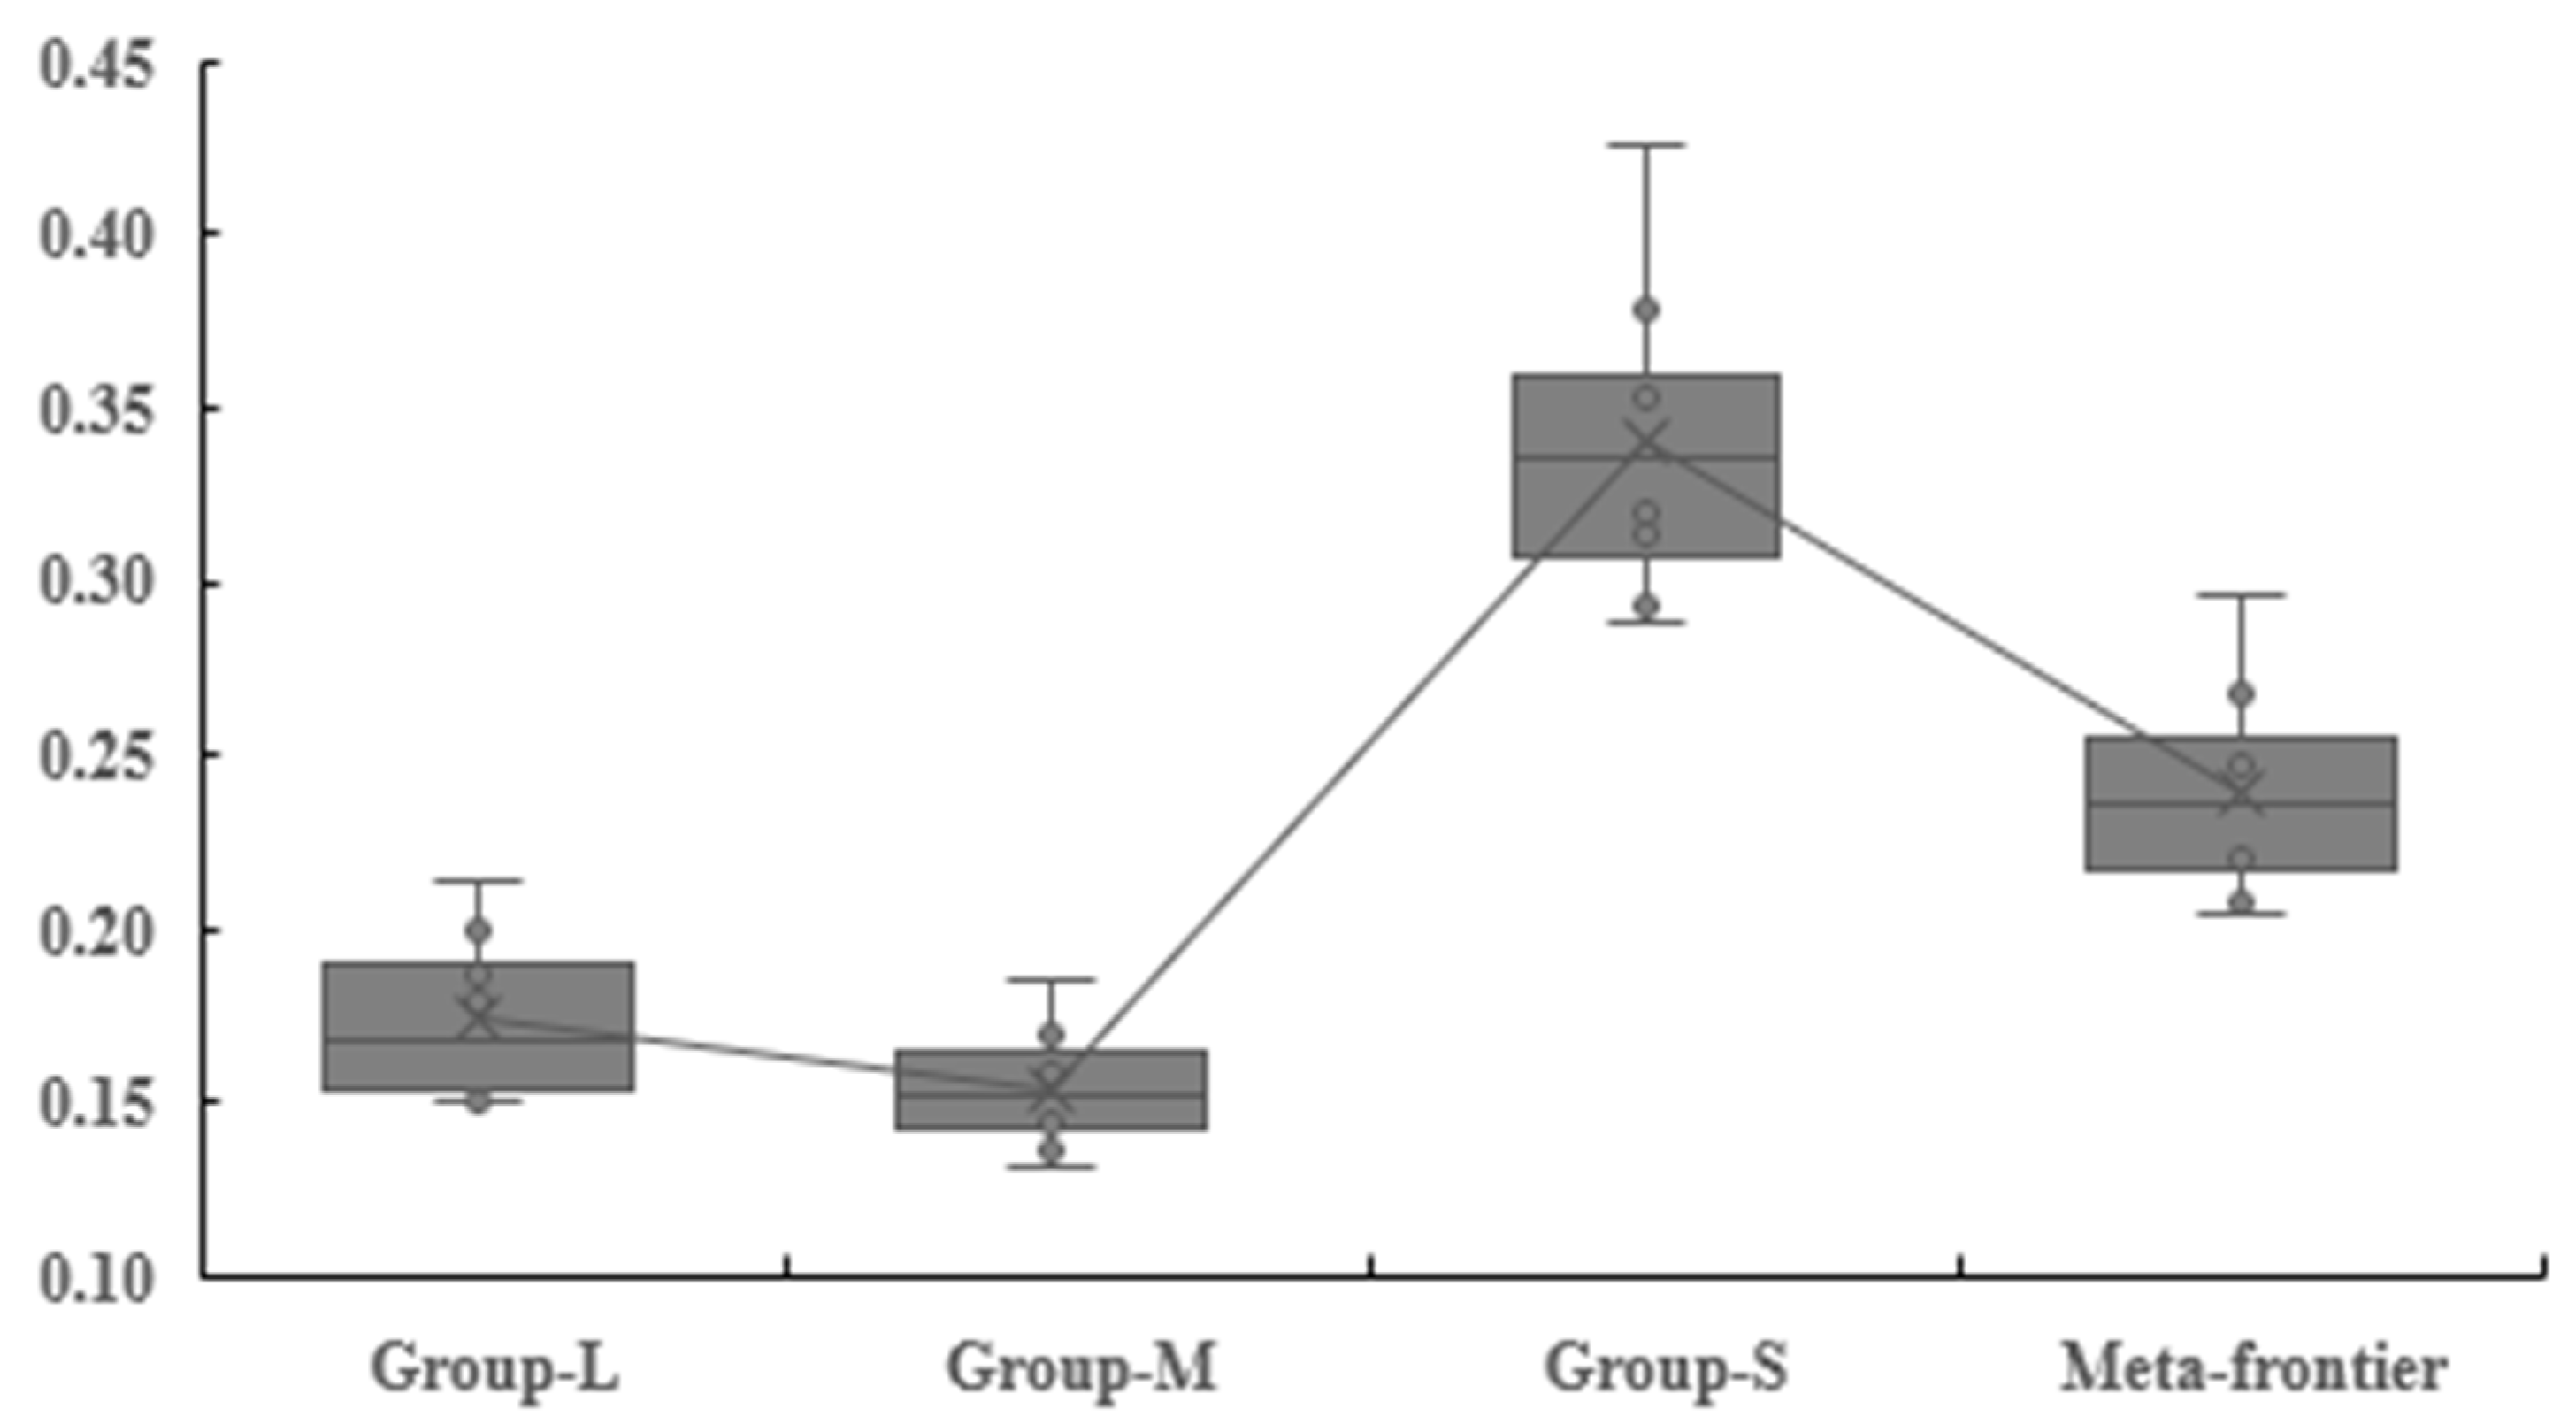
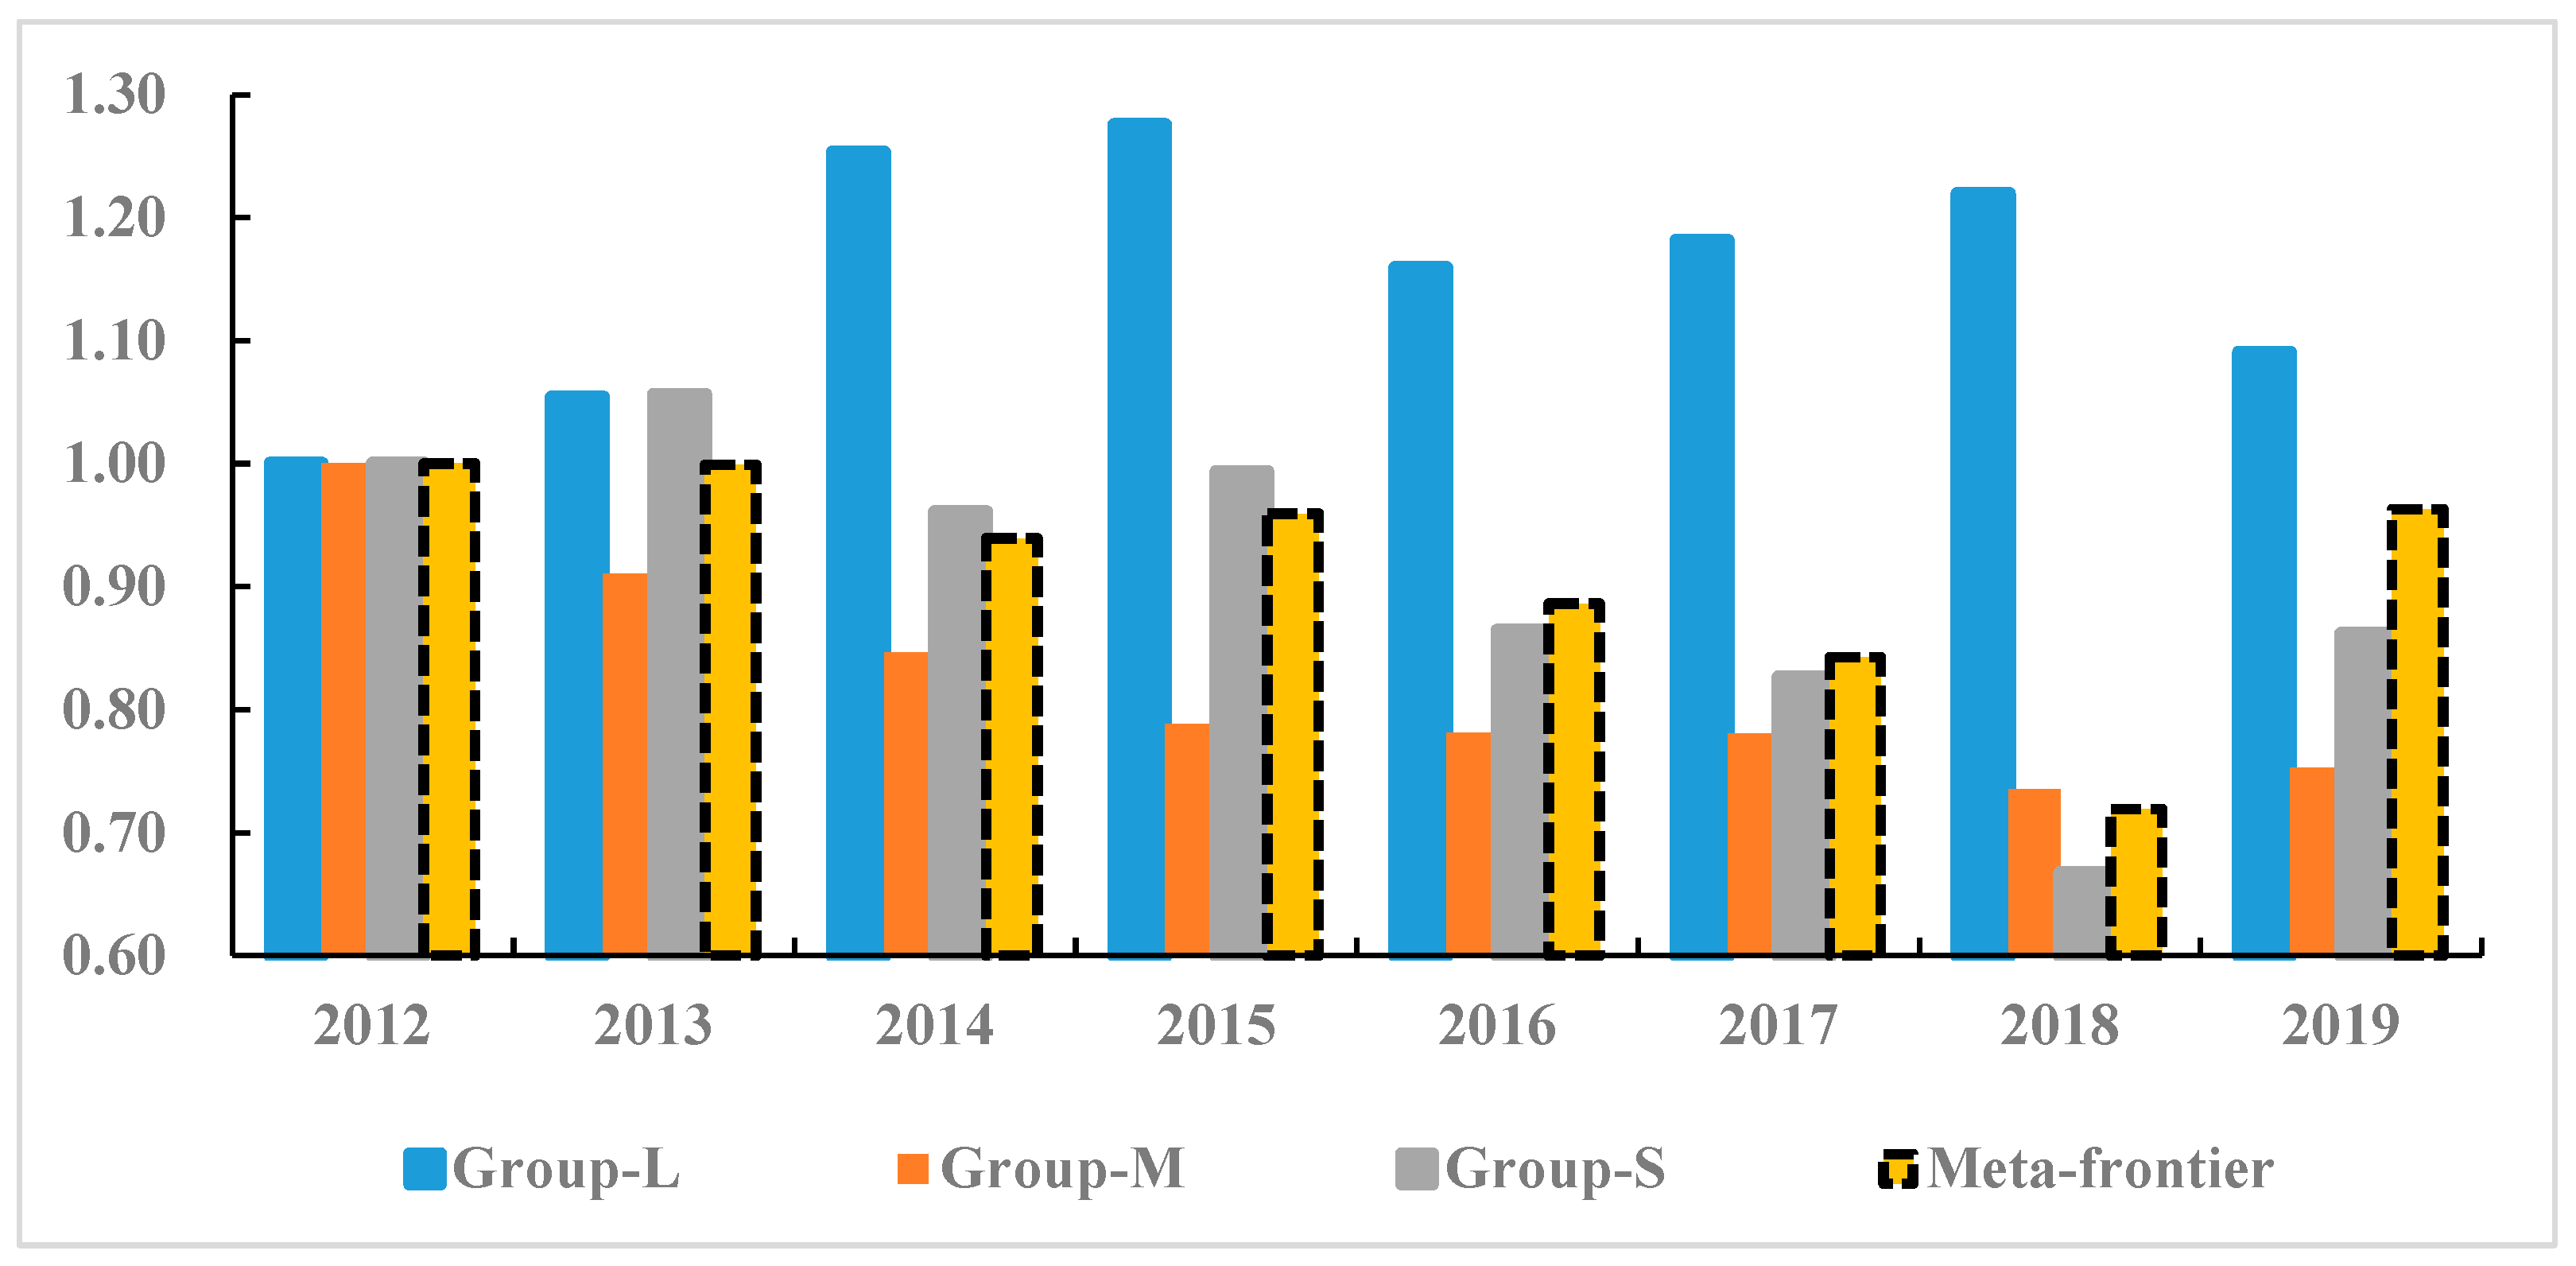
4.1. Production Heterogeneity
4.2. Influencing Factors Analysis
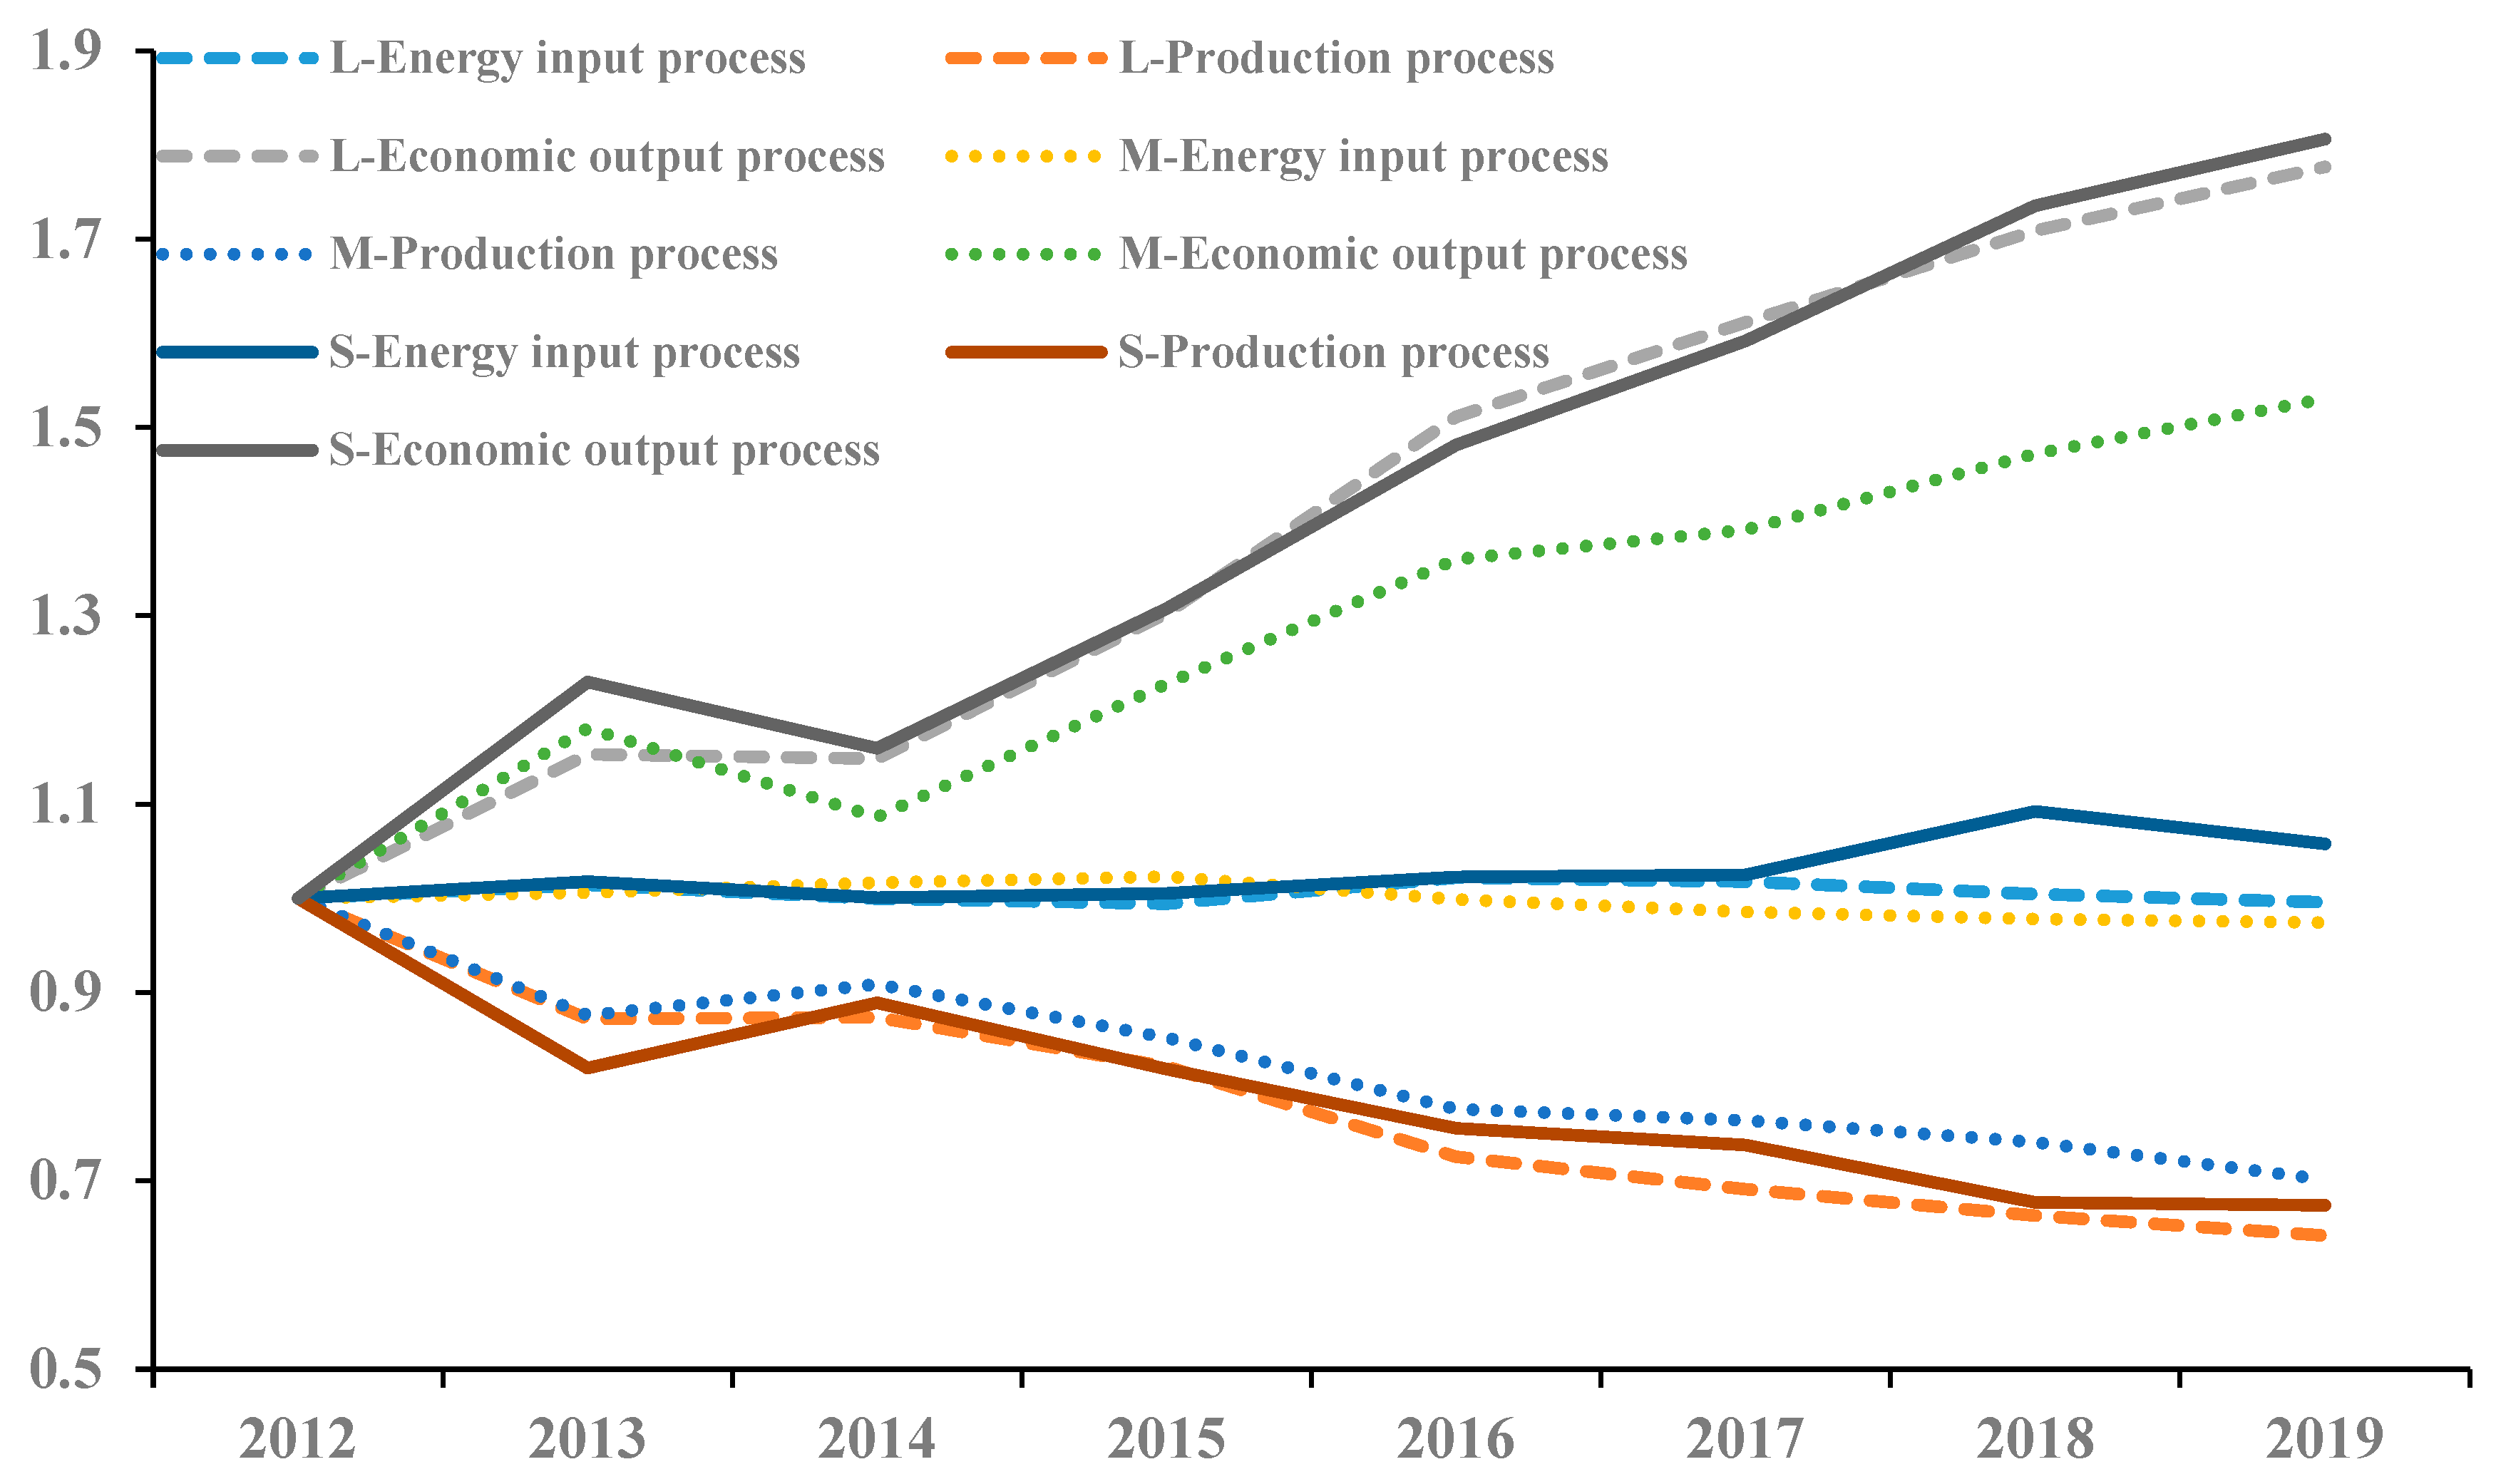
4.2.1. Decomposition Results and Analysis
4.2.2. Attribution Results and Analysis
5. Conclusions
Author Contributions
Funding
Conflicts of Interest
Appendix A
Appendix B
| Group-L | Group-M | Group-S | |||
|---|---|---|---|---|---|
| NO. | Country | NO. | Country | NO. | Country |
| 1 | France | 15 | Austria | 29 | Tanzania |
| 2 | Germany | 16 | Belgium | 30 | Iceland |
| 3 | Italy | 17 | Ireland | 31 | Jordan |
| 4 | Spain | 18 | Singapore | 32 | Macedonia |
| 5 | Brazil | 19 | Sweden | 33 | Belarus |
| 6 | Canada | 20 | Switzerland | 34 | Kyrgyz |
| 7 | Japan | 21 | Chile | 35 | Mongolia |
| 8 | America | 22 | Colombia | 36 | Senegal |
| 9 | China | 23 | Denmark | 37 | Tajikistan |
| 10 | Korea | 24 | Hungary | 38 | Tunisia |
| 11 | Russian | 25 | Israel | 39 | Nicaragua |
| 12 | Turkey | 26 | New Zealand | 40 | Ecuador |
| 13 | Netherlands | 27 | Portugal | 41 | Benin |
| 14 | Indonesia | 28 | Romania | 42 | Bolivia |
References
- Intergovernmental Panel on Climate Change. Summary for Policymakers of IPCC Special Report on Global Warming of 1.5 °C Approved by Governments; Intergovernmental Panel on Climate Change: Geneva, Switzerland, 2018. [Google Scholar]
- Intergovernmental Panel on Climate Change. Climate Change 2021: The Physical Science Basis. Contribution of Working Group I to the Sixth Assessment Report of the Intergovernmental Panel on Climate Change; Intergovernmental Panel on Climate Change: Geneva, Switzerland, 2021. [Google Scholar]
- Fuchs, R.; Brown, C.; Rounsevell, M. Europe’s Green Deal offshores environmental damage to other nations. Nature 2020, 586, 671–673. [Google Scholar] [CrossRef]
- Goh, T.; Ang, B.; Xu, X. Quantifying drivers of CO2 emissions from electricity generation Current practices and future extensions. Appl. Energy 2018, 231, 1191–1204. [Google Scholar] [CrossRef]
- Huo, C.; Hameed, J.; Sharif, A.; Albasher, G.; Alamri, O.; Alsultan, N.; Baig, N. Recent scenario and nexus of globalization to CO2 emissions: Evidence from wavelet and Quantile on Quantile Regression approach. Environ. Res. 2022, 212, 113067. [Google Scholar] [CrossRef]
- Janzen, R.; Davis, M.; Kumar, A. Evaluating long-term greenhouse gas mitigation opportunities through carbon capture, utilization, and storage in the oil sands. Energy 2020, 209, 118364. [Google Scholar] [CrossRef]
- Debone, D.; Leite, V.P.; Miraglia, S.G.E.K. Modelling approach for carbon emissions, energy consumption and economic growth: A systematic review. Urban Clim. 2021, 37, 100849. [Google Scholar] [CrossRef]
- Acheampong, A.O.; Boateng, E.B. Modelling carbon emission intensity: Application of artificial neural network. J. Clean. Prod. 2019, 225, 833–856. [Google Scholar] [CrossRef]
- Ajmi, A.N.; Hammoudeh, S.; Nguyen, D.K.; Sato, J.R. On the relationships between CO2 emissions, energy consumption and income: The importance of time variation. Energy Econ. 2015, 49, 629–638. [Google Scholar] [CrossRef]
- Zhu, Z.; Liao, H.; Cao, H.; Wang, L.; Wei, Y.M.; Yan, J. The differences of carbon intensity reduction rate across 89 countries in recent three decades. Appl. Energy 2014, 113, 808–815. [Google Scholar] [CrossRef]
- Dong, F.; Long, R.; Li, Z.; Dai, Y. Analysis of carbon emission intensity, urbanization and energy mix: Evidence from China. Nat. Hazards 2016, 82, 1375–1391. [Google Scholar] [CrossRef]
- Wang, Q.; Hang, Y.; Su, B.; Zhou, P. Contributions to sector-level carbon intensity change: An integrated decomposition analysis. Energy Econ. 2018, 70, 12–25. [Google Scholar] [CrossRef]
- Su, B.; Ang, B.W. Structural decomposition analysis applied to energy and emissions: Some methodological developments. Energy Econ. 2012, 34, 177–188. [Google Scholar] [CrossRef]
- Shao, S.; Yang, L.; Gan, C. Using an extended LMDI model to explore techno-economic drivers of energy-related industrial CO2 emission changes: A case study for Shanghai (China). Renew. Sustain. Energy Rev. 2016, 55, 516–536. [Google Scholar] [CrossRef] [Green Version]
- Long, H.; Xie, R.; Gao, C.; Sun, M.; Su, B. Analysis of China’s regional differences in water consumption based on spatial structural decomposition analysis model. Sci. Total Environ. 2022, 848, 157629. [Google Scholar] [CrossRef]
- Wang, H.; Ang, B.W.; Su, B. A multi-region structural decomposition analysis of global CO2 emission intensity. Ecol. Econ. 2017, 142, 163–176. [Google Scholar] [CrossRef]
- Ang, B.W. LMDI decomposition approach: A guide for implementation. Energy Policy 2015, 86, 233–238. [Google Scholar] [CrossRef]
- Hang, Y.; Wang, Q.; Wang, Y.; Su, B.; Zhou, D. Industrial SO2 emissions treatment in China: A temporal-spatial whole process decomposition analysis. J. Environ. Manag. 2019, 243, 419–434. [Google Scholar] [CrossRef]
- Ang, B.W.; Zhang, F.Q. A survey of index decomposition analysis in energy and environmental studies. Energy 2000, 25, 1149–1176. [Google Scholar] [CrossRef]
- Zhang, W.; Li, K.; Zhou, D.; Zhang, W.; Gao, H. Decomposition of intensity of energy-related CO2 emission in Chinese provinces using the LMDI method. Energy Policy 2016, 92, 369–381. [Google Scholar] [CrossRef]
- Zhou, D.; Huang, F.; Wang, Q.W.; Liu, X. The role of structure change in driving CO2 emissions from China’s waterway transport sector. Resour. Conserv. Recycl. 2021, 171, 105627. [Google Scholar] [CrossRef]
- Pasurka, C.A. Decomposing electric power plant emissions within a joint production framework. Energy Econ. 2006, 28, 26–43. [Google Scholar] [CrossRef]
- Zhou, P.; Ang, B.W. Decomposition of aggregate CO2 emissions: A production-theoretical approach. Energy Econ. 2008, 30, 1054–1067. [Google Scholar] [CrossRef]
- Bulut, U.; Muratoglu, G. Renewable energy in Turkey: Great potential, low but increasing utilization, and an empirical analysis on renewable energy-growth nexus. Energy Policy 2018, 123, 140–150. [Google Scholar] [CrossRef]
- Shironitta, K.; Okamoto, S.; Kagawa, S. Cross-country analysis of relationship between material input structures and consumption-based CO2 emissions. Environ. Econ. Policy Stud. 2019, 21, 533–554. [Google Scholar] [CrossRef]
- Xiao, H.; Sun, K.J.; Tu, X.W.; Bi, H.M.; Wen, M. Diversified carbon intensity under global value chains: A measurement and decomposition analysis. J. Environ. Manag. 2020, 272, 111076. [Google Scholar] [CrossRef]
- Färe, R.; Grosskopf, S.; Pasurka, C.A. Pollution abatement activities and traditional productivity. Ecol. Econ. 2007, 62, 673–682. [Google Scholar] [CrossRef]
- Liu, X.; Hang, Y.; Wang, Q.W.; Chiu, C.; Zhou, D. The role of energy consumption in global carbon intensity change: A meta-frontier-based production-theoretical decomposition analysis. Energy Econ. 2022, 109, 105968. [Google Scholar] [CrossRef]
- O’Donnell, C.J.; Rao, D.S.P.; Battese, G. Metafrontier frameworks for the study of firm-level efficiencies and technology ratios. Empir. Econ. 2008, 34, 231–255. [Google Scholar] [CrossRef]
- Lin, B.; Du, K. Decomposing energy intensity change: A combination of index decomposition analysis and production-theoretical decomposition analysis. Appl. Energy 2014, 129, 158–165. [Google Scholar] [CrossRef]
- Zhang, N.; Wang, B. A deterministic parametric metafrontier Luenberger indicator for measuring environmentally-sensitive productivity growth: A Korean fossil-fuel power case. Energy Econ. 2015, 51, 88–98. [Google Scholar] [CrossRef]
- Oh, D.H. A metafrontier approach for measuring an environmentally sensitive productivity growth index. Energy Econ. 2010, 32, 146–157. [Google Scholar] [CrossRef]
- Barro, R.J.; Sala-i-Martin, X. Public finance in models of economic growth. Rev. Econ. Stud. 1992, 59, 645–661. [Google Scholar] [CrossRef] [Green Version]
- Chen, J. Carbon neutrality: Toward a sustainable future. Innovation 2021, 2, 100127. [Google Scholar] [CrossRef]
- Wang, H.; Ang, B.W.; Su, B. Assessing drivers of economy-wide energy use and emissions: IDA versus SDA. Energy Policy 2017, 107, 585–599. [Google Scholar] [CrossRef]
- Wang, Z.; Chen, H.; Huo, R.; Wang, B.; Zhang, B. Marginal abatement cost under the constraint of carbon emission reduction targets: An empirical analysis for different regions in China. J. Clean. Prod. 2020, 249, 119362. [Google Scholar] [CrossRef]
- Wang, S.; Zhu, X.; Song, D. Drivers of CO2 Emissions from Power Generation in China Based on Modified Struc-tural Decomposition Analysis. J. Clean. Prod. 2019, 220, 1143–1155. [Google Scholar] [CrossRef]


| Factors | Connotation (during the Period of t to t+1) | |
|---|---|---|
| Energy input process | The effect of energy structure on the carbon emission changes. | |
| Production process | The effect of potential energy intensity on the carbon emission changes. | |
| The effect of the technology gap on the carbon emission changes. | ||
| The effect of group energy efficiency on the carbon emission changes. | ||
| The effect of group technology progress on the carbon emission changes. | ||
| Economic output process | The effect of economic output on the carbon emission changes. | |
| All Sample | Group-L | Group-M | Group-S | |
|---|---|---|---|---|
| −0.0220 (−1.5814) | −0.0207 * (−1.9564) | −0.0154 (−0.3106) | −0.0263 ** (−1.9116) | |
| −0.9141 *** (−6.3426) | −0.9527 *** (−4.6013) | −0.9869 *** (−4.2586) | −1.8864 *** (−6.7649) | |
| 0.5734 | 0.4811 | 0.3360 | 0.7524 |
| Period | Energy Consumption | Economic Development | Total | ||||
|---|---|---|---|---|---|---|---|
| ENS | ENI | ECA | |||||
| PEI | TEG | GEF | GTC | ||||
| 2012–2013 | 1.0148 | 0.8991 | 0.8818 | 0.9847 | 1.1206 | 1.1480 | 1.0192 |
| 2013–2014 | 0.9883 | 1.0253 | 0.9886 | 0.9942 | 1.0021 | 1.0146 | 1.0126 |
| 2014–2015 | 0.9966 | 0.9105 | 1.0284 | 1.0048 | 1.0026 | 1.0752 | 1.0108 |
| 2015–2016 | 1.0251 | 0.8719 | 0.9738 | 1.0078 | 1.0398 | 1.1083 | 1.0109 |
| 2016–2017 | 0.9960 | 0.9501 | 0.9951 | 1.0079 | 1.0060 | 1.0682 | 1.0200 |
| 2017–2018 | 0.9896 | 0.9381 | 1.0344 | 0.9972 | 0.9953 | 1.0709 | 1.0207 |
| 2018–2019 | 0.9923 | 0.9490 | 1.1773 | 1.0073 | 0.8630 | 1.0463 | 1.0083 |
| G-mean | 0.9996 | 0.9338 | 1.0081 | 1.0005 | 1.0016 | 1.0839 | 1.0146 |
| 0.9434 | |||||||
| 2012–2013 | 2013–2014 | 2014–2015 | 2015–2016 | 2016–2017 | 2017–2018 | 2018–2019 | ||
|---|---|---|---|---|---|---|---|---|
| PEI | Group-L | −9.1636 | 1.7567 | −8.5300 | −10.8257 | −4.7901 | −6.3618 | −4.6767 |
| Group-M | −0.7585 | 0.4784 | −0.3191 | −0.8711 | −0.2660 | −0.0410 | −0.3618 | |
| Group-S | −0.2485 | 0.1930 | −0.0802 | −0.0806 | −0.0225 | 0.1658 | −0.1523 | |
| TEG | Group-L | −12.0480 | −1.6380 | 2.7604 | −3.0240 | −0.6932 | 3.2130 | 17.7065 |
| Group-M | 0.1556 | 0.3930 | −0.0008 | 0.2995 | 0.0048 | 0.1770 | −0.1863 | |
| Group-S | −0.0139 | 0.0015 | −0.0176 | 0.0067 | 0.0992 | −0.0470 | 0.0864 | |
| GEF | Group-L | −1.8079 | −0.5706 | 0.2168 | 0.5753 | 0.3896 | −0.4641 | 1.1343 |
| Group-M | 0.2167 | −0.1641 | 0.2048 | −0.1473 | 0.2135 | −0.0622 | −0.0674 | |
| Group-S | −0.0400 | 0.0533 | −0.0410 | 0.2541 | 0.0868 | 0.1502 | −0.4337 | |
| GTC | Group-L | 12.4956 | 0.6748 | 0.4730 | 4.0604 | 0.7500 | 0.0643 | −14.4655 |
| Group-M | −0.5998 | −0.4309 | −0.3441 | 0.1056 | −0.0547 | −0.2772 | 0.2166 | |
| Group-S | 0.0500 | −0.1340 | 0.0287 | −0.2888 | −0.1971 | −0.3599 | 0.4604 | |
Publisher’s Note: MDPI stays neutral with regard to jurisdictional claims in published maps and institutional affiliations. |
© 2022 by the authors. Licensee MDPI, Basel, Switzerland. This article is an open access article distributed under the terms and conditions of the Creative Commons Attribution (CC BY) license (https://creativecommons.org/licenses/by/4.0/).
Share and Cite
Liu, X.; Zhang, Y.; Li, Y. How Does Energy Consumption and Economic Development Affect Carbon Emissions? A Multi-Process Decomposition Framework. Energies 2022, 15, 8802. https://doi.org/10.3390/en15238802
Liu X, Zhang Y, Li Y. How Does Energy Consumption and Economic Development Affect Carbon Emissions? A Multi-Process Decomposition Framework. Energies. 2022; 15(23):8802. https://doi.org/10.3390/en15238802
Chicago/Turabian StyleLiu, Xiao, Yancai Zhang, and Yingying Li. 2022. "How Does Energy Consumption and Economic Development Affect Carbon Emissions? A Multi-Process Decomposition Framework" Energies 15, no. 23: 8802. https://doi.org/10.3390/en15238802
APA StyleLiu, X., Zhang, Y., & Li, Y. (2022). How Does Energy Consumption and Economic Development Affect Carbon Emissions? A Multi-Process Decomposition Framework. Energies, 15(23), 8802. https://doi.org/10.3390/en15238802


