Abstract
The main objective of this research, directly related to the introduction of the COVID-19 pandemic, is to answer the question: has the epidemiological situation and energy crisis affected the CSR policy of transport industry companies and the forms of its implementation? This research aims to answer whether the social objective set out in the CRS policy, implemented by the studied entities, conflicts with commercial purposes, whether the implementation of CRS is profitable for these entities, and in which areas of activity it manifests itself. The aim is to investigate why the studied entities engage in CSR? The following research methods were applied: an economic and legal analysis of CRS principles and activity reports. The study focused on the activities of enterprises pursuing their business objectives and, at the same time, their socio-cultural mission. The CSR policies for 2019–2021, which surveyed transport industry companies operating in Poland, are analyzed. Empirical findings show that companies are responsive to the CSR concept and those considering international standards.
1. Introduction
Currently, the importance of corporate social responsibility (CSR) is gaining momentum [1], as the goal of modern companies is no longer just innovation [2] but also responsibility for their actions [3,4]. This is a topic widely discussed in academia due to the close relationship between the actions taken in business practices and their impact on society, employees, customers, investors, local communities, and authorities [5]. In addition, it should be pointed out that the discussion of profit maximization and shareholder welfare has been going on since the 1970s [6,7,8], with it gaining prominence after the 2008–2009 financial crisis [9] and further becoming the subject of analysis during the COVID-19 pandemic [10,11,12,13,14]. Corporate social responsibility is not a goal of doing business, but rather a way of doing business in a way that considers the company’s spheres of influence on the environment [15,16]. Its premise is developing a management concept that will ensure the company’s continued growth with social dialogue and the fulfillment of stakeholder objectives [17,18]. The number of companies applying CSR is also growing steadily [19].
Furthermore, companies voluntarily adopt CSR assumptions and implement them into their business strategies [20]. Significantly, it used to be sufficient for a business entity to only declare its application of CSR concepts [21]. At the moment, we can observe an increased demand for information on the results of CSR activities [22,23] because stakeholders, when evaluating the activities of a company, use an analysis not only of the current financial and asset situation of the entity but also of non-financial criteria, including precisely the results on CSR activities [24]. In addition, it should be pointed out that companies increasingly undertake the assumptions of the CSR concept, aware that they must accept responsibility for the impact of their activities on the environment [25] while seeing in it many advantages, which include improving the image of the company, improving relations with the environment, or weakening the negative consequences associated with environmental impact (which in the case of the transport industry seems crucial) [26]. Significantly, although CSR has been in use for many years, until recently it was marginalized and actively promoted by only a few companies [27]. The crisis triggered by the COVID-19 pandemic has reignited analyses of developed CSR models, their effectiveness, and defense mechanisms for abnormal situations.
It should be noted that the pandemic and the energy crisis inconsistently affected individual industries, with some companies reporting significant gains while others estimated financial losses [28]. In addition, the COVID-19 pandemic created opportunities for companies to engage with consumers while increasing their credibility, market value, and profits [29] genuinely and realistically. At this point, transportation companies undoubtedly impact the environment, including, first and foremost, a negative impact on the environment. On the other hand, transport companies played a vital role during the pandemic, enabling millions of people to stay home and receive ordered goods despite couriers’ work.
Regardless of the theoretical and legal doubts related to the title issue, the thesis of this article remains the following assumption (T1): Crises, although requiring changes in the planned activities related to the development of the company and its CSR policy, do not contradict the growth of initiatives undertaken by the company for sustainable development, including local communities. The purpose of this article is to indicate whether transport companies are implementing CSR policies, and the possible correlation between the actions taken by these companies during the COVID-19 pandemic and the energy crisis, and to present possible changes in socially oriented activities. Taking the above into account, the following hypotheses were proposed. Hypothesis 1 (H1) is that CSR in abnormal situations (such as the COVID-19 pandemic or the energy crisis) protects the company’s value. Hypothesis 2 (H2) states that: the crisis caused by abnormal situations (such as the COVID-19 pandemic or the energy crisis) will potentially increase the importance of CSR efforts by companies. Hypothesis 3 (H3) states that abnormal situations affect the financial situation of companies.
This article analyzes the direction of change in the implementation of sustainability measures by companies in the transport industry. It identifies trends in the lessons learned from the pandemic and energy crises. In the long term, properly adopting a CSR strategy and its inclusion in the enterprise’s strategic objectives will increase the investments carried out, attract new customers, strengthen the market position, and lead to increased stakeholder localization [30].
This article examines the impact of the COVID-19 pandemic and the energy crisis caused by the armed conflict in Ukraine on the CSR policies of companies in the transport industry in Poland in 2019–2022. Empirical studies of financial and non-financial reports of selected entities and statistical research indicate that the COVID-19 pandemic and the energy crisis affect companies’ sustainability efforts. Moreover, the results of the conducted research indicate that studies have yet to be published, to date, that focus on the link between the COVID-19 pandemic and the energy crisis, specifically on Polish enterprises. Secondly, the research indicates scientific contributions to energy, environmental sustainability, and business activities of business entities. In addition, in most academic papers the focus is primarily on linking the financial performance of companies to the pandemic or economic crisis without analyzing non-financial activities, i.e., the actions that companies take for sustainability. In addition, researchers focus primarily on the importance of CSR and its regulatory framework under corporate law and governance mechanisms [31,32], rather than on the correlation of the current situation, considering the so-called abnormal situations (crises) with the implemented CSR-P and the financial situation of companies. Therefore, this paper analyzes the impact of the COVID-19 pandemic and the energy crisis on the sustainable activities carried out by selected transportation industry entities to comprehensively understand the topic under analysis and fill the existing gap. This article is an original attempt to correlate the financial performance of companies with the measures taken in pursuit of the CSR-P objectives of the so-called new post-pandemic economic reality, which has highly exacerbated social inequality. The research will help understand the importance and significance of preparing business units for abnormal situations and developing resilience to future crises. This research can also help companies “design their organizations to create more equal societies” [33] while building the capacity to build competitive advantage in abnormal situations. This research can also help reduce concerns on the part of national legislators in revising CSR regulations, as abnormal situations provide an excellent impetus for changing existing regulations and introducing transparent, mandatory solutions for undertaking sustainability activities, particularly for those with negative environmental impacts. The article is organized as follows. The first part of the article briefly presents the motivation for the research undertaken and the purpose of the work. The second part includes the theoretical background, current trends of ongoing CSR research, and its relevance to society, highlighting socially oriented activities and the impact of company actions on stakeholders. The third section presents a description of the methods and data used. Moreover, the following sections present the results of the research. The article concludes with conclusions, concluding remarks, discussion, and research limitations.
2. Literature Overview
2.1. CSR as a Philosophy of Corporate Action
CSR is a global phenomenon encompassing development, environmental, and human rights themes [34]. Blowfield points out that there is no universal agreement on the definition of CSR, as it can be perceived and interpreted differently by different stakeholder groups. The definition of CSR has been revised several times by the World Business Council for Sustainable Development, recognized in 1998. CSR is “the continuing commitment by business to behave ethically and contribute to economic development while improving the quality of life from the workforce and their families as well as the local community and society at large,” only to change its definition in 2002 to “the commitment of business to contribute to sustainable economic development, working with employees, their families, the local community and society at large to improve their quality of life” [35]. In turn, the European Commission defined CSR as “the responsibility of enterprises for their impact on society and, therefore, it should be company led.” [36]. However, the CSR phenomenon itself is perceived differently by different communities. For example, when asked about the concept of CSR, Ghanaians emphasized community empowerment, and Thais highlighted the negative impact on the environment by companies [37]. Similarly, Europeans also emphasize the need for greener and low-carbon solutions in public transportation, among other things [38]. The concept of CSR, although it speaks of voluntary action for sustainable development, is an obligation imposed on companies [39], thus contributing to better national legislation in countries with enforcement difficulties [40].
CSR is about striking a balance between conflicting stakeholder interests [41], with business managers thoughtfully and consciously distributing benefits among selected (competing) stakeholder groups and identifying employees, suppliers, local communities, or customers as appropriate [42]. Researchers also point to the link between CSR and poverty alleviation and other development goals in developing countries [35]. In addition, academics, practitioners, and national governments regard CSR as “a bridge between the business and development arenas and are increasingly discussing CSR programs in the context of their contribution to development” [35]. CSR is concerned with managing relationships among various stakeholders, affecting the roles and relationships between governments, communities, and businesses [43]. Clarkson emphasizes that managers need to implement social and environmental issues into their business strategies with responsibility and sustainability in mind, but only focus their attention on the claims of individual stakeholders [44]. Mitchell takes a similar view, stressing that companies implement CSR assumptions not because of existing legal requirements, but because of increasingly intense stakeholder pressures (social, environmental, and economic pressures) [45]. In addition, Cragg and Greenbaum [46] point out that companies, as open entities, must meet the demands of stakeholders, and additionally, as Frooman [47] adds, since shareholders provide capital to profit from the business, it is the job of stakeholders to determine organizational opportunities and constraints. The strategy adopted by companies depends on them. A rich literature on CSR topics indicates that corporations are increasingly acting as a network of stakeholders whose primary goal is organizational wealth in the long term [48]. In the socio-political context, on the other hand, CSR seeks to understand sustainable development, integrate local and ecological communities, and engage social organizations and businesses [49,50]. CSR is often referred to as a company’s voluntary contribution to sustainable development (beyond the legal framework), while Corporate Accountability is compliance with applicable legal standards [43,51]. In summary, many companies, while implementing CSR-P, manage stakeholder relations and use political lobbying through various tools [43] including, but not limited to, reports which are discussed later in the paper using selected companies as examples. The impact of the interrelationships of the tools used is illustrated in Figure 1.
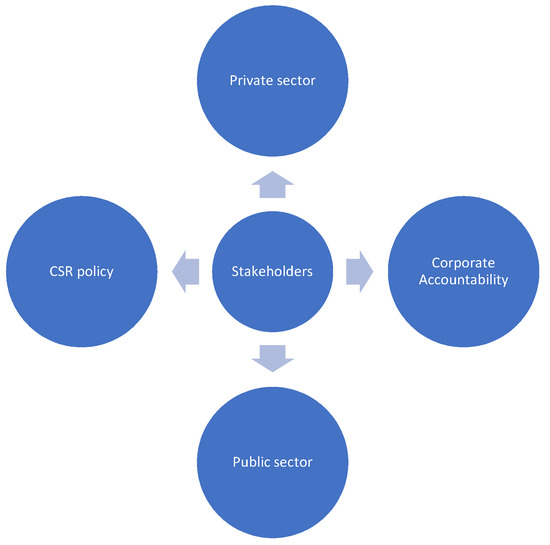
Figure 1.
CSR strategy-dependency models. Source: own compilation based on [43].
At the moment, Europe is leading the way in CSR. From a historical perspective, the only European country with a rich CSR history is the United Kingdom [52], where the topic has been discussed since the 1970s. A more comprehensive profile was given to the issue as early as the 1980s [53] due to social unrest and high unemployment rates [54]. The turn of the century led to an increasing interest in CSR in Western Europe [52]. Global interest in CSR followed a high-profile speech by the UN Secretary-General at the World Economic Forum in 1999, which initiated a global pact of shared values, which resulted in the creation of a corporate culture based on integrity [55] and, subsequently, the creation of a Green Paper by the European Commission [49,50], which indicated new expectations and social concerns in the context of the impact of business on the environment. In 2001, C. Smith expanded the meaning of the term CSR-P, pointing out that over the years, the needs of the public change, and as it does, so does CSR policy itself. This meant an increase in the group of stakeholders, and C. Smith’s proposed definition indicated “a company’s commitment to its stakeholders-those affected by corporate policies and practices.
Moreover, by extension, the implementation of these commitments is to minimize the harm of business impact on society and the environment, and maximize the benefits of impact on stakeholder groups [56]. This definition was supplemented by Lantos, incorporating elements of strategic planning into the concept of CSR, recognizing that it consists of a particular social contract between society and business in such a way as to enable mutual relations, respond to needs, and at the same time minimize the adverse effects of their actions [57]. This way of understanding CSR initiated the inherent link between CSR-P and the term strategic concept [58,59,60], which has been expanded and analyzed by many researchers (in terms of the new perspective of stakeholder theory) [58]. In addition, it is essential to point out the relevance of the research of Heslin and Ochoa. They pointed out that companies can grow and, at the same time, fulfill their responsibilities to local communities. In addition, it is increasingly noted that global companies have a growing belief in generating shared values with society, which translates into generating shared values and solving social problems [61]. The main subject of current studies by researchers is the search for an answer to whether the actions taken by companies in the field of CSR policies lead to an increase in their value. This is evidenced by the work of Flammer [62,63,64], Borghesi [65] and Ferrell [66], among others, as well as attempts to undertake analysis of CSR policies in times of crisis (Lins [67], Albuquergue [68]). Porter and Kramer also pursued the concept of creating shared value [69]. In this article, the analysis is not about building the company’s value but about the impact of abnormal situations on the company’s value through implementing CSR policies (CSR-P).
In summary, it should be pointed out that CSR activities are voluntary and contribute to dialogue with stakeholders [70,71], and that CSR itself is a strategic response to stay in the market in the long term [72].
2.2. Impact of Abnormal Situations on CSR-P
Previous studies have verified the impact of ongoing CSR activities on minimizing the effects of abnormal situations [73,74], and public reactions and perceptions of companies through the lens of crisis communication [75,76]. While it has been repeatedly pointed out that a properly conducted CSR policy can lead to positive effects in times of crisis [77], it should be pointed out that undertaking crisis response activities through a CSR strategy should be tailored and carefully thought out for the specific crisis, and take into account the variables of the situation [76], which primarily include the type of crisis and the type of crisis response [78]. Undoubtedly, crises are unpredictable. Hence, it can be inferred that virtually all companies will be dealing with crises, whether they are prepared for them or not [79]. Because of the above, this article identifies examples of business behavior in the face of the crisis caused by the COVID-19 pandemic and the energy crisis.
It should be mentioned that the COVID-19 pandemic, which is referred to as a “black swan” event [80,81], has led to a deterioration of the economic situation around the world, creating a new category of recession called a global social upheaval, which was not triggered before by errors in the economic policies of individual countries or a financial bubble. It is a crisis that, in addition to loss of life, has also taken a toll on the lives of millions of people around the world, including economic and political losses [82]. Over time, individual governments, to halt the upward trend of infections, introduced one travel, trade, or quarantine restriction after another [83,84]. The pandemic led to a situation where all economic actors were forced to make immediate changes in their operations to survive the pandemic [85] and, at the same time, meet the public expectations of consumers [86]. The pandemic also highlighted the social inequality and interdependence of entrepreneurs and consumers [87]. Entrepreneurs have once again been forced to reevaluate their goals, and examine their corporate strategies and the effectiveness of their existing business models [88]. Companies are being forced to remain flexible to adjust and adapt their strategic assumptions in the face of crises while building a substantial strategic advantage for the future [89].
In addition, an armed conflict in Ukraine, triggered by Russia, erupted in 2022. Russia’s unprovoked and unjustified aggression against Ukraine, and Russia’s use of energy supplies as weapons, led to a critical point for all EU countries which are currently facing an energy crisis [90]. With the armed conflict, the energy war began [91]. The armed conflict has shown the dependence on Russian raw materials of European countries, which translates directly into current energy prices, which are at unprecedentedly high levels unknown in history since World War II [90]. On the one hand, the COVID-19 pandemic has reduced the demand for fuel and energy globally.
On the other hand, the Russian state, engaged in an armed conflict in Ukraine, is a tycoon as an energy producer and exporter [92]. Many countries around the world have initiated the imposition of a series of sanctions on Russia (including a ban on the import of coal and other solid fuels, oil, gold, timber or alcohol, and seafood from Russia to the EU) [93], which were supposed to weaken the actions of the aggressor and lead to a quick end to the conflict. Meanwhile, European countries have become increasingly dependent on Russia over the years. For example, Poland has paid more than 900 billion zlotys for the import of energy resources from Russia over the past two decades, where, for instance, in 2020, the share of supplies from Russia in total imports: natural gas was 55%, oil 66%, and coal 75% [94], while the average of the past twenty years of fossil fuel imports to Poland from Russia is respectively: for oil 87%, for natural gas 72%, and coal 62% [95]. In contrast, the EU has relied on Russian coal imports for more than 70% of its electricity production [96]. This, in turn, is currently forcing an increase in fuel imports (including primarily hard coal by the EU) from other countries: the US, Colombia, or Australia [97], and in the context of increasing pressure on the price of coal (among other things, due to the EU’s climate targets), will result in an estimated increase in the average European family’s electricity spending in 2023 by 200% compared to 2021 [98], and for businesses by as much as 1000% [99,100,101,102,103]. The ongoing economic crisis undoubtedly impacts conducting business and surviving in the market. Both the COVID-19 pandemic and the ongoing energy crisis have increased interest in debating the topic of CSR in the context of the need to balance corporate goals with sustainability objectives. Crises that have occurred in recent years around the world demonstrate the need for attention to CSR from both the authorities of individual countries and market participants themselves [104]. Hence, an important question remains: should companies continue to care about society and its welfare despite the pandemic and ongoing energy crisis? It remains noteworthy to subject to analysis companies in so-called socially stigmatized industries whose goals and objectives, as well as the products offered, negatively affect society. How, in difficult times (COVID-19 pandemic, energy crisis), did companies behave whose main assumptions are contrary to social goals, which are at the same time supported by these companies? The article refers to the indicated relationship as “matching” [105].
Social responsibility and activities directed toward sustainability play essential roles in society. Consumers are increasingly aware of the products they purchase and expect social commitment from businesses. For these reasons, business entities must continue to engage in CSR despite difficult times for the business environment because, if implemented correctly, it benefits societies or charitable organizations and, most importantly, the organizations themselves applying it. In the face of a pandemic (but similarly during an energy crisis), entrepreneurs are forced to adapt their CSR policies to the prevailing market conditions [106]. Interestingly, entrepreneurs faced hitherto unknown CSR challenges in the face of COVID-19, for CSR policies are an essential determinant of the perception of a given entrepreneur.
Interestingly, taking appropriate actions in times of crisis enables entrepreneurs to gain a market advantage based on strengthening their credibility in front of customers [107]. Examples of positive actions taken by entrepreneurs during the COVID-19 pandemic are numerous. These include the actions of the 7-Eleven store chain, which donated one million masks to medical personnel at the beginning of the pandemic, Apple, which donated 10 million masks, the Armani Group, which began producing disposable suits for health care instead of making luxury clothing, or Colgate-Palmolive, which donated 25 million bars of soap and $20 million to fight the pandemic for charities [108]. DHL Parcel in Poland conducted the #stayhome campaign, which had a very positive public reception [109]. The straightforward message convinced the public of its authenticity and undoubtedly brought positive results for the company [110]. In addition, DHL became financially involved in countering the effects of COVID-19, helping with the logistics of providing protective equipment for medical services and the transportation of medical components, and meals for medics were organized [110]. While it is not uncommon for consumers to be skeptical of companies’ CSR activities, questioning their intentions [111], undoubtedly, the activities carried out in connection with countering the spread of the COVID-19 pandemic were received positively and with understanding by consumers. These exemplary actions directed toward social partners in connection with the global pandemic crisis have also directly contributed to an increase in social expectations regarding actions taken by businesses toward sustainability [112].
3. Materials and Methods
The answer to the research question posed in the introduction regarding the relationship of crises to CSR-P policies by transportation companies will allow us to examine what impact the COVID-19 pandemic and the ongoing energy crisis have had on the CSR-P of transportation companies. The subject of the study was the non-financial reports and financial statements of the three most prominent transportation companies in Poland. Non-financial data on the implementation of CSR-P were obtained from reports published on the websites of the surveyed companies. In contrast, financial data presented in the companies’ financial statements were obtained from the National Court Register. The companies were selected according to the contributed share capital criterion among all companies operating in Poland in the transport industry in 2019–2021. The selected companies are Poland’s 20 largest logistics operators [112]. The companies selected for the study were: Raben Logistics Polska (hereafter Raben) sp. z o.o., owned by Raben Group (share capital: PLN 1.1 billion), Schenker sp. z o.o., owned by DB Schenker (share capital: PLN 186.3 million, hereafter Schenker), DSV Road sp. z o.o., owned by SV Global Transport and Logistics Group-DSV Panalpina (share capital: PLN 38.9 million, hereinafter DSV), the period analyzed includes the years 2019–2021 in terms of CSR policy, and the years 2017–2021 in terms of analysis of financial statements and statistical analysis.
The economic data of the companies were analyzed to determine the financial situation of the companies (financial data contained in the financial statements were used), and CSR-P was used for the analysis of data contained in non-financial reports. Legal acts were reviewed and documents were analyzed; the CSR reports of the indicated companies for the years 2019–2021, with a particular focus on sustainability activities, especially environmental data and issues related to electricity consumption. For the entities Raben and DSV, complete CSR-P reports for 2019–2021 were obtained. For Schenker, only the 2019–2020 period was examined. The entity reports on sustainability activities once every two years. The study was conducted in two parts. The first part analyzed the published CSR-P reports of the selected companies. In particular, the following were examined: the purpose, the main assumptions of sustainability activities, the impact of crises on the CSR policy (including the impact of the COVID-19 pandemic and the energy crisis), the issues of electricity spending, and the zero-carbon activities of transport companies.
In the next stage, the financial results of the companies, published in their financial statements, were analyzed. A comparative analysis of selected entities was carried out, and their financial and asset situation was presented against the background of the entire transportation industry. Ratio analysis tools were used to determine the financial situation (financial ratios were presented), and statistical tests were carried out.
The significance level of statistical tests in the present analysis was set at α = 0.05. The t-Welch test was used to compare the means of two independent groups. The effect size measure was estimated using the . Interpretation of the ω2p effect size was based on the Cohen convention [113]. Testing for mean differences within a group (for dependent data) was performed using Fisher’s One-way ANOVA statistic. The effect size measure was estimated using the ω2p. Interpretation of the ω2p effect size was based on the Field convention [114].
Analyses were conducted using the R Statistical language (version 4.1.1) [115] on Windows 10 Pro 64 bit (build 19044), using the packages effectsize (version 0.7.0) [116], rstatix (version 0.7.0) [117], sjPlot (version 2.8.10) [118], report (version 0.5.1.3) [119], ggstatsplot (version 0.9.3) [120], psych (version 2.1.6) [121], ggplot2 (version 3.3.5) [122].
The analysis carried out provides the canvass for the conclusions and demands made in conclusion.
4. Results
4.1. CSR Policy Analysis
4.1.1. Raben’s CSR Policy
Each company selected for the study has published annual CSR-P reports and financial statements. Raben was selected as the first entity to be analyzed. In its 2019 report, the company took as its main CSR-P objective to set trends in the transportation industry that will bring additional environmental benefits through activities involving sustainability. Among others, concern for health and safety, partnership, dialogue and education, attractive working conditions, offsetting negative environmental impacts, and promoting the quality and role of transportation and logistics services were identified as sub-goals. The sustainability goals under the economic goals were: achieving and maintaining leadership, achieving a sustainable return on investment, and promoting logistics with a so-called “human face” through partnerships; under the environmental goals: innovative green solutions in infrastructure and technology; and under the social goals: supporting subcontractors in business development and local communities with community engagement strategies, promoting healthy lifestyles and creating an interdependent safety culture with immediate suppliers, as well as retaining and attracting the best employees and building transparent relations with neighbors. As for the goals and their implementation in 2019 [123], they are shown in Table 1.

Table 1.
CSR strategy-CSR-P goals and implementation in 2019.
As can be seen from the data presented in Table 1, almost all targets were met. The company has not met the goals of filling the fleet and interdependent safety culture. Comparing the 2019 targets [123], with the targets for subsequent years, the targets are duplicated. For example, in the 2020 CSR-P [124], it was indicated that the company’s operational goals continued to include both targets for fleet fill (a rate of 145%), a modern fleet (an assumption of 0% of vehicles below the EURO5 standard, below the EURO4 standard at the end of 2020 was only 9% of the subcontractor’s fleet, compared to 10% of subcontractor’s fleets ranked below EURO4 in 2021 [125]) and combating empty mileage, modern fleet, and neutralizing greenhouse gases (data shows a 2% decrease in carbon footprint compared to 2019). In the 2020 CSR-P [124], assumptions from previous years were replicated and supplemented with information on the ongoing work to introduce the first zero- or low-emission trucks into Raben’s fleet. Importantly, Raben emphasizes transparent relations with local communities, indicating that without dialogue, the company will have little chance of conducting effective business. As indicated by surveys conducted among the company’s customers, the key topic area that Raben should address for the environment is ecology, the environment, and reducing exhaust emissions. It is worth noting that Raben supports local communities, takes up the fight against poverty and hunger, and supports responsible consumption and production. Cooperation was undertaken with the Polish Food Federation, under which 13,000 pallets and 9000 tons of food were rescued in 5 years, translating into 16 million meals issued to needy people. In 2020 [124], despite the ongoing COVID-19 pandemic, food banks were also supported, with Raben donating 1500 pallets with 650,000 kg of food to the Czech Republic and Ukraine. In comparison, 1100 pallets of 600,000 kg of food were donated in 2021 [125]. Other Raben activities include visits to kindergartens, preparing a transport fairy tale involving the company’s employees, and grassroots social initiatives organized by employees (such as flea markets, Christmas fairs, auctions, and book fairs) donated more than PLN 250 thousand to charity in 2019 [123], while in 2020 [124], financial support figures were not disclosed in the CSR-P, while in 2021 [125] more than 50 thousand euros were donated to charity. Only data on in-kind support was indicated, highlighting that Raben organized charitable shipments including 6 million masks, 220,000 visors, and medical goggles, 100,000 protective suits, 250,000 gloves, 5000 L of disinfectants, and 60 respirators, and in 2021, despite mention in the CSR-P of charitable activities to support COVID-19 countermeasures, no detailed data including specific financial data was included. Raben also demonstrates an awareness of the transportation industry’s impact on the environment and aims to minimize its operations’ environmental impact, emphasizing the responsible and conscious role the company plays concerning future generations [123,124,125]. The company operates it fueling stations, constantly examining the quality of the fuels it fills, looking to the future, and measuring itself against the need for widespread adoption of green solutions, including electric vans. In 2019 [123] Raben had created a 5-year plan called Eco2way to reduce its carbon footprint and neutralize its gas emissions, which includes negotiating the supply of energy with a guarantee of its origin from Renewable Energy Sources, developing and implementing a comprehensive tool for calculating CO2 emissions per shipment, and partially replacing its fleet with electric vehicles. In terms of electricity in 2019 [123], Raben’s total electricity consumption was 27,034 MWh, resulting in a decrease of 1000 MWh compared to the previous year, of which 7000 MWh relates to the energy consumed at leased warehouses, where the company has no control over how energy is managed. In addition, more than 28,000 l of oil was used to power all the company’s facilities, bringing the total consumption to 1150 GJ (an increase of 54 GJ compared to 2018). As for thermal energy demand, in 2019 Raben consumed 2.612 million cubic meters, translating into energy production of 99,000 GJ (a decrease of 8000 GJ compared to 2018) [123]. The 2020 report [124] did not provide data on total electricity consumption, oil consumption, or thermal energy demand data consistent with the 2019 statements, which could be compared with each other. Only the organization’s total electricity consumption of 6,615,248 GJ (compared to 6,813,650 GJ in 2019) and natural gas consumption of 134,271 GJ (compared to 121,018 GJ in 2019) were indicated [123]. On the other hand, according to data for 2021 [125], the company’s total energy consumption in 2021 was 7,727,486 GJ, with natural gas at 228,645 GJ. In addition, the company did not use energy from renewable sources in 2019–2020 [123,124,125]. As indicated by the 2020 CSR-P [124], Raben purchased electricity for 2021–2022 with renewable energy certificates, reducing electricity demand by at least 20%. As a result, almost all of Raben’s facilities will be powered by 100% green electricity (except for leased facilities, for which Raben does not influence energy purchases). In terms of green energy indicators, the company purchased 132,627 GJ of green energy in 2021 (no such purchases were made in earlier years) against the total purchased energy of 266,438 GJ in 2021 240,080 GJ in 2020. The rate of purchasing green energy for 2021 was 49.8%. On the other hand, the Eco2way program in 2020 implemented environmental management standards (ISO 50,001-energy management and ISO 14,001-environmental management) and identified targets for 2025, dividing them into five pillars: greenhouse gas emissions (e.g., reducing emission intensity at the company’s facilities by 30%), resource management (energy efficiency initiatives and energy intensity measurement), green energy (first investments in renewable energy sources), waste management (90% segregation), green initiatives (sustainable investments for low-carbon or neutral services). The 2019 targets for the Eco2way project were replicated in the 2021 CSR-P. The targets were supplemented with renewable energy activities, indicating that the first renewable energy purchase agreement for the next seven years had been signed and work on a zero-emission warehouse had begun. In addition, it was indicated that Raben plans to become a climate-neutral company on all levels by 2050. Raben emphasizes that it will use energy from photovoltaic farms between 2023 and 2029. To meet its energy needs, photovoltaic farms will be built with a total capacity of about 35 MWp and 40 hectares of land [125].
The COVID-19 pandemic impacted the shape of Raben’s CSR-P, as the company took measures aimed at protecting employees’ health but also tried to ensure business continuity. A Crisis Staff was established, responsible for monitoring the development of the situation in the market and creating rules and regulations to effectively inhibit the spread of the virus among the company’s employees. In this regard, specific policies, procedures, instructions for action, and information campaigns (Keep Calm and Stay Healthy) were created and protective measures, organizational changes in the workplace, and COVID-19 compliance audits were implemented. In response to the COVID-19 pandemic, policies were implemented for security, business travel arrangements, stakeholder visits, and an inventory procedure with customers. Despite the ongoing crisis related to the COVID-19 pandemic, Raben continued to undertake environmental initiatives. Among the measures taken was implementing a paperless procedure, including the switch to electronic invoices. In addition, the company has supported forest conservation in Peru since 2015, sponsored the Drive to bee project in Germany since 2017, helped build nesting boxes for butterflies and bats in Poland, and financially supported small zoos in the Czech Republic that house animals injured in traffic accidents. In addition, as indicated in the 2020 CSR-P, the COVID-19 pandemic undoubtedly affected the company’s involvement in social activities. Legal restrictions resulted in a decrease in completed social projects (educational projects for children, among others, were abandoned). However, it should undoubtedly be emphasized that the company was looking for new opportunities in terms of activities for local communities. It funded 3000 language courses for children from orphanages, provided assistance in transporting medical equipment, donated 2000 pallets of food (2 million meals), and purchased equipment for 40 hospitals and psychiatric wards in Poland (30,000 pieces of furniture and accessories). Despite the ongoing COVID-19 pandemic, the company also became involved in the Noble Parcel campaign (individual and in-kind assistance to those in need, cooperation continued in 2021), as well as Raben’s Christmas Charity Convoy (cooperation continued in 2021), donating Christmas parcels for financially disadvantaged children. In 2021, Raben also paid great attention to protecting the health of employees and subcontractors in connection with the ongoing COVID-19 pandemic. As indicated in the CSR-P, cooperation and consultation with employees and interaction made it possible to develop mechanisms to combat the effects of the pandemic and, more broadly, to respond more quickly to abnormal situations. In addition, during the humanitarian crisis in Ukraine, in 2021, the company together with the UA Food Foundation Food Bank and Carlsberg Ukraine, organized the delivery of drinks to medical personnel. In 2021, Raben expanded its community outreach by joining the Nestle partnership (a campaign to support medical personnel), actively participating in fundraising and donations to charitable organizations, promoting environmental and educational campaigns, healthy living during the pandemic, and road safety [124,125]. The management reports for 2019 [126]–2020 [127] did not indicate information on the impact of the COVID-19 pandemic on the company’s operations. In addition, the management report for 2021 [64] highlighted that the armed conflict and the energy crisis caused by it significantly affect the market in Poland and are global in scope. The company’s primary focus is on domestic and international transportation. However, the eastern directions are not affected. For these reasons, the situation in Ukraine should not affect the continuation of business operations but will undoubtedly translate into an increase in the cost of doing business [128].
4.1.2. Schenker’s CSR Policy
In its 2019–2020 CSR-P report [129], Schenker identifies the principles it follows in conducting business. These include building a culture of innovation, efficient flow of information, proper selection of suppliers, transportation safety, proper working conditions, and care for the social environment and the environment (including economic energy consumption and reduction of waste and CO2 emissions). Schenker bases its assumptions for sustainability efforts on the so-called Primus pyramid, which consists of four pillars: overarching goal, ambition, values, and commitment, while defining a sustainable transformation process in the face of global market challenges [129]. CSR-P’s goals are indicated in Table 2.
Table 2.
CSR strategy-CSR-P goals and implementation in 2019–2020.
According to Schenker’s sustainability efforts, the company is building its CRS-P on implementing innovations. The 2019–2020 core targets include three baseline goals: clean logistics (ensuring climate neutrality by 2050, zero-carbon facilities, and 100% waste treatment), a thriving community (ensuring fair working conditions for employees as well as supply chain partners), and shared values (developing sustainable logistics solutions of the future, a smart urban mobility concept and implementing a learning organization). The CSR-P pointed out that the COVID-19 pandemic revised the company’s business strategy and forced Schenker to adapt its growth scenarios to the new reality. The report demonstrated the need to create post-pandemic Smart Cities, for it is, after all, cities that generate the largest global GDP (urban centers are home to more than 50% of people, who generate 70% of global GDP while consuming 60% of energy and producing 70% of waste). The premise and goals of the Smart City are to manage through innovation and creativity, creating resident-friendly cities while maintaining sustainability. Schenker points out that it remains critical to maintaining proper logistics cooperation between the cities of the future with other centers in order to ensure an efficient supply chain through the use of new technologies: drones, autonomous vehicles, zero-emission small city terminals, or logistics centers that will be located outside city limits. In its Smart City efforts, Schenker points to a low-emission distribution terminal in Oslo, known as e-Trucks, opening in 2019, with deliveries handled by e-trucks, e-Vans, and cargo bikes, among other things. Using the example of the company’s operations in Poland, it is worth adding that in the first six months of 2022, Schenker consumed 2845.74 MWh of electricity from renewable sources. According to its targets, the company wants to achieve climate neutrality by 2040 [125]. Schenker points out that one of CSR-P’s main goals is to create sustainable value for customers and build a resilient supply chain to turbulence and crises. Because of the above, the company is constantly improving its processes and operations, enhancing the quality of its solutions, whether in land, ocean, air, or contract logistics. As part of its BBFM+ (Bigger, Better, Faster & More) strategy in land transportation, the company aims to standardize processes and systems for products offered to customers in the European network. Here, it is worth pointing out that with the COVID-19 pandemic, trade was changed (restrictions on sea routes were introduced), leading to the use of rail infrastructure, including on the so-called New Silk Road. Many difficulties hit maritime transport during COVID-19 due to connection closures, container shortages, and pandemic restrictions. Freight prices have risen dramatically, while at the same time, shipowners’ on-time performance has deteriorated. In addition, in terms of shipping, the company opened a new container trans-shipment terminal in Sosnowiec in 2020. After arriving at the port of Gdansk, goods are transported to Sosnowiec and are then delivered to their intended recipients. As for air transportation, it should be pointed out that as a result of the COVID-19 pandemic, the number of passenger shipments dropped by 90%. Under normal market conditions, cargo transport involving scheduled aircraft accounts for about 54% of the cargo capacity available in global air transport. The COVID-19 pandemic caused a crisis in the airline industry. Despite this, the company managed to fulfill orders by air transport, and new routes between Asia and Europe were launched. In terms of sustainability efforts, Schenker has set climate neutrality by 2050 as a strategic goal, implementing eco-solutions to contribute to positive environmental changes and the well-being of the company’s employees and local communities. These include the Clean Skies for Tomorrow coalition (a global initiative related to the transition to zero emissions), the Getting to Zero coalition (the goal of introducing zero-emission ships by 2030), and the Arctic Commitment (phasing out heavy fuel oil from shipping from 2020). In addition, Schenker is testing and gradually introducing the following in individual European cities: cargo bikes, electric vehicles, and autonomous vehicles. In 2020, the first electric car was purchased to transport shipments from one warehouse to Warsaw, and tests of electric cars for parcel distribution in major cities (Katowice, Warsaw, Wroclaw) have begun. For example, initiatives that have been undertaken in Poland include reducing energy consumption through new terminal construction technology and a smart building management system (adjusting temperature to users’ needs, controlling outdoor lighting with an astronomical clock and motion sensors, solar panels for heating water, and converting internal combustion forklifts to electric and battery-powered ones). In terms of good environmental practices, it is worth noting that the company’s electricity consumption decreased by 20% in 2020, compared to 2019, greenhouse gas emissions decreased by 23% in 2020, and compared to 2019, the use of plastic bottles was eliminated. In addition, energy efficiency in 2020 was 4628 kWh per number of employees and 220 kWh per 1000 operations, respectively. The company, while making new investments in the construction of terminals, is erecting completely green facilities equipped with solar panels, heating, and ventilation equipment with heat recovery, using rainwater to flush toilets, buying green energy, and putting up insect boxes. Comparing the data in terms of waste generation with Raben, the level of processing is slightly lower (but also at a high level), and in 2020 was 84%. In terms of statistics, constructing eco-terminals undoubtedly contributes to a positive environmental impact and generates savings. For example, the Stawiguda (Olsztyn) Terminal generated savings in 2020 of 171 m3 of potable water and 24,000 kWh of thermal energy for heating water. In terms of energy consumption at terminals and warehouses, the intensity of energy consumption decreased in 2020, compared to 2019 (where it was 97,694 MWh in 2020 and 126,287 MWh in 2019, respectively), while the total energy consumption from non-renewable resources in 2019: was 171 (fuel oil) and 71,787 (natural gas), respectively, and in 2020: 152 (fuel oil) and 44,830 (natural gas). On the other hand, the total consumption of self-produced or purchased energy was 126,287 MWh in 2019, while 97,694 MWh in 2020. It is worth mentioning that the company did not conduct renewable energy purchases in 2019–2020 (as did Raben). These measures were not taken until 2021 [129].
The COVID-19 pandemic impacted not only the shape of CSR-P but Schenker as a whole. Nearly 700 people worked remotely, training and workshops on mental and physical health were introduced for employees due to social isolation, special sanitation procedures were created, information campaigns were conducted, and vaccination was encouraged. Despite the problematic pandemic situation, Schenker continued to support charitable activities. The company runs a volunteer program called Time to Help, which includes several initiatives aimed at local communities (supporting orphanages, hospitals, hospices, and schools, and activities such as landscaping and organizing workshops for young people). In addition, support has been provided to hospitals (purchase of contact cameras, supply of lamps for illuminating rooms, as well as nursing supplies), children’s daycare centers (office supplies, toys), or support for medical staff and patients (purchase of protective clothing, disinfecting fluids, sewing of masks), among others. The company cooperates with and supports food banks. The total value of donations to the Olsztyn branch of the Food Bank amounted to PLN 17.5 thousand in 2020 and PLN 24.6 thousand in 2019. Schenker, in cooperation with Dr. Irena Eris, offered free transport of medical products to hospitals, donating products with a total value of about PLN 1.5 million to 200 hospitals across Poland. In addition, the management report for 2019 indicated that the pandemic situation related to COVID-19 would undoubtedly harm both the global economy and the entity. However, as of the date of the report, it has yet to play a significant role in the entity’s financial and asset position [130]. In turn, the management report for 2020 indicated that the ongoing economic crisis caused by the COVID-19 pandemic, which caused a decline in domestic demand and a decrease in investments, did not contribute to the entity’s financial and asset situation [131], while the 2021 report indicated that despite successive waves of the virus and the developing COVID-19 pandemic, the entity’s financial and asset situation is stable [132]. In contrast, the situation related to the energy crisis and the armed conflict in Ukraine requires constant analysis regarding currency fluctuations, fuel prices, and driver availability. Nevertheless, the company is taking measures to ensure continuity and the ability to continue operations in future years, considering the risk of the impact of macroeconomic changes on the financial and asset situation of the entity in coming years [130,131,132].
4.1.3. DSV’s CSR Policy
DSV’s CSR-P for 2019 [133], recognizing itself as a global player in the transport and Logistics industry, is fully aware of the impact of business on the world. Because of this, the entity has formulated four main CSR areas: environment (the transportation industry’s impact on the environment as an opportunity to make a difference), business ethics (recognized by employees and suppliers), people (the right working environment in the organization) and suppliers (the network of relationships with suppliers in the asset-light business model). The 2020 report [134], on the other hand, adopts 5 CSR-P goals, within which the following are singled out: business ethics (conflicts of interest, unfair competition, anti-corruption, tax policy, and compliance), people (similar to 2019 as the right working environment in the organization), environment (minimizing the negative impact of the industry on the environment), commitment to local communities, and responsible procurement (the highest standards in cooperation with suppliers). The 2021 report [135] outlines three main sustainability goals: governance (business ethics, responsible procurement), environment, and social. In addition, a new goal has been added: maintaining the supply chain in the face of changes caused by emergencies (this is in response to the COVID-19 pandemic). DSV, in the report [133], stresses that the logistics industry is a major contributor to global greenhouse gas emissions, so it has, as a goal, its responsibility to drive change in the transportation industry toward a more sustainable future. It is worth noting that among the goals met in 2020 [134], they indicate science-based targets for lowering CO2 emissions by 2030 (they are the only ones to indicate 2030, not 2050), green procurement projects, EcoTransIT, and green buildings, among others. The 2021 targets [135] were: 100% compliance with the revised car emission policy, and a waste recovery rate of more than 80%. As only one of the companies analyzed, it indicated while the industry is largely ready to opt for sustainable solutions that allow goods to move in less severe ways for the environment, these solutions are often financially unviable. Many of the company’s sites have implemented a management system for environmental activities (ISO 14,001 certified), including optimizing supply chains, developing sustainable solutions, and using resources responsibly. DSV, in 2019 [133], began collaborating on the innovative H2RES project, funded by the Energy Technology Development and Demonstration Program (EUDP), which aims to demonstrate the feasibility of using energy production from offshore wind power to produce renewable hydrogen (as a zero-emission source used for transportation). As indicated in the report [134], the project aims to build a 1.3 GW electrolysis plant near Copenhagen by 2030, which will supply more than 250,000 tons of hydrogen-based fuels annually. In addition, DSV, like Raben and Schenker, is pursuing a recycling policy, pointing to material recovery at 80% of its locations. Like the other companies, DSV is upgrading its warehouses, increasing its energy efficiency, and, thus, reducing CO2 emissions. Newly built investments benefit from modern solutions, such as automated lighting, water-saving fixtures, and good working conditions. It is worth noting that DSV was the only company surveyed in the report [134] to indicate that all the company’s newly built facilities use renewable energy sources (whether generated on-site or purchased renewable energy). The company-built DSC Hedeland in Denmark in 2021 [135], a transit point that has enabled the consolidation of the supply chain. Importantly, the facility meets all the requirements for green buildings (solutions include recovery of excavation materials, filters to protect workers from harmful nitrogen, and rooftop solar panels with batteries were installed). In addition, an initiative has been taken to optimize technical solutions, including replacing equipment in warehouses (forklifts or eco-friendly packaging) in 2020. Steps have also been taken to replace the fleet, gradually replacing fossil-fuel-powered vehicles with electric vehicles, to have a vehicle fleet powered solely by electricity or renewable sources by 2028. The company also emphasizes its commitment to local communities. Since the early 1990s, it has been directing its sustainable development activities toward disaster relief in affected areas. Collaborations include working with the Red Cross and Red Crescent (through the Danish Red Cross), which carry out a range of local activities worldwide. In addition, DSV sponsors storage space for disaster relief equipment, transports rescue equipment free of charge, or helps set up camps in affected areas. In 2019, for example, Cyclone Idai flooded a large part of Malawi, and the effects of the weather phenomenon affected more than 900,000 people, who had to seek help at evacuation centers. DSV provided storage facilities for relief supplies and participated in the transportation of emergency equipment. Similar actions on the company’s part took place after Hurricane Dorian hit the Bahamas. In addition, a blood donation drive was also organized in Ecuador in 2019, and financial donations were made to the Children’s Cancer Fund every year. In the face of the COVID-19 pandemic, DSV took steps to minimize the negative effects of the pandemic in Cox’s Bazar camp in Bangladesh. Fifteen million protective masks were donated to healthcare workers and the elderly in Bangladesh, Iraq, Kenya, and Belarus. In addition, DSV financially supported (unfortunately, no financial data is available) the Danish Red Cross in the fight against the COVID-19 pandemic with financial donations to the COVID-19 Vaccines Global Access (COVAX) program. In 2020, the company also provided support in the form of a financial donation to the Lebanese Red Cross in connection with the explosion at the Port of Beirut. Other activities in 2020 include participation in World Cleanup Day and support for victims following the eruption of the Taal volcano in the Philippines. DSV indicated in the CSR-P that a reduction in CO2 emissions in 2020, compared to 2019, contributed to by, among other things, increasing the energy efficiency of its facilities and using energy-efficient vehicles. Regarding the impact of the COVID-19 pandemic on CO2 emissions, it was pointed out that pandemic restrictions reduced transportation volumes, which also resulted in lower emissions, as did fewer business trips. In the 2021 report, where the goal of maintaining a supply chain in a world of constant change is clearly stated, DSV highlights the impact of the COVID-19 pandemic on the company’s CSR policy. It points out that a positive aspect of the crisis caused by the pandemic is to highlight the importance of the company’s involvement in emergencies as an entity that is part of the critical infrastructure that, on the one hand, allows societies to develop and, on the other hand, also function in the most difficult situations. Unfortunately, the company does not present figures in its reports on the sustainability measures taken [133,134,135]. In its management report for 2020, the company indicated that the COVID-19 pandemic did not significantly affect sales and the supply chain. However, it caused slight payment delays (but no congestion). In view of the above, it was concluded that there was no impact of the COVID-19 pandemic on liquidity. On the other hand, the pandemic led to changes in working hours, securing protective measures, and reorganizing workspaces [133,134,135]. DSV, in its management report for 2021, indicated that the ongoing energy crisis triggered by Russia’s 2022 attack on Ukraine has not significantly affected sales and the supply chain to date. Nevertheless, due to the market situation and steadily rising fuel and energy prices, the company is trying to accelerate payment terms to subcontractors who currently face the risk of insolvency. In contrast, DSV has not recorded events that could affect its continued operations [136,137]. Additionally, DSV is the only surveyed entity that has not published a CSR-P in Polish. The website dedicated to CSR-P is done in Polish. However, all references to the report refer only to CSR-P in English.
4.2. Financial Data Analysis
Table 3, Table 4 and Table 5 present the financial data of the surveyed entities for 2019–2021, derived from the published financial statements of Raben [138,139,140], Schenker [141,142,143], and DSV [144,145,146]. Table 6 compiles critical financial ratios of the entire transportation industry and selected companies for 2017–2021.
Table 3.
Balance sheet total and equity in the years 2021–2019 (in PLN million).
Table 4.
Net profit and revenue in the years 2021–2019 (in PLN million).
Table 5.
Summary of key financial ratios for the years 2017–2019.
Based on the data presented in Table 3, Table 4 and Table 5, the operations of the surveyed entities are growing steadily. In all years, each entity recorded a gradual increase in revenue from core operations. In terms of net profit generated, only Schenker recorded a decrease in net profits in 2021 compared to the other years (2019 and 2020). This situation is also reflected in the financial indicators of the surveyed entities. Each of the surveyed entities shows that liquidity and profitability indicators are reasonable, and no signs threaten the continuation of business operations.
Considering the financial data of companies in the transportation industry, the range of weighted average net sales margins from 2017 to 2021 earned by transportation service providers was at the following market level: the first quartile was 0.41%, and the third quartile was 3.97% with a median of 1.73%. The lowest median level was reached in 2019 at 1.13% [153].
The results achieved by DSV Road and Schenker are within the designated market range, while Raben achieved higher net sales margins in the period under review. However, they were within the maximum results achieved by the surveyed group of peers.
4.3. Statistical Analysis
The comparison of the financial performance of the companies under study with selected companies (Rhenus, Śląskie Centrum Logistyk, Fresh) in the logistics industry was carried out using seven standardized financial indicators, namely: classical current ratio, classical quick liquidity ratio, receivables turnover rate, overall debt ratio, net return on sales, return on assets, return on equity.
4.3.1. Examine the Significance of Differences in Selected Financial Parameters between the Group of Companies Studied and the Control Group
This subsection compares the means of financial indicators between Raben, Schenker, DSV companies (further-studied companies) and Rhenus, Śląskie Centrum Logistyki, Fresh (further-control companies) for 2017–2021 for each year separately.
Classical Current Ratio (Third-Degree Liquidity)
The distribution of the classical current ratio’s central tendency and the Welch t test results are shown in Table 6, n = 3, df = 4, nobs = 6.
Table 6.
Classical current ratio (third-degree liquidity).
Table 6.
Classical current ratio (third-degree liquidity).
| Year | Group | M (SD) | tWelch | p | |
|---|---|---|---|---|---|
| 2017 | control | 2.05 (0.32) | 1.50 | 0.207 | 0.98 |
| studied | 1.65 (0.33) | ||||
| 2018 | control | 2.40 (0.60) | 1.76 | 0.120 | 1.12 |
| studied | 1.64 (0.45) | ||||
| 2019 | control | 2.18 (0.66) | 1.10 | 0.340 | 0.68 |
| studied | 1.68 (0.42) | ||||
| 2020 | control | 3.70 (3.07) | 1.14 | 0.370 | 0.55 |
| studied | 1.65 (0.5) | ||||
| 2021 | control | 1.93 (0.75) | 0.91 | 0.430 | 0.55 |
| studied | 1.48 (0.43) |
Own a study based on the annual financial statements for 2017–2021 [138,139,140,141,142,143,144,145,146,147,148,149,150,151,152].
From the data in Table 6, it can be seen that the mean values of the control group had higher values of the analyzed parameter throughout the study period. However, the differences were not significant (p > 0.05). Due to the very small samples, it is also important to consider the effect size, which decreased from 0.98 in 2017 to 0.55 in 2021, which meant a decrease in the effect between groups from large to medium. The variance of the analyzed financial parameters was more stable in the studied group.
Classical Quick Liquidity Ratio (Second-Degree Liquidity)
The distribution of the classical quick liquidity ratio’s central tendency and the Welch t test results are shown in Table 7, n = 3, df = 4, nobs = 6.
Table 7.
Classical quick liquidity ratio (second-degree liquidity).
From the data in Table 7, analogous to parameter Classical Current Ratio, the mean values of the control group had higher values of the analyzed parameter throughout the study period. However, the differences were not significant (p > 0.05). Because of the small samples, it is also necessary to consider the effect size, which decreased from 0.95 in 2017 to 0.52 in 2021, which meant a decrease in the effects between groups from large to medium. The variance of the analyzed financial parameters was more stable in the studied group.
Receivables Turnover Rate in Days (Receivables Cycle)
The distribution of the central tendency of the receivables turnover rate and the results of the Welch t-test are shown in Table 8, n = 3, df = 4, nobs = 6.
Table 8.
Receivables turnover rate in days (receivables cycle).
The data in Table 8 shows that the mean values of the control group had higher values of the analyzed parameter throughout the period 2017–2020, and vice versa in 2021. However, the differences were not significant (p > 0.05). Due to the small samples, it is also necessary to consider the effect size, which decreased from 0.95 in 2017 to −0.18 in 2021, which means a decrease in the effects between groups from a large to a small size. The variance of the financial parameters analyzed was variable over time for both groups.
Overall Debt Ratio
The distribution of the central tendency of the overall debt ratio and the results of the Welch t test are shown in Table 9, n = 3, df = 4, nobs = 6.
Table 9.
Overall Debt Ratio.
The data in Table 9 shows that the mean values of the control group had lower values of the analyzed parameter throughout the period. However, the differences were not significant (p > 0.05). Due to the very small samples, it is also necessary to consider the effect size, which increased from −0.77 in 2017 to −1.53 in 2021, which means an increase in the effects between the groups from a medium to a large size. The variance of the analyzed financial parameters decreased in the studied group and increased in the control group.
Net Return on Sales (ROS)
The distribution of the central tendency of the net return on sales and the results of the Welch t test are shown in Table 10, n = 3, df = 4, nobs = 6.
Table 10.
Net Return on Sales (ROS).
From the data in Table 10, the mean values of the control group had higher values of the analyzed parameter throughout the analyzed period. However, the differences were not significant (p > 0.05). Due to the very small samples, it is also necessary to consider the effect size, which decreased from 0.82 in 2017 to 0.12 in 2021, which means a decrease in the effects between the groups from a large to a very small size. The variance of the financial parameters analyzed was variable over time for both groups.
Return on Assets (ROA)
The distribution of the central tendency of the return on assets and the results of the Welch t test are shown in Table 11, n = 3, df = 4, nobs = 6.
Table 11.
Return on Assets (ROA).
From the data in Table 11, the mean values of the control group had higher values of the analyzed parameter throughout the studied period, although the differences were not significant (p > 0.05). Due to the very small samples, it is also necessary to consider the effect size, which increased from 0.49 in 2017 to 0.18 in 2021, which means that the effects between the groups decreased from a small to a very small size. The variance of the analyzed financial parameters was mainly increased in both groups.
Return on Equity (ROE)
The distribution of the central tendency of the return on equity and the results of the Welch t test are shown in Table 12, n = 3, df = 4, nobs = 6.
Table 12.
Return on equity (ROE).
From the data in Table 12, it can be seen that the mean values of the control group had higher values of the analyzed parameter throughout the analyzed period except 2021. However, the differences were not significant (p > 0.05). Due to the very small samples, it is also necessary to consider the effect size, which increased from 0.25 in 2017 to −0.11 in 2021, which means a decrease in the effects between the groups from a small to a very small size. The variance of the analyzed financial parameters was mainly increased in both groups.
4.3.2. Examine the Significance of Differences in Selected Financial Parameters within the Group of Companies Studied and the Control Group
Classical Current Ratio (Third-Degree Liquidity)
The dynamics of changes in the classical current ratio parameter within each group from 2017 to 2021 are shown in Figure 2.
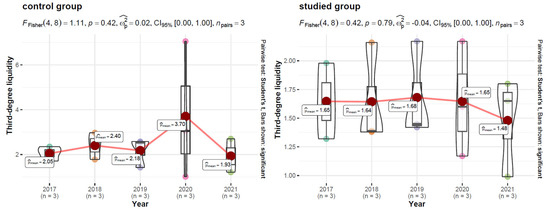
Figure 2.
Analysis of the differences within the Classical current ratio parameter over time for control (left) and studied (right) group. Own a study based on the annual financial statements for 2017–2021 [138,139,140,141,142,143,144,145,146,147,148,149,150,151,152].
Figure 2 shows no significant change within each group for 2017–2021, and a small pooled effect size was obtained for both groups. The period of 2020–2021 (pandemic) for both groups were characterized by a higher variance with a change in the trend from constant to decreasing.
Classical Quick Liquidity Ratio (Second-Degree Liquidity)
The dynamics of changes in the classical quick liquidity ratio parameter within each group from 2017 to 2021 are shown in Figure 3.
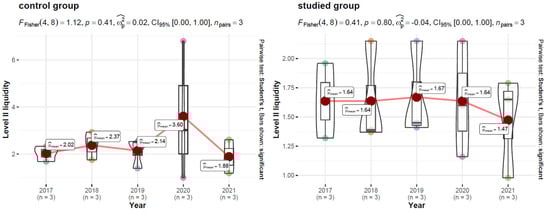
Figure 3.
Analysis of the differences within the Classical quick liquidity ratio parameter over time for the control (left) and studied (right) group. Own a study based on the annual financial statements for 2017–2021 [138,139,140,141,142,143,144,145,146,147,148,149,150,151,152].
Figure 3 shows that there was no significant change within each group for 2017–2021, and a small pooled effect size was obtained for both groups. The period of 2020–2021 (pandemic) for both groups were characterized by a higher variance with a change in the trend from constant to decreasing.
Receivables Turnover Rate in Days (Receivables Cycle)
The dynamics of changes in the receivables turnover rate parameter within each group from 2017 to 2021 are shown in Figure 4.
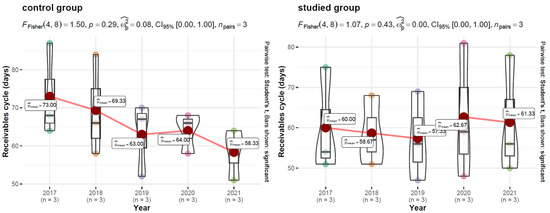
Figure 4.
Analysis of the differences within the Receivables turnover rate parameter over time for control (left) and studied (right) group. Own a study based on the annual financial statements for 2017–2021 [138,139,140,141,142,143,144,145,146,147,148,149,150,151,152].
Analysis of the differences within the Classical quick liquidity ratio parameter over time for control (left) and studied (right) group.
Figure 4 shows that there was no significant change in receivables cycle within each group for 2017–2021. There was a median pooled effect size for the control group and no effect for the studied group. The 2020–2021 (pandemic) period for both groups was characterized by lower variance for the control group and higher variance for the studied group, with the trend for both groups changing from a decrease (2017–2019) to an increase (2020) with a further decrease in 2021.
Overall Debt Ratio
The dynamics of changes in the overall debt ratio parameter within each group from 2017 to 2021 are shown in Figure 5.
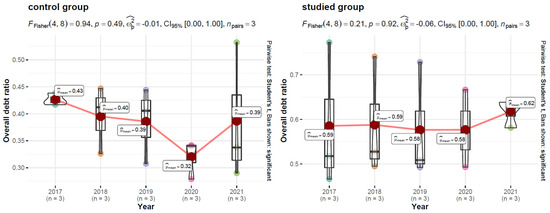
Figure 5.
Analysis of the differences within the Overall debt ratio parameter over time for control (left) and studied (right) group. Own a study based on the annual financial statements for 2017–2021 [138,139,140,141,142,143,144,145,146,147,148,149,150,151,152].
Figure 5 shows no significant change within each group for 2017–2021. A small pooled effect size was obtained for the control group and a medium one for the studied group. The 2020–2021 (pandemic) period for both groups was characterized by higher variance for the control group and lower variance for the studied group, with the trend changing from decreasing to increasing.
Net Return on Sales (ROS)
The dynamics of changes in the net return on sales parameter within each group from 2017 to 2021 are shown in Figure 6.
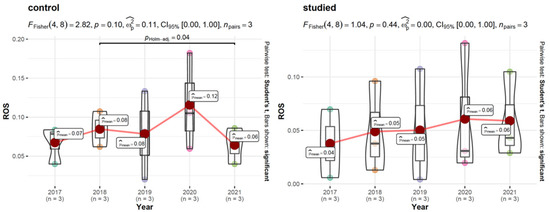
Figure 6.
Analysis of the differences within the Net Return on Sales parameter over time for control (left) and studied (right) group. Own a study based on the annual financial statements for 2017–2021 [138,139,140,141,142,143,144,145,146,147,148,149,150,151,152].
Figure 6 shows that the control group experienced a significant decrease in ROS between 2018 and 2021. There was a medium pooled effect for the control group and no effect in the study group. The 2020-2021 (pandemic) period was characterized by higher variance for the study group, with a change in trend from an increase or stability (2017–2020) to a decrease in 2021 for the control group. No change ROS in variance or trend was observed for the study group throughout the study period.
Return on Assets (ROA)
The dynamics of changes in the return on assets parameter within each group from 2017 to 2021 are shown in Figure 7.
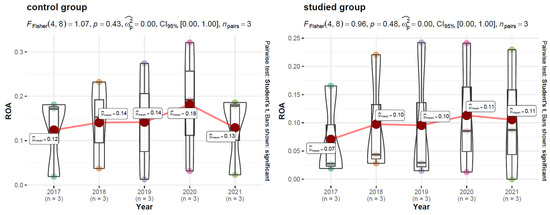
Figure 7.
Analysis of the differences within the Return on assets parameter over time for control (left) and studied (right) group. Own a study based on the annual financial statements for 2017–2021 [138,139,140,141,142,143,144,145,146,147,148,149,150,151,152].
Figure 7 shows no significant change within each group for 2017–2021, and there was no pooled effect for either group. The 2020–2021 (pandemic) period was characterized by higher variance for both groups, with the trend changing from an increase or stability (2017–2020) to a decrease in 2021 for both groups.
Return on Equity (ROE)
The dynamics of changes in the return on equity parameter within each group from 2017 to 2021 are shown in Figure 8.
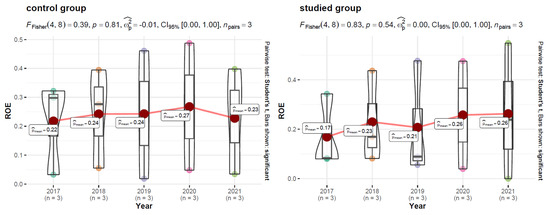
Figure 8.
Analysis of the differences within the Return on equity parameter over time for control (left) and studied (right) group. Own a study based on the annual financial statements for 2017–2021 [138,139,140,141,142,143,144,145,146,147,148,149,150,151,152].
Figure 8 shows that there was no significant change within each group for 2017–2021, and there was little pooled effect for either group. The 2020–2021 (pandemic) period was characterized by higher variance, particularly for the studied group, with the trend changing from an increase or stability (2017–2020) to a decrease in 2021 for the control group. In the case of the studied group, the trend remained elevated in 2020–2021.
5. Discussion
The article analyzes the relationship between abnormal situations and the financial situation of companies in the transportation industry and the actions they take in connection with their CSR policies. The study results align with previous literature examining the impact of corporate social responsibility on abnormal situations. The results are in line with the findings of Skare and Golja [154], as well as Navaro Espigares and Lopez [155], who identified a positive relationship between CSR and impact on local communities, pointing to economic growth as an indicator that influences the implementation of CSR assumptions. As indicated by the researchers, crises play a significant role in creating CSR policy assumptions. In addition, the study can contribute to the assumption that CSR strategies can positively affect the performance of an entity. A similar position was expressed by Magno and Cassia [156]. The results of the transportation industry analysis extend the existing knowledge, indicating that CSR policy measures can positively affect the performance of companies if they are correctly implemented and primarily benefit stakeholders. Scott and Laws [157,158] and Alonso-Almeida and Bremser [159] came to a similar conclusion, emphasizing that CSR leads to improved corporate financial performance if resilience to abnormal situations is built in correctly the first place. Similarly, Gossling, Scott, and Hall emphasize that CSR influences companies’ coping with crises [160].
6. Conclusions
The COVID-19 pandemic, the associated business constraints, and the ongoing energy crisis are undoubtedly affecting the economic situation in Europe and worldwide. Uncertain situations, on the one hand, threaten the continuity of business operations. On the other hand, they provide an opportunity to review the adopted strategic goals of companies. Companies in the transport industry show great awareness of the importance of their actions in social responsibility and sustainable development, not only through reports but also through actual actions. As indicated by the article research and the presented results of the surveyed companies’ financial analysis, each company achieved positive financial results despite the challenging market situation while pursuing the objectives for sustainable development and corporate social responsibility. Crises over the period 2020–2021 did not threaten the continuation of the activities of the studied entities. There was no break in the supply chain. Each entity sought not only to ensure continuity of supply, but also addressed the challenge posed to transportation industry players to counter the spread of the COVID-19 pandemic. Despite the difficult market situation, each of the surveyed companies sought to support their contractors during the crisis, seeking favorable solutions to protect them from the harsh effects of not only the COVID-19 pandemic but also the ongoing energy crisis (using, for example, accelerated payment terms for suppliers). In addition, each company noted the need to conduct investments in renewable energy sources, targeting green solutions in transportation and the transit centers or offices they run. At this point, although hit by the economic crisis, each of the surveyed entities continues to implement and can carry out the responsibilities of sustainability and social responsibility measures.
This article adds to the general knowledge of creating and conducting CSR strategies concerning emergencies. The research showed a new aspect, confirmed by the results, that crises affect the implemented CSR policies and require them to be analyzed to achieve resilience and prepare companies for abnormal situations. The research showed that each company implements the obligation to report and implement CSR activities. In addition, each of the surveyed entities has a need that translates into actual activities in terms of conducting investments in so-called green energy. It was also confirmed that such activities positively affect public perception and deepen consumer confidence in CSR activities carried out by the surveyed entities.
Concerning the limitations of the research, it was conducted on a small group of companies and industry leaders, and a more extensive research sample could have yielded better results. In addition, the results presented here do not serve to formulate general conclusions about the situation of companies in the transport industry in the face of economic crises. In the future, I intend to expand my research on the subject under analysis. Together with researchers from HCMC University in Vietnam and Klaipeda State University in Lithuania (cooperation with these entities has been ongoing for several years now), we intend to conduct a comparative legal study of the legal regulation of CSR policies and their impact on the added value of transportation companies that operate around the world. This will undoubtedly contribute to research contributions on the topic of CSR, and perhaps lead to the development of a model to be adopted by companies in the transport industry so that the CSR reports published by these entities will allow an in-depth comparative analysis of the actions taken by the entities. Nevertheless, they could be a starting point for research of a broader scope, selecting a larger sample from the transport industry in Poland, a sample from countries belonging to the EU, or even selecting entities from third countries for the sample. This would provide a starting point for re-analyzing the topic and could result in more reliable conclusions that provide a basis for generalizing the findings presented. Future researchers could also analyze the topic of CSR policy itself in the context of the investments being made in reducing CO2 emissions by transport companies, as these investments are inevitable. Showing a broader perspective, different countries, and companies concerning their financial performance or employment size will undoubtedly lead to reliable and exciting research findings.
Funding
Chair funds of the Department of Financial Management, Faculty of Law, Administration and Economics, University of Wroclaw.
Institutional Review Board Statement
Not applicable.
Informed Consent Statement
Not applicable.
Data Availability Statement
All statistical, financial, and non-financial statement data can be found with the author. Available upon request.
Conflicts of Interest
The author declares no conflict of interest.
Abbreviations
| List of Abbreviations of the Names of Statistical Measures: | |
| N | sample size; |
| n | group sample |
| M | mean |
| SD | standard deviation |
| nobs | number of observations |
| df | degrees of freedom |
| p | p-value of statistical test |
| measure of Hedges g effect size | |
| CI 95% | confidence interval 95%; |
| tWelch | the t Welch test statistic |
| FFisher | the Fisher’s One-way ANOVA statistic |
| ω2p | omega square (partial) effect size |
| Other Abbreviations: | |
| CSR-P | CSR Policy |
References
- Haski-Leventhal, D.; Roza, L.; Meijs, L.C.P.M. Congruence in corporate social responsibility: Connecting the identity and behavior of employers and employees. J. Bus. Ethics 2017, 143, 35–51. Available online: https://link.springer.com/article/10.1007/s10551-015-2793-z (accessed on 13 September 2022). [CrossRef]
- Szutkowski, D.; Ratajczak, P. The Relation between CSR and Innovation. A Model Approach. J. Entrep. Manag. Innov. 2016, 12, 2. Available online: https://jemi.edu.pl/vol-12-issue-2-2016/the-relation-between-csr-and-innovation-model-approach (accessed on 13 September 2022).
- Jankal, R. The role of innovation in the assessment of the excellence of enterprise subjects. Procedia-Soc. Behav. Sci. 2014, 109, 541–545. [Google Scholar] [CrossRef][Green Version]
- Jankalova, M. Business Excellence evaluation as the reaction on changes in global business environment. Procedia-Soc. Behav. Sci. 2012, 62, 1056–1060. [Google Scholar] [CrossRef][Green Version]
- Saxton, G.D.; Waters, R.D. What do stakeholders like on Facebook? Examining public reactions to nonprofit organizations’ informational, promotional, and community-building messages. J. Public Relat. Res. 2014, 26, 280–299. [Google Scholar] [CrossRef]
- Friedman, M. The Social Responsibility of Business is to Increase Its Profits. In Corporate Ethics and Corporate Governance; Springer: Berlin/Heidelberg, Germany, 2007. [Google Scholar]
- Freeman, R.E. Strategic Management: A Stakeholder Approach; Pitman: Boston, MA, USA, 1984. [Google Scholar]
- Freeman, R.E. The new story of business: Towards a more responsible capitalism. Bus. Soc. Rev. 2017, 122, 449–465. Available online: https://onlinelibrary.wiley.com/doi/10.1111/basr.12123 (accessed on 13 September 2022). [CrossRef]
- Antonia García-Benau, M.; Sierra-Garcia, L.; Zorio, A. Financial crisis impact on sustainability reporting. Manag. Decis. 2013, 51, 1528–1542. [Google Scholar] [CrossRef]
- Sun, W.; Stewart, J.; Pollard, D. Reframing Corporate Social Responsibility. In Reframing Corporate Social Responsibility: Lessons from the Global Financial Crisis (Critical Studies on Corporate Responsibility, Governance and Sustainability), 1st ed.; Sun, W., Stewart, J., Pollard, D., Eds.; Emerald Group Publishing Limited: Bingley, UK, 2010; pp. 3–19. [Google Scholar] [CrossRef]
- Oliveira, J.d.S.; Azevedo, G.M.d.C.; Silva, M.J.P.C. Institutional and economic determinants of corporate social responsibility disclosure by banks: Institutional perspectives. Meditari Account. Res. 2019, 27, 196–227. [Google Scholar] [CrossRef]
- Hackett, C. The rebirth of dependence-offering an alternative understanding of financial crisis. Int. J. Law Manag. 2014, 56, 121–135. [Google Scholar] [CrossRef]
- Bu, M.; Rotchadl, S.; Bu, M. A comparative analysis of corporate social responsibility development in the USA and China. Crit. Perspect. Int. Bus. 2022. [Google Scholar] [CrossRef]
- Bebchuk, L.A.; Tallarita, R. The illusory promise of stakeholder governance. Cornell Law Rev. 2020, 106, 91. Available online: https://heinonline.org/HOL/LandingPage?handle=hein.journals/clqv106&div=5&id=&page= (accessed on 5 September 2022). [CrossRef]
- Guthrie, J.; Mathews, M.R. Corporate social accounting in Australasia. In Research in Corporate Social Performance and Policy; JAI Press: New York, NY, USA, 1985; pp. 251–277. [Google Scholar]
- Matten, D.; Moon, J. Corporate social responsibility. J. Bus. Ethics 2004, 54, 323–337. [Google Scholar] [CrossRef]
- Carroll, A.B. Corporate social responsibility, evolution of a definitional construct. Bus. Soc. 1999, 38, 268–295. [Google Scholar] [CrossRef]
- Crane, A.; Matten, D. Corporate Social Responsibility as a Field of Scholarship. In Corporate Social Responsibility; Andrew Crane, Dirk Matten; Sage: London, UK, 2007; Volume I–III, Available online: https://ssrn.com/abstract=1865404 (accessed on 11 September 2022).
- Raimo, N.; Vitolla, F.; Nicolò, G.; Polcini, P.T. CSR disclosure as a legitimation strategy: Evidence from the football industry. Meas. Bus. Excel. 2021, 25, 493–508. Available online: https://www.emerald.com/insight/content/doi/10.1108/MBE-11-2020-0149/full/html (accessed on 11 September 2022). [CrossRef]
- Jones, D.A. Does serving the community also serve the company? Using organizational identification and social exchange theories to understand employee responses to a volunteerism program. J. Occup. Organ. Psychol. 2010, 83, 857–878. [Google Scholar] [CrossRef]
- Haski-Leventhal, D. Strategic Corporate Social Responsibility: A Holistic Approach to Responsible and Sustainable Business, 2nd ed.; SAGE Publications: Newbury Park, CA, USA, 2022. [Google Scholar]
- Johnson, M.P.; Schaltegger, S. Two Decades of Sustainability Management Tools for SMEs: How Far Have We Come? J. Small Bus. Manag. 2015, 54, 481–505. Available online: https://onlinelibrary.wiley.com/doi/abs/10.1111/jsbm.12154 (accessed on 11 September 2022). [CrossRef]
- Boronat-Navarro, M.; Pérez-Aranda, J.A. Consumers’ perceived corporate social responsibility evaluation and support: The moderating role of consumer information. Tour. Econ. 2019, 25, 613–638. Available online: https://journals.sagepub.com/doi/10.1177/1354816618812297 (accessed on 13 September 2022). [CrossRef]
- Variak, L. CSR reporting of companies on a global scale. Procedia-Soc. Behav. Sci. 2016, 39, 176–183. [Google Scholar]
- McWilliams, A.; Siegel, D. Corporate social responsibility: A theory of the firm perspective. Acad. Manag. Rev. 2001, 26, 117–127. Available online: https://www.jstor.org/stable/259398?origin=crossref#metadata_info_tab_contents (accessed on 10 November 2022). [CrossRef]
- Greening, D.W.; Turban. D.B. Corporate social performance as a competitive advantage in attracting a quality workforce. Bus. Soc. 2000, 39, 254–280. [Google Scholar] [CrossRef]
- Simionescu, L.N.; Dumitrescu, D. Empirical Study toward Corporate Social Responsibility Practices and Company Financial Performance. Evidence for Companies Listed on the Bucharest Stock Exchange. Sustainability 2018, 10, 3141. [Google Scholar] [CrossRef]
- Lee, Y.-J.; Cho, M. Socially stigmatized company’s CSR efforts during the COVID-19 pandemic: The effects of CSR fit and perceived motives. Public Relat. Rev. 2022, 48, 284–289. [Google Scholar] [CrossRef]
- CSR in the Time of Coronavirus: Social Marketing & Corporate Brand. Available online: https://businessforimpact.georgetown.edu/uncategorized/csr-in-the-time-of-coronavirus-social-marketing-corporate-brands (accessed on 25 April 2022).
- Gutierrez, G. COVID-19 Poses New Challenges for Corporate Social Responsibility Efforts. 6 May 2020. Available online: https://www.kcl.ac.uk/news/covid-19-poses-new-challenges-corporate-social-responsibility-efforts#:~:text=Prioritizing%20the%20vulnerable,an%20even%20more%20urgent%20priority (accessed on 4 November 2022).
- Danisch, C. The Relationship of CSR Performance and Voluntary CSR Disclosure Extent in the German DAX Indices. Sustainability 2021, 13, 4904. [Google Scholar] [CrossRef]
- Wen, S.; Zhao, J. The Commons, the Common Good and Extraterritoriality: Seeking Sustainable Global Justice through Corporate Responsibility. Sustainability 2020, 12, 9475. [Google Scholar] [CrossRef]
- Bapuji, H.; Patel, C.; Ertug, G.; Allen, D.G. Corona crisis and inequality: Why management research needs a societal turn. J. Manag. 2020, 46, 1205–1222. [Google Scholar] [CrossRef]
- Fabig, H.; Boele, R. The Changing Nature of NGO Activity in a Globalising World: Pushing the Corporate Responsibility Agenda. IDS Bull. 2009, 30, 58–67. [Google Scholar] [CrossRef]
- Blowfield, M.; Frynas, J.G. Editorial Setting new agendas: Critical perspectives on Corporate Social Responsibility in the developing world. Int. Aff. 2005, 81, 499–513. [Google Scholar] [CrossRef]
- Communication from the Commission to the European Parliament, the Council, the European Economic and Social Committee and the Committee of the Regions. A Renewed EU Strategy 2011-14 for Corporate Social Responsibility /* COM/2011/0681 Final */. Available online: https://eur-lex.europa.eu/legal-content/EN/TXT/HTML/?uri=CELEX:52011DC0681&from=EN (accessed on 4 November 2022).
- Holme, R.; Watts, P. Corporate Social Responsibility: Making Good Business Sense; World Business Council for Sustainable Development: Conches-Geneva, Switzerland, 2000; Available online: https://www.worldcat.org/title/corporate-social-responsibility-making-good-business-sense/oclc/53238304 (accessed on 4 November 2022).
- Directive 2014/95/EU of the European Parliament and of the Council of 22 October 2014 Amending Directive 2013/34/EU as Regards Disclosure of Non-Financial and Diversity Information by Certain Large Undertakings and Groups, Official Journal of the European Union, L330/1. Available online: https://eur-lex.europa.eu/legal-content/EN/TXT/HTML/?uri=CELEX:32014L0095&from=PL (accessed on 4 November 2022).
- Kein, M.; Harford, T. Corporate responsibility: When will voluntary reputation building improve standards? Public Policy J. 2004, 271. Available online: http://www.energytoolbox.org/library/water_utility_corporatization/references/Corporate_Responsibility.pdf (accessed on 4 November 2022).
- How Do Poles Perceive Green Transportation? Available online: https://raportcsr.pl/europejski-dzien-bez-samochodu-jak-polacy-postrzegaja-ekologiczny-transport/ (accessed on 4 November 2022).
- Stawicka, E. Sustainable Business Strategies as an Element Influencing Diffusion on Innovative Solutions in the Field of Renewable Energy Sources. Energies 2021, 14, 5453. [Google Scholar] [CrossRef]
- Svenson, G.; Wood, G.; Callaghan, M. A corporate model of sustainable business practices: An ethical perspective. J. World Bus. 2010, 45, 336–345. [Google Scholar] [CrossRef]
- Steurer, R. The role of governments in corporate social responsibility: Characterizing public policies on CSR in Europe. Policy Sci. 2010, 43, 49–72. Available online: https://www.jstor.org/stable/40586552 (accessed on 4 November 2022). [CrossRef]
- Clarkson, M.B.E. A stakeholder framework for analyzing and evaluating corporate social performance. Acad. Manag. Rev. 1995, 20, 92–117. Available online: https://www.jstor.org/stable/258888#metadata_info_tab_contents (accessed on 4 November 2022). [CrossRef]
- Mitchell, R.K. Toward a Theory of Stakeholder Identification and Salience: Defining the Principle of Who and What Really Counts. Acad. Manag. Rev. 1997, 22, 853–886. [Google Scholar] [CrossRef]
- Cragg, W.; Greenbaum, A. Reasoning about Responsibilities: Mining Company Managers on What Stakeholders are Owed. J. Bus. Ethics 2002, 39, 319–335. Available online: https://ixtheo.de/Record/1785618199 (accessed on 4 November 2022). [CrossRef]
- Frooman, J. Stakeholder Influence Strategies. Acad. Manag. Rev. 1999, 24, 191–205. [Google Scholar] [CrossRef]
- Post, J.E.; Preston, L.E.; Sachs, S. Redefining the Corporation: Stakeholder Management and Organizational Wealth. In Stanford Business Books, 1st ed.; Stanford University Press: Redwood City, CA, USA, 2002. [Google Scholar]
- European Council. Lisbon European Council 23 and 24 March 2000 Presidency Conclusions. Available online: https://www.europarl.europa.eu/summits/lis1_en.htm (accessed on 4 November 2022).
- European Council. Review of the EU Sustainable Development Strategy (EU SDS)—Renewed Strategy 10917/06. Available online: https://data.consilium.europa.eu/doc/document/ST%2010917%202006%20INIT/EN/pdf (accessed on 4 November 2022).
- Dyllick, T.; Hickerts, K. Beyond the business case for corporate sustainability. Bus. Strategy Environ. 2002, 11, 130–141. [Google Scholar] [CrossRef]
- Carroll, A.B.; Shabana, K.M. The business case for corporate social responsibility: A review of concepts, research and practice. Int. J. Manag. Rev. 2010, 12, 85–105. [Google Scholar] [CrossRef]
- Carroll, A.B. The Four Faces of Corporate Citizenship. Bus. Soc. Rev. 2003, 100, 1–7. Available online: https://onlinelibrary.wiley.com/doi/10.1111/0045-3609.00008 (accessed on 4 November 2022). [CrossRef]
- Matten, D.; Moon, J. “Implicit” and “Explicit” CSR: A Conceptual Framework for a Comparative Understanding of Corporate Social Responsibility. Acad. Manag. Rev. 2008, 33, 51–66. [Google Scholar] [CrossRef]
- Eberhard-Harribey, L. Corporate social responsibility as a new paradigm in the European policy: How CSR comes to legitimize the European regulation process. Corp. Gov. Int. J. Bus. Soc. 2006, 6, 358–368. Available online: https://www.emerald.com/insight/content/doi/10.1108/14720700610689487/full/html (accessed on 4 November 2022).
- Smith, N.C. Changes in Corporate Practices in Response to Public Interest Advocacy and Actions. In Handbook of Marketing and Society; Bloom, P.N., Gundlach, G.T., Eds.; Sage Publications, Inc: Thousand Oaks, CA, USA; London, UK; New Delhi, India, 2001; Available online: https://books.google.pl/books?hl=pl&lr=&id=qlPqBu48IvUC&oi=fnd&pg=PR7&dq=Handbook+of+Marketing+and+Society.+Thousand+Oaks,+2001.&ots=G583Vg6M23&sig=jjPg0sVpj7kLSlFdCWdtvJWztKk&redir_esc=y#v=onepage&q=Handbook%20of%20Marketing%20and%20Society.%20Thousand%20Oaks%2C%202001.&f=false (accessed on 4 November 2022).
- Lantos, G.P. The Boundaries of Strategic Corporate Social Responsibility. J. Consum. Mark. 2001, 18, 595–632. [Google Scholar] [CrossRef]
- Husted, B.W.; Allen, D.B. Strategic corporate social responsibility and value creation among large firms: Lessons from the Spanish experience. Long Range Plan. 2007, 40, 594–610. [Google Scholar] [CrossRef]
- Porter, M.E.; Kramer, M.R. Strategy and Society: The Link Between Competitive Advantage and Corporate Social Responsibility. Harv. Bus. Rev. 2006, 84, 78–92. Available online: https://hbr.org/2006/12/strategy-and-society-the-link-between-competitive-advantage-and-corporate-social-responsibility (accessed on 4 November 2022).
- Chandler, D. Strategic Corporate Social Responsibility: Sustainable Value Creation; SAGE Publications, Inc: Thousand Oaks, CA, USA, 2016; Available online: https://www.worldcat.org/title/strategic-corporate-social-responsibility-sustainable-value-creation/oclc/957324862 (accessed on 4 November 2022).
- Heslin, P.A.; Ochoa, J.D. Understanding and developing strategic corporate social responsibility. Organ. Dyn. 2008, 37, 125–144. [Google Scholar] [CrossRef]
- Flammer, C. Does Corporate Social Responsibility Lead to Superior Financial Performance? A Regression Discontinuity Approach. Manag. Sci. 2015, 61, 2549–2568. [Google Scholar] [CrossRef]
- Flammer, C. Competing for government procurement contracts: The role of corporate social responsibility. Strateg. Manag. J. 2018, 39, 1299–1324. [Google Scholar] [CrossRef]
- Flammer, C. Corporate green bonds. J. Financ. Econ. 2021, 142, 499–516. [Google Scholar] [CrossRef]
- Borghesi, R.; Houston, J.F.; Naranjo, A. Corporate socially responsible investments: CEO altruism, reputation, and shareholder interests. J. Corp. Financ. 2014, 26, 164–181. [Google Scholar] [CrossRef]
- Ferrell, A.; Hao, L.; Renneboog, L. Socially responsible firms. J. Financ. Econ. 2016, 122, 585–606. [Google Scholar] [CrossRef]
- Lins, K.V.; Servaes, H.; Tamayo, A. Social Capital, Trust, and Firm Performance: The Value of Corporate Social Responsibility during the Financial Crisis. J. Financ. 2017, 72, 1785–1824. [Google Scholar] [CrossRef]
- Albuquerque, R.; Koskinen, Y.; Zhang, C. Resiliency of Environmental and Social Stocks: An Analysis of the Exogenous COVID-19 Market Crash. Rev. Corp. Financ. Stud. 2020, 9, 593–621. [Google Scholar] [CrossRef]
- Porter, M.E.; Kramer, M.R. Creating Shared Value. In Harvard Business Review; FSG: Boston, MA, USA, 2011; Available online: https://hbr.org/2011/01/the-big-idea-creating-shared-value (accessed on 4 November 2022).
- Peters, J.; Simaens, A. Integrating sustainability into corporate strategy: A case study of the textile and clothing industry. Sustainability 2020, 12, 6125. Available online: https://www.mdpi.com/2071-1050/12/15/6125 (accessed on 4 November 2022). [CrossRef]
- Aarstad, J.; Jakobsen, S.-E. Norwegian firms’ green and new industry strategies: A dual challenge. Sustainability 2020, 12, 361. Available online: https://www.mdpi.com/2071-1050/12/1/361 (accessed on 4 November 2022). [CrossRef]
- Lloret, A. Modeling corporate sustainability strategy. J. Bus. Res. 2016, 69, 418–425. Available online: https://linkinghub.elsevier.com/retrieve/pii/S0148296315002787 (accessed on 4 November 2022). [CrossRef]
- Coombs, W.T.; Holladay, S.J. The negative communication dynamic: Exploring the impact of stakeholder affect on behavioral intentions. J. Commun. Manag. 2007, 11, 300–312. Available online: https://www.emerald.com/insight/content/doi/10.1108/13632540710843913/full/html (accessed on 14 November 2022). [CrossRef]
- Grappi, S.; Romani, S. Company Post-Crisis Communication Strategies and the Psychological Mechanism Underlying Consumer Reactions. J. Public Relat. Res. 2015, 27, 22–45. [Google Scholar] [CrossRef]
- Arpan, L.M.; Roskos-Ewoldsen, D.R. Stealing thunder: Analysis of the effects of proactive disclosure of crisis information. Public Relat. Rev. 2005, 31, 425–433. [Google Scholar] [CrossRef]
- Kim, J.; Kim, H.J.; Cameron, G.T. Making nice may not matter: The interplay of crisis type, response type and crisis issue on perceived organizational responsibility. Public Relat. Rev. 2009, 35, 86–88. [Google Scholar] [CrossRef]
- Ham, C.D.; Kim, J. The effects of CSR communication in corporate crises: Examining the role of dispositional and situational CSR skepticism in context. Public Relat. Rev. 2020, 46, 101792. [Google Scholar] [CrossRef]
- Janssen, C.; Sen, S.; Bhattacharya, C. Corporate crises in the age of corporate social responsibility. Bus. Horiz. 2015, 58, 183–192. [Google Scholar] [CrossRef]
- Burnett, J.J. A strategic approach to managing crises. Public Relat. Rev. 1998, 24, 475–488. Available online: https://www.scopus.com/record/display.uri?eid=2-s2.0-0032325568&origin=inward (accessed on 14 November 2022). [CrossRef]
- Chesbrough, H. To recover faster from COVID-19, open up: Managerial implications from an open innovation perspective. Ind. Mark. Manag. 2020, 88, 410–413. Available online: https://www.sciencedirect.com/science/article/pii/S001985012030300X?via%3Dihub (accessed on 13 September 2022). [CrossRef]
- Renjen, P. The Heart of Resilient Leadership: Responding to COVID-19. A Guide for Senior Executives. Available online: https://www2.deloitte.com/global/en/insights/economy/covid-19/heart-of-resilient-leadership-responding-to-covid-19.html (accessed on 25 April 2022).
- Sohrabi, C.; Alsafi, Z.; O’Neill, N.; Khan, M.; Kerwan, A.; Al-Jabir, A.; Iosifidis, C.; Agha, R. World Health Organization declares global emergency: A review of the 2019 novel coronavirus (COVID-19). Int. J. Surg. 2020, 76, 71–76. [Google Scholar] [CrossRef] [PubMed]
- Burkert, A.; Loeb, A. Flattening the COVID-19 Curves. Social Distancing Imposes Hardships, But it Can Save Many Millions of Lives. Available online: https://blogs.scientificamerican.com/observations/flattening-the-covid-19-curves/ (accessed on 25 April 2022).
- Guidance on Social Distancing for Everyone in the, UK. Available online: https://www.gov.uk/government/publications/covid-19-guidance-on-social-distancing-and-for-vulnerable-people/guidance-on-social-distancing-for-everyone-in-the-uk-and-protecting-older-people-and-vulnerable-adults (accessed on 25 April 2022).
- Donthu, N.; Gustafsson, A. Effects of COVID-19 on business and research. J. Bus. Res. 2020, 117, 284–289. [Google Scholar] [CrossRef] [PubMed]
- Torreggiani, G.; Rosa De Giacomo, M. CSR representation in the public discourse and corporate environmental disclosure strategies in the context of Brexit. A cross-country study of France, Germany, and the United Kingdom. J. Clean. Prod. 2022, 367, 132783. [Google Scholar] [CrossRef]
- Forcadell, F.J.; Aracil, E. A purpose-action framework for Corporate Social Responsibility in times of shock. J. Clean. Prod. 2021, 312, 127789. [Google Scholar] [CrossRef]
- Zhao, J. Reimagining Corporate Social Responsibility in the Era of COVID-19: Embedding Resilience and Promoting Corporate Social Competence. Sustainability 2021, 13, 6548. [Google Scholar] [CrossRef]
- Raynor, M.E. The Strategy Paradox: Why Committing to Success Leads to Failure (And What to Do About It); Crown Business: New York, NY, USA, 2007. [Google Scholar]
- Fighting the Energy Crisis. Available online: https://poland.representation.ec.europa.eu/news/walka-z-kryzysem-energetycznym-2022-10-07_pl (accessed on 18 October 2022).
- Maźkowiak-Pandera, J.; Gawlikowska-Fyk, A. The End of Energy Imports from Russia? Available online: https://www.forum-energii.eu/pl/blog/stop-import-rosja (accessed on 10 October 2022).
- Pawlowski, D. Energy Crisis 2022—Causes, Price Increases. How to Cope? Available online: https://magazynprzedsiebiorcy.pl/kryzys-energetyczny (accessed on 15 October 2022).
- EU Sanctions Against Russia Explained. Available online: https://www.consilium.europa.eu/en/policies/sanctions/restrictive-measures-against-russia-over-ukraine/sanctions-against-russia-explained/ (accessed on 18 October 2022).
- CSO, 2021: Import Dependency = Imports/Domestic Consumption. Available online: https://stat.gov.pl/obszary-tematyczne/srodowisko-energia/energia/energia-2021-folder,1,9.html (accessed on 1 September 2022).
- Kleinschmidt, P.; Maćkowiak-Pandera, J. More Than a Trillion Zlotys for the Import of Energy Resources to Poland. Available online: https://www.forum-energii.eu/pl/blog/import-paliw-kopalnych (accessed on 1 September 2022).
- National Fiscal Policy Responses to the Energy Crisis. Available online: https://www.bruegel.org/dataset/national-policies-shield-consumers-rising-energy-prices (accessed on 1 September 2022).
- More Mining and Imports from Australia, Colombia and the US Will Replace Coal from Russia. Available online: https://cleanerenergy.pl/2022/03/30/wieksze-wydobycie-oraz-import-z-australii-kolumbii-i-usa-zastapia-wegiel-z-rosji/ (accessed on 1 September 2022).
- European Energy Secuity Strategy, Communication from the Commission to the European Parliament and the Council, Com (2014) 330 Final. Available online: https://eur-lex.europa.eu/legal-content/EN/TXT/PDF/?uri=CELEX:52014DC0330&from=EN (accessed on 1 September 2022).
- Electricity and Gas Prices Are Hitting Businesses. The Entire Revenue Is Not Even Enough for One Bill. Available online: https://www.money.pl/gospodarka/ceny-pradu-i-gazu-uderzaja-w-firmy-caly-utarg-nie-starczy-nawet-na-jeden-rachunek-6807658764052992a.html (accessed on 1 September 2022).
- What to Know (and Do) About the UK’s Rising Energy Costs. Available online: https://www.entrepreneur.com/en-gb/business-news/what-to-know-and-do-about-the-uks-rising-energy-costs/435331 (accessed on 1 September 2022).
- Croatian Entrepreneurs Urge Government Action as Power Bills Triple. Available online: https://balkangreenenergynews.com/croatian-entrepreneurs-urge-government-action-as-power-bills-triple/ (accessed on 1 September 2022).
- Business Energy Prices to Be Cut by Half Expected Levels. Available online: https://www.bbc.com/news/business-62969427 (accessed on 1 September 2022).
- Electricity Prices Are Striking. Companies Will Raise Rates or Go Bankrupt. Available online: https://www.rp.pl/finanse/art36996211-ceny-pradu-porazaja-firmy-podniosa-stawki-albo-upadna (accessed on 5 September 2022).
- The Lancet. Redefining Vulnerability in the Era of COVID-19. Lancet 2020, 395, 1089. Available online: https://www.thelancet.com/journals/lancet/article/PIIS0140-6736(20)30757-1/fulltext (accessed on 10 November 2022). [CrossRef]
- de Jong, M.D.T.; van der Meer, M. How Does It Fit? Exploring the Congruence Between Organizations and Their Corporate Social Responsibility (CSR) Activities. J. Bus. Ethics 2017, 143, 71–83. [Google Scholar] [CrossRef]
- Mott MacDonald. Available online: https://www.mottmac.com/views/adapting-corporate-social-responsibility-to-covid-19 (accessed on 25 April 2022).
- Kacprzak, M.; Milewska, A.; Kacprzak, A.; Król, A. Corporate Social Responsibility in the Era of the COVID-19 Pandemic on the Example of Companies from Poland, Belgium, and Ukraine. Eur. Res. Stud. J. 2021, 24, 547–562. [Google Scholar] [CrossRef]
- Sankar, C. 3 Ways Companies Have Shown Corporate Social Responsibility during the Pandemic. Available online: https://www.inc.com/carol-sankar/3-ways-companies-have-shown-corporate-social-responsibility-during-pandemic.html (accessed on 25 April 2022).
- Courier Asks: #Stayathome. Available online: https://youtu.be/gHAXPAPt5YE (accessed on 14 November 2022).
- Adamska-Cieśla, E. New dimension of CSR-pandemic verifies existing strategies. Marketer+ 2020, 6, 18–21. [Google Scholar]
- Edelman Trust Barometer. Available online: https://www.edelman.com/sites/g/files/aatuss191/files/2021-04/2021%20Edelman%20Trust%20Barometer%20Trust%20in%20Financial%20Services%20Global%20Report_website%20version.pdf (accessed on 14 November 2022).
- Responsible Business in Poland. Good Practices, Responsible Business Forum, Report 2017. 2017. Available online: https://odpowiedzialnybiznes.pl/wp-content/uploads/2018/04/Raport2017-1.pdf (accessed on 25 April 2022).
- Cohen, J. Statistical Power Analysis for the Behavioral Sciences, 2nd ed.; Routledge: New York, NY, USA, 1998; Available online: https://www.utstat.toronto.edu/~brunner/oldclass/378f16/readings/CohenPower.pdf (accessed on 14 November 2022).
- Field, A. Discovering Statistics Using IBM SPSS Statistics, 4th ed.; Sage Publications Ltd.: Thousand Oaks, CA, USA, 2013; Available online: https://in.sagepub.com/en-in/sas/discovering-statistics-using-ibm-spss-statistics/book238032 (accessed on 14 November 2022).
- R Core Team R: A Language and Environment for Statistical Computing. R Foundation for Statistical Computing, Vienna, Austria. 2021. Available online: https://www.R-project.org (accessed on 14 November 2022).
- Ben-Shachar, M.S.; Lüdecke, D.; Makowski, D. Effectsize: Estimation of Effect Size Indices and Standardized Parameters. J. Open Source Softw. 2020, 5, 2815. Available online: https://joss.theoj.org/papers/10.21105/joss.02815 (accessed on 14 November 2022). [CrossRef]
- Kassambara, A. Rstatix: Pipe-Friendly Framework for Basic Statistical Tests. R Package Version 0.7.0. 2021. Available online: https://CRAN.R-project.org/package=rstatix (accessed on 14 November 2022).
- Lüdecke, D. Sjplot: Data Visualization for Statistics in Social Science. R Package Version 2.8.10. 2021. Available online: https://CRAN.R-project.org/package=sjPlot (accessed on 14 November 2022).
- Makowski, D.; Ben-Shachar, M.; Patil, I.; Lüdecke, D. Automated Results Reporting as a Practical Tool to Improve Reproducibility and Methodological Best Practices Adoption. 2021 CRAN. Available online: https://github.com/easystats/report (accessed on 14 November 2022).
- Patil, I. Visualizations with statistical details: The ‘ggstatsplot’ approach. J. Open Source Softw. 2021, 6, 3167. [Google Scholar] [CrossRef]
- Revelle, W. Psych: Procedures for Psychological, Psychometric, and Personality Research. Northwestern University, Evanston, Illinois, 2021. R Package Version 2.1.6. Available online: https://CRAN.R-project.org/package=psych (accessed on 14 November 2022).
- Wickham, H. Ggplot2: Elegant Graphics for Data Analysis; Springer: New York, NY, USA, 2016; Available online: https://ggplot2.tidyverse.org (accessed on 14 November 2022).
- CSR Report 2019 Raben Group. Available online: https://pl-api.raben-group.com/fileadmin/user_upload/Raport_Zrownowazonego_Rozwoju_2019.pdf (accessed on 6 September 2022).
- CSR Report 2020 Raben Group. Available online: https://pl-api.raben-group.com/fileadmin/user_upload/Raport_Zrownowazonego_Rozwoju_2020.pdf (accessed on 6 September 2022).
- CSR Report 2021 Raben Group. Available online: https://pl-api.raben-group.com/fileadmin/CSR/RABEN_Sustainability_Report_2021_vPL_FINAL.pdf (accessed on 6 September 2022).
- Report on the Activities of the Board of Directors for the Year of 2019 the Company Raben. Available online: https://ekrs.ms.gov.pl/rdf/pd/search_df (accessed on 6 September 2022).
- Report on the Activities of the Board of Directors for the Year of 2020 the Company Raben. Available online: https://ekrs.ms.gov.pl/rdf/pd/search_df (accessed on 6 September 2022).
- Report on the Activities of the Board of Directors for the Year of 2021 the Company Raben. Available online: https://ekrs.ms.gov.pl/rdf/pd/search_df (accessed on 6 September 2022).
- CSR Report 2019–2020 DB Schenker. Available online: https://www.dbschenker.com/resource/blob/738080/7c3130fa8025f3321a02265710d35434/raport-zrównoważonego-rozwoju-2019-2020-data.pdf (accessed on 6 September 2022).
- Report on the Activities of the Board of Directors for the Year of 2019 the Company Schenker. Available online: https://ekrs.ms.gov.pl/rdf/pd/search_df (accessed on 6 September 2022).
- Report on the Activities of the Board of Directors for the Year of 2020 the Company Schenker. Available online: https://ekrs.ms.gov.pl/rdf/pd/search_df (accessed on 6 September 2022).
- Report on the Activities of the Board of Directors for the Year of 2021 the Company Schenker. Available online: https://ekrs.ms.gov.pl/rdf/pd/search_df (accessed on 6 September 2022).
- CSR Report 2019 DVS. Available online: https://docs.dsv.com/group/group-compliance/responsibility-report-2019/?page=2 (accessed on 6 September 2022).
- CSR Report 2020 DVS. Available online: https://docs.dsv.com/group/group-compliance/corporate-responsibility-report-2020/?_ga=2.95128474.762161064.1666636775-1967800165.1666276763&_gl=1*1mh4zbo*_ga*MTk2NzgwMDE2NS4xNjY2Mjc2NzYz*_ga_2DYYPJ3BGM*MTY2NjYzNjc3NC4yLjEuMTY2NjYzNjk1Ny4wLjAuMA (accessed on 6 September 2022).
- CSR Report 2021 DVS. Available online: https://docs.dsv.com/group/group-compliance/corporate-sustainability-report-2021/?_ga=2.95128474.762161064.1666636775-1967800165.1666276763&_gl=1*1mh4zbo*_ga*MTk2NzgwMDE2NS4xNjY2Mjc2NzYz*_ga_2DYYPJ3BGM*MTY2NjYzNjc3NC4yLjEuMTY2NjYzNjk1Ny4wLjAuMA (accessed on 6 September 2022).
- Report on the Activities of the Board of Directors for the Year of 2020 the Company DSV. Available online: https://ekrs.ms.gov.pl/rdf/pd/search_df (accessed on 6 September 2022).
- Report on the Activities of the Board of Directors for the Year of 2021 the Company DSV. Available online: https://ekrs.ms.gov.pl/rdf/pd/search_df (accessed on 6 September 2022).
- Financial Statement, Raben of 2019. Available online: https://ekrs.ms.gov.pl/rdf/pd/search_df (accessed on 6 September 2022).
- Financial Statement, Raben of 2020. Available online: https://ekrs.ms.gov.pl/rdf/pd/search_df (accessed on 6 September 2022).
- Financial Statement, Raben of 2021. Available online: https://ekrs.ms.gov.pl/rdf/pd/search_df (accessed on 6 September 2022).
- Financial Statement, Schenker of 2019. Available online: https://ekrs.ms.gov.pl/rdf/pd/search_df (accessed on 6 September 2022).
- Financial Statement, Schenker of 2020. Available online: https://ekrs.ms.gov.pl/rdf/pd/search_df (accessed on 6 September 2022).
- Financial Statement, Schenker of 2021. Available online: https://ekrs.ms.gov.pl/rdf/pd/search_df (accessed on 6 September 2022).
- Financial Statement, DSV of 2019. Available online: https://ekrs.ms.gov.pl/rdf/pd/search_df (accessed on 6 September 2022).
- Financial Statement, DSV of 2020. Available online: https://ekrs.ms.gov.pl/rdf/pd/search_df (accessed on 6 September 2022).
- Financial Statement, DSV of 2021. Available online: https://ekrs.ms.gov.pl/rdf/pd/search_df (accessed on 6 September 2022).
- Financial Statement, Raben of 2018. Available online: https://ekrs.ms.gov.pl/rdf/pd/search_df (accessed on 6 September 2022).
- Financial Statement, Raben of 2017. Available online: https://ekrs.ms.gov.pl/rdf/pd/search_df (accessed on 6 September 2022).
- Financial Statement, Schenker of 2018. Available online: https://ekrs.ms.gov.pl/rdf/pd/search_df (accessed on 6 September 2022).
- Financial Statement, Schenker of 2017. Available online: https://ekrs.ms.gov.pl/rdf/pd/search_df (accessed on 6 September 2022).
- Financial Statement, DSV of 2018. Available online: https://ekrs.ms.gov.pl/rdf/pd/search_df (accessed on 6 September 2022).
- Financial Statement, DSV of 2017. Available online: https://ekrs.ms.gov.pl/rdf/pd/search_df (accessed on 6 September 2022).
- Benchmarking Transfer Pricing Benchmarking Analysis 2017–2021.
- Skare, M.; Golja, T. The impact of government CSR supporting policies on economic growth. J. Policy Model. 2014, 36, 562–577. Available online: https://reader.elsevier.com/reader/sd/pii/S0161893814000192?token=01CBB43E3381F12CDD65E9EC25F271DED7B0F82A7E4EE45ACB6BE32D6D5C1C9A8313E1D62E4FA51281180347BA3B2188&originRegion=eu-west-1&originCreation=20221120091937 (accessed on 20 November 2022). [CrossRef]
- Navarro Espigares, J.L. Responsabilidad social corporativa y crecimiento económico. Estud. Econ. Apl. 2006, 24, 637–638. Available online: https://www.scopus.com/record/display.uri?eid=2-s2.0-84890169173&origin=inward (accessed on 20 November 2022).
- Magno, F.; Cassia, F. Effects of agritourism businesses’ strategies to cope with the COVID-19 crisis: The key role of corporate social responsibility (CSR) behaviours. J. Clean. Prod. 2021, 325, 129292. Available online: https://reader.elsevier.com/reader/sd/pii/S0959652621034776?token=6768EB979ABD5EFD64576E8C54EC192F289E63BD0D3A221BEF57F3094E10B87B74CD2D98110AF0EFEC4E02F8ADA9D20C&originRegion=eu-west-1&originCreation=20221120092932 (accessed on 20 November 2022). [CrossRef]
- Scott, N.; Laws, E. Tourism Crises and Disasters: Enhancing Understanding of System Effects. J. Travel Tour. Mark. 2006, 19, 149–158. Available online: https://www.tandfonline.com/doi/abs/10.1300/J073v19n02_12 (accessed on 20 November 2022). [CrossRef]
- Scott, N.; Laws, E. Tourism Crises and Marketing Recovery Strategies. J. Travel Tour. Mark. 2008, 23, 1–13. Available online: https://www.tandfonline.com/doi/abs/10.1300/J073v23n02_01 (accessed on 20 November 2022). [CrossRef]
- Alonso-Almeida, M.M.; Bremser, K. Strategic responses of the Spanish hospitality sector to the financial crisis. Int. J. Hosp. Manag. 2013, 32, 141–148. Available online: https://www.sciencedirect.com/science/article/pii/S0278431912000655 (accessed on 20 November 2022). [CrossRef]
- Gossling, S.; Scott, D.; Hall, C.M. Pandemics, tourism and global change: A rapid assessment of COVID-19. J. Sustain. Tour. 2020, 29, 1–20. Available online: https://www.scopus.com/record/display.uri?eid=2-s2.0-85089501412&origin=inward (accessed on 20 November 2022). [CrossRef]


Publisher’s Note: MDPI stays neutral with regard to jurisdictional claims in published maps and institutional affiliations. |
© 2022 by the author. Licensee MDPI, Basel, Switzerland. This article is an open access article distributed under the terms and conditions of the Creative Commons Attribution (CC BY) license (https://creativecommons.org/licenses/by/4.0/).