Article

Application of LSTM Approach for Predicting the Fission Swelling Behavior within a CERCER Composite Fuel

1
School of Aerospace Engineering and Applied Mechanics, Tongji University, Shanghai 200092, China
2
Department of Aeronautics and Astronautics, Fudan University, Shanghai 200433, China
*
Authors to whom correspondence should be addressed.
Energies 2022, 15(23), 9053; https://doi.org/10.3390/en15239053
Submission received: 8 November 2022 / Revised: 25 November 2022 / Accepted: 27 November 2022 / Published: 29 November 2022

Abstract

:
Irradiation-induced swelling plays a key role in determining fuel performance. Due to their high cost and time demands, experimental research methods are ineffective. Knowledge-based multiscale simulations are also constrained by the loss of trustworthy theoretical underpinnings. This work presents a new trial of integrating knowledge-based finite element analysis (FEA) with a data-driven deep learning framework, to predict the hydrostatic-pressure–temperature dependent fission swelling behavior within a CERCER composite fuel. We employed the long short-term memory (LSTM) deep learning network to mimic the history-dependent behaviors. Training of the LSTM is achieved by processing the sequential order of the inputs to do the forecasting; the input features are fission rate, fission density, temperature, and hydrostatic pressure. We performed the model training based on a leveraged dataset of 8000 combinations of a wide range of input states and state evaluations that were generated by high-fidelity simulations. When replicating the swelling plots, the trained LSTM deep learning model exhibits outstanding prediction effectiveness. For various input variables, the model successfully pinpoints when recrystallization first occurs. The preliminary study for model interpretation suggests providing quantified insights into how those features affect solid and gaseous portions of swelling. The study demonstrates the efficacy of combining data-driven and knowledge-based modeling techniques to assess irradiation-induced fuel performance and enhance future design.

1. Introduction

Nuclear fuel elements are the key components of nuclear reactors, which undergo extreme environments of extreme heat, high pressure, and strong irradiation dose in reactors [1,2]. Damage effects caused by irradiation, such as hardening, creep, and swelling, result in complicated thermo-mechanical coupled behaviors in fuel elements. Irradiation-induced swelling is one of the most critical factors affecting the in-pile structural integrity and dimensional stability of U O 2 nuclear fuels [3,4].
Swelling [5,6] originates from the generation and accumulation from fission products of solid and gas species as the irradiation proceeds. Fission solid products grow proportional to burnup (a measure of the number of fission events that have occurred, also used as a measurement of the history of the material) [7]. The accumulation of gas swelling is an inherent, complex, and multiscale process that involves recrystallization with diffusion and precipitation of xenon (Xe) and kerypton (Kr), and intergranular gas atom re-solution effects in fission gas bubbles [7,8,9]. At the microscale, recrystallization favors the creation of grain borders greatly, improving their capacity to accommodate additional gas atoms and resulting in the formation of huge intergranular bubbles [7]. At the mesoscale, the bubbles make the fuels more porous [10], which causes substantial fission gas swelling deformation and a decrease in heat conductivity [11,12].
It is critical to predict the swelling behavior with reliable precision, to provide sufficient operating margin for the range of reactor operating conditions [4,13]. Experiments excel at identifying the best approximation model for irradiation damage assessment, but the resource-intensive method can be extremely costly, time-consuming, and difficult for online tracking [14]. For tackling gas swelling behaviors, multiscale modeling and simulation methods have been explored extensively with mechanistic models [7,10], with the first formulation dating back to 1957 by Booth [15]. Those models are typically rooted in several spatially-independent partial differential equations (PDEs) [16,17], focusing on comprehensively probing the fundamentals and physical mechanisms of the recrystallized swelling process. With the rapid advancement of high-performance computers, there are a few publications devoted to computational examination of swelling behavior using finite element analysis (FEA) [18,19,20,21], molecular dynamics [22], and phase-field simulations [23]. By using a high fidelity mechanistic model [9], Zhao et al. [11,24,25] investigated the swelling evolution of CERCER ( U O 2 inclusions in MgO matrix) composite fuel inside an ADS (Accelerator Driven System) subreactor. The parametric study [11] evaluated four leading influencing parameters: fission rate, irradiation dose, temperature, and hydrostatic pressure. However, knowledge-based multiscale modeling alone is incapable of efficiently combining large datasets from various sources and levels of service conditions, severely limiting its ability to accurately predict fuel behavior under a variety of conditions.
In recent years, the data-driven approach of machine learning (ML), especially deep neural networks, has increasingly attracted attention in the fields of computational mechanics [26]. The data-driven technique makes use of neural networks to discover connections between intertwined phenomena and showcases strong power for quickly predicting material behavior that requires intensive calculations [26,27]. The representativeness of the labeled data and the choice of neural networks have a significant impact on the predictive power. Multiscale modeling naturally complements the ML approach by supplying big, reasonable data, which benefits constructing reliable and robust predictive models [28,29]. The integration mode has been applied in research on nuclear materials [30], such as detecting fuel pin diversion [31], exploring high-temperature properties [32], and predicting the spend fuel parameters [33]. However, in contrast to modeling attempts, the usage of ML method for swelling behavior investigation is still very limited. Miao et al. [14] applied the gradient boosting ensemble method to predict experimental onset doses for swelling in test datasets. Cai et al. [34] utilized an image data-driven machine learning approach for advanced post-irradiation examination and used the decision tree algorithm to derive the features of gas swelling. The adopted feed-forward neural networks (FFNN) have great trouble dealing with the complicated time history response and thus cannot comprehensively track the history-dependent nature of swelling evolution.
Recurrent neural networks (RNN), using recurrent links among hidden layers, have been shown to be a promising approach to dealing with history-related problems [35]. Long short-term memory (LSTM) is an enhanced RNN with gates that can learn both the long-term and short-term affects of the prior data, according to [36,37]. This technique has been used to quickly anticipate the time history response of dynamical systems [38,39], model the material constitutive behavior [40], and forecast plastic deformation [35,41,42]. The LSTM is an obvious choice for this application since it can successfully learn from data with long-range temporal relationships.
This work we aimed to explore the capability of data-driven machine learning to forecast the hydrostatic-pressure-temperature dependent fission swelling behavior in U O 2 nuclear fuels. The structure of the work is as follows: The multiscale modeling framework and the LSTM deep learning configuration are described in the Method section. The sequential training data used in this research were gathered through knowledge-based multiscale simulations of CERCER composite fuel pellets in ADS in order to attain accuracy under a variety of situations. The prediction model’s findings are shown in Section 3, where we evaluated the prediction accuracy and efficiency to assess the model performance of the trained LSTM deep learning model. We covered the constraints and the prospects of this work in Section 4.

2. Method

2.1. Integration Mode of Multiscale Modeling and Machine Learning

Multiscale modeling employs knowledge-based theories and can intuitively probe the underlying mechanisms, whereas ML discovers mapping correlation and quantifies uncertainties. Figure 1 depicts the common procedures in the application of integrating multiscale modeling with a machine learning approach. “Ground truth values” refers to the data that were retrieved from simulations and later divided into two separate subsets, training data and validation data. The weights for each epoch must be changed, and the loss function must be minimized, while the deep learning model is being trained using training data to fit a high-quality model. The fitted model is used to predict the responses for the observations in the validation set and to examine its reliability.

2.2. Knowledge-Based Multiscale Modeling

The diffusion equation, the thermal conductivity equation, and the constitutive relationship for multiscale thermo-mechanical problems [18,43] are the governing equations for the concerned problem. Our previous works [11,18,24] well addressed the development of theories and how we translated those theories into methods and algorithms to implement the multiscale modeling. Modeling and FE analysis revealed that the service conditions of fission rate f ˙ [ fission / m 3 s ], irradiation dosage F d [ fission / m 3 ] temperature T [K], and hydrostatic pressure P h [MPa] are strongly related to swelling with recrystallization, as shown in Figure 1. The loading parameters of fission rate and irradiation dosage record the service process, which can be measured as burnup or fission density. The former specifies the reactor settings.
We used the fission density F d , which can be calculated explicitly as
F d = f ˙ × t
where t [s] denotes irradiation time.
The solid swelling portion (noted as θ s s w in Figure 1) is also determined by fission density, and the empirical model is written as follows [7]:
θ s s w = 2.5 × 10 29 × F d
When the fission density reaches a particular level, recrystallization starts, and gas swelling (denoted by θ g s w in Figure 1) speeds up. The critical fission density, F d c r , is proportional to the fission rate, and the expression is written as follows:
F d c r = 4 × 10 24 ( f ˙ ) 2 / 15
On the other hand, temperature T and hydrostatic pressure P h are physical parameters that affect the gas swelling process and can only be extracted implicitly through simulations. The mechanistic model that describes gas swelling behavior has been well elaborated in our previous studies [11,29,43]. Here, we only briefly summarized the methodology to design, implement, and execute the simulations of in-pile behavior in CERCER composite fuel.
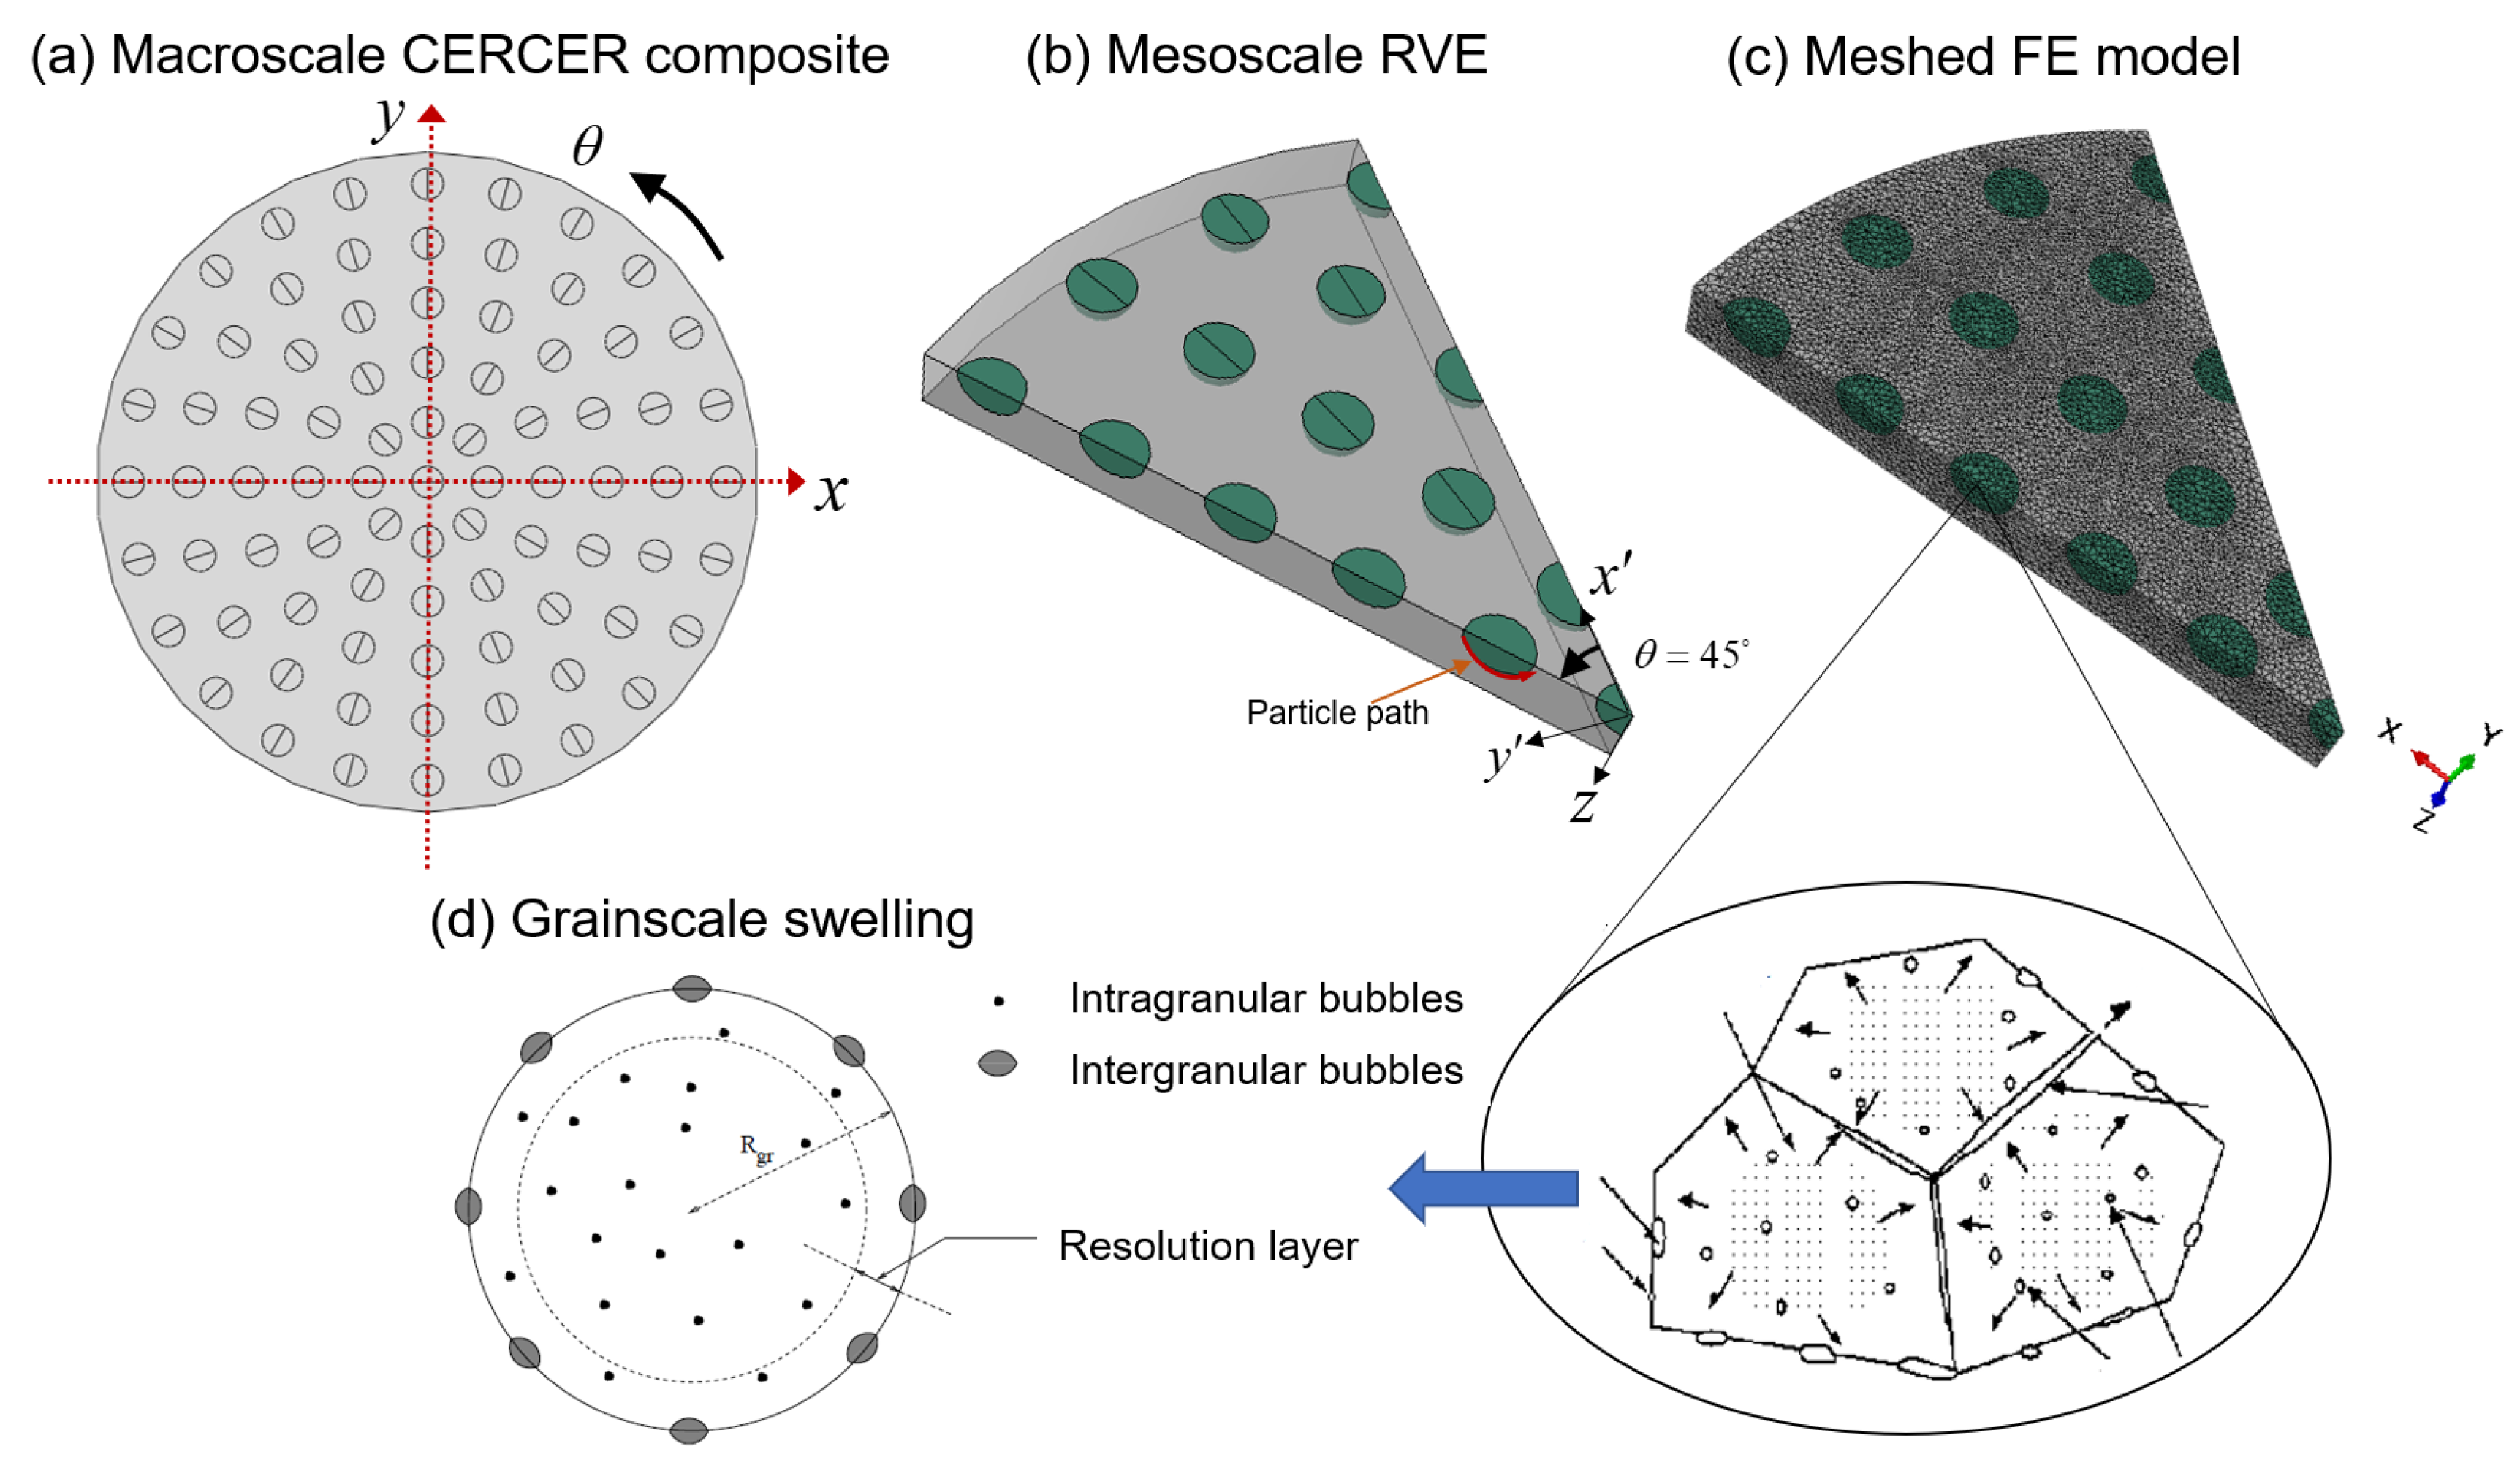
Figure 2 depicts an idealized composite fuel pellet in a fast neutron reactor, in which the spherical U O 2 particles are assumed to be periodically arranged in the MgO matrix. With a pellet radius of 4.15 mm and a particle radius of 200 μm, this configuration expresses a particle volumetric of 6.23%. The mesoscale RVE model in Figure 2b represents the eighth portion of Figure 2a, and the imposed mechanical and thermal boundary conditions and constraints can be found in [24]. With applying the 10-node thermally coupled modified quadratic tetrahedron elements of C3D10MT, the RVE model is discretized into 151,598 nodes, as in Figure 2c. Figure 2d illustrates the numerical calculation for each integration point within the RVE model. The mesocale volumetric swelling incorporates grain-scale swelling information governed by recrystallization progress.
To handle the large-strain kinematics, i.e., geometric nonlinearities, we proposed the stress–update algorithm with constitutive relations in an incremental form under a rotational coordinate system, which can be obtained as [43,44]
Δ σ i j = σ i j t + Δ t σ i j t = 2 G ( T + Δ T , t + Δ t ) Δ ε i j e + λ ( T + Δ T , t + Δ t ) Δ ε k k e δ i j + 2 G ε i j e ( t ) + Δ λ ε k k e ( t ) δ i j
where Δ σ i j are the stress increments and Δ ε i j e are the elastic logarithmic strain increments, while Δ G and Δ λ are the increments of the Lame coefficients.
The total strain increments ε i j t o t a l consist of the elastic ones ε i j e , the thermal expansion ones ε i j t h , the irradiation swelling ones ε i j s w , the plastic ones ε i j p , and the logarithmic elastic strain increments ε i j e read as
Δ ε i j e = Δ ε i j t o t a l Δ ε i j t h Δ ε i j s w Δ ε i j p
The above equations represent the constitutive relations. In Ref. [44], the crucial mesoscale and grainscale swelling model with recrystallization effects is described. The algorithms are programmed as fuel performance codes of the UMAT and UMATHT subroutines and implemented all the simulations in ABAQUS. In 23 analytical stages across the simulations, we took into account a total irradiation period of 230 days. The burnup stage is covered by the raw data produced by simulations from the beginning (0.001) to 230 days. The swelling plot (the volumetric swelling strain vs. irradiation time) for each chosen integration point has about 400 data points because each step has roughly 20 time increments. Thus, the concerned swelling values of θ t s w and θ g s w of each integration point can be extracted, along with the associated key influencing variables of fission rate ( f ˙ ), fission density ( F d ), temperature (T), and hydrostatic pressure ( P h ).
The composite configuration of RVE in Figure 2 results in unevenly distributed fields of temperature and hydrostatic pressure. Thus, the ground truth results from different integration points are the keys to constructing a large, accurate, and reasonable dataset. Furthermore, the parametric study [24] took into account three different fission rates as f 1 = 1.25 × 10 20 [ fission / m 3 s ], f 2 = 2.5 × 10 20 [ fission / m 3 s ], and f 3 = 3.0 × 10 20 [ fission / m 3 s ], which benefits the dataset construction with a high level of diversification and completeness.
It takes 60 h to complete all the simulations on 60 CPU cores.

2.3. Data-Driven LSTM Deep Learning Scheme

LSTM networks are recurrent neural networks that can learn order dependence in sequence prediction problems. It employs a series of gates to control how information in a data sequence enters, is stored in, and exits the network. The typical LSTM unit usually contains an input gate, an output gate, a forget gate, a unit input, and a cell state [36]. These gates collaborate to control the units’ ability to learn or forget specific information from temporal data.
Figure 3 depicts the general deep learning framework with feedback neural network architectures with LSTM cells. In Figure 3a, the deep learning scheme includes one input layer, several hidden layers, and one output layer, which maps four input features of [ f ˙ , F d , T, P h ] to two output features [ θ t s w ( t + Δ t ) θ g s w ( t + Δ t ) ]. It is worth noting that the predicted values are returned to the input layer and used to predict the next time step.
In Figure 3b, N is the batch size, H i n is the input size that corresponds to the four input features ([ f ˙ , F d , T, P h ]); L is the sequence length; C 0 is the initial cell state, h 0 is an initial hidden state (which is initialized as zeros at first), and n u m l a y e r s is the number of LSTM layer. Therefore, the input data should be shaped as a three-dimensional matrix that reflects the state variables (features) and their evolution (sequential length). FC is the fully connected layer that exports predicted total volumetric swelling and gas swelling variables [ θ t s w , θ g s w ].
The predicted values of θ t s w ( t ) and θ g s w ( t ) at time t can be used in the loop to predict [ θ t s w ( t + Δ t ) , θ g s w ( t + Δ t ) ] at t + Δ t , as shown in Figure 3b.

2.4. Model Training and Evaluation

We collected 8000 sequential data points, 70% of which were used for training and 30% for validation. The length of the sequence ranges from 70 to 100. We first standardized the inputs and outputs before feeding them to the neural network. For each feature denoted by X, we used the following linear operation [45], which is expressed as
X ̲ = X X m X s ,
with
X m = X min + X max 2 and X s = X max X min 2
where X m a x and X m i n are the maximum and minimum values of the features among all the processed data used for training. The min-max normalization scales all features in a fixed range between 0 and 1 but does not change the distribution of the features.
We used accuracy as the evaluation metric to comprehensively quantify the LSTM predictor, with the coefficient of determination R 2 and Mean Squared Error (MSE) computed as [46]
R 2 = i N Y i Y ^ i 2 i N Y i Y ¯ 2
M S E = 1 N i = 1 N Y i Y ^ i 2
where i denotes the i-th set of input vectors, and N is the number of training or validation samples. Y i is the vector of actual values of the inputs being predicted, with Y ^ i being the predicted outputs, and Y ¯ is the averaged value for the trained samples.
We built and trained the neural networks based on the Keras TensorFlow package in Python [47]. Since the LSTM model directly outputs the predicted total swelling θ t s w and gas swelling θ g s w (as shown in Figure 3b), the solid swelling can be predicted by θ s s w = θ t s w θ g s w .

3. Results and Discussion

3.1. Evaluation of the Data-Driven Model

We trained the deep learning network based on the strategy of hyperparameter optimization (weights and bias) by implementing back-propagation errors. The trained model is finalized with three LSTM layers, each one with 60 nodes, and one fully connected layer. The LSTM deep learning scheme computes in about 130 s.
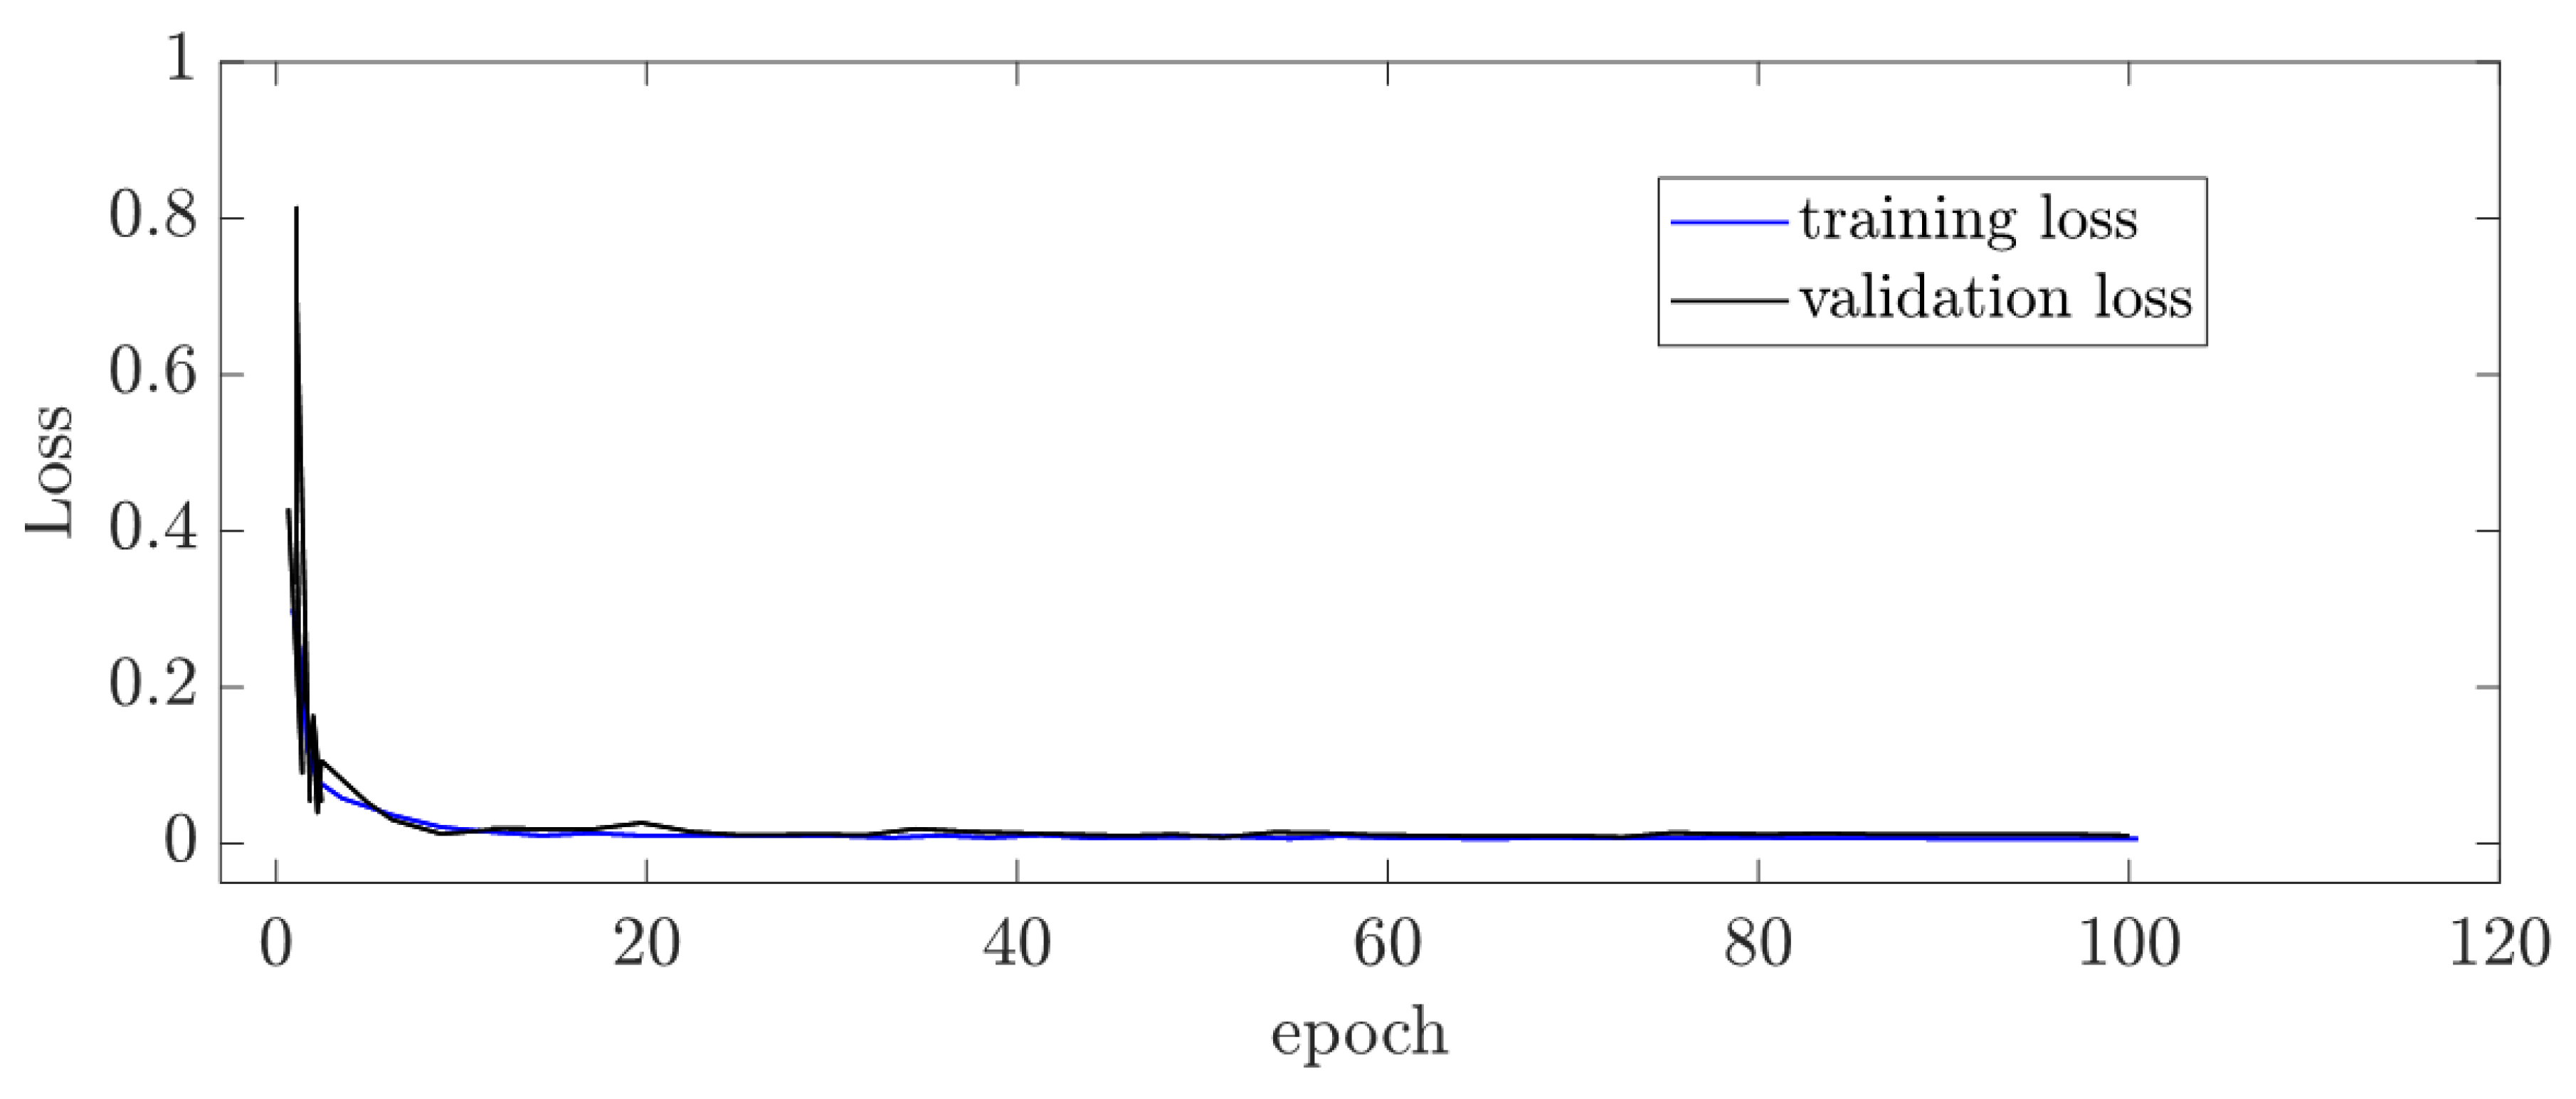
Figure 4 first draws the learning curves of training loss and validation loss that are computed from the loss function. The plots decrease drastically and remain stable after 10 epochs, indicating that the model has a good performance on both training and validation datasets.
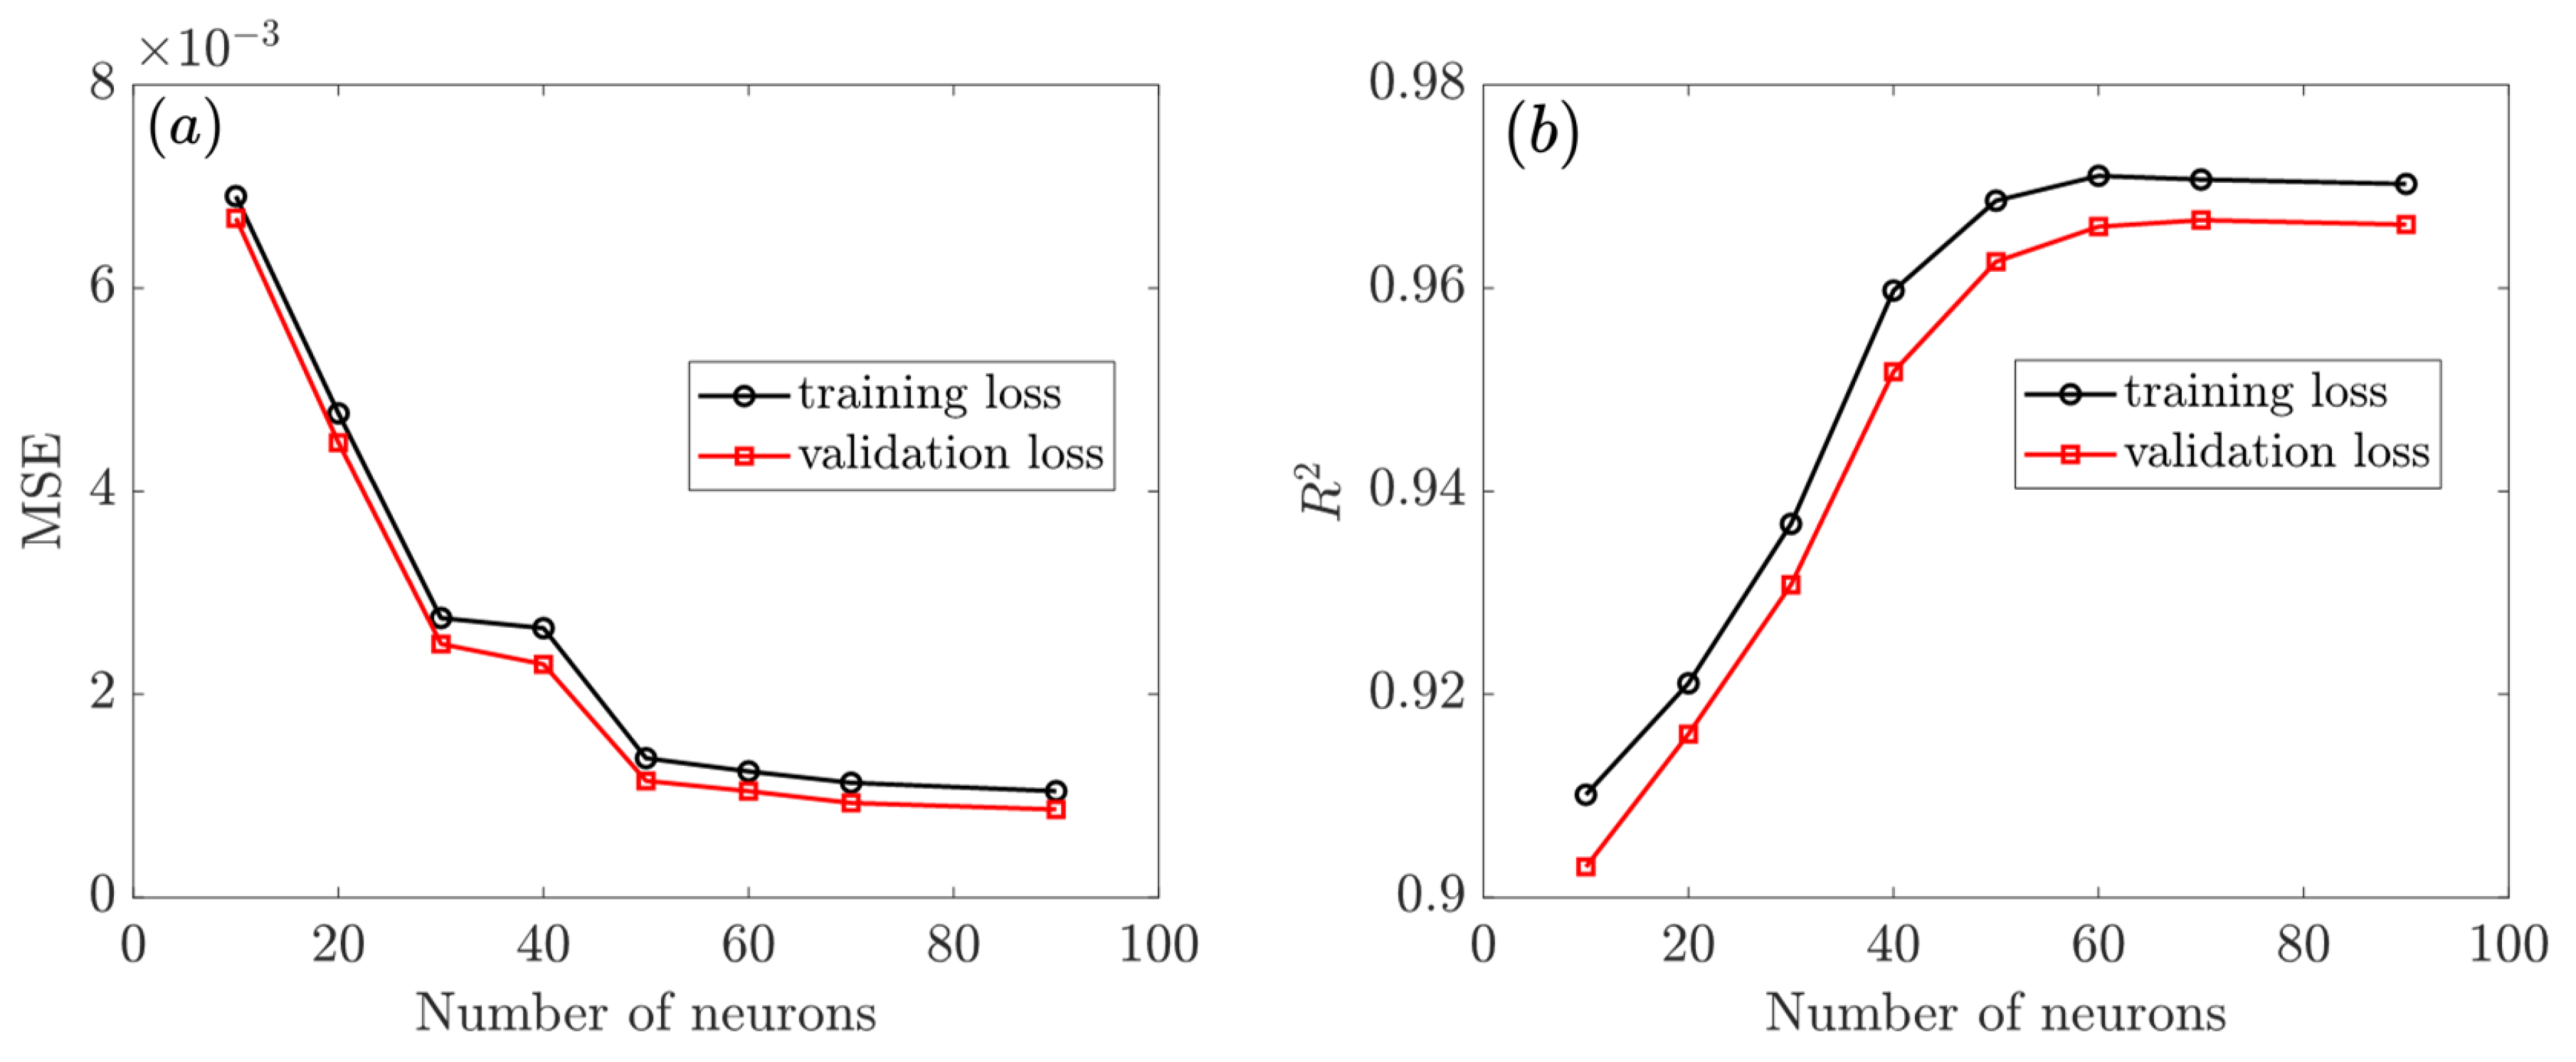
On the basis of a three-layered LSTM structure, Figure 5 investigates the MSE and R 2 plots with respect to a varying number of neutrons. The increased neuron number favors achieving a lower MSE value and a higher R 2 value for both training and validation datasets, implying that the model is capable of further learning and possible improvements.
For both training and validation datasets, it is observed that the increased neuron number favors achieving a lower MSE value and a higher R 2 value, implying that the model is capable of further learning and possible further improvements. However, when neuron equals to 60, the MSE value (in Figure 5a) for the validation dataset starts to converge, indicating that the model has stopped learning, and no improvement will be achieved beyond this neuron level. Figure 5b discovers a similar phenomenon for R 2 value, as no significant improvement in the R 2 values could be expected with neurons higher than 60. As a result, we optimized the LSTM layers with 60 neurons, with MSE achieving 1.7 × 10 3 and R 2 reaching as high as 0.97.

3.2. Predictions from the Data-Driven Model

We generated an LSTM deep learning model that can take [ f ˙ , F d , P h , T] as input and produced [ θ t s w , θ g s w ] as output. Figure 6 compares the LSTM predicted plots of total swelling θ t s w , gas swelling θ g s w , and solid swelling θ s s w with the ground truth values from FE simulations for the validation dataset to assess model efficiency.
In general, the trained LSTM model has excellent validation performance, as predicted results are in close agreement with the simulated swelling portions. The model accurately depicts the evolution trends in which total swelling θ t s w accelerates after recrystallization, with the critical fission density corresponding to 98.7 days of irradiation time. It is worth noting that the average R 2 for general total swelling is around 0.94, whereas the plot comparison reveals a high R 2 value in excess of 0.98 for swelling fraction θ s s w and a significantly lower R 2 of 0.91 for gas swelling θ g s w .
Figure 7 further reports the predictions of solid swelling and gas swelling with consideration of three varied fission rates. In Figure 7a, the model also produces the evolution of solid swelling with very high precision. It implies that the model has a good fit in mapping the linear relationship between solid swelling and irradiation dose. Furthermore, the LSTM model successfully identifies the input loading parameters of fission rate f ˙ and fission density F d as two key features for solid swelling θ g s w , as the gradients are calculated the same in Equation (2).
With regard to the gas swelling in Figure 7b, we observed comparably lower precision with increased irradiation dose, with the calculated R 2 falling from 0.98 at 46 days to 0.91 at 207 days. We learned from Equation (3) that, at higher fission rates of f ˙ 2 and f ˙ 3 , the recrystallization initials were higher earlier; thus, at the same irradiation, level gas swelling accounts for a larger volumetric portion.
As shown in [18,24], “ground-truth” values from simulations have been confirmed for correctness by comparison with experimental reports for CERCER composites in ADS [48]. Limited investigations with a focus on the history-dependent evolution have been conducted on data-driven models for irradiation-included swelling behavior. The simulated outcomes and our anticipated results from the LSTM model concur well, which suggests a satisfactory data-driven model.

3.3. Interpretation of the Data-Driven Model Using Feature Selection Analysis

As aforementioned, we picked the four input features based on our previously developed mechanistic swelling model and FE analysis. In addition, the data-driven LSTM model achieves satisfying performance with good accuracy. Nevertheless, we still considered it a “black box” model that lacks a comprehensive mechanism, due to its complexity and highly nonlinear architecture [49]. To this end, we intended to interpret the time series LSTM model using a sensitivity analysis of feature selection [50], which has successfully been evaluated for LSTM model interpretation in [39].
Feature selection is a method of reducing the input variable to the model by using only relevant data and removing noise in the data. It might be achieved by reshaping the inputs of the pre-trained LSTM model for this problem. Figure 8 examines the predicted swelling plots using a modified LSTM model that excludes the input feature of temperature T and hydrostatic pressure P h , respectively. We further investigated the influence of the selected features on the predicted responses of solid swelling and gas swelling, as shown in Figure 9. Table 1 contains a summary of the R 2 evaluations for different LSTM models with varied inputs.
It is worth noting that reshaping the LSTM model’s input layer has a significant impact on its predictive performance. By removing feature T in Figure 8a, the R 2 value for θ g s w falls to 0.91, and by removing feature P h in Figure 8b, it falls to 0.93. The precision also differs at different levels of irradiation time. We discovered that the removed features have no effect on the output solid swelling portion, with R 2 values all very close to 0.99. In terms of gas swelling, the predicted values agree well with the simulated ones at low irradiation time (corresponding to irradiation dose). Prediction error, defined as the difference between the LSTM expectation and the ground truth reality, becomes more pronounced at high irradiation times (deep burnup) because the gas swelling portion contributes the majority of the total swelling. Before recrystallization, when the temperature T is removed, the R 2 decreases to 0.90, and when the hydrostatic pressure P h is removed, it decreases to 0.92. After recrystallization, the R 2 significantly decreases to 0.85 when the temperature T is removed, and to 0.88 when the hydrostatic pressure P h is removed. The maximum prediction error in Figure 9a and Figure 9b is 45% and 17%, respectively.
Thus, we can conclude that variables of temperature T and hydrostatic pressure P h are dominant features in predicting gas swelling portions. It is also important to note that gas swelling P h is less responsive to the gas swelling than T, while solid swelling is influenced most by fission rate and density. The feature importance results of the four input features are also supported by the numerical analysis of the parametric study in [18,24,29]. Nonetheless, the data-driven approach takes much less time. Therefore, the proposed LSTM model was implemented and validated from knowledge-based simulation results, producing accurate, reliable, and gratifying predictions for irradiation-induced fission swelling in the CERCER composite fuels.

4. Conclusions

We demonstrated the feasibility of a new approach that combines data-driven analysis with a knowledge-driven method to predict the irradiation-induced effects in nuclear fuel in this work. The implementation of knowledge-driven multiscale simulation of CERCER composite fuel provides a sufficient dataset of swelling curves (sequential formed data) with wide-ranging input features of fission rate, irradiation dose, temperature, and hydrostatic pressure. We tested the trained LSTM model’s predictive power for several fission rate predictors, and conducted a preliminary study to interpret the data-driven model using the feature selection method. The conclusions can be drawn as follows.
(1)
Results predicted by the data-driven method exhibit a high R 2 = 0.98 and in the training dataset and 0.95 in the validation dataset. The trained LSTM model performs excellently and accurately in predicting the hydrostatic-pressure-temperature dependent swelling behavior of CERCER composite fuels.
(2)
The LSTM model has comparatively greater performance at solid swelling prediction; it also distinguishes between solid shared swelling and labeled total swelling and catches the moment at which recrystallization first appears for gas swelling.
(3)
The interpretation analysis gives quantitative information about how the data-driven model interprets the loading and physical characteristics and how they relate to various swelling contributions. The variables such as temperature T and hydrostatic pressure P h are dominant features in predicting gas swelling portions.
The LSTM model can be further developed into a fuel design code to improve fuel performance prediction and thoroughly investigate the physical mechanisms underlying inflation-induced swelling behavior.

Author Contributions

Conceptualization: Y.Z. and Y.D.; Methodology: Y.D., Y.Z., and J.Z.; Data curation: J.Z., Z.C., J.T., and Y.Z.; Writing—original draft preparation: J.Z., Y.D., and Y.Z.; Writing—review and editing: J.Z., Y.D., J.T., and Y.Z.; Funding acquisition: Y.Z., Y.D., and J.Z. All authors have read and agreed to the published version of the manuscript.

Funding

This work was supported by the Shanghai Pujiang Talent Program (Y.Z., 22PJ1413800), the National Science Foundation of Shanghai (Y.D., 22ZR1404500; J.Z., 20ZR1462600), the Shanghai Sailing Program (Y.D., 20YF1402500), the National Science Foundation of China (J.Z., 52175144), the Aeronautical Science Foundation of China (J.Z., 201909038001), and the Innovation Foundation of SAST (J.Z., SAST2020).

Data Availability Statement

Data in this article are available upon reasonable request.

Conflicts of Interest

We have no conflicts of interest to report.

References

  1. Aitkaliyeva, A.; He, L.; Wen, H.; Miller, B.; Bai, X.M.; Allen, T. Irradiation effects in Generation IV nuclear reactor materials. In Structural Materials for Generation IV Nuclear Reactors; Elsevier: Amsterdam, The Netherlands, 2017; pp. 253–283. [Google Scholar]
  2. Chen, D.; He, X.; Chu, G.; He, X.; Jia, L.; Wang, Z.; Yang, W.; Hu, C. An overview: Multiscale simulation in understanding the radiation damage accumulation of reactor materials. Simulation 2021, 97, 659–675. [Google Scholar] [CrossRef]
  3. Kohnert, A.A.; Wirth, B.D.; Capolungo, L. Modeling microstructural evolution in irradiated materials with cluster dynamics methods: A review. Comput. Mater. Sci. 2018, 149, 442–459. [Google Scholar] [CrossRef]
  4. Robinson, A.; Williams, W.; Hanson, W.; Rabin, B.; Lybeck, N.; Meyer, M. Swelling of U-Mo monolithic fuel: Developing a predictive swelling correlation under research reactor conditions. J. Nucl. Mater. 2021, 544, 152703. [Google Scholar] [CrossRef]
  5. Rest, J.; Cooper, M.; Spino, J.; Turnbull, J.; Van Uffelen, P.; Walker, C. Fission gas release from UO2 nuclear fuel: A review. J. Nucl. Mater. 2019, 513, 310–345. [Google Scholar] [CrossRef]
  6. Kim, D.U.; Blondel, S.; Bernholdt, D.E.; Roth, P.; Kong, F.; Andersson, D.; Tonks, M.R.; Wirth, B.D. Modeling mesoscale fission gas behavior in UO2 by directly coupling the phase field method to spatially resolved cluster dynamics. Mater. Theory 2022, 6, 1–28. [Google Scholar] [CrossRef]
  7. Rest, J. A model for the effect of the progression of irradiation-induced recrystallization from initiation to completion on swelling of UO2 and U–10Mo nuclear fuels. J. Nucl. Mater. 2005, 346, 226–232. [Google Scholar] [CrossRef]
  8. Li, Y.; Hu, S.; Sun, X.; Stan, M. A review: Applications of the phase field method in predicting microstructure and property evolution of irradiated nuclear materials. Npj Comput. Mater. 2017, 3, 1–17. [Google Scholar] [CrossRef] [Green Version]
  9. Cui, Y.; Ding, S.; Huo, Y.; Wang, C.; Yang, L. An efficient numerical method for intergranular fission gas evolution under transient with piecewise boundary resolution. J. Nucl. Mater. 2013, 443, 570–578. [Google Scholar] [CrossRef]
  10. Tonks, M.; Andersson, D.; Devanathan, R.; Dubourg, R.; El-Azab, A.; Freyss, M.; Iglesias, F.; Kulacsy, K.; Pastore, G.; Phillpot, S.R.; et al. Unit mechanisms of fission gas release: Current understanding and future needs. J. Nucl. Mater. 2018, 504, 300–317. [Google Scholar] [CrossRef] [Green Version]
  11. Zhao, Y.; Ding, S.; Zhang, X.; Wang, C.; Yang, L. Effects of fuel particle size and fission-fragment-enhanced irradiation creep on the in-pile behavior in CERCER composite pellets. J. Nucl. Mater. 2016, 482, 278–293. [Google Scholar] [CrossRef]
  12. Zhao, Y.; Gong, X.; Ding, S. Simulation of the irradiation-induced thermo-mechanical behaviors evolution in monolithic U–Mo/Zr fuel plates under a heterogeneous irradiation condition. Nucl. Eng. Des. 2015, 285, 84–97. [Google Scholar] [CrossRef]
  13. Chen, X.N.; Rineiski, A.; Maschek, W.; Liu, P.; Boccaccini, C.M.; Sobolev, V.; Delage, F.; Rimpault, G. Comparative studies of CERCER and CERMET fuels for EFIT from the viewpoint of core performance and safety. Prog. Nucl. Energy 2011, 53, 855–861. [Google Scholar] [CrossRef]
  14. Miao, Y.; Gamble, K.A.; Andersson, D.; Ye, B.; Mei, Z.G.; Hofman, G.; Yacout, A.M. Gaseous swelling of U3Si2 during steady-state LWR operation: A rate theory investigation. Nucl. Eng. Des. 2017, 322, 336–344. [Google Scholar] [CrossRef]
  15. Booth, A. A Method of Calculating Gas Diffusion from UO2 Fuel and Its Application to the X-2-f Loop Test; AECL Chalk River Report, CRDC-721; 1957. Available online: https://www.osti.gov/servlets/purl/4331839 (accessed on 7 November 2022).
  16. Gurtin, M.E. An Introduction to Continuum Mechanics; Academic Press: Cambridge, MA, USA, 1982. [Google Scholar]
  17. Polyanin, A.D. Functional separable solutions of nonlinear reaction–diffusion equations with variable coefficients. Appl. Math. Comput. 2019, 347, 282–292. [Google Scholar] [CrossRef]
  18. Zhao, Y.; Zhang, J.; Ding, S. A new method for solving the fission gas diffusion equations with time-varying diffusion coefficient and source term considering recrystallization of fuel grains. Nucl. Mater. Energy 2019, 20, 100686. [Google Scholar] [CrossRef]
  19. Xiang, F.; He, Y.; Niu, Y.; Deng, C.; Wu, Y.; Wang, K.; Tian, W.; Su, G.; Qiu, S. A new method to simulate dispersion plate-type fuel assembly in a multi-physics coupled way. Ann. Nucl. Energy 2022, 166, 108734. [Google Scholar] [CrossRef]
  20. Yang, G.; Liao, H.; Ding, T.; Chen, H. Preliminary study on the thermal-mechanical performance of the U3Si2/Al dispersion fuel plate under normal conditions. Nucl. Eng. Technol. 2021, 53, 3723–3740. [Google Scholar] [CrossRef]
  21. Ye, L.; Wang, M.; Wang, X.; Deng, J.; Xiang, Y.; Tian, W.; Qiu, S.; Su, G. Thermal hydraulic and neutronics coupling analysis for plate type fuel in nuclear reactor core. Sci. Technol. Nucl. Install. 2020, 2020, 2562747. [Google Scholar] [CrossRef]
  22. Liu, X.Y.; Andersson, D. Molecular dynamics study of fission gas bubble nucleation in UO2. J. Nucl. Mater. 2015, 462, 8–14. [Google Scholar] [CrossRef] [Green Version]
  23. Hu, S.; Joshi, V.; Lavender, C.A. A rate-theory–phase-field model of irradiation-induced recrystallization in UMo nuclear fuels. Jom 2017, 69, 2554–2562. [Google Scholar] [CrossRef]
  24. Zhao, Y.; Ding, S.; Huo, Y.; Wang, C.; Yang, L. Irradiation-induced thermomechanical behavior in ads composite fuel pellets: Mechanism and main influencing factors. J. Therm. Stress. 2016, 39, 630–657. [Google Scholar] [CrossRef]
  25. Ding, S.; Zhao, Y.; Wan, J.; Gong, X.; Wang, C.; Yang, L.; Huo, Y. Simulation of the irradiation-induced micro-thermo-mechanical behaviors evolution in ADS nuclear fuel pellets. J. Nucl. Mater. 2013, 442, 90–99. [Google Scholar] [CrossRef]
  26. Guo, K.; Yang, Z.; Yu, C.H.; Buehler, M.J. Artificial intelligence and machine learning in design of mechanical materials. Mater. Horizons 2021, 8, 1153–1172. [Google Scholar] [CrossRef]
  27. Zohdi, T. Dynamic thermomechanical modeling and simulation of the design of rapid free-form 3D printing processes with evolutionary machine learning. Comput. Methods Appl. Mech. Eng. 2018, 331, 343–362. [Google Scholar] [CrossRef]
  28. Alber, M.; Buganza Tepole, A.; Cannon, W.R.; De, S.; Dura-Bernal, S.; Garikipati, K.; Karniadakis, G.; Lytton, W.W.; Perdikaris, P.; Petzold, L.; et al. Integrating machine learning and multiscale modeling—perspectives, challenges, and opportunities in the biological, biomedical, and behavioral sciences. NPJ Digit. Med. 2019, 2, 1–11. [Google Scholar] [CrossRef] [Green Version]
  29. Zhang, J.; Wang, H.; Wei, H.; Zhang, J.; Tang, C.; Lu, C.; Huang, C.; Ding, S.; Li, Y. Modelling of effective irradiation swelling for inert matrix fuels. Nucl. Eng. Technol. 2021, 53, 2616–2628. [Google Scholar] [CrossRef]
  30. Morgan, D.; Pilania, G.; Couet, A.; Uberuaga, B.P.; Sun, C.; Li, J. Machine learning in nuclear materials research. Curr. Opin. Solid State Mater. Sci. 2022, 26, 100975. [Google Scholar] [CrossRef]
  31. Rossa, R.; Borella, A.; Giani, N. Comparison of machine learning models for the detection of partial defects in spent nuclear fuel. Ann. Nucl. Energy 2020, 147, 107680. [Google Scholar] [CrossRef]
  32. Kobayashi, K.; Okumura, M.; Nakamura, H.; Itakura, M.; Machida, M.; Cooper, M.W. Machine learning molecular dynamics simulations toward exploration of high-temperature properties of nuclear fuel materials: Case study of thorium dioxide. Sci. Rep. 2022, 12, 1–11. [Google Scholar] [CrossRef]
  33. Mishra, V.; Branger, E.; Elter, Z.; Grape, S.; Jansson, P. Comparison of supervised machine learning algorithms to predict PWR spent fuel parameters. In Proceedings of the INMM & ESARDA Joint Annual Meeting 2021, Vienna, Austria, 21–26 August 2021. [Google Scholar]
  34. Cai, L.; Xu, F.; Di Lemma, F.G.; Giglio, J.J.; Benson, M.T.; Murray, D.J.; Adkins, C.A.; Kane, J.J.; Xian, M.; Capriotti, L.; et al. Understanding fission gas bubble distribution, lanthanide transportation, and thermal conductivity degradation in neutron-irradiated α-U using machine learning. Mater. Charact. 2022, 184, 111657. [Google Scholar] [CrossRef]
  35. Wu, L.; Kilingar, N.G.; Noels, L. A recurrent neural network-accelerated multi-scale model for elasto-plastic heterogeneous materials subjected to random cyclic and non-proportional loading paths. Comput. Methods Appl. Mech. Eng. 2020, 369, 113234. [Google Scholar] [CrossRef]
  36. Yu, Y.; Si, X.; Hu, C.; Zhang, J. A review of recurrent neural networks: LSTM cells and network architectures. Neural Comput. 2019, 31, 1235–1270. [Google Scholar] [CrossRef] [PubMed]
  37. Dong, Y.; Tao, J.; Zhang, Y.; Lin, W.; Ai, J. Deep learning in aircraft design, dynamics, and control: Review and prospects. IEEE Trans. Aerosp. Electron. Syst. 2021, 57, 2346–2368. [Google Scholar] [CrossRef]
  38. Parish, E.J.; Carlberg, K.T. Time-series machine-learning error models for approximate solutions to parameterized dynamical systems. Comput. Methods Appl. Mech. Eng. 2020, 365, 112990. [Google Scholar] [CrossRef] [Green Version]
  39. Zhao, Y.; Zhao, H.; Ai, J.; Dong, Y. Robust Data-Driven Fault Detection: An Application to Aircraft Air Data Sensors. Int. J. Aerosp. Eng. 2022, 2022, 2918458. [Google Scholar] [CrossRef]
  40. Chen, G. Recurrent neural networks (RNNs) learn the constitutive law of viscoelasticity. Comput. Mech. 2021, 67, 1009–1019. [Google Scholar] [CrossRef]
  41. Im, S.; Lee, J.; Cho, M. Surrogate modeling of elasto-plastic problems via long short-term memory neural networks and proper orthogonal decomposition. Comput. Methods Appl. Mech. Eng. 2021, 385, 114030. [Google Scholar] [CrossRef]
  42. Qu, T.; Di, S.; T Feng, Y.; Wang, M.; Zhao, T.; Wang, M. Deep Learning Predicts Stress–Strain Relations of Granular Materials Based on Triaxial Testing Data. Comput. Model. Eng. Sci. 2021, 128. [Google Scholar] [CrossRef]
  43. Gong, X.; Zhao, Y.; Ding, S. A new method to simulate the micro-thermo-mechanical behaviors evolution in dispersion nuclear fuel elements. Mech. Mater. 2014, 77, 14–27. [Google Scholar] [CrossRef]
  44. Zhao, Y.; Gong, X.; Cui, Y.; Ding, S. Simulation of the fission-induced swelling and creep in the CERCER fuel pellets. Mater. Des. 2016, 89, 183–195. [Google Scholar] [CrossRef]
  45. Schielzeth, H. Simple means to improve the interpretability of regression coefficients. Methods Ecol. Evol. 2010, 1, 103–113. [Google Scholar] [CrossRef]
  46. Nagelkerke, N.J. A note on a general definition of the coefficient of determination. Biometrika 1991, 78, 691–692. [Google Scholar] [CrossRef]
  47. Gulli, A.; Pal, S. Deep Learning with Keras; Packt Publishing Ltd.: Birmingham, UK, 2017. [Google Scholar]
  48. Neeft, E.; Bakker, K.; Schram, R.; Conrad, R.; Konings, R. The EFTTRA-T3 irradiation experiment on inert matrix fuels. J. Nucl. Mater. 2003, 320, 106–116. [Google Scholar] [CrossRef]
  49. Dayhoff, J.E.; DeLeo, J.M. Artificial neural networks: Opening the black box. Cancer Interdiscip. Int. J. Am. Cancer Soc. 2001, 91, 1615–1635. [Google Scholar] [CrossRef]
  50. Cai, J.; Luo, J.; Wang, S.; Yang, S. Feature selection in machine learning: A new perspective. Neurocomputing 2018, 300, 70–79. [Google Scholar] [CrossRef]
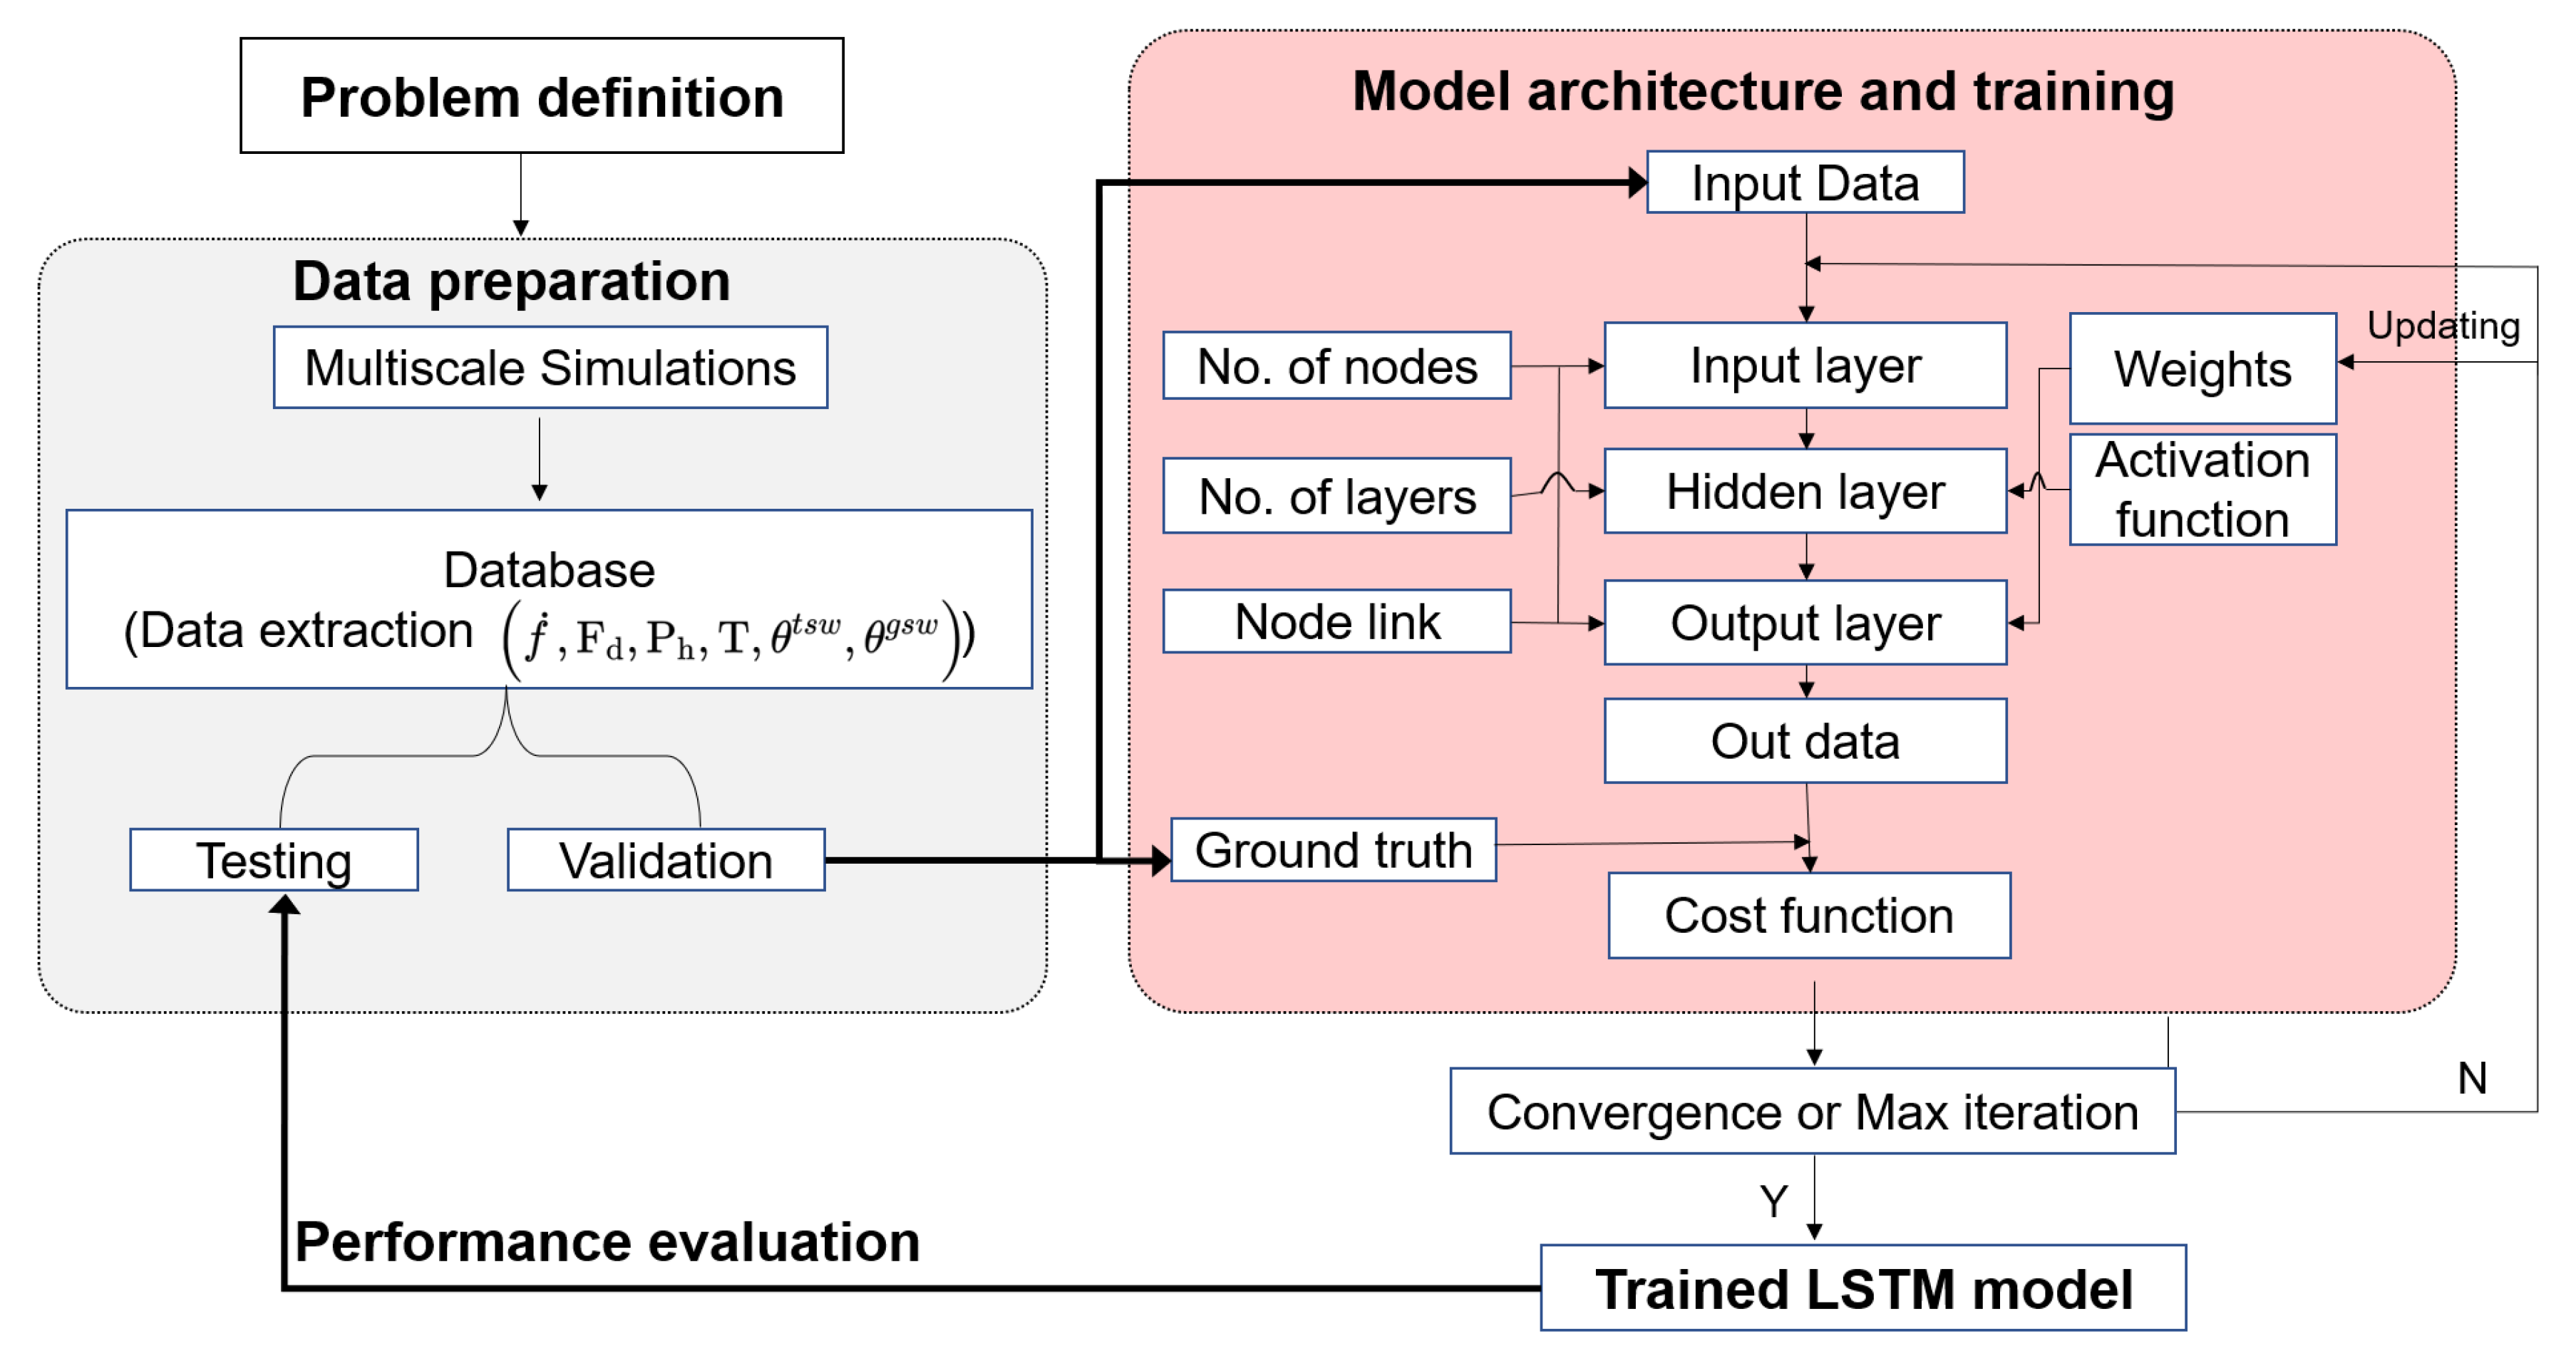
Figure 1. Application of machine learning to nuclear fuels for predicting irradiation-induced swelling via integrating knowledge-based multiscale simulations and LSTM deep learning schemes.
Energies 15 09053 g001
Figure 2. Dataset generation by knowledge-based multiscale simulations include: (a) Schematic of CERCER composite fuel pellet with periodically arranged spherical microstructures; (b) Mesoscale RVE model for thermo-mechanical modeling; (c) Geometry mesh in ABAQUS using C3D10MT tetrahedron elements and (d) Illustration of grainscale swelling during diffusion activities.
Energies 15 09053 g002
Figure 3. LSTM deep learning method: (a) data preparation of input and output features; (b) architecture of the feedback neural network.
Energies 15 09053 g003
Figure 4. Model evaluation including convergence analysis of training and validation losses.
Energies 15 09053 g004
Figure 5. Swelling prediction via the LSTM deep learning approach: Model evaluation for sensitive analysis of the number of neurons in LSTM layers with (a) MSE and (b) R 2 values.
Energies 15 09053 g005
Figure 6. Comparison between the predicted volumetric swelling plot of θ t s w , θ g s w , and θ s s w from the LSTM model (hollow symbols) and the values obtained from the FE simulations (doted lines) for the validation dataset.
Energies 15 09053 g006
Figure 7. Swelling prediction via the LSTM deep learning approach: (a) solid swelling prediction; (b) gas swelling prediction.
Energies 15 09053 g007
Figure 8. Predictions of the total volumetric swelling using the LSTM deep-learning approach: (a) with input features are f ˙ , F d , P h ; (b) with input features are f ˙ , F d , T.
Energies 15 09053 g008
Figure 9. Predictions of the solid and gas fission swelling using the LSTM deep-learning approach: (a) with input features are f ˙ , F d , P h ; (b) with input features are f ˙ , F d , T.
Energies 15 09053 g009
Table 1. Prediction evaluation of R 2 for LSTM models with different inputs.
R 2 [ f ˙ , F d , P h , T]    [ f ˙ , F d , P h ]    [ f ˙ , F d , T]    
θ t s w 0.950.910.93
Before recrystallization θ g s w 0.940.900.92
θ s s w 0.980.990.99
θ t s w 0.930.880.92
After recrystallization θ g s w 0.910.850. 88
θ s s w 0.980.980.98
Publisher’s Note: MDPI stays neutral with regard to jurisdictional claims in published maps and institutional affiliations.