Abstract
Lithium batteries employed in lightweight fixed-wing UAVs are required to operate with large temperature variations and, especially for the emerging applications in hybrid propulsion systems, with relevant transient loads. The detailed dynamic modelling of battery packs is thus of paramount importance to verify the feasibility of innovative hybrid systems, as well as to support the design of battery management systems for safety/reliability enhancement. This paper deals with the development of a generalised approach for the dynamic modelling of battery packs via Thevenin circuits with modular hysteretic elements (open circuit voltage, internal resistance, RC grids). The model takes into account the parameters’ dependency on the state of charge, temperature, and both the amplitude and sign of the current load. As a relevant case study, the modelling approach is here applied to the Li-Po battery pack (1850 mAh, 6 cells, 22.2 V) employed in the lightweight fixed-wing UAV Rapier X-25 developed by Sky Eye Systems (Cascina, Italy). The procedure for parameter identification with experimental measurements, obtained at different temperatures and current loads, is firstly presented, and then the battery model is verified by simulating an entire Hybrid Pulse Power Characterisation test campaign. Finally, the model is used to evaluate the battery performance within the altitude (i.e., temperature) envelope of the reference UAV. The experiments demonstrate the relevant hysteretic behaviour of the characteristic relaxation times, and this phenomenon is here modelled by inserting Bouc–Wen hysteresis models on RC grid capacitances. The maximum relative error in the terminal output voltage of the battery is smaller than 1% for any value of state of charge greater than 10%.
Keywords:
modelling; simulation; testing; Li-Po battery; hysteresis; fixed-wing UAV; hybrid propulsion 1. Introduction
1.1. Research Context
Low noise emissions, a minimised thermal signature, high efficiency, enhanced diagnostics/prognostics and widespread requests for decarbonisation are pushing the aviation sector to investigate the potentialities of electric propulsion systems for long-endurance UAV applications. However, the specific energy of battery packs is nowadays much lower than liquid hydrocarbon fuels [], and Internal Combustion Engines (ICEs) still remain a reference solution, although their power efficiency, typically approximately 40%, is very poor. Hybrid Electric Propulsion Systems (HEPSs), combining the high efficiency of electric motors with the high specific energy of fossil fuels, could enhance both cruise and climb performance [] and are expected to play a key role in UAV development in the coming years, especially for long-endurance applications [].
Several works can be found in the literature on the development of HEPSs for aircraft applications. Wall and Meyer proposed an extensive review on HEPS solutions for aircraft in [], while Harmon [] and Hiserote [] analysed strategies to be applied for the design and the control of HEPSs for fixed-wing UAVs. In these particular applications, it has been proven that a HEPS with a parallel configuration can lead to up to 7% fuel savings [,], by overcoming the limitations of climb performance due to the overheating of conventional ICEs. In fact, the ICEs of long-endurance UAVs are essentially sized for cruise conditions (i.e., at low power rating), so they are prone to overheating when the power request is high (e.g., during climb) []. To avoid thermal concerns during climb, a typical compensation is obtained by alternating small climbs and levelled flights to cool down the ICE, but UAV performance is adversely influenced.
A compensation can be obtained by adding an electric motor, which is powered by batteries and activated as a “booster”, to deliver the thrust power excess needed for climb while the ICE temperature decreases. Further, the use of an electric booster can strongly enhance the UAV’s agility during sense-and-avoid manoeuvres, thanks to the superior dynamic performance of electric machines with regard to ICEs in terms of torque response. To design and verify the feasibility of such HEPSs, it is crucial to characterise in detail the cyclic dynamics of discharge/charge of the battery pack related to the activation/deactivation of the electric booster. The development of detailed models of batteries is thus of paramount importance to optimise the booster power requests (durations and amplitudes of cycles) and to evaluate the HEPS efficiency, as well as for supporting the design of Battery Management Systems (BMSs).
The potential benefits of reconfiguring conventional ICE-based propulsion systems into HEPSs for UAVs have been also analysed, via simulations, by the authors in a previous work [], where, as a reference application, the Rapier X-25 was considered (Figure 1), which is a 25 kg take-off weight fixed-wing UAV designed by Sky Eye Systems (Cascina, Italy) []. To confirm and consolidate the promising results, based on preliminary simulation models, it is now necessary to develop a virtual prototype of the HEPS, based on experimentally validated models of the most relevant electric power devices, including the battery pack.
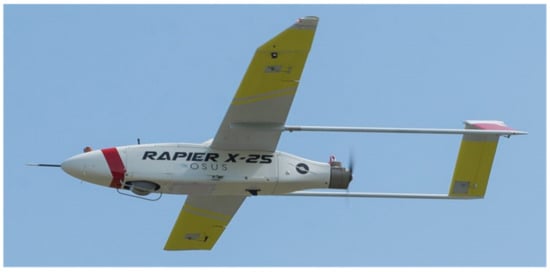
Figure 1.
Lightweight fixed-wing UAV “Rapier X-25” by Sky Eye Systems (Cascina, Italy).
1.2. Motivation of the Research
Due to superior performance in terms of energy density, power-to-energy balance and long cycle life with respect to other technologies (lead–acid, Ni–Cd, Ni–metal hydride, Li–metals), Li-ion batteries have recently become the market leader for both electric vehicle and portable electronics applications [,]. Nevertheless, some drawbacks are related to costs and health-monitoring concerns. A cell in a Li-ion battery is composed of the following basic elements: the anode and cathode electrodes, a separator and an electrolyte []. The anode is a copper foil, coated with a material characterised by high negative potential (e.g., graphite, lithium, titanate, silicone) [], while the cathode is an aluminium foil, coated with a material of high specific electrical capacity, which gives the name to the battery type. Since high content of nickel and lithium increases the electrical capacity, the most used materials for cathode coatings are lithium metal oxides (LMO), lithium cobalt oxide (LCO), nickel cobalt aluminium oxide (NCAO), nickel cobalt manganese oxide (NCMO), lithium ferrite phosphate (LFP), lithium ferrite fluor-sulphate (LFSF) and lithium titanium sulphide (LTS) [,,]. The interaction between the anode and the cathode is realised by means of the electrolyte, which enables the transfer of lithium ions between the electrodes, while the separator prevents short circuits. Typical materials for separators in Li-ion batteries are microporous polyolefin films (e.g., polyethylene, polypropylene) or ceramic alumina–silica composites. The safety issues are essentially related to the electrolyte employed for the ionic conductivity. Indeed, to achieve high performance, Li-ion batteries employ electrolytes based on organic solvents, loaded with Li salt, creating a risk of environmental contamination due to leakage and potential flammability []. To solve leakage problems, batteries with solid polymer electrolytes have been developed (e.g., Li-Po batteries) and are typically preferred for aerospace applications [].
The safety and efficiency of battery packs also depends on the power output balancing among the battery cells, aiming to maintain the cells’ voltages within specific limits (imperfect balancing is unavoidable, due to operative conditions, such as the temperature gradient along the battery or repetition of charge/discharge cycles [], as well as to the manufacturing process). Exceeding the cells’ voltage limits could cause a reduction in the overall capacity of the battery and it can lead to failure. For this reason, the batteries are integrated with BMS devices, implementing algorithms characterised by different objectives/methods [,], which depend also on cells’ interconnection topology (string-parallels and parallel-strings []). The BMS device also implements monitoring algorithms on the currents and temperatures of the cells, by estimating the state of charge (SOC), state of health (SOH) and depth of discharge (DOD).
The implementation and the effectiveness of most of these monitoring functions strictly depend on the prediction accuracy of battery models. Over the years, many models have been proposed in the literature and they can be categorised into the following types (a comprehensive survey is provided by Tamilselvi et al. in []):
- electrochemical models;
- architectural models;
- circuit-oriented models;
- machine learning models.
In electrochemical models [,,], the battery dynamics are reconstructed by modelling the electrochemical reaction taking place in the electrodes and the electrolyte. This approach is very accurate, since it provides a detailed physical representation of the electrolytic diffusion, including charge balance and temperature effects, but it requires detailed data/information, which are often not available in the preliminary design phases, for solving complex sets of nonlinear partial differential equations [].
Architectural models are based either on analytical [,,] or stochastic methods [,], mainly aiming to predict the efficiency and runtime of the batteries. Compared with electrochemical models, these models are clearly less accurate, but their simplicity leads to them being preferred for system-level analyses [].
Circuit-oriented models are lumped-parameter dynamic models based on modelling the battery as an equivalent electrical circuit. These models essentially represent a balance between electrochemical and architectural models in terms of prediction granularity and computational resources. In particular, they are demonstrated to be suitable for simulating charge/discharge dynamics at fixed environmental conditions. Circuit-oriented models can be classified into the following:
- Thevenin-based models [,,,,], providing a time-domain description of the battery dynamics, which is simulated via resistor–capacitor (RC) grids. The circuitry parameters are typically identified by measuring the battery voltage response under discharging and/or charging pulse waves of current.
- Impedance-based models [,,,], providing a frequency-domain description of the battery dynamics, in which each component of the model represents an electrochemical process. The conversion of these models from the frequency to time domain is often burdensome, and the model parameters are identified using sophisticated electrochemical spectroscopy methods.
More recently, machine learning models (e.g., artificial neural network, recursive neural network, support vector machine, support vector regression) have been also proposed in the literature [,,], but the need for a large amount of measurements/data for the training phase of model development often makes this approach unfeasible for preliminary design and technology validation.
This work aims to provide a contribution to the development of experimentally validated models of Li-Po batteries with high performance and reliability capabilities, as compared to those typically required for air vehicle applications, by using a Thevenin-based approach. In particular, a generalised Thevenin-based circuitry including hysteretic RC grids is presented, including all the most relevant physical behaviours of the device (battery losses, hysteretic charge/discharge, thermal dependence, high-order relaxation time scales). With reference to the Li-Po battery pack employed as an emergency power system in the lightweight fixed-wing UAV “Rapier X-25”, a second-order Thevenin-based circuitry with hysteretic RC grids is developed and verified with experimental measurements. Since battery performance is strongly influenced by environmental conditions and current rate profiles [], the reference battery pack response has been characterised via the Hybrid Pulse Power Characterisation (HPPC) technique [] at different temperatures, as in [,], and by imposing different levels of discharge/charge rates. Special attention has been dedicated to the modelling of the hysteretic behaviour of the RC grids’ capacitances, which are described via first-order Bouc–Wen models [].
The main contributions of the present work are the following:
- development of a generalised Thevenin-based battery model, including hysteretic phenomena related to device elements (OCV, internal resistance, relaxation times);
- development of an ad hoc procedure for the model parameters’ identification, starting from experimental measurements;
- construction of a database characterising the response of a Li-Po battery pack for UAV applications (LCO LiPo 1850 6S 22.2 V []) for different temperatures and charge rates.
The paper is organised as follows. In the first section, after presenting the state of the art of the circuit-oriented modelling of Li-Ion batteries, a generalised Thevenin-based model is presented, by including hysteretic behaviours in each battery element. In the second section, the identification procedure of the model parameters is described, by using as a reference database the experimental results obtained on the reference battery pack. In the third section of the work, the experimentally validated model of the battery is finally used to evaluate the equipment response within the altitude (i.e., temperature) envelope of the UAV.
2. Materials and Methods
2.1. State of the Art of Thevenin-Based Models
Thevenin-based models of batteries essentially create a series connection of a nonlinear voltage source (open-circuit voltage, OCV), a resistor (internal resistance) and a number of RC grids, to simulate the characteristic relaxation time scales of the battery; see Figure 2a. The literature highlights that the parameters of each element of the Thevenin circuit are the functions of the SOC and the temperature, as well as of the sign of the current, by generating hysteretic behaviours in the device with respect to the SOC. Different interpretations have been presented to explain the origin of hysteretic behaviours, i.e.,
- kinetics of battery insertion [,,,,];
- thermodynamics [,];
- electrochemistry [].
Moreover, several modelling approaches are available. Hysteresis models can be classified into static models (e.g., Preisach [], Prandtl–Ishlinskii []) and dynamic models (e.g., Bouc–Wen [], Duhem [], Maxwell []), depending on whether they use ordinary differential equations or not. Compared with static models, the dynamic ones are often less accurate, but they are more suitable for control and real-time monitoring purposes.

Figure 2.
State-of-the-art modelling of batteries via Thevenin-based circuit models with m RC grids: (a) non-hysteretic model; (b) with OCV hysteresis.
Many works have been developed on hysteresis modelling for batteries [,,,], by essentially focusing on the OCV behaviour. The OCV accounts for the electrochemical and thermodynamic processes characterising the battery operation, and it is typically a nonlinear monotonic function of SOC. The relevance of hysteresis on the battery OCV depends on the battery technology, as experimentally shown in []: in particular, it is extremely significant in nickel–metal hydride (NiMH) and nickel–cadmium (Ni–Cd) types, while it tends to be low for Li-Po and Li-ion batteries []. In Thevenin-equivalent circuits, the OCV hysteresis is accounted for by adding a voltage drop to the OCV, as shown in Figure 2b.
For Li-Po batteries, the dependence of the Thevenin circuit parameters can be summarised as in Table 1, where is the electrical charge (i.e., SOC), is the delivered current, is the temperature, is the OCV and is the internal resistance, while and are the resistance and the capacitance of the j-th grid, respectively. It is worth noting that most of the parameters are highly dependent on the SOC and temperature, which justifies the great attention given by the literature to these issues. On the other hand, the literature is poor in terms of the investigation of the dependence of the relaxation time scales (i.e., j-th grid capacitance) on the current sign, which implies a hysteretic response.

Table 1.
Dependence of Thevenin circuit parameters on operative conditions for Li-Po batteries.
2.2. Generalised Thevenin Circuit with Modular Hysteretic Grids
The basic idea underlying the proposed modelling approach is that each element of the Thevenin circuit can be represented by a hysteretic RC grid—see Figure 3a, where () and () are the resistances (capacitances) related to non-hysteretic and hysteretic behaviours, respectively. The RC grid can be used to model the OCV and the internal resistance too, by setting

Figure 3.
Generalised Thevenin circuit modelling: (a) single hysteretic RC grid; (b) OCV; (c) internal resistance; (d) complete circuit with m RC grids.
By using this approach, the mathematical modelling of a generalised m-th order Thevenin circuit (Figure 3d) referring to a Li-Po battery at fixed temperature can be expressed by
where is the terminal output voltage, is the voltage drop on the j-th circuit element (j = 0 for the internal resistance, and j = 1,…, m for the other grids), is the battery capacitance, is the hysteretic electrical charge related to the Z parameter () of the j-th grid, and is the hysteretic parameter charge of the j-th grid, while is the shape factor of a first-order Bouc–Wen hysteresis model applied to the j-th grid.
2.3. Experimental Set-Up
To identify the parameters of the model of the reference battery pack, a test campaign based on the HPPC technique [,] has been carried out. During HPPC tests, the battery is repeatedly discharged or charged via pulse-wave currents of constant period and amplitude (test input , defined as multiple of the nominal “battery C-rate”, Cr), and the terminal voltage is measured (test output ), to characterise the parameters’ dependence on the SOC. The signal sampling rate for both inputs and outputs is = 0.1 s.
In addition, to investigate the effects of temperature, each HPPC test has been performed under environmental control, by imposing via a thermal chamber hot (49 °C), ambient (15 °C) and cold (0 °C) operations. Each campaign is composed of six HPPC tests, with pulse-wave currents of 30 min periods and 0.5, 1 and 1.5 Cr amplitudes, to characterise the parameters’ dependence on both the amplitude and sign of the current.
The experimental set-up, depicted in Figure 4, is mainly composed of
- a thermal chamber with hot and cold zones—see Figure 4a;
- an electronic control unit (see Figure 4b), including a
- ○
- TENMA-30V-5A DC (Farnell, Leeds, UK) bench power supply [];
- ○
- RIGOL-DL-3031A DC (ALLdata, Milano, Italy) electronic loading system, to regulate the pulse-wave current input [];
- ○
- VOLTCRAFT-V-CHARGER 240 (Conrad, Hirschau, Germany) battery charger, with cell balancing capabilities [];
- ○
- KEYSIGHT-DAQ970A (Keysight, Colorado Springs, United States) data acquisition system [];
Table 2.
Li-Po batteries 1850 6S 22.2 V specifications.

Figure 4.
Experimental set-up for the battery testing: (a) thermal chamber; (b) electronic control unit; (c) reference battery.
2.4. Experimental Measurements for Model Parameter Identification
In each HPPC test, the battery is discharged and charged by applying a series of load cycles, in which a constant current input () is firstly imposed, to obtain a 10% SOC variation, and then the current is set to zero for a pre-defined rest period of 30 min, to reach a steady-state terminal voltage output (). In the discharge phase, the HPPC testing is stopped when a cut-off voltage of 18 V is reached.
The procedure for the identification of the basic model parameters (, , and in Equation (1)) can be described with reference to Figure 5, which reports the measurements obtained during a discharge load cycle. The battery OCV is evaluated as the steady-state terminal voltage output immediately before the current load is applied ( in Figure 5):
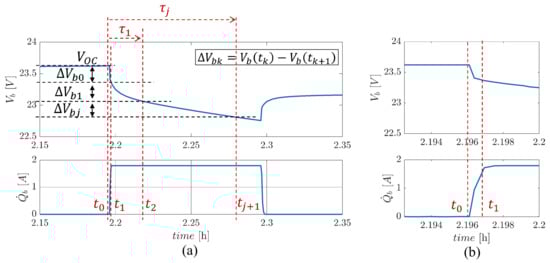
Figure 5.
Terminal voltage and current discharging pulse during a discharging HPPC test at 1.85 A (−1 Cr): (a) entire discharging pulse; (b) detail during the load application.
The internal resistance is instead obtained from the measured variation in terminal voltage when the current has reached its steady-state value (from to in Figure 5):
As outlined in Equation (3), the estimation neglects all the voltage drops related to the RC grids (in Equation (1), with ) within the current input transient, but this approach is largely applied in the literature when the time constant related to the current load control (in the examined case, less than 1 s) is much smaller than the expected relaxation times of the device.
The successive variations in the terminal voltage ( in Figure 5) are used to identify the dynamic response of the battery, which is related to the voltage responses of the m RC grids of the model. In particular, by subdividing into m parts the voltage variation phase up to the time at which the current load is removed ( in Figure 5), the resistance and the capacitance of the -th RC grid are calculated as in [,], where is the time constant of the -th RC grid:
The correct identification of the characteristic times has thus a crucial role in the model accuracy. Generally, for Li-Po batteries, the smallest time constant is approximately 10 s, while larger time constants are within the range of minutes, with a negligible dependence on the SOC [,,]. Nevertheless, the time constants can vary with temperature and C-rate, and they can be affected by hysteretic behaviours, so that their direct evaluation from experiments is very complicated. For this reason, an optimisation technique based on a nonlinear least-square fitting method [] has been applied to a state-of-the-art model without hysteresis with two RC grids (refer to Figure 2a, with m = 2), by using the Simulink Optimisation Toolbox in the Matlab environment. The model parameters estimated via optimisation are reported in Appendix A, in Table A1, Table A2, Table A3, Table A4, Table A5 and Table A6, at different temperatures, C-rates and SOCs. This database has been used as a preliminary estimation of the model parameters, to be enhanced by taking into account hysteretic grids—see Figure 3d.
The model parameters preliminarily estimated via the optimisation tool are reported for each test temperature in Figure 6, Figure 7 and Figure 8.
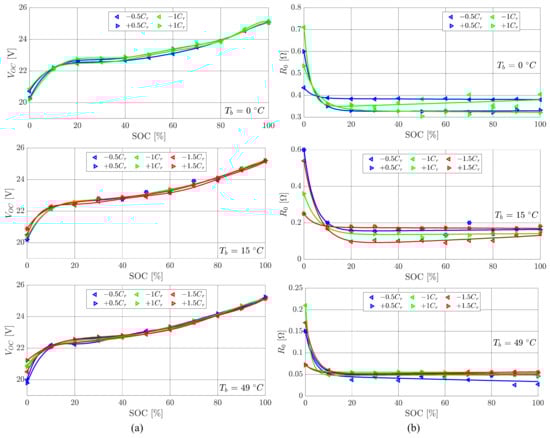
Figure 6.
OCV () and internal resistance () as function of SOC for different values of C-rate (Cr) and temperature ( , up; , central; , lower): (a) OCV; (b) internal resistance. Experimental data are reported together with best-fit approximations (7th-order polynomial functions for OCV, 2nd-order exponential functions for internal resistance).
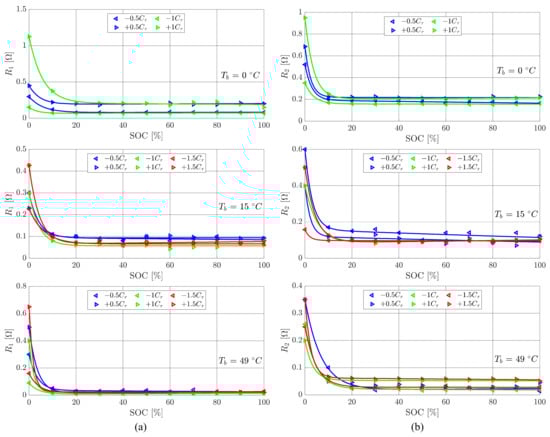
Figure 7.
Resistances of the two RC grids ( and ) as function of SOC for different values of C-rate (Cr) and temperature ( , up; , central; , lower): (a) resistance of the first grid; (b) resistance of the second grid. Experimental data are reported together with best-fit approximations (2nd-order exponential functions).
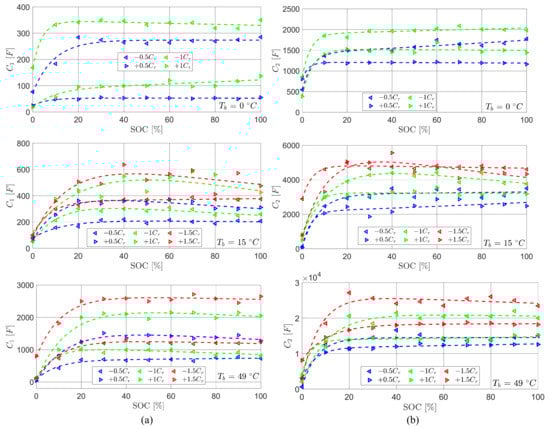
Figure 8.
Preliminary estimation (without hysteresis) of the two RC grids’ capacitances ( and ) as function of SOC for different values of C-rate (Cr) and temperature ( , upper; , central; , lower): (a) capacitance of the first grid; (b) capacitance of the second grid. Experimental data are reported together with best-fit approximations (2nd-order exponential functions).
The identification of the OCV (Figure 6a) confirms a minor dependency on temperature, as well as on the amplitude and sign of the current; see Table 1. The identified values of resistances (Figure 6b and Figure 7) show similar trends. Concerning the dependence on the SOC, the resistances are essentially constant when the SOC ranges from 50% to 100%, while they significantly increase for lower SOC values. All resistances generally decrease with temperature.
As far as the SOC dependence is concerned, the capacitances (Figure 8) are roughly constant from 50% to 100% of the charge, while they decrease for lower SOC values. The capacitances generally increase with temperature, and they exhibit significant hysteresis with respect to the SOC.
2.5. Adaptation of the Generalised Model to the Reference Battery
The experimental measurements carried out on the reference Li-Po battery demonstrated that a Thevenin-based model with two RC grids provides a good approximation of the battery dynamics, and that remarkable hysteretic behaviour can be observed for the polarisation capacitances. Hence, the generalised Thevenin-based method depicted in Figure 3d can be reduced to the one reported in Figure 9.
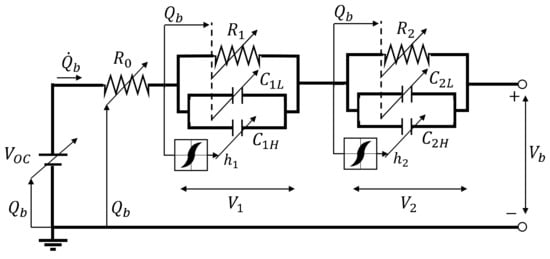
Figure 9.
Thevenin-based equivalent circuit used for the reference battery simulation.
Equation (1) can be thus specialised as
where
As described by Equation (6), is a sort of “baseline capacitance”, obtained as the mean value between the capacitances identified by the optimisation tool during charge () and discharge () tests at the same current amplitude ().
The battery model is thus completely defined once the Bouc–Wen hysteresis model parameters () are identified. This has been achieved by developing a Matlab/Simulink model of the system from Equation (5), and by minimising the simulation residues with respect to experimental measurements of capacitances. The simulation is numerically solved via the fourth-order Runge–Kutta method, using an integration step of 0.01 s.
The results of this activity are reported in Table 3. To better clarify and support the interpretation of results, the closed-form solution of a first-order Bouc–Wen model applied to a single RC grid with hysteretic capacitance is reported in Appendix B.
Table 3.
Bouc-Wen hysteresis model parameters () related to the capacitances of the two RC grids at different temperatures () and C-rates (Cr).
Figure 10 reports an excerpt of the results obtained from the Matlab/Simulink model of the battery, in which full (Figure 10a) and partial (Figure 10b) discharge/charge cycles with increasing C-rates are simulated (at ). It can be clearly noticed that the simulation succeeds in reproducing the hysteretic behaviour of the capacitances, in terms of both partial and full hysteretic cycles.
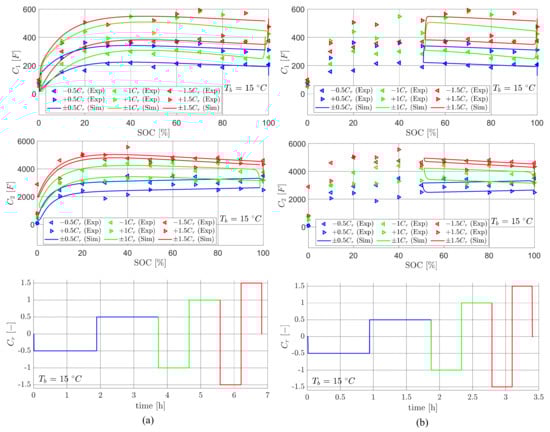
Figure 10.
Final estimation (with hysteresis) of the Thevenin circuit RC grids’ capacitances for different values of C-rate (Cr) at temperature : (a) complete discharge/charge cycle; (b) 50% discharge/charge cycle. Simulation results are reported together with best-fit approximations of the experimental data.
3. Results
The effectiveness of the battery model is firstly verified by simulating the entire HPPC test campaign performed on the hardware, by comparing its results with the experiments. Successively, the model is used to predict the battery performance in a typical flight mission of the reference UAV, by imposing dynamic current loadings and temperature variations due to altitude.
3.1. HPPC Test Simulation
The results related to the verification of the model are provided in Figure 11, Figure 12, Figure 13 and Figure 14, by reporting an excerpt of the HPPC test simulations, namely

Figure 11.
Simulation and experimental results in a HPPC test at 0.5 Cr and : (a) full discharge/charge: voltages (upper); current load and SOC (central), normalised voltage error (lower); (b) discharge/charge dynamics at SOC = 0.7 (; ): voltages (upper), current load (lower).

Figure 12.
Simulation and experimental results in a HPPC test at 0.5 Cr and : (a) full discharge/charge: voltages (upper); current load and SOC (central), normalised voltage error (lower); (b) discharge/charge dynamics at SOC = 0.7 (; ): voltages (upper), current load (lower).

Figure 13.
Simulation and experimental results in a HPPC test at 1 Cr and : (a) full discharge/charge: voltages (upper); current load and SOC (central), normalised voltage error (lower); (b) discharge/charge dynamics at SOC = 0.7 (; ): voltages (upper), current load (lower).

Figure 14.
Simulation and experimental results in a HPPC test at 1 Cr and : (a) full discharge/charge: voltages (upper); current load and SOC (central), normalised voltage error (lower); (b) discharge/charge dynamics at SOC = 0.7 (; ): voltages (upper), current load (lower).
It is worth noting that the simulation errors in the voltage output are very small throughout the whole SOC range (the normalised peak error does not exceed 1% for SOC > 0.1, while it reaches 10% only at very small SOCs, surely outside the normal operating conditions of the device). A more detailed comparison is also provided, in Figure 11b, Figure 12b, Figure 13b and Figure 14b, highlighting the voltage relaxation behaviour at SOC = 0.7, during both charge and discharge phases. The experimental and simulation results in the charge phase have been overlapped with those during the discharge phase, time-shifted along the time axis (with respect to the time at which SOC = 0.7) and voltage-shifted (with respect to the experimental measurement at time ). It is worth noting that, as outlined in Section 2.4, the OCV hysteresis is negligible, i.e., the variation in the experimental value of the steady-state terminal voltage between charge and discharge phases is around 5 mV. The maximum simulation error is around 0.1 V, and it is essentially related to the static response of the model (i.e., linked to OCV and internal resistance parameters). On the other hand, the simulation of transient behaviours is very good, and the voltage perturbation waveform is well reproduced.
3.2. Flight Mission Simulation
The battery model is finally employed to estimate the energy efficiency of the reference battery pack during a flight mission:
- take-off/on-ground: hot day conditions with ( = 40 °C);climb (2 m/s rate): the battery operates under a negative temperature gradient, passing from 40 °C to approximately 1 °C at 6 km altitude (cruise);
- cruise: the battery operates at constant temperature ( = 1 °C);
- descent (2 m/s rate): the battery operates under a positive temperature gradient, passing from approximately 1 °C to 40 °C (on-ground).
The simulation is carried out by imposing, in each flight phase, a full discharge/charge cycle, up to SOC = 0.1. The current load waveform is set as a “1-cos” function, i.e.,
where is the peak amplitude required to discharge the battery up to SOC = 0.1 within one oscillation cycle and is the time required to reach 6 km altitude with a 2 m/s climb rate.
The results of the simulation are summarised in Figure 15, reporting the current loading and the operating temperature (Figure 15a), the output voltage (Figure 15b) and the energy and energy efficiency for each flight phase (Figure 15c), as in Equation (8):
It is worth noting that the battery efficiency is expected to significantly decrease during cruise, at cold temperatures (in the simulations, ranges from 0.93 at take-off to 0.75 in cruise), confirming the observations in [].

Figure 15.
Battery performance during flight mission: (a) time histories of current loading and SOC; (b) battery voltage output; (c) energy and energy efficiency .
4. Discussion
The results in Section 3 highlight the effectiveness and the potentialities of the generalised modelling approach for batteries, as well as the simulation accuracy in describing the dynamic performance of a reference Li-Po battery for UAV applications, by taking into account the effects of the environmental temperature and current loading (the maximum relative error on output voltage for SOC > 0.1 is lower than 1%, i.e., <25 mV).
The modelling approach based on hysteretic RC grids permits us to accurately reproduce the transient behaviour of the device in both the charge and discharge phases without introducing discontinuities or dense interpolation databases. Actually, when the current load is removed or changes sign, the hysteretic parameters (OCV, internal resistance or RC grid parameters) evolve as continuous-time functions governed by ordinary differential equations, by maintaining the memory of the previous time history. In this work, this hysteretic behaviour has been mostly observed on RC grid capacitances, and particular attention has been paid to time constant simulation. The impact of the hysteresis modelling on the battery voltage response is highlighted in Figure 16, in terms of normalised voltage drops (to outline the response waveforms in the transient phases), with reference to a HPPC test at 0.5 Cr and . The simulation has been performed for SOC = 0.7 for both charge and discharge transients. It is worth noting that, without hysteresis, the voltage drop dynamics are identical for both charge and discharge transients. On the other hand, the hysteresis simulation allows us to reproduce different behaviours depending on the sign of the current flow. In particular, the relaxation times during the discharge phase (−0.5 Cr in Figure 16) increase, while the ones during the charge phase (+0.5 Cr in Figure 16) decrease.
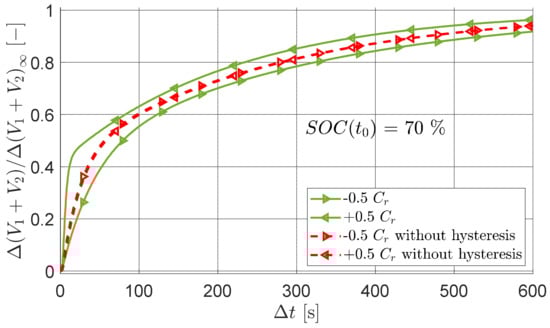
Figure 16.
Impacts of hysteresis simulation on battery voltage response: normalised voltage drops for a HPPC test at SOC = 0.7, 0.5 Cr and (; ).
The reference battery is used in the X-25 Rapier UAV by Sky Eye Systems (Cascina, Italy) as a stand-by energy storage system for the onboard utilities, but it is also evaluated for the HEPS conversion of the UAV, in which the battery is used to power an electrical booster motor. For this reason, after the experimental validation, the model has been employed to evaluate the battery performance during a typical UAV mission, by characterising the reduction in energy efficiency in cruise.
The future developments of the research will focus on the integration of the experimentally validated model of the battery into a high-fidelity UAV simulator, including the vehicle flight dynamics, the main HEPS subsystems (electric booster with related power electronics, ICE, propeller) and the power control and management logics, to be used as a HEPS design platform for lightweight fixed-wing UAVs.
5. Conclusions
A novel generalised approach to the dynamic modelling of batteries, based on a Thevenin circuit with modular hysteretic elements, with parameter dependency on the state of charge, temperature and both the amplitude and sign of the current load, has been proposed. The model also takes into account the hysteretic phenomena by inserting first-order Bouc–Wen models on all circuit elements. The approach’s effectiveness is here demonstrated in simulating the dynamics of the Li-Po battery (1850 mAh, 6 cells, 22.2 V) employed in the lightweight fixed-wing UAV Rapier X-25 developed by Sky Eye Systems (Cascina, Italy). The experimental results obtained via a HPPC campaign test show that a Thevenin circuit composed of two RC grids with hysteretic capacitances provides a good balance between simulation accuracy and computing resources (maximum error on voltage output is 25 mV when SOC > 0.1). The model response is then verified by simulating the entire HPPC test campaign performed on the hardware, and it is finally used to predict the performance in a typical flight mission of the reference UAV, by imposing dynamic current loadings and temperature variations due to altitude. The simulations show a variation in the energy efficiency from 0.93 at take-off to 0.75 in cruise, consolidating the literature observations. Future research developments will focus on the integration of the battery model into a high-fidelity UAV simulator, to be used as a HEPS design platform.
Author Contributions
Conceptualisation, methodology and investigation, A.S. and G.D.R.; software, data curation and writing—original draft preparation, A.S.; validation, formal analysis, writing—review, editing, visualisation and supervision, G.D.R.; resources, project administration, funding acquisition and visualisation, G.M. All authors have read and agreed to the published version of the manuscript.
Funding
This research received no external funding.
Informed Consent Statement
Not applicable.
Data Availability Statement
Not applicable.
Acknowledgments
The authors wish to thank Andrea Ricci, who contributed to defining the experimental set-up as part of his MSc Degree Thesis in Aerospace Engineering at the University of Pisa.
Conflicts of Interest
The authors declare no conflict of interest.
Appendix A
In this section, we report the battery model parameters estimated by employing the Simulink optimisation toolbox proposed by MathWorks in []. All the parameters of the battery model are tabulated in Table A1, Table A2, Table A3, Table A4, Table A5 and Table A6 with respect to the battery temperature (), the C-rate (Cr) and the SOC.
Table A1.
Estimated OCV ( with respect to the SOC, C-rate (Cr) and battery temperature ().
Table A1.
Estimated OCV ( with respect to the SOC, C-rate (Cr) and battery temperature ().
| Cr [−] | ||||||||||||
|---|---|---|---|---|---|---|---|---|---|---|---|---|
| SOC (%) | 100 | 90 | 80 | 70 | 60 | 50 | 40 | 30 | 20 | 10 | 0 | |
| 0 | −0.5 | 25.06 | 24.539 | 23.87 | 23.5 | 23.084 | 22.84 | 22.662 | 22.589 | 22.515 | 22.2 | 20.723 |
| 0.5 | 25.1 | 24.55 | 23.9 | 23.699 | 23.4 | 23 | 22.872 | 22.769 | 22.6 | 22.2 | 20.279 | |
| −1 | 25.133 | 24.65 | 23.832 | 23.6 | 23.23 | 22.95 | 22.73 | 22.552 | 22.443 | 22.2 | 20.862 | |
| 1 | 25.05 | 24.55 | 23.9 | 23.714 | 23.364 | 23.042 | 22.9 | 22.805 | 22.749 | 22.1 | 20.2 | |
| 15 | −0.5 | 25.208 | 24.7 | 23.987 | 23.9 | 23.179 | 23.2 | 22.743 | 22.8 | 22.5 | 22.15 | 20.2 |
| 0.5 | 25.208 | 24.7 | 23.987 | 23.9 | 23.179 | 23.2 | 22.743 | 22.8 | 22.5 | 22.15 | 20.2 | |
| −1 | 25.201 | 24.65 | 24.1 | 23.7 | 23.3 | 23 | 22.872 | 22.77 | 22.5 | 22.22 | 20.875 | |
| 1 | 25.181 | 24.7 | 24.1 | 23.7 | 23.4 | 23 | 22.888 | 22.767 | 22.569 | 22.15 | 20.329 | |
| −1.5 | 25.15 | 24.574 | 23.932 | 23.6 | 23.153 | 22.892 | 22.8 | 22.609 | 22.37 | 22.3 | 20.5 | |
| 1.5 | 25.201 | 24.65 | 24.1 | 23.7 | 23.3 | 23 | 22.872 | 22.77 | 22.5 | 22.22 | 20.875 | |
| 49 | −0.5 | 25.196 | 24.614 | 24.081 | 23.7 | 23.25 | 23.1 | 22.723 | 22.468 | 22.234 | 22.2 | 20 |
| 0.5 | 25.25 | 24.658 | 24.19 | 23.75 | 23.37 | 23 | 22.808 | 22.63 | 22.55 | 22.057 | 19.788 | |
| −1 | 25.149 | 24.576 | 24.044 | 23.7 | 23.167 | 22.883 | 22.7 | 22.453 | 22.334 | 22.1 | 20.875 | |
| 1 | 25.133 | 24.7 | 24.1 | 23.75 | 23.35 | 23 | 22.7 | 22.701 | 22.37 | 22.1 | 20.834 | |
| −1.5 | 25.15 | 24.573 | 24.036 | 23.624 | 23.161 | 22.874 | 22.692 | 22.57 | 22.3 | 22.1 | 20.5 | |
| 1.5 | 25.165 | 24.5 | 24.1 | 23.64 | 23.33 | 23.01 | 22.8 | 22.722 | 22.563 | 22.15 | 21.226 | |
Table A2.
Estimated internal resistance ( as function of the SOC, C-rate (Cr) and battery temperature ().
Table A2.
Estimated internal resistance ( as function of the SOC, C-rate (Cr) and battery temperature ().
| Cr [−] | ||||||||||||
|---|---|---|---|---|---|---|---|---|---|---|---|---|
| SOC (%) | 100 | 90 | 80 | 70 | 60 | 50 | 40 | 30 | 20 | 10 | 0 | |
| 0 | −0.5 | 0.3798 | 0.3825 | 0.3798 | 0.3807 | 0.3852 | 0.3825 | 0.3857 | 0.3825 | 0.3834 | 0.3881 | 0.4348 |
| 0.5 | 0.332 | 0.335 | 0.322 | 0.323 | 0.328 | 0.326 | 0.328 | 0.3306 | 0.33 | 0.35 | 0.6 | |
| −1 | 0.4043 | 0.3492 | 0.3535 | 0.4023 | 0.3286 | 0.3821 | 0.3661 | 0.3466 | 0.351 | 0.3553 | 0.7102 | |
| 1 | 0.3216 | 0.3246 | 0.344 | 0.312 | 0.324 | 0.304 | 0.328 | 0.3306 | 0.3573 | 0.3596 | 0.5345 | |
| 15 | −0.5 | 0.4043 | 0.3492 | 0.3535 | 0.4023 | 0.3286 | 0.3821 | 0.3661 | 0.3466 | 0.351 | 0.3553 | 0.7102 |
| 0.5 | 0.3216 | 0.3246 | 0.344 | 0.312 | 0.324 | 0.304 | 0.328 | 0.3306 | 0.3573 | 0.3596 | 0.5345 | |
| −1 | 0.1619 | 0.1652 | 0.14 | 0.2 | 0.1323 | 0.166 | 0.1602 | 0.1528 | 0.1552 | 0.2 | 0.6 | |
| 1 | 0.1619 | 0.1652 | 0.14 | 0.2 | 0.1323 | 0.166 | 0.1602 | 0.1528 | 0.1552 | 0.2 | 0.6 | |
| −1.5 | 0.18 | 0.17 | 0.16 | 0.1697 | 0.1718 | 0.17 | 0.1667 | 0.18 | 0.1784 | 0.18 | 0.25 | |
| 1.5 | 0.15 | 0.14 | 0.1417 | 0.1308 | 0.1286 | 0.1206 | 0.1477 | 0.1385 | 0.15 | 0.17 | 0.3597 | |
| 49 | −0.5 | 0.1402 | 0.1318 | 0.1022 | 0.1023 | 0.0903 | 0.1025 | 0.101 | 0.105 | 0.096 | 0.1668 | 0.5393 |
| 0.5 | 0.18 | 0.17 | 0.16 | 0.1697 | 0.1718 | 0.17 | 0.1667 | 0.18 | 0.1784 | 0.18 | 0.25 | |
| −1 | 0.027 | 0.0255 | 0.048 | 0.0375 | 0.045 | 0.045 | 0.036 | 0.045 | 0.0375 | 0.0525 | 0.15 | |
| 1 | 0.0462 | 0.0517 | 0.0473 | 0.0495 | 0.0517 | 0.0485 | 0.0476 | 0.0468 | 0.0506 | 0.0572 | 0.1505 | |
| −1.5 | 0.0468 | 0.0487 | 0.0527 | 0.052 | 0.0409 | 0.055 | 0.0528 | 0.0433 | 0.0458 | 0.0484 | 0.21 | |
| 1.5 | 0.055 | 0.055 | 0.0551 | 0.0542 | 0.0549 | 0.0558 | 0.0557 | 0.0542 | 0.055 | 0.0567 | 0.0708 | |
Table A3.
Estimated resistance of RC grid n° 1 ( as function of the SOC, C-rate (Cr) and battery temperature ().
Table A3.
Estimated resistance of RC grid n° 1 ( as function of the SOC, C-rate (Cr) and battery temperature ().
| Cr [−] | ||||||||||||
|---|---|---|---|---|---|---|---|---|---|---|---|---|
| SOC (%) | 100 | 90 | 80 | 70 | 60 | 50 | 40 | 30 | 20 | 10 | 0 | |
| 0 | −0.5 | 0.08 | 0.0787 | 0.0837 | 0.0837 | 0.0854 | 0.0835 | 0.0816 | 0.0792 | 0.0769 | 0.12 | 0.2974 |
| 0.5 | 0.2 | 0.21 | 0.1881 | 0.19 | 0.21 | 0.2038 | 0.2 | 0.1811 | 0.2 | 0.22 | 0.45 | |
| −1 | 0.07 | 0.073 | 0.0751 | 0.076 | 0.072 | 0.0682 | 0.0684 | 0.0683 | 0.0704 | 0.0724 | 0.1514 | |
| 1 | 0.15 | 0.195 | 0.2265 | 0.219 | 0.18 | 0.2056 | 0.2056 | 0.208 | 0.2103 | 0.375 | 1.125 | |
| 15 | −0.5 | 0.07 | 0.073 | 0.0751 | 0.076 | 0.072 | 0.0682 | 0.0684 | 0.0683 | 0.0704 | 0.0724 | 0.1514 |
| 0.5 | 0.15 | 0.195 | 0.2265 | 0.219 | 0.18 | 0.2056 | 0.2056 | 0.208 | 0.2103 | 0.375 | 1.125 | |
| −1 | 0.09 | 0.07 | 0.1 | 0.09 | 0.08 | 0.1 | 0.08 | 0.09 | 0.1 | 0.11 | 0.3 | |
| 1 | 0.0917 | 0.0916 | 0.0917 | 0.097 | 0.1035 | 0.1 | 0.0843 | 0.0848 | 0.1 | 0.1083 | 0.2296 | |
| −1.5 | 0.08 | 0.07 | 0.085 | 0.0714 | 0.0576 | 0.076 | 0.06 | 0.0794 | 0.0711 | 0.1 | 0.4265 | |
| 1.5 | 0.06 | 0.07 | 0.05 | 0.05 | 0.043 | 0.0591 | 0.06 | 0.0636 | 0.06 | 0.0798 | 0.3 | |
| 49 | −0.5 | 0.065 | 0.067 | 0.0683 | 0.065 | 0.067 | 0.0663 | 0.0585 | 0.0728 | 0.0715 | 0.0975 | 0.2275 |
| 0.5 | 0.08 | 0.07 | 0.085 | 0.0714 | 0.0576 | 0.076 | 0.06 | 0.0794 | 0.0711 | 0.1 | 0.4265 | |
| −1 | 0.0244 | 0.0216 | 0.0214 | 0.04 | 0.025 | 0.036 | 0.0354 | 0.03 | 0.029 | 0.05 | 0.3 | |
| 1 | 0.02 | 0.0195 | 0.0191 | 0.0161 | 0.0178 | 0.019 | 0.017 | 0.018 | 0.0179 | 0.042 | 0.5 | |
| −1.5 | 0.0135 | 0.0141 | 0.0144 | 0.0111 | 0.0107 | 0.0106 | 0.0107 | 0.01 | 0.0092 | 0.015 | 0.09 | |
| 1.5 | 0.019 | 0.0215 | 0.0195 | 0.021 | 0.019 | 0.022 | 0.021 | 0.02 | 0.024 | 0.024 | 0.4 | |
Table A4.
Estimated resistance of RC grid n° 2 ( as function of the SOC, C-rate (Cr) and battery temperature ().
Table A4.
Estimated resistance of RC grid n° 2 ( as function of the SOC, C-rate (Cr) and battery temperature ().
| Cr [−] | ||||||||||||
|---|---|---|---|---|---|---|---|---|---|---|---|---|
| SOC (%) | 100 | 90 | 80 | 70 | 60 | 50 | 40 | 30 | 20 | 10 | 0 | |
| 0 | −0.5 | 0.1647 | 0.168 | 0.176 | 0.172 | 0.164 | 0.1767 | 0.1868 | 0.1866 | 0.1865 | 0.2 | 0.52 |
| 0.5 | 0.225 | 0.2115 | 0.2277 | 0.2034 | 0.207 | 0.2115 | 0.215 | 0.2268 | 0.2214 | 0.225 | 0.6847 | |
| −1 | 0.1615 | 0.1554 | 0.1521 | 0.1533 | 0.1548 | 0.1585 | 0.1614 | 0.155 | 0.16 | 0.17 | 0.35 | |
| 1 | 0.215 | 0.2135 | 0.2153 | 0.206 | 0.2 | 0.215 | 0.2089 | 0.205 | 0.21 | 0.25 | 0.95 | |
| 15 | −0.5 | 0.1615 | 0.1554 | 0.1521 | 0.1533 | 0.1548 | 0.1585 | 0.1614 | 0.155 | 0.16 | 0.17 | 0.35 |
| 0.5 | 0.215 | 0.2135 | 0.2153 | 0.206 | 0.2 | 0.215 | 0.2089 | 0.205 | 0.21 | 0.25 | 0.95 | |
| −1 | 0.12 | 0.14 | 0.0855 | 0.1411 | 0.14 | 0.1 | 0.14 | 0.16 | 0.15 | 0.17 | 0.6 | |
| 1 | 0.12 | 0.07 | 0.0855 | 0.11 | 0.08 | 0.09 | 0.11 | 0.13 | 0.11 | 0.12 | 0.4 | |
| −1.5 | 0.1039 | 0.1 | 0.09 | 0.1 | 0.09 | 0.09 | 0.0899 | 0.09 | 0.1 | 0.1271 | 0.5 | |
| 1.5 | 0.11 | 0.09 | 0.1 | 0.1 | 0.09 | 0.09 | 0.0899 | 0.08 | 0.11 | 0.1271 | 0.4 | |
| 49 | −0.5 | 0.0954 | 0.0958 | 0.0945 | 0.0958 | 0.0951 | 0.0945 | 0.0958 | 0.0977 | 0.0983 | 0.0977 | 0.1575 |
| 0.5 | 0.1039 | 0.1 | 0.09 | 0.1 | 0.09 | 0.09 | 0.0899 | 0.09 | 0.1 | 0.1271 | 0.5 | |
| −1 | 0.0142 | 0.024 | 0.025 | 0.026 | 0.0262 | 0.023 | 0.0217 | 0.018 | 0.0307 | 0.1 | 0.35 | |
| 1 | 0.045 | 0.0305 | 0.0286 | 0.026 | 0.03 | 0.035 | 0.0389 | 0.0345 | 0.046 | 0.05 | 1.5 | |
| −1.5 | 0.02 | 0.018 | 0.0168 | 0.023 | 0.0178 | 0.016 | 0.022 | 0.0246 | 0.0228 | 0.05 | 0.26 | |
| 1.5 | 0.051 | 0.052 | 0.053 | 0.054 | 0.053 | 0.052 | 0.051 | 0.052 | 0.055 | 0.06 | 0.2 | |
Table A5.
Estimated capacitance of RC grid n° 1 ( as function of the SOC, C-rate (Cr) and battery temperature ().
Table A5.
Estimated capacitance of RC grid n° 1 ( as function of the SOC, C-rate (Cr) and battery temperature ().
| Cr [−] | ||||||||||||
|---|---|---|---|---|---|---|---|---|---|---|---|---|
| SOC (%) | 100 | 90 | 80 | 70 | 60 | 50 | 40 | 30 | 20 | 10 | 0 | |
| 0 | −0.5 | 285 | 274.8 | 269.7 | 271 | 264.1 | 260.6 | 264.8 | 274.5 | 284.1 | 183.3 | 76.7 |
| 0.5 | 55.5 | 49 | 53.2 | 50.7 | 53 | 54.5 | 53.2 | 55.2 | 48 | 48.2 | 24.4 | |
| −1 | 350 | 318 | 319.1 | 340.3 | 339.2 | 331.8 | 346.2 | 350.6 | 341.5 | 332.4 | 168.5 | |
| 1 | 136.7 | 116.9 | 99.3 | 96.8 | 120 | 99.4 | 99.4 | 97.3 | 95.3 | 57.3 | 18.2 | |
| 15 | −0.5 | 350 | 318 | 319.1 | 340.3 | 339.2 | 331.8 | 346.2 | 350.6 | 341.5 | 332.4 | 168.5 |
| 0.5 | 136.7 | 116.9 | 99.3 | 96.8 | 120 | 99.4 | 99.4 | 97.3 | 95.3 | 57.3 | 18.2 | |
| −1 | 207.4 | 210 | 187.3 | 201.5 | 215 | 190 | 220 | 214.8 | 165.6 | 157.6 | 77.8 | |
| 1 | 310.9 | 297.6 | 303.5 | 356.2 | 372 | 339.5 | 360 | 339.9 | 362.8 | 254.4 | 60.5 | |
| −1.5 | 259.1 | 248 | 252.9 | 296.8 | 310 | 282.9 | 300 | 283.3 | 302.4 | 212 | 50.4 | |
| 1.5 | 425 | 371.4 | 560 | 582.3 | 539.1 | 431.2 | 547.9 | 393.1 | 440.6 | 376.1 | 92.5 | |
| 49 | −0.5 | 375 | 370 | 373.3 | 387.7 | 367.4 | 369.5 | 370 | 357.7 | 330 | 300 | 100 |
| 0.5 | 475 | 571.4 | 411.8 | 592.9 | 565.1 | 519.7 | 636.7 | 490.3 | 506.3 | 359 | 82.1 | |
| −1 | 730 | 780 | 750 | 650 | 700 | 680.6 | 670.5 | 700 | 689.7 | 433.1 | 83.3 | |
| 1 | 1275 | 1450 | 1380 | 1350 | 1421.9 | 1450 | 1364.7 | 1515.3 | 1250 | 800 | 40 | |
| −1.5 | 814.8 | 922 | 833.3 | 936.9 | 996.8 | 995.3 | 995.3 | 903.6 | 1018.9 | 800 | 111.1 | |
| 1.5 | 2050 | 2150 | 1980 | 2150 | 2150 | 1950 | 2105 | 2122.7 | 2000 | 1000 | 112.5 | |
Table A6.
Estimated capacitance of RC grid n° 2 ( as function of the SOC, C-rate (Cr) and battery temperature ().
Table A6.
Estimated capacitance of RC grid n° 2 ( as function of the SOC, C-rate (Cr) and battery temperature ().
| Cr [−] | ||||||||||||
|---|---|---|---|---|---|---|---|---|---|---|---|---|
| SOC (%) | 100 | 90 | 80 | 70 | 60 | 50 | 40 | 30 | 20 | 10 | 0 | |
| 0 | −0.5 | 1777.6 | 1666.7 | 1613.6 | 1651.2 | 1746.3 | 1576.3 | 1491.2 | 1495.1 | 1499 | 1365.9 | 546.2 |
| 0.5 | 1163.1 | 1192 | 1193 | 1215 | 1218 | 1218 | 1202.6 | 1200 | 1182 | 1200 | 805 | |
| −1 | 1981.4 | 1995.5 | 2005.3 | 2089.6 | 2026.4 | 1976.3 | 1962.2 | 1967.7 | 1812.5 | 1856.5 | 857.1 | |
| 1 | 1441.9 | 1498.8 | 1463.1 | 1577.7 | 1690 | 1441.9 | 1460 | 1487.8 | 1523.8 | 1400 | 384.2 | |
| 15 | −0.5 | 1981.4 | 1995.5 | 2005.3 | 2089.6 | 2026.4 | 1976.3 | 1962.2 | 1967.7 | 1812.5 | 1856.5 | 857.1 |
| 0.5 | 1441.9 | 1498.8 | 1463.1 | 1577.7 | 1690 | 1441.9 | 1460 | 1487.8 | 1523.8 | 1400 | 384.2 | |
| −1 | 3500 | 3085.7 | 2964 | 3443.2 | 3450 | 3000 | 3500 | 3000 | 2923.9 | 2470.6 | 101.6 | |
| 1 | 2480 | 2571.4 | 2470 | 2869.3 | 2875 | 2500 | 2142.9 | 1863 | 2436.6 | 2058.8 | 84.6 | |
| −1.5 | 3754.5 | 3800 | 4388.9 | 3850 | 4422.2 | 4222.2 | 4394.9 | 4277.8 | 3900 | 2989.5 | 770 | |
| 1.5 | 3181.8 | 3190 | 3150 | 3100 | 3555.6 | 3333.3 | 3290 | 3125 | 3090 | 3000 | 500 | |
| 49 | −0.5 | 4610 | 4699.2 | 4814.8 | 4751.5 | 4814.5 | 4656.1 | 4751.5 | 4659.5 | 4985.8 | 4608.3 | 2888.9 |
| 0.5 | 4332.1 | 4400 | 4611.1 | 4100 | 4666.7 | 4444.4 | 5563.2 | 5000 | 5050 | 3304.2 | 800 | |
| −1 | 15,000 | 14,583.3 | 13,800 | 13,653,8 | 13,923.2 | 15,304.3 | 16,613.9 | 14,500 | 11,390.1 | 12,500 | 616.7 | |
| 1 | 12,580 | 12,580 | 12,395 | 12,385 | 12,398 | 12,857.1 | 12,000 | 11,385 | 11,390 | 10,380 | 3085 | |
| −1.5 | 20,000 | 22,000 | 20,500 | 20,543.5 | 20,500 | 20,000 | 21,477.3 | 18,473.6 | 20,597.5 | 11,900 | 2019.2 | |
| 1.5 | 15,196.1 | 15,149.6 | 13,808.8 | 13,657.4 | 14,386.8 | 14,038.5 | 14,460.8 | 14,423.1 | 13,863.6 | 13,333.3 | 3937.5 | |
Appendix B
To introduce the identified battery parameters presented in the next section and to better show the parameters’ hysteretic behaviour on the RC grid voltage drop, a reduced case is proposed hereafter in which only the capacitor is affected by hysteresis. The generic j-th RC grid voltage drop dynamic with only a hysteretic capacitor can be described by
Thanks to the simplified model proposed, it is possible to easily obtain a closed-form solution for the hysteretic displacement as follows:
where and are the initial amount of the battery and hysteretic charge, respectively. By rearranging Equation (A3), we can finally obtain
As an example, the impact of the hysteretic capacitance on the RC grid voltage dynamics is reported in Figure A1 by considering a solution with and . As can be seen from Figure A1a, the dynamic response of the RC grid voltage (yellow line) under a charging/discharging cycle (blue line) highly depends not only on the cycle phase but also on the cycle history, namely its initial state, as evident from (6). In the proposed solution, a charging cycle implies an increase in the hysteretic capacitance (Figure A1b) and hence a reduction in the characteristic time of the RC grid, and vice versa for the discharging case.

Figure A1.
RC grid dynamics with and without hysteretic capacitor during charging and discharging cycles: (a) normalised voltage response; (b) capacitor capacity cycle.
References
- Chan, C.C. The state of the art of electric and hybrid vehicles. Proc. IEEE 2002, 90, 247–275. [Google Scholar] [CrossRef]
- Lu, W.; Zhang, D.; Zhang, J.; Li, T.; Hu, T. Design and implementation of a gasoline-electric hybrid propulsion system for a micro triple tilt-rotor VTOL UAV. In Proceedings of the 2017 6th Data Driven Control and Learning Systems (DDCLS), Chongqing, China, 26–27 May 2017. [Google Scholar] [CrossRef]
- Wall, T.J.; Meyer, R. A Survey of Hybrid Electric Propulsion for Aircraft. In Proceedings of the 53rd AIAA/SAE/ASEE Joint Propulsion Conference, Atlanta, GA, USA, 10–12 July 2017. [Google Scholar] [CrossRef]
- Harmon, F.G.; Frank, A.A.; Chattot, J.-J. Conceptual design and simulation of a small hybrid-electric unmanned. J. Aircr. 2006, 43, 1490–1498. [Google Scholar] [CrossRef]
- Hiserote, R.; Harmon, F. Analysis of hybrid-electric propulsion system designs for small unmanned aircraft systems. In Proceedings of the 8th Annual International Energy Conversion Engineering Conference, Nashville, TN, USA, 25–28 July 2010. [Google Scholar] [CrossRef]
- Hugo, J.Y.; Gonzalez, L. On Parallel Hybrid-Electric propulsion System for Unmanned Aerial Vehicles Energy-efficient electric machines. Prog. Aerosp. Sci. 2012, 51, 1–17. [Google Scholar] [CrossRef]
- Xie, Y.; Savvaris, A.; Tsourdos, A.; Laycock, J.; Farmer, A. Modelling and Control of a Hybrid Electric Propulsion System for Unmanned Aerial Vehicles. In Proceedings of the 2018 IEEE Aerospace Conference, Big Sky, MT, USA, 3–10 March 2018. [Google Scholar] [CrossRef]
- Suti, A.; Di Rito, G.; Galatolo, R. Climbing performance enhancement of small fixed-wing UAVs via hybrid electric propulsion. In Proceedings of the 2021 IEEE Workshop on Electrical Machines Design, Control and Diagnosis (WEMDCD), Modena, Italy, 8–9 April 2021. [Google Scholar] [CrossRef]
- Sky Eye Systems. Available online: https://www.skyeyesystems.it/ (accessed on 31 October 2022).
- Chen, W.; Liang, J.; Yang, Z.; Li, G. A Review of Lithium-Ion Battery for Electric Vehicle Applications and Beyond. Energy Procedia 2019, 158, 4363–4368. [Google Scholar] [CrossRef]
- Miao, Y.; Hynan, P.; von Jouanne, A.; Yokochi, A. Current Li-Ion Battery Technologies in Electric Vehicles and Opportunities for Advancements. Energies 2019, 12, 1074. [Google Scholar] [CrossRef]
- Ghiji, M.; Novozhilov, V.; Moinuddin, K.; Joseph, P.; Burch, I.; Suendermann, B.; Gamble, G. A Review of Lithium-Ion Battery Fire Suppression. Energies 2020, 13, 5117. [Google Scholar] [CrossRef]
- Sanad, M.M.S.; Azab, A.A.; Taha, T.A. Inducing lattice defects in calcium ferrite anode materials for improved electrochemical performance in lithium-ion batteries. Ceram. Int. 2022, 48, 12537–12583. [Google Scholar] [CrossRef]
- Nitta, N.; Wu, F.; Lee, J.T.; Yushin, G. Li-ion battery materials: Present and future. Mater. Today 2015, 18, 5. [Google Scholar] [CrossRef]
- Sanad, M.M.S.; Toghan, A. Unveiling the role of trivalent cation incorporation in Li-rich Mn-based layered cathode materials for low-cost lithium-ion batteries. Appl. Phys. 2021, 127, 733. [Google Scholar] [CrossRef]
- Damiano, A.; Porru, M.; Salimbeni, A.; Serpi, A.; Castiglia, V.; Di Tommaso, A.O.; Miceli, R.; Schettino, G. Batteries for Aerospace: A Brief Review. In Proceedings of the 2018 AEIT International Annual Conference, Bari, Italy, 3–5 October 2018. [Google Scholar] [CrossRef]
- Manetti, A.; Abba, A.; Merati, A.; Savaresi, S.M.; Geraci, A. A new BMS Architecture Based on Cell Redundancy. IEEE Trans. Ind. Electron. 2011, 58, 9. [Google Scholar] [CrossRef]
- Qi, J.; Lu, D.D.-C. Review of battery cell balancing techniques. In Proceedings of the 2014 Australasian Universities Power Engineering Conference (AUPEC), Perth, WA, Australia, 28 September–1 October 2014. [Google Scholar] [CrossRef]
- Khalid, A.; Stevenson, A.; Sawarat, A.I. Overview of Technical Specifications for Grid-Connected Microgrid Battery Energy Storage Systems. IEEE Access 2021, 9, 163554–163593. [Google Scholar] [CrossRef]
- Khalid, A.; Sawarat, A.I. Battery Module Performance Analysis under Varying Interconnection Topology for Electric Vehicles. In Proceeding of the 2019 IEEE Transportation Electrification Conference (ITEC-India), Bengaluru, India, 17–19 December 2019. [Google Scholar] [CrossRef]
- Tamilselvi, S.; Gunasundari, S.; Karuppiah, N.; Razak RK, A.; Madhusudan, S.; Nagarajan, V.M.; Sathish, T.; Shamim, M.Z.M.; Saleel, C.A.; Afzal, A. A Review on Battery Modelling Techniques. Sustainability 2021, 13, 10042. [Google Scholar] [CrossRef]
- Smith, K.; Wang, C.-Y. Solid-state diffusion limitations on pulse operation of a lithium ion cell for hybrid electric vehicles. J. Power Source 2006, 161, 628–639. [Google Scholar] [CrossRef]
- Seaman, A.; Dao, T.-S.; McPhee, J. A survey of mathematics-based equivalent-circuit and electrochemical battery models for hybrid and electric vehicle simulation. J. Power Source 2014, 256, 410–423. [Google Scholar] [CrossRef]
- Hutzenalaub, T.; Thiele, S.; Paust, N.; Spotnitz, R.; Zengerle, R.; Walchshofer, C. Three-dimensional electrochemical Li-ion battery modelling featuring a focused ion-beam/scanning electron microscopy based three-phase reconstruction of a LiCoO2 cathode. Electrochim. Acta 2014, 115, 131–139. [Google Scholar] [CrossRef]
- Manwell, J.F.; McGrowan, J.G. Lead acid battery storage model for hybrid energy systems. Solar Energy 1993, 50, 399–405. [Google Scholar] [CrossRef]
- Fotouhi, A.; Auger, D.J.; Propp, K.; Longo, S.; Wild, M. A review on electric vehicle battery modelling: From Litium-ion toward Lithium-Sulphur. Renew. Sustain. Energy Rev. 2016, 56, 1008–1021. [Google Scholar] [CrossRef]
- Rodrigues, L.M.; Montez, C.; Moraes, R.; Portugal, P.; Vasques, F. A Temperature-Dependent Battery Model for Wireless Sensor Networks. Sensors 2017, 17, 422. [Google Scholar] [CrossRef]
- Chiasserini, C.-F.; Rao, R.R. Improving battery performance by using traffic shaping techniques. IEEE J. Sel. Areas Commun. 2001, 19, 1385–1394. [Google Scholar] [CrossRef]
- Tao, L.; Ma, J.; Cheng, Y.; Noktehdan, A.; Chong, J.; Lu, C. A review of stochastic battery model and health management. Renew. Sustain. Energy Rev. 2017, 80, 716–732. [Google Scholar] [CrossRef]
- Chen, M.; Rincon-Mora, G.A. Accurate electrical battery model capable of predicting runtime and I-V performance. IEEE Trans. Energy Convers. 2006, 21, 504–511. [Google Scholar] [CrossRef]
- El Ghossein, N.; Salameh, J.P.; Karami, N.; El Hassan, M.; Najjar, M.B. Survey on electrical modelling methods applied on different battery types. In Proceedings of the 2015 Third International Conference on Technological Advances in Electrical, Electronics and Computer Engineering (TAEECE), Beirut, Lebanon, 29 April–1 May 2015. [Google Scholar] [CrossRef]
- Feng, D.; Huang, J.; Jin, P.; Chen, H.; Wang, A.; Zheng, M. Parameter Identification and Dynamic Simulation of Lithium-Ion Power Battery Based on DP Model. In Proceedings of the 2019 14th IEEE Conference on Industrial Electronics and Applications (ICIEA), Xi’an, China, 19–21 June 2019. [Google Scholar] [CrossRef]
- Frivaldsky, M.; Simcak, M. Evaluation of the Accuracy of the Identified Equivalent Electrical Circuit of LiPePO4 Battery through Verified Measurements. Batteries 2022, 8, 38. [Google Scholar] [CrossRef]
- Di Rito, G.; Suti, A.; Ricci, A.; Galatolo, R.; Mattei, G. Experimental characterisation of Li-Po battery packs and BLDC machines for hybrid propulsion systems of lightweight UAVs. In Proceedings of the 2022 IEEE 9th International Workshop on Metrology for AeroSpace (MetroAeroSpace), Pisa, Italy, 27–29 June 2022. [Google Scholar] [CrossRef]
- Westerhoff, U.; Kurbach, K.; Lienesch, F.; Kurrat, M. Analysis of Lithium-Ion Battery Models Based on Electrochemical Impedance Spectroscopy. Energy Technol. 2016, 4, 1620–1630. [Google Scholar] [CrossRef]
- Choi, W.; Shin, H.-C.; Kim, J.M.; Choi, J.-Y.; Yoon, W.-S. Modeling and Applications of Electrochemical Impedance Spectroscopy (EIS) for Lithium-ion Batteries. J. Electrochem. Sci. Technol. 2020, 11, 1–13. [Google Scholar] [CrossRef]
- Paccha-Herrera, E.; Calderón-Muñoz, W.R.; Orchard, M.; Jaramillo, F.; Medjaher, K. Thermal Modeling Approaches for a LiCoO2 Lithium-ion Battery—A Comparative Study with Experimental Validation. Batteries 2020, 6, 40. [Google Scholar] [CrossRef]
- Iurilli, P.; Brivio, C.; Wood, V. On the use of electrochemical impedance spectroscopy to characterize and model the aging phenomena of lithium-ion batteries: A critical review. J. Power Source 2021, 505, 229860. [Google Scholar] [CrossRef]
- Boujoudar, Y.; Elmoussaoui, H.; Lamhamdi, T. Lithium-ion batteries modeling and state of charge estimation using artificial neural network. Int. J. Electr. Comput. Eng. 2019, 9, 3415–3422. [Google Scholar] [CrossRef]
- Almeida, G.C.S.; Souza, A.C.Z.d.; Ribeiro, P.F. A Neural Network Application for a Lithium-Ion Battery Pack State-of-Charge Estimator with Enhanced Accuracy. Proceedings 2020, 58, 33. [Google Scholar] [CrossRef]
- Cui, Z.; Dai, J.; Sun, J.; Li, D.; Wang, L.; Wang, K. Hybrid Methods Using Neural Network and Kalman Filter for the State of Charge Estimation of Lithium-Ion Battery. Math. Probl. Eng. 2022, 2022, 9616124. [Google Scholar] [CrossRef]
- Jin, Y.; Zhao, W.; Li, Z.; Liu, B.; Wang, K. SOC estimation of lithium-ion battery considering the influence of discharge rate. Energy Rep. 2021, 7, 1436–1446. [Google Scholar] [CrossRef]
- Angermeier, S.; Ketterer, J.; Karcher, C. Liquid-Based Battery Temperature Control of Electric Buses. Energies 2020, 13, 4990. [Google Scholar] [CrossRef]
- Sequino, L.; Eancaruso, E.; Vaglieco, B.M. Modeling Study of the Battery Pack for the Electric Conversion of a Commercial Vehicle. In Proceedings of the 15th International Conference on Engines & Vehicles, Capri, Italy, 12–16 September 2021. [Google Scholar] [CrossRef]
- Zhang, Z.; Tian, X.; Ge, X. Dynamic Characteristics of the Bouc–Wen Nonlinear Isolation System. Appl. Sci. 2021, 11, 6106. [Google Scholar] [CrossRef]
- Maxamps. Lithium Batteries. Available online: https://maxamps.com/products/lipo-1850-6s-22-2v-battery-pack (accessed on 2 November 2022).
- García-Plaza, M.; Carrasco, J.; Peña-Asensio, A.; Alonso-Martínez, J.; Arnaltes Gómez, S. Hysteresis effect influence on electrochemical battery modeling. Electr. Power Syst. Res. 2017, 152, 27–35. [Google Scholar] [CrossRef]
- Yamada, A.; Koizumi, H.; Sonoyama, N.; Kanno, R. Phase Change in LixFePO4. Electrochem. Solid-State Lett. 2005, 8, A409–A413. [Google Scholar] [CrossRef]
- Morgan, D.; van der Ven, A.; Ceder, G. Li Conductivity in Lix MPO4 (M=Mn, Fe, Co, Ni) Olivine Materials. Electrochem. Solid-State Lett. 2003, 7, A30–A32. [Google Scholar] [CrossRef]
- Srinivasan, V.; Newman, J. Discharge Model for the Lithium Iron-Phosphate Electrode. J. Electrochem. Soc. 2004, 9, A1517–A1529. [Google Scholar] [CrossRef]
- Srinivasan, V.; Newman, J. Existence of Path-Dependence in the LiFePO4 Electrode. Electrochem. Solid-State Lett. 2006, 10, A110–A114. [Google Scholar] [CrossRef]
- Dreyer, W.; Jamnik, J.; Guhlke, C.; Huth, R.; Moškon, J.; Gaberšček, M. The thermodynamic origin of hysteresis in insertion batteries. Nat. Mater. 2010, 9, 448–453. [Google Scholar] [CrossRef]
- He, Y.; He, R.; Guo, B.; Zhang, Z.; Yang, S.; Liu, X.; Zhao, X.; Pan, Y.; Yan, X.; Li, S. Modeling of Dynamic Hysteresis Characters for the Lithium-Ion Battery. J. Electrochem. Soc. 2020, 167, 090532. [Google Scholar] [CrossRef]
- Zheng, T.; McKinnon, W.R.; Dahn, J.R. Hysteresis during Lithium Insertion in Hydrogen-Containing Carbons. J. Electrochem. Soc. 1996, 143, 2137–2145. [Google Scholar] [CrossRef]
- Baronti, F.; Femia, N.; Saletti, R.; Visone, C.; Zamboni, W. Preisach modelling of lithium-iron-phosphate battery hysteresis. J. Energy Storage 2015, 4, 51–61. [Google Scholar] [CrossRef]
- Hassani, V.; Tjahjowidodo, T.; Nho Do, T. A survey on hysteresis modeling, identification and control. Mech. Syst. Signal Process. 2014, 49, 209–233. [Google Scholar] [CrossRef]
- Ikhouane, F. A survey of the Hysteretic Duhem Model. Arch. Comput. Methods Eng. 2017, 25, 965–1002. [Google Scholar] [CrossRef]
- Liu, Y.; Liu, H.; Wu, H.; Zou, D. Modelling and compensation of hysteresis in piezoelectric actuators based on Maxwell approach. IET Electron. Lett. 2016, 52, 188–190. [Google Scholar] [CrossRef]
- Baronti, F.; Zamboni, W.; Fermia, N.; Roncella, R.; Saletti, R. Experimental analysis of open- circuit voltage hysteresis in lithium-iron-phosphate batteries. In Proceedings of the IECON 2013—39th Annual Conference of the IEEE Industrial Electronics Society, Vienna, Austria, 10–13 November 2013. [Google Scholar] [CrossRef]
- Lei, X.; Zhao, X.; Wang, G.; Liu, W. A Novel Temperature–Hysteresis Model for Power Battery of Electric Vehicles with an Adaptive Joint Estimator on State of Charge and Power. Energies 2019, 12, 3621. [Google Scholar] [CrossRef]
- Antonucci, V.; Artale, G.; Brunaccini, G.; Caravello, G.; Cataliotti, A.; Cosentino, V.; Di Cara, D.; Ferraro, M.; Guaiana, S.; Panzavecchia, N.; et al. Li-ion Battery Modeling and State of Charge Estimation Method Including the Hysteresis Effect. Electronics 2019, 8, 1324. [Google Scholar] [CrossRef]
- Madani, S.S.; Schaltz, E.; Knudsen Kær, S. An Electrical Equivalent Circuit Model of a Lithium Titanate Oxide Battery. Batteries 2019, 5, 31. [Google Scholar] [CrossRef]
- Farnel, Bench Power Supply. Available online: https://it.farnell.com/tenma/72-2540/alimentatore-1-canale-30v-5a-prog/dp/2445412?gclid=CjwKCAiAvK2bBhB8EiwAZUbP1OpLjFFBAcZ14BSO57kkLHU-ofiOVa7v7j3n12pA7IKxb471UPRINBoC2akQAvD_BwE&mckv=_dc|pcrid||plid||kword||match||slid||product|2445412|pgrid||ptaid|&CMP=KNC-GIT-GEN-SHOPPING-PMAX-Low-Roas_26-Sept-22&gross_price=true (accessed on 2 November 2022).
- Rigol. Possibilities and more. Available online: https://www.rigolitalia.it/products/carico-programmabile-rigol-dl3031-350w-150v-60a (accessed on 4 November 2022).
- Conrad. VOLTCRAFT V-Charger 240 Quadro Scale Model. Available online: https://www.conrad.com/p/voltcraft-v-charge-240-quadro-scale-model-multifunction-charger-12-v-230-v-12-a-lipolymer-lifepo-li-ion-lihv-nicd-1489899 (accessed on 5 November 2022).
- Keysight. Available online: https://www.keysight.com/us/en/products/modular/data-acquisition-daq/digital-acquisition-benchtop-system/daq970a-data-acquisition-system.html (accessed on 5 November 2022).
- Gandolfo, D.; Brandão, A.; Patiño, D.; Molina, M. Dynamic model of lithium polymer battery—Load resistor method for electric parameters identification. J. Energy Inst. 2015, 88, 470–479. [Google Scholar] [CrossRef]
- Yu, Y.; Narayan, N.; Vega-Garita, V.; Popovic-Gerber, J.; Qin, Z.; Wagemaker, M.; Bauer, P.; Zeman, M. Constructing Accurate Equivalent Electrical Circuit Models of Lithium Iron Phosphate and Lead–Acid Battery Cells for Solar Home System Applications. Energies 2018, 11, 2305. [Google Scholar] [CrossRef]
- Mathworks, Generate Parameter Data for Equivalent Circuit Battery Block. Available online: https://www.mathworks.com/help/autoblks/ug/generate-parameter-data-for-estimations-circuit-battery-block.html (accessed on 25 September 2022).
- Rftekhari, A. Energy efficiency: A critically important but neglected factor in battery research. Sustain. Energy Fuels 2017, 1, 2053–2060. [Google Scholar] [CrossRef]
Publisher’s Note: MDPI stays neutral with regard to jurisdictional claims in published maps and institutional affiliations. |
© 2022 by the authors. Licensee MDPI, Basel, Switzerland. This article is an open access article distributed under the terms and conditions of the Creative Commons Attribution (CC BY) license (https://creativecommons.org/licenses/by/4.0/).