Article

Economic Analysis of P2G Green Hydrogen Generated by Existing Wind Turbines on Jeju Island

Korean Register, 36, Myeongji-Ocean City 9-ro, Gangseo-gu, Busan 46762, Republic of Korea
*
Authors to whom correspondence should be addressed.
Energies 2022, 15(24), 9317; https://doi.org/10.3390/en15249317
Submission received: 30 October 2022 / Revised: 14 November 2022 / Accepted: 23 November 2022 / Published: 8 December 2022

Abstract

:
Every wind turbine is subject to fluctuations in power generation, depending on climatic conditions. When electricity supply exceeds demand, wind turbines are forced to implement curtailment, causing a reduction in generation efficiency and commercial loss to turbine owners. Since the frequency and amount of curtailment of wind turbines increases as the amount of renewable energy become higher on Jeju Island in South Korea, Jeju is configuring a Power to Gas (P2G) water-electrolysis system that will be connected to an existing wind farm to use the “wasted energy”. In this study, economic analysis was performed by calculating the production cost of green hydrogen, and sensitivity analysis evaluated the variance in hydrogen cost, depending on several influential factors. Approaches to lower hydrogen costs are necessary for the following reasons. The operating company needs a periodical update of hydrogen sale prices by reflecting a change in the system margin price (SMP) with the highest sensitivity to hydrogen cost. Technical development to reduce hydrogen costs in order to reduce power consumption for producing hydrogen and a decrease in annual reduction rate for the efficiency of water electrolysis is recommended. Discussions and research regarding government policy can be followed to lower the hydrogen cost.

1. Introduction

The supply of renewable energy, such as wind and solar power, has steadily increased on Jeju Island, South Korea. Due to good climatic conditions, the proportion of generation capacity for renewable energy on Jeju Island accounts for 66.8% of the total capacity as of 2021 [1]. To promote renewable energy supply more, Jeju Special Self-Governing Province has announced the “CFI 2030 (Carbon Free Island 2030)” policy and set a goal for 100% of its electricity to be renewable energy on Jeju Island by 2030 [2].
Renewable energies on Jeju Island mainly consist of wind power and solar power. The generation of these two powers is affected by climate change and climate change leads to fluctuations in output from the generators; hence, this fluctuation directly affects the amount of electricity acquired from the generators. Sometimes, the amount of electricity required on the island is smaller than the total demand due to insufficient generation of renewable energy when the climatic conditions are not good and this will cause a shortage of electricity, even leading to a black-out in the worst case. Contrarily, extra electricity may be left when the supply exceeds the demand if the weather conditions are good. This extra electricity might not be provided to consumers but be discarded to maintain generation capacity “as planned” in the whole electricity supply system. According to the power-supply system principle, Korea Electric Power Corporation (KEPCO) controls the whole power supply as “slightly over” 10% of the maximum demand to retain a stable electricity supply [3]. Due to this principle and variable characteristics of renewable energy, power supply in renewable energy creates an “over supply situation”, comparatively more than other energy sources.
In this regard, the provision of electricity from renewable power to the grid system is restricted or limited when the power supply exceeds the demand. Surplus electricity is created due to the limitation and this extra energy cannot be used (i.e., wasted) for generation. For wind power, this limitation is called “curtailment”. This curtailed electricity refers to electricity that is not commercially available (i.e., cannot be sold to KEPCO) due to excessive electricity supply compared to demand under the normal operating conditions of wind turbines, in a range of the cut-in speed to the cut-out speed of wind.
As the ratio of wind power generation is higher than that of other regions on Jeju Island and its amount is also increasing, the amount of curtailment increases accordingly. In recent years, the frequency of curtailment on Jeju Island has increased dramatically since 2015, when curtailment first occurred, increasing from 3 times in 2015 to 77 times in 2020. The amount of curtailed energy increased to 2.1-times that of the last year as of 2020, as shown in Table 1.
Curtailment lowers the energy efficiency of wind power and economic feasibility in the renewable energy market. Increasing curtailment makes governments or developers hesitant to decide on additional investment in renewable energy businesses.
Recently, an approach to commercializing extra electricity made from curtailment to other products covering wind power’s disadvantage is being conducted on Jeju Island. The plan is that extra electricity that is to be discarded from wind turbines will be supplied to water electrolysis to be used as a “material” in producing hydrogen during electrolysis [5]. This water electrolysis will be installed near the existing wind farm on Jeju Island and be connected to wind turbines there, where the electricity will be used in the electrolyzing process. Hydrogen from the water electrolysis will be distributed to H2 charging stations throughout Jeju Island and used as a new energy source. This system is called P2G (Power to Gas).
This business aims to provide a new energy source by converting and storing extra electricity from wind power and contributing to stabilizing the hydrogen supply chain on Jeju Island. In the past, a pilot water-electrolysis facility was installed near another wind farm on the island [6]. However, the project’s purpose was focused on research for developing water-electrolyzing technology and verification of the performance of the facility, not on commercialization, because the capacity of the water electrolysis is relatively small (500 kW). This business is facilitating a total of 3.3 MW capacity of water electrolysis to supply hydrogen sufficiently. In this study, an economic evaluation of hydrogen was made by estimating hydrogen production cost, which will be reflected in the future determination of hydrogen sale prices.

2. Difference with Other Studies and Impact of the Result of This Study

2.1. Difference with Other Studies

Similar studies have been published regarding estimating hydrogen costs related to renewable energies; however, this study differs from them as follows.
The most notable difference from previous studies [7,8,9,10,11,12] is that suggestions are given to lower hydrogen costs further than the estimated cost in the analysis, not limited to providing the hydrogen cost under given conditions made by the operation plan. In particular, the proposal of producing hydrogen by absorbing (transfer or transaction) curtailed electricity, not only from physically connected wind farms but also in neighboring farms, which are not connected to the water electrolysis, is given to lower the cost. This approach may bring a new paradigm for the power-trading system in the renewable energy market and contribute to dramatically lowering the green hydrogen cost (over 20%) globally.
In addition, another proposal to lower the hydrogen cost further by commercializing oxygen, which is another product generated through the electrolysis of water in addition to hydrogen, was suggested in this study. Although the profits from trading oxygen will not affect the profits from hydrogen sales, the hydrogen cost is expected to be reduced by sharing expenses for facilities investments and raw materials to hydrogen and oxygen production cost with a specific ratio. If this two-way trading system is organized simultaneously at one site, it will affect investment and construction of green hydrogen-production facilities worldwide in the future.
This study investigated facility configuration and production efficiency of respective equipment (Power-supply system, Power-conversion system, etc.). Their values were considered when calculating the amount of electricity to minimize deviations against the actual supply rate. Contrastingly, in previous studies, the representative design specification of power supply capacity was applied to estimate the amount of electricity and hydrogen [7,8,11].
In other studies, production efficiencies of respective water-electrolysis stacks (alkaline and polymer electrolyte membrane (PEM)) were considered during the calculation of hydrogen amount, which should be estimated to expect hydrogen cost in advance [7,9,11]. Adding to the research, the annual reduction rate of stack efficiency due to the aging of the equipment was considered and the decrease in the production of hydrogen amount year by year was reflected in addition to its “initial production efficiency” in this study.
The levelized cost of hydrogen (LCOH) technique was applied to determine hydrogen cost in this study. However, a breakdown of each element in expecting expenditures was considered, and total expenses were arranged in time series while leveling the cost rather than simple leveling.
In a previous study, capital expenditure (CAPEX) was assumed to be a specific price [7] or the price was set proportionally based on the amount of supplied electricity (i.e., USD per kW) [8,10]. At the same time, actual budgets assigned to respective design, procurement, and construction companies are summated to CAPEX as of current monetary value in this study. Furthermore, the business period for estimating hydrogen cost was set to be over the lifetime of major equipment, such as stacks, to cover each facility replacement. The cost incurred in the equipment replacement was allocated to the depreciation cost of corresponding accounting years at a specific rate from the replacement year. The replacement costs were also reflected in the total investment cost.
In this study, a virtual accounting sheet, including a balance sheet, cash flow, and internal rate of return, which reflects the project’s financial status, was made where a Special Purpose Company (SPC) will be established after the construction of P2G hydrogen-production facilities. In calculating operating expenditure (OPEX), the assumption of OPEX as a specific ratio against CAPEX [7,9,10] was made, or an expense estimation in proportion to the amount of electricity used [8] in several pieces of research. These different techniques led to the significant implication that OPEX occupies around 82% of the total cost and 4.4-times CAPEX (as of Scenario I to be referred to in Section 6) based on the result with a company’s accounting sheet in this study, whereas OPEX was normally considered only as 3% to 4% of CAPEX in other studies.
This huge amount of OPEX is not unusual for this project because most of it is occupied by raw material (e.g., electricity and tap water) expenses, and the electricity expenses are much higher than other expenses in South Korea. Electricity cost depends on the system margin price (SMP) prescribed by the Korean Government and has been increasing recently. If the same technique is applied in this study, as in other studies, a risk of a significant deviation might occur in determining hydrogen price.
Otherwise, in previous studies [7,8,9,10,11,12], expenses were calculated for each fiscal year rather than estimated expenses for the entire business period. The general operating expense was calculated by breaking down costs based on the expected salaries for the company to be established (SPC), considering the number of employees required. Each element of general operating expense was calculated by the parameters related to the government’s renewable energy policy (SMP, REC, etc.) or by applying the historical ratio of three similar facility operation companies nearby, or by a specific ratio of operation and maintenance (O&M) costs. In addition, the regional characteristic was considered annually in accounting OPEX, such as supporting fees to neighboring villages to contribute to other power-generation companies.
In previous studies, discount rate was applied to every expense equally [8,10,12] when calculating the LCOH; however, each element cost was considered as monetary value at the time of the respective year, reflecting inflation rate (or not) or reflecting wage growth rate (or not) selectively. Further, the two abovementioned reference values were acquired and averaged from the value of similar items over the past three years based on the National Statistics and past performances in a similar company instead of a simple estimation.
Some studies suggested sole hydrogen price based on only one case [10,11,12]; otherwise, seven hydrogen costs were made and compared by configuring scenarios with different operating days, operating hours, and operating time zones in this study. As the number of operating days and hours varies, general operating expenses for the company, including labor expenses, change according to the required number of operating personnel (two vs. six persons due to working in shifts) and their overtime work salaries.
In addition, a variance in working time leads to a change in SMP, determined by the time zone prescribed by the Ministry of Trade, Industry, and Energy in South Korea. This SMP change affects raw material expenses (i.e., purchasing price of electricity) accordingly. This comparison provided the conclusion that producing more hydrogen is economical to the hydrogen cost, even though it causes an increase in OPEX rather than minimizing hydrogen production to save expenses.
In addition to estimating hydrogen costs based on operation plans (given through Scenarios I to IV) from the company, other scenarios (Scenarios V to VII) were made to reduce hydrogen costs further. In those additional scenarios, several proposals were presented, such as the trade of curtailment between the “H” wind farm and other farms, supplying electricity up to maximum capacity, and the development of by-product sales routes. Although these suggestions are not applicable under the current circumstance, discussions can be made to reduce hydrogen prices and develop a renewable energy supply chain.

2.2. Impact of the Result of This Study

The result of this research impacts relevant green hydrogen industries and government policy as follows.
This study is carried out not to predict the feasibility of the project for investment but to provide a basis for determining a hydrogen price for the currently constructed business. Companies that will own and operate water-electrolysis facilities will reflect the result of the study on determining hydrogen sales prices before starting hydrogen production. Accordingly, the Korean Government will consider the study result when adjusting hydrogen subsidies for promoting the renewable energy market.
Further, the operating company will be able to establish its budget and employee recruitment plan at the start of the project and annually using a basis of OPEX calculation, as performed through Scenarios I to IV.
Through the results of this study’s sensitivity analysis, the optimization of operation mode, such as determination of supplying capacity for respective power supply sources (grid electricity and wind power generation electricity) to water electrolysis, input ratio between water electrolysis type (PEM vs. alkaline), and so on, is available by the operating company.
Jeju Island plans to accelerate the green-hydrogen-production business based on this project. The construction project of a 12.5 MW water-electrolysis facility consisting of alkaline, PEM, solid oxide electrolysis cell (SOEC), and AEM types will be followed sooner [13]. The result of this study will directly or indirectly affect the financing for the following project and decision-making by developers and the government accordingly.
Furthermore, one of three proposals in Section 8, absorption (or trading) of curtailment from other wind farms, can become a reference to improve the energy transaction system in the future when experts conduct further discussions to realize this system.
In addition, this study will improve LCOE techniques in economic analysis for entire energy cost by reflecting detailed breakdowns during the estimation of expenditure and calculation of electricity amount by time series.

3. Object and Method of Economic Analysis

3.1. Object of Economic Analysis

As described in Table 2, the object of this economic analysis is a P2G system that will be developed by establishing a water-electrolysis facility near an existing wind farm (“H” wind farm with a maximum generation capacity of 9.38 MW) on Jeju Island. One year of the demonstration will take place after construction and commercial operation will follow. This P2G system is typically designed to produce 200 kg of hydrogen per day (600 kg of hydrogen per day at maximum). A total of 3.3 MW of water-electrolysis facilities and auxiliaries will be configured to achieve productivity, as described in the next section.

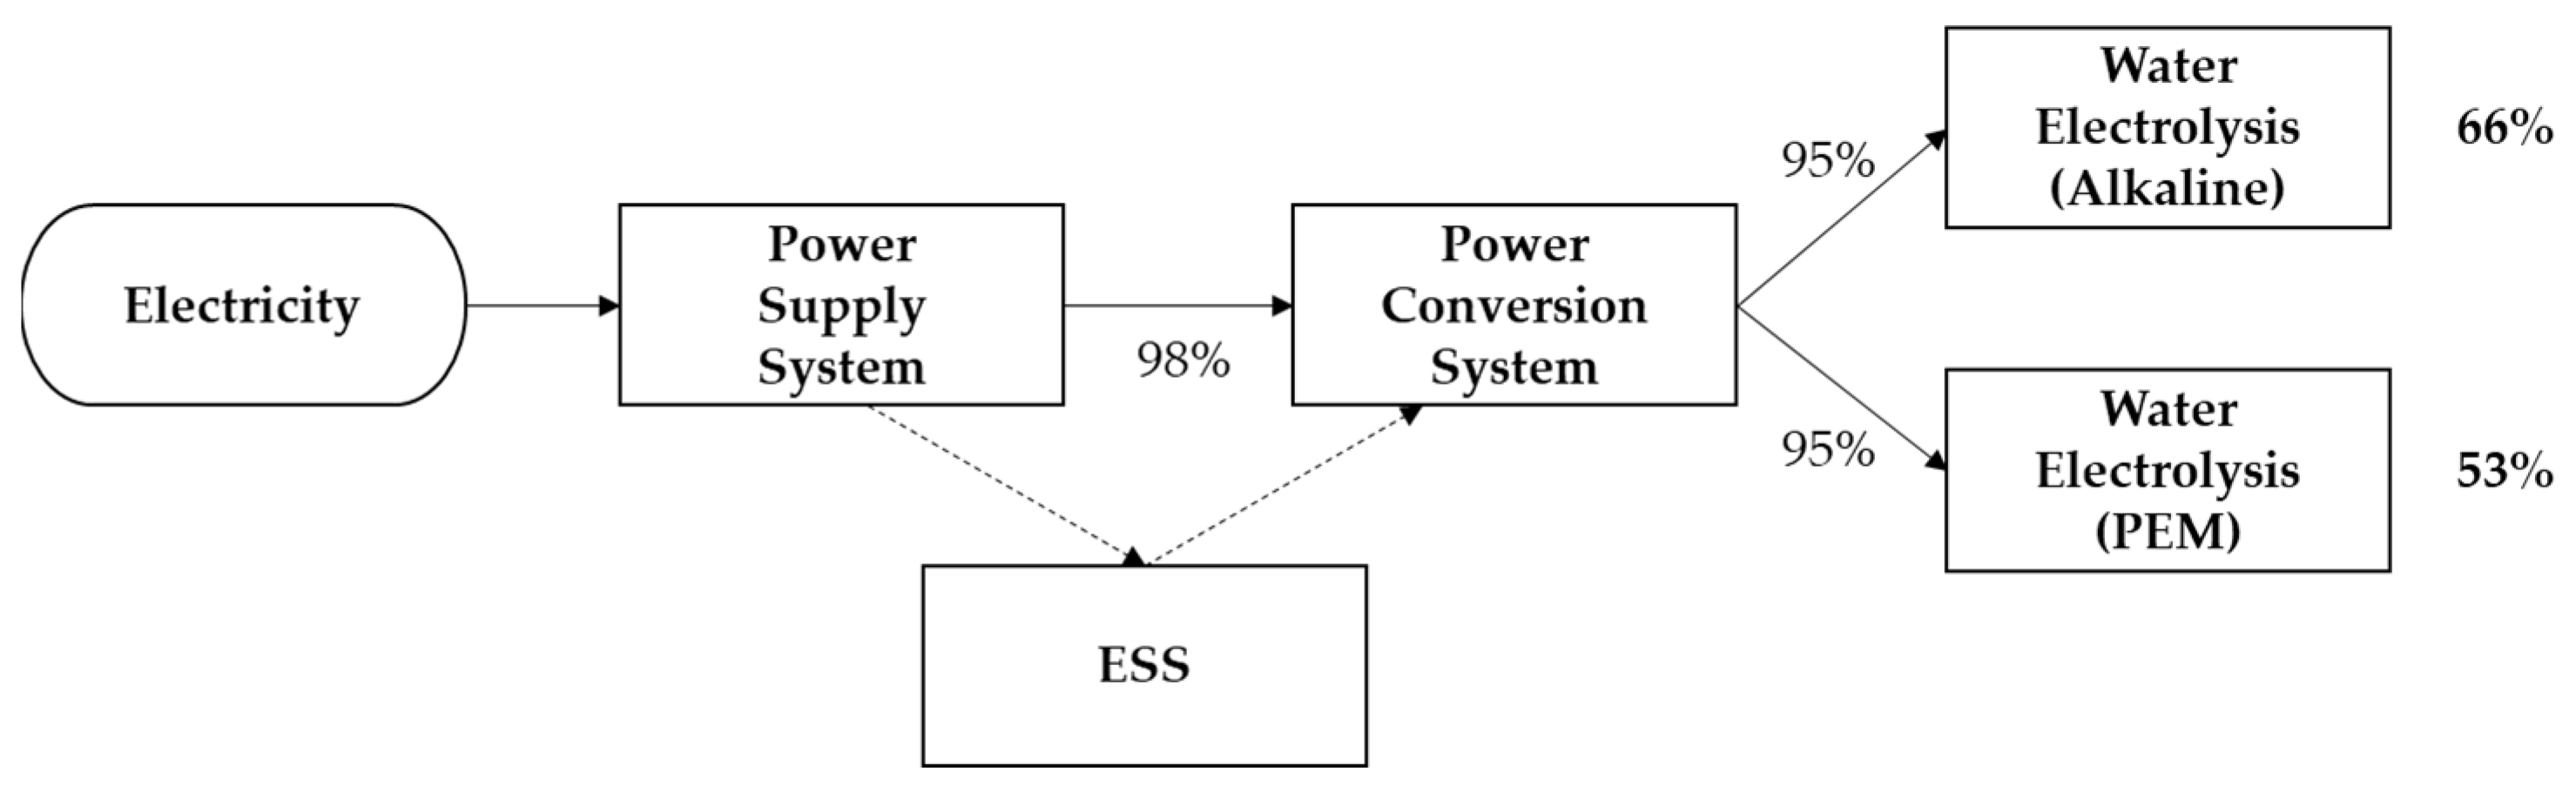
3.2. Configuration of the P2G System

The P2G system, which converts electricity to hydrogen, is configured by various devices, such as a power-supply system, power-conversion system, water electrolysis devices, buffer tanks, compressors, tube trailers, and an energy storage system (ESS) battery system. Since the SPC will be founded to run a commercial operation (hydrogen production and distribution service), a detailed specification of a respective facility cannot be specified to keep a non-disclosure of information. Instead, a summary of specifications for some major components is shown in Table 3 and a flowchart for hydrogen production is shown in Figure 1.
A power-supply system gathers electricity from various power sources, such as wind turbines and grid electricity systems, and delivers it to a power-conversion system. The power-conversion system is a device that converts AC power provided by the power-supply system into DC. In the conversion process, since the electricity voltage becomes higher than the voltage required to operate the water electrolysis, an auxiliary device, such as a converter, for decompression is required.
The water-electrolysis facilities make hydrogen by receiving low-voltage, high-current, and direct-current electricity from the power-conversion system. When no energy (electricity) is supplied to the water electrolysis, the facility goes into standby mode to minimize its power consumption (1 kWh or less). When energy is given to the facility, the control system automatically switches to operation mode to produce hydrogen.
The hydrogen from the water electrolysis is temporarily stored in a buffer tank and conveyed to a compressor installed next to the tank. At the compressor, the hydrogen is compressed up to 300 Barg. This highly pressurized hydrogen is transported to hydrogen charging stations all over Jeju Island through tube trailers to supply fuel to vehicles.
During the process, some electricity may be transported from the power-supply system to the ESS battery installed separately rather than going to the power-conversion system. This battery system is to be installed for two purposes: for a buffer role to store electricity temporarily and for providing charge to electric vehicles directly.
Wind turbines are already installed and are under operation. These turbines will provide not only limited curtailed electricity but also “normal” electricity, originally to be sold to KEPCO to enhance the facilities’ availability. A total of 9.38 MW of wind turbines in the “H” wind farm is connected to utilize the maximum capacity (3.3 MW) of the water electrolysis. In addition, a grid system is also connected to the water electrolysis to provide electricity (purchased from KEPCO) to supplement power-supply capacity.
Since the capacity and type of the water-electrolysis facilities determine the amount of hydrogen production and the hydrogen cost as well as investment cost, design criteria for the water-electrolysis facilities were determined considering the specifications for the wind turbines and post-processing facilities.
Generally, temperature condition for hydrogen production through water electrolysis is categorized into high temperatures (usually 800 °C or higher) and low temperatures (below 150 °C). Since these water-electrolysis facilities in the “H” wind farm on Jeju Island apply to a low-temperature type, suitable for small-scale production, another high-temperature type suitable for large-scale production was excluded from the application. Among low-temperature-type electrolysis, alkaline and PEM types were adopted for this business, but the SOEC type was excluded because it is technically not developed for commercialization.
The alkaline-type water electrolysis consists of anode and cathode cells in an electrolyte tank having 20% to 30% concentration of KOH or NaOH aqueous solution as electrolytes. OH- ions produced from the anode of the aqueous alkali solution pass through the separation membrane and move to the cathode to produce hydrogen. The hydrogen is obtained through the reaction formula, as shown in Equation (1).
H2O → 1/2 O2 + H2 (Overall)
2 H2O + 2 e → H2 + 2 OH (Cathode)
2 OH → 1/2 O2 + H2O + 2 e (Anode)
This alkaline-type water electrolysis is conventional and practical and has a simpler structure than other types. Because of its high efficiency, long lifetime, and comparatively economical cost, this technique is already in the commercialized stage. However, hydroxide ions react before moving to the anode since the membrane is unstable. Another disadvantage is that electric loss occurs, caused by high electrical resistance due to the usage of liquid electrolytes (KOH or NaOH). Further, the device’s volume is large because of its low current density and it takes a long time to start up [9,12,14].
In PEM-type water electrolysis, an electrolyte is decomposed into hydrogen and oxygen using an ion-exchange membrane, a hydrogen ion conductor. When current flows through the electrolytic cell, H+ ions selectively penetrate an ion-exchange membrane at the anode via the following reaction (Equation (2)). The H+ ion meets electrons flowing through an external circuit and H2 is made [9,12,14].
H2O → 1/2 O2 + H2 (Overall)
2 H+ + 2 e → H2 (Cathode)
H2O → 1/2 O2 + 2 H+ + 2 e (Anode)
Typically, PEM-type water electrolysis is free from corrosion compared to the alkaline type, in which pure water is supplied using a catalyst electrode with platinum group element to a fluorine-based ion-exchange membrane. The PEM type also has high efficiency by using high-voltage current, and the facility can be small sized because no additional facilities are required. However, as there are no commercialized cases in South Korea yet for PEM-type water electrolysis, further technical development and operation optimization may be necessary during the demonstration stage in this business.
As described above, each type of water electrolysis has several advantages and disadvantages. These two types have differences in electrolyzing method and practicality, resulting in different hydrogen-production efficiency. Generally, the efficiency of the alkaline type is estimated to be around 70% and the PEM type is 50% to 60% in current technology [12].
The total capacity of the water-electrolysis facility for this green-hydrogen-production system is 3.3 MW. A combination of 2 MW of alkaline-type water-electrolysis system and 1.3 MW of PEM-type water-electrolysis system will be utilized parallelly. This integrated system aims to compensate weak points of each type by applying two different types and using them to compare each type’s production performance and durability during the demonstration period.

3.3. Methodology of Economic Analysis

The economic analysis was carried out by calculating the production cost of hydrogen made from the water-electrolysis facilities connected to the “H” wind farm. The hydrogen cost as a result of economic analysis will be used as a reference for establishing a market price for hydrogen production/sales businesses on Jeju Island. It will also be reflected in the government’s renewable energy policy, such as the set of subsidies for hydrogen in the commercial period.
The estimation of hydrogen cost was carried out by calculating a break-even price, indicating “the minimum hydrogen sales price that can cover CAPEX + OPEX during the whole business period”. The cost incurred during the business period was estimated and divided by the total hydrogen produced. The LCOH method was applied to calculate the hydrogen cost. The applicable calculation formula is shown in Equation (3).
LCOH = I 0 + t = 1 T C t ( 1 + r ) t   t = 1 T H t ( 1 + r ) t
where
I 0 = Initial Investment costs (KRW);
T = Total lifetime (years);
t = year of calculation;
C t = O&M costs;
H t = Production quantity of Hydrogen (kg);
r = discount rate.
The discount rate in the above equation is generally applied in a range of 4% to 9% in the energy industries [12]. However, the rate is not assigned directly in this calculation. Instead, the inflation rate and wage-growth rate were selectively reflected at corresponding annual expenses during the estimation of respective break-downs of CAPEX and OPEX. Further, conversion to monetary value at the current time was adopted in estimating expenses in every accounting year for the economic evaluation of hydrogen cost made in every scenario.

4. Premise of Economic Analysis

4.1. Premise Subject to Project Execution

Before the economic analysis, information necessary for the project execution was investigated/assumed and reflected in the analysis hereinafter. The project period was set as 15 years. The reason for the application of 15 years is that the period should be set longer than at least one cycle of time of some major equipment (e.g., water-electrolysis stacks and ESS battery, etc.) to increase reliability in economic analysis. The period shall be shorter than the lifetime of the wind turbine (20 to 25 years).
The entire curtailed energy produced from the “H” wind farm will be supplied to the water electrolysis to fulfill the purpose of “green” hydrogen. The amount of curtailed energy provided to the water electrolyte is set as 286,437 kWh per year, where this value is derived from a previous record of the “H” wind farm in 2021. As shown in Table 1 in Section 1, the amount of curtailed energy is increasing rapidly; therefore, the amount of supplied electricity in the future is expected to be larger than that of 2021.
Further, 4 MW out of a total of 9.38 MW of the electricity generated by the “H” wind farm (originally to be sold to KEPCO) will also be supplied to the water electrolysis because the water electrolysis can bear only a few hours of operation per day with curtailed electricity that leads to insufficient supply of hydrogen on Jeju Island. The capability of the “H” wind farm is used during calculation, whose value is 27%, which came from the average value of the same farm.
For maintaining a stable electricity supply to the water electrolysis, the P2G system was designed to supply 1.5 MW of electricity from the grid system (purchased from KEPCO) and supply from the wind turbines. Each wind turbine and the grid electricity are set to be input to the water electrolysis simultaneously.
As mentioned in Section 3.2, electricity from the power-supply system can immediately go to power conversion or temporarily be stored in an ESS battery rather than directly transmitted to the following process. Since the total amount of electricity that goes to the water electrolysis is the same whether electricity passes through the ESS battery or not, the path is not considered during this calculation, based on the assumption that no electricity loss is made during battery charging/discharging.
After one year of demonstration of water-electrolysis operation, an SPC, which will produce and distribute hydrogen, will be established and hire a few employees. Two employees will be hired for facility operation based on the candidate SPC’s plan, but six personnel may be necessary, depending on the scenarios described in Section 6.
Respective values and their basis of application for premise are shown in Table 4.

4.2. Parameters or Assumptions Affecting Hydrogen Production

Parameters related to P2G system facilities that affect hydrogen productivity (or power consumption) are given in Table 5.
The factors affecting power consumption for producing hydrogen are production efficiency for the power-supply system, production efficiency for the power-conversion system, production efficiency for water electrolysis (alkaline and PEM, respectively), and annual reduction rate of production efficiency for water-electrolysis stack (alkaline and PEM, respectively). Calculation of the actual amount of electricity to be used for hydrogen production reflecting these factors will be followed in Section 5.2.
Values of efficiency for the power-supply system and power-conversion system are applied from the design specification of respective manufacturers.
For the water-electrolysis stack, efficiency is defined as in Equation (4), but the applied value is constant at 56% and 69.6% for PEM and alkaline type, respectively, which is derived from design data or reference records of other companies.
Efficiency   of   stack = Amount   of   electricity   consumed   for   producing   unit   hydrogen ( kWh kg ) Power   consumption ( kWh kg )
Power consumption indicates the required amount of electricity consumed for producing a unit weight (i.e., one kilogram) of hydrogen, as per Equation (5). The value is applied as 64.3 kWh/kg in the calculation. This figure is from a reference record from a neighboring water-electrolysis facility on Jeju Island.
Power   consumption ( kWh kg ) = Amount   of   electricity   consumed ( kWh ) Amount   of   hydrogen   produced ( kg )
Water-electrolysis stacks are expected to lose their efficiency gradually during operation because of the aging of the facilities. Assuming that stack efficiency is reduced constantly, the annual reduction rate can be defined as Equation (6). In this study, the annual reduction rate is assumed as 1.5% per year, both in alkaline and PEM types.
Annual   efficiency   reduction   rate = Power   consumption ( theoritical ) Power   consumption ( actual , initial   year ) Power   consumption ( theoritical ) Power   consumption ( actual , next   year ) × 100
The distribution ratio of supplied electricity to the water electrolysis is 2:1.3 for alkaline and PEM, respectively, the same as the capacity of each type. The calculation does not consider the loss of electricity during transmission and distribution from the wind turbine, grid system, or ESS battery to water electrolysis.

5. Calculation of Expenses and Amount of Hydrogen

5.1. Calculation Procedure

Calculating hydrogen production cost was performed following the procedure, divided into two steps, as shown in Figure 2.
One step is to calculate the whole expenses incurred during the business operation. Expenses can be primarily divided into CAPEX and OPEX. Most CAPEX is generated in the initial period of the project, considering procurement and construction costs, whereas some portions occur in the intermediate period because of the replacement of specific equipment. Detailed breakdowns of CAPEX are specified in Section 5.2.1. OPEX can be divided into three categories, such as general operation expense, raw material expense, and expense for operating tube trailers. General operation expenses, which indicate expenditures incurred during a company’s management, increase or decrease depending on the number of employees’ salaries proportionally because the basic salary determines most breakdowns. Raw material expenses consist of purchasing electricity from KEPCO and tap water as raw materials. As referred to later in Section 6, these raw material expenses significantly affect hydrogen production costs because of a large amount of purchasing electricity against total OPEX and its relatively expensive purchasing fee. Tube trailer operating expenses are composed of purchase fees for tube trailers or rental fees, the cost of hiring or contracting drivers, fuel costs, and so on. Since these tube trailer operating expenses are determined costs based on the amount of hydrogen produced, these expenses can be calculated after the summation of the hydrogen amount produced differently from the other two abovementioned expenses.
Apart from the estimated expenses incurred, the amount of electricity supplied from several power sources to water electrolysis should be calculated separately, as per the procedure shown on the right side in Figure 2. After the total amount of electricity is figured out, the total amount is divided by power consumption for water electrolysis, which indicates the intrinsic performance characteristic of the facility to acquire the amount of hydrogen produced. The calculation method of the abovementioned two “amount [s] of electricity” may be distinguished during the calculation. The amount of “input” electricity from the power sources is applicable for calculating raw material expenses. For calculating the hydrogen amount, the final amount of electricity gathered should reflect the production efficiency (i.e., electric loss) of respective equipment located after the power source and before water electrolysis.

5.2. Calculation of Expenses

5.2.1. Capital Expenditure

CAPEX is a temporary and irregular cost incurred before and after the event, such as purchasing, construction, or replacing/substituting facilities. In this business, CAPEX occurred in the 1st, 6th, 9th, and 11th years in the whole period.
Strictly speaking, some expenses, such as investment costs, were incurred before the first year. For the initial occurrence of CAPEX, engineering, procurement, and construction costs for the initial setup of the P2G system referred to in Section 3.1 and Section 3.2 were incurred in the first year. Since this project is financed without a loan, fees, such as loan interest and guarantee fees for loans, can be disregarded. This “no debt” situation makes a very slight difference but can be negligible when the costs are transferred from “before the first year” to the “first year” in the accounting aspect.
As several terminations and replacements of each type of electrolysis stack due to reach its respective lifetime are expected in the entire business period, replacement costs for stacks are considered in CAPEX calculation, as indicated in Table 6.
A breakdown of CAPEX is given in Table 7. The exact price of each item cannot be disclosed due to confidentiality. Instead, the ratio of respective costs against total expenses is described.

5.2.2. Operating Expenditure

Since the hydrogen production and supply through water electrolysis will be operated by the independent company established in the demonstration period, OPEX was calculated by preparing accounting data, such as cash flow, income statement, and balance sheet, for each year during the business period. As this economic analysis aims to calculate production costs rather than considering profits made by hydrogen sales, cash flows from hydrogen sales activities (e.g., revenue for hydrogen sales, interest income, and corporate tax refund profits, etc.) in the income statement during accounting is not considered.
One of the major factors in OPEX is the raw material expense. In operating the water electrolysis, raw materials are identified as “electricity” and “tap water” necessary for electrolysis. The fee for electricity from curtailment is “0” because the electricity was to be discarded initially. For the calculation of expense for electricity from a wind turbine, “settlement unit price” [21], which can be obtained as a counter benefit, is used for estimating material expense. Otherwise, the electricity is supplied to the water electrolysis.
When grid electricity is injected into water electrolysis in addition to a wind turbine, SPC for operating water electrolysis should purchase electricity as a raw material from KEPCO. In this case, “contract unit price” is applicable to calculate the cost in South Korea as usual [22]. The contract unit price (fixed) is set following Equation (7), a formula that is defined and used in the Renewable energy Portfolio Standard (RPS) market in South Korea.
Contract   Unit   Price ( fixed ) = SMP + weight   factor   × REC
In the calculation of raw material expense, Jeju’s SMP applies to the “SMP” term in the above equation, especially the average value from January to August 2022, which was adopted to reflect the recent trend rather than applying the average for an extended period (e.g., 3 or 5 years), because a rapid increase in SMP was incurred from the beginning of 2022 to the current day (September 2022). If an additional increase or decrease in SMP is made, hydrogen cost can be updated by reflecting the average of the recent period at that time. See Section 7.6 for SMP change in a recent year.
Other major raw materials for electrolysis, water supply, and sewage-treatment costs were considered to calculate the expense for tap water. The unit price of the water supply contracted with the Jeju Water Supply Business Headquarters was used for estimating water expenses.
The detailed items for estimating OPEX and their basis for the calculation are shown in Table 8. Regional consideration is included, where a specific ratio of profit must be contributed to the Jeju Province when electricity is generated related to wind power on Jeju Island, as per the ordinance of Jeju Special Self-governing Province [23]. However, this term is negligible since only production costs are considered, and profits are not regarded during economic analysis in this study. However, the supporting fee to a neighboring village, regardless of profit, applies to the OPEX calculation.
Since tax (excluding corporate tax), utility bills, O&M costs, insurance fees, and expenses for consumables are calculated based on a certain percentage of depreciation costs, estimation and reflection to the accounting of depreciation costs shall be made for the calculation of the aforementioned OPEX expenses. The initial cost of CAPEX mentioned in Section 5.2.1 was evenly reduced to the total business period (15 years). In the case of expenses for the replacement of stacks, the expenses were divided equally from the replaced year to their entire life period as shown in Table 9. Depreciation costs include investment costs for new water-electrolysis facilities, ESS, buffer tank, tube trailer, and investment costs for stacks to be replaced in the future. Depreciation costs for wind turbines, grids, cables for transmission, and other facilities already installed and being operated for a generation were already included in the current sales prices (i.e., settlement unit price and contract unit price).
Among several types of taxes, corporate tax is calculated when profit is made. Since the hydrogen cost calculated is aimed at the lowest hydrogen price with no margin, corporate tax was not considered, nor profit.

5.3. Calculation of the Amount of Electricity Supplied

To estimate the hydrogen cost, a calculation of the amount of hydrogen that can be produced during the business period should be made. Before calculating the amount of hydrogen, the amount of electricity consumed during hydrogen production should be figured out in advance. After that, output electricity from the water electrolysis was calculated by reflecting the efficiency of each type of water electrolysis (alkaline and PEM). The actual amount of electricity should be converted to input electricity to the water electrolysis by reflecting the respective efficiency of a wind turbine, power-supply system, power-conversion system, and so on. Since every facility has its production efficiency for operation, 100% of energy cannot be consumed to produce hydrogen in each facility. The efficiency of each facility used in the calculation is presented in Section 4.2.
Through these steps, cumulative production efficiency can be made, so that when 100% of power is supplied from the power source, only 66% can be used to produce hydrogen for the alkaline type and 53% for the PEM type, as shown in Figure 3. This process assumes no electrical transmission loss and temporary store efficiency in the ESS battery.

5.4. Calculation of the Amount of Hydrogen Produced

Based on the result presented in Section 5.3, the amount of hydrogen produced was calculated according to Equation (8) by dividing the total electricity supplied to the P2G system by power consumption for producing unit hydrogen (1 kg) of water electrolysis (depending on the technology of the water electrolysis manufacturer).
Amount   of   hydrogen   produced = Amount   of   electricity   supplied   to   P 2 G   System ( kWh ) Power   consumption   for   producing   hydrogen ( kWh kg )
Even if the same amount of electricity is supplied every year, the amount of hydrogen produced will be reduced at a certain rate due to the reduced efficiency rate caused by the aging of the water-electrolysis stack. In this regard, when calculating the total amount of hydrogen, the corresponding reduction rate in efficiency was reflected for each year, as shown in Table 10 cumulatively. However, the amount of hydrogen calculated through Equation (8) indicates the amount obtained only in the first year. For example, the amount of hydrogen is estimated to be 301 kg/day in the initial year; however, the amount fell to 244 kg per day in the last year, as in Scenario I.

6. Estimation of Hydrogen Cost by Scenarios

6.1. Organization of Economic Analysis Scenarios

Hydrogen cost can be determined through the procedure described in Section 5, but only one cost can be suggested. The estimated cost of hydrogen has an impact that will be reflected in the hydrogen sales price of the SPC to be established for water electrolysis operation and will affect the supply amount on Jeju Island. Further, the subsidy amount will be determined by this hydrogen cost from the government, if necessary. Considering the revenue of the SPC for operation and promotion policy from the government, the hydrogen production cost shall be as low as possible and be updated according to the internal/external situation. Several proposals with organizing scenarios are necessary to find the lowest hydrogen cost rather than fixing the cost to set a hydrogen price flexibly by reflecting variable conditions regarding hydrogen production.
The scenarios were constructed by varying the number of days and hours, including the time zone for power supply (i.e., the number of days and hours of electrolysis operation) for hydrogen production. The reasons for selecting these parameters as the major factors in diversifying scenarios are that changes in these parameters lead to a significant change in expenses, including the following: (1) Electricity expenses as raw material cost in the analysis change depending on the time of usage (The Ministry of Trade, Industry and Energy (MOTIE) in South Korea divides peak time zones considering electricity demands and sets the electricity fee differently on time, as seen Table 11). (2) If operating hours exceed eight hours per day, additional employees should be hired for shift work, such as two shifts among three groups or three shifts among four groups. (3) If the water electrolysis is operated seven days a week (365 days a year), employees’ salaries will increase due to overtime work expenses.
These parameters impact total expenses more than expected in other studies. For example, raw material costs account for 47% of the total cost incurred (CAPEX + OPEX) based on Scenario I, to be described later. At the same time, other studies resulted in the ratio of OPEX being much smaller (3% to 4%) than the ratio of CAPEX [7,9]. Hence, this is the reason to find the best case to reduce hydrogen costs through configuration and comparison of scenarios by decreasing terms in OPEX.

6.2. Hydrogen Cost—According to Scenario I

Scenario I is created under the condition that is operating the water electrolysis 365 days a year (seven days a week), 12 h per day, and its operation time is 09:00 to 21:00. Since two employees in one group cannot afford to cover 12 h per a day without holidays, six employees are required (two persons per group for three shifts). As working time in Scenario I is out of regular working hours (09:00 to 18:00 typically) and work on weekends and holidays is included, a certain rate for salary shall be given to operators. In this study, the applicable rate for wages is defined as the “O/T(Overtime) factor”, and 80% of the basic salary in this operating condition was reflected in OPEX, especially in the “extra benefit” term by applying Factor 1.8 in Scenario I.
The SMP applicable to the operating hours (09:00 to 21:00) is a mixture of “Mid-peak” and “On-peak” time, as described in Table 11, for Jeju Island. Based on this SMP, the contract unit price is calculated to be KRW 227.40/kWh, as per Equation (7). The corresponding SMP average in Jeju is KRW 203.40/kWh.
Abovementioned Factors regarding operation plan(condition) is summarized in Table 12 below.
The amount of electricity supplied to the water electrolysis for each power-supply source was calculated, as shown in Table 13. The amount of respective electricity was calculated without distinguishing the paths of going through ESS. Even though the capacity (4 MW) of electricity from the wind turbine is larger than that (1.5 MW) of electricity from the grid, the ratio of electricity amount supplied to water electrolysis is relatively small (40.8% vs. 56.7%) due to the capability of the wind turbines (27%).
Table 14 shows expenses incurred during the business period according to Scenario I. Although detailed expenses cannot be specified due to confidentiality, they have been marked as A, B, C, and D instead. These breakdown marks will be compared to how each expense changes depending on scenarios later by indicating the proportion of the respective symbol. The ratio of each breakdown expense is also mentioned in the table to see how much each factor affects the determination of the hydrogen cost.
Among the breakdown of OPEX in Table 14, “general operation expenses”, which include employees’ salaries (also include extra benefits affected by the number of operation days and hours), charge 26.3% of the total hydrogen-production expenses. In addition, raw material costs account for nearly half of the total cost, 47.0%. Among these, the expense of purchasing tap water accounts only for 2.3% and the expense of purchasing electricity accounts for 44.7%, which is the biggest influencing factor in the hydrogen cost. This “expensive cost” of electricity is derived from a rapid increase in SMP from early 2022.
The amount of supplied electricity presented in Table 13 was divided by the “power consumption for unit hydrogen production” of the water-electrolysis facilities to find the annual amount of hydrogen production for each water-electrolysis type. Even though the same amount of electricity is given to alkaline and PEM types, different amounts result in hydrogen production due to the difference in the efficiency of each facility. In addition, as the efficiency of the stacks decreases (1.5% yearly; assumption) due to the aging of the stacks every year, the estimated amount of hydrogen will decrease annually. As shown in Table 15, 301 kg per day of hydrogen will be made in the first year, whereas only 244 kg daily can be produced in the 15th year. The average hydrogen production for the entire period will be 272 kg daily.
The total amount of hydrogen produced during the business period is 1,488,141 kg. Dividing this figure by the total expenses presented in Table 14, the LCOH is identified as KRW 62,029/kg∙H2 (USD 45/kg·H2).

6.3. Hydrogen Cost—According to Scenario II

Scenario II was designed under conditions of operating 365 days a year (seven days a week), 12 h per day, and its working time is 22:00 to 08:00. As in Scenario I, six employees (three groups) are required for shift work. Compared to Scenario I, the operating time was moved to nighttime, which affects SMP change on Jeju Island. The Jeju Special Self-Governing Province defines 22:00 to 08:00 as the “Off-peak” time zone. The contract unit price is KRW 236.52 according to Equation (7) by applying the average SMP value from January to August 2022.
As the operating time changes, the proportion of night workers increases compared to Scenario I (working in the daytime disappeared) and the O/T factor increased to 2.5 (extra benefit = 150% of basic salary).
Factors regarding operation plan for Scenario II is summarized in Table 16 below.
The amount of electricity supplied to the water electrolysis for each power-supply source is shown in Table 17. As the input capacity and input time for each supply source are the same as in Scenario I, the total amount of electricity is the same as well.
The expenses incurred during the business period are shown in Table 18. The rate of increase or decrease for each sub-category compared to Scenario I was indicated using marks “A”, “B”, “C”, and “D”. Total expenses increased by 5.4% compared to Scenario I. CAPEX remains unchanged because investment costs are the same as in Scenario I. General operation expense in OPEX, calculated based on labor cost, increased by 16.7% compared to Scenario I. This change implies that expenses for the operating corporation are expected to rise by 16.7% when night work is required, while other conditions are the same. The raw material expense depending on SMP slightly increased to 2.5%. Since total hydrogen production is the same as Scenario I, the expense for operating the tube trailer within OPEX is not changed.
Next, the average amount of hydrogen for each water-electrolysis type was calculated. Since there is no change without a shift in working time compared to Scenario I, the average amount of hydrogen production is 272 kg per day, as described in Table 19.
The amount of hydrogen produced during the entire business period is 1,488,141 kg (same as Scenario I). Dividing the whole amount of hydrogen by total expenses, as calculated in Table 18 (5.42% increase than Scenario I), the LCOH is KRW 65,131/kg∙H2 (USD 47/kg·H2). This cost is 5.00% of the increased price compared to Scenario I.

6.4. Hydrogen Cost—According to Scenario III

In Scenario III, the number of operating days and hours is set to 240 days a year (five days per week), eight hours per day, and its working time is from 09:00 to 18:00. Operation is made only during regular working hours without weekends and holidays under this condition. Hence, the required number of employees will be reduced from six to two compared to Scenarios I and II. The working time is defined as the “Mid-peak” from 09:00 to 16:00 and the “On-peak” from 16:00 to 18:00, as per Table 11. SMP at these time zones is averaged as KRW 187.11/kWh. This shows a reduction of 8.0% and 12.0% in SMP compared to Scenarios I and II, respectively. Since working on holidays and nights was removed, no overtime work is necessary for employees. In this regard, the O/T factor applies to “1” (extra benefit = 2.3% of basic salary; the average value of three similar corporations).
Factors regarding operation plan for Scenario III is summarized in Table 20 below.
Since the operating time decreases in this scenario compared to Scenarios I and II, the annual power supply to the water electrolysis also decreases, as shown in Table 21. As operating days decreased from 365 days to 240 days per year compared to Scenario I and II and operating time also decreased from twelve hours to eight hours per day, the annual power supply decreased by 54.8% from 11,586,837 kWh to 5,240,037 kWh.
A significant decrease in total expenses during the entire business period is identified compared to Scenario I, as seen in Table 22. Total expenses decreased by 44.6% against Scenario I. CAPEX is the same due to no change in investment cost. Reduction in OPEX caused a change in the ratio of CAPEX, which increased significantly to 33.1%. Even though CAPEX is the same, the impact on the total cost is larger in the current scenario.
No night work and holiday operation decreased the company’s general operating expenses in OPEX (fell by 50.54% compared to Scenario I). As the electricity supply time is reduced in Scenario I, the amount of raw materials consumed is also reduced. The expenses for raw materials were reduced by 56.85% more than those in Scenario I. Furthermore, expenses for tube trailer operation decreased by 54.78% as total hydrogen production decreased at the same ratio.
The daily amount of hydrogen production (average) for each type of water electrolysis is as follows. The average amount of daily hydrogen production during the business period is 187 kg per day, which is expected to decrease by 31% compared to Scenario I (272 kg/day). In the first year, an average of 207 kg of hydrogen can be produced per day but will reduce to 168 kg per day in the final year due to decreased production efficiency of stacks as shown in Table 23 below.
The amount of hydrogen produced during the entire business period is 672,998 kg. This figure is reduced by 55% from that of Scenario I. Dividing the total amount by expenses incurred during the entire business period (44.6% decrease compared to Scenario I), the LCOH is determined as KRW 74,939/kg∙H2 (USD 54/kg∙H2). This is an increase of KRW 12,910 (USD 9) compared to Scenario I. The decrease in hydrogen production was greater than the decrease in expenses, resulting in increased hydrogen costs.

6.5. Hydrogen Cost—According to Scenario IV

Operating days and hours of the water electrolysis in Scenario IV are 240 days per year (five days per week) and eight hours/per day, as in Scenario III. Operating time was shifted to night, from 23:00 to 08:00 h. Likewise, the number of employees required is two (one group without shift), the same as Scenario III. SMP applies to the “Off-peak” zone. The average of SMP at that time is calculated as KRW 209.31/kWh. The contract unit price is KRW 233.31/kWh. This price is higher than the price in Scenario III (KRW 211.11/kWh) and is slightly lower than that in Scenarios I and II (KRW 227.40/kWh and KRW236.52/kWh, respectively). The applicable O/T factor according to operating time is “2” (extra benefit = 100% of basic salary) because no holidays exist, but the proportion of night work is 100%.
Factors regarding operation plan for Scenario IV is summarized in Table 24 below.
Since the operating time is the same as in Scenario III, the annual amount of electricity to the water electrolysis is also the same. See Table 25. Compared to Scenario I, the supplied amount decreased by 54.8%.
Total expenses incurred during the entire business period in Scenario IV slightly increased compared to Scenario III but decreased by 41.4% compared to Scenario I, as shown in Table 26. As in all previous scenarios, CAPEX is unchanged. General operation expense in OPEX decreased by 42.80% compared to Scenario I. Compared to Scenario III, this figure increased by 15.6% due to an increase in the nightwork time of employees. Expenses for material fell by 54.45% compared to Scenario I. Compared to Scenario III, which produced the same amount of hydrogen, the expense increased by 5.6%. This small increase occurred based on the difference in applicable SMPs. Tube trailer operating expenses decreased by 54.78% because the amount of hydrogen production decreased compared to Scenario I and was equal to Scenario III with the same amount of hydrogen production.
The average amount of hydrogen produced is estimated to be 187 kg/day, the same as in Scenario III. Compared to Scenario I (272 kg), the amount decreased by 31%. Refer to Table 27 below.
The amount of hydrogen produced during the entire business period is 672,998 kg, with a 55% decrease compared to Scenario I, the same as the amount in Scenario III. Dividing this amount by the total expenses (44.6% decrease compared to Scenario I and 5.7% increase compared to Scenario III), the LCOH is KRW 78,934/kg∙H2 (USD 57/kg∙H2). The cost increased by KRW 16,905 (USD 12) compared to Scenario I and by KRW 3995 (USD 3) compared to Scenario III. This scenario’s results present the worst case among the other scenarios.

7. Sensitivity Analysis

Sensitivity analysis was performed based on Scenario I, which shows the lowest hydrogen production cost among the scenarios presented in Section 6, to determine the relationship between the hydrogen cost and several dependent variables. Parameters that are expected to affect the variance in hydrogen cost are identified during organizing scenarios in Section 6 for application to sensitivity analysis, such as the capability of wind turbines, the efficiency of the alkaline-type water electrolysis, the efficiency of the PEM-type water electrolysis, the reduction rate of annual efficiency for electrolysis stack, power consumption for unit hydrogen production, and the SMP.

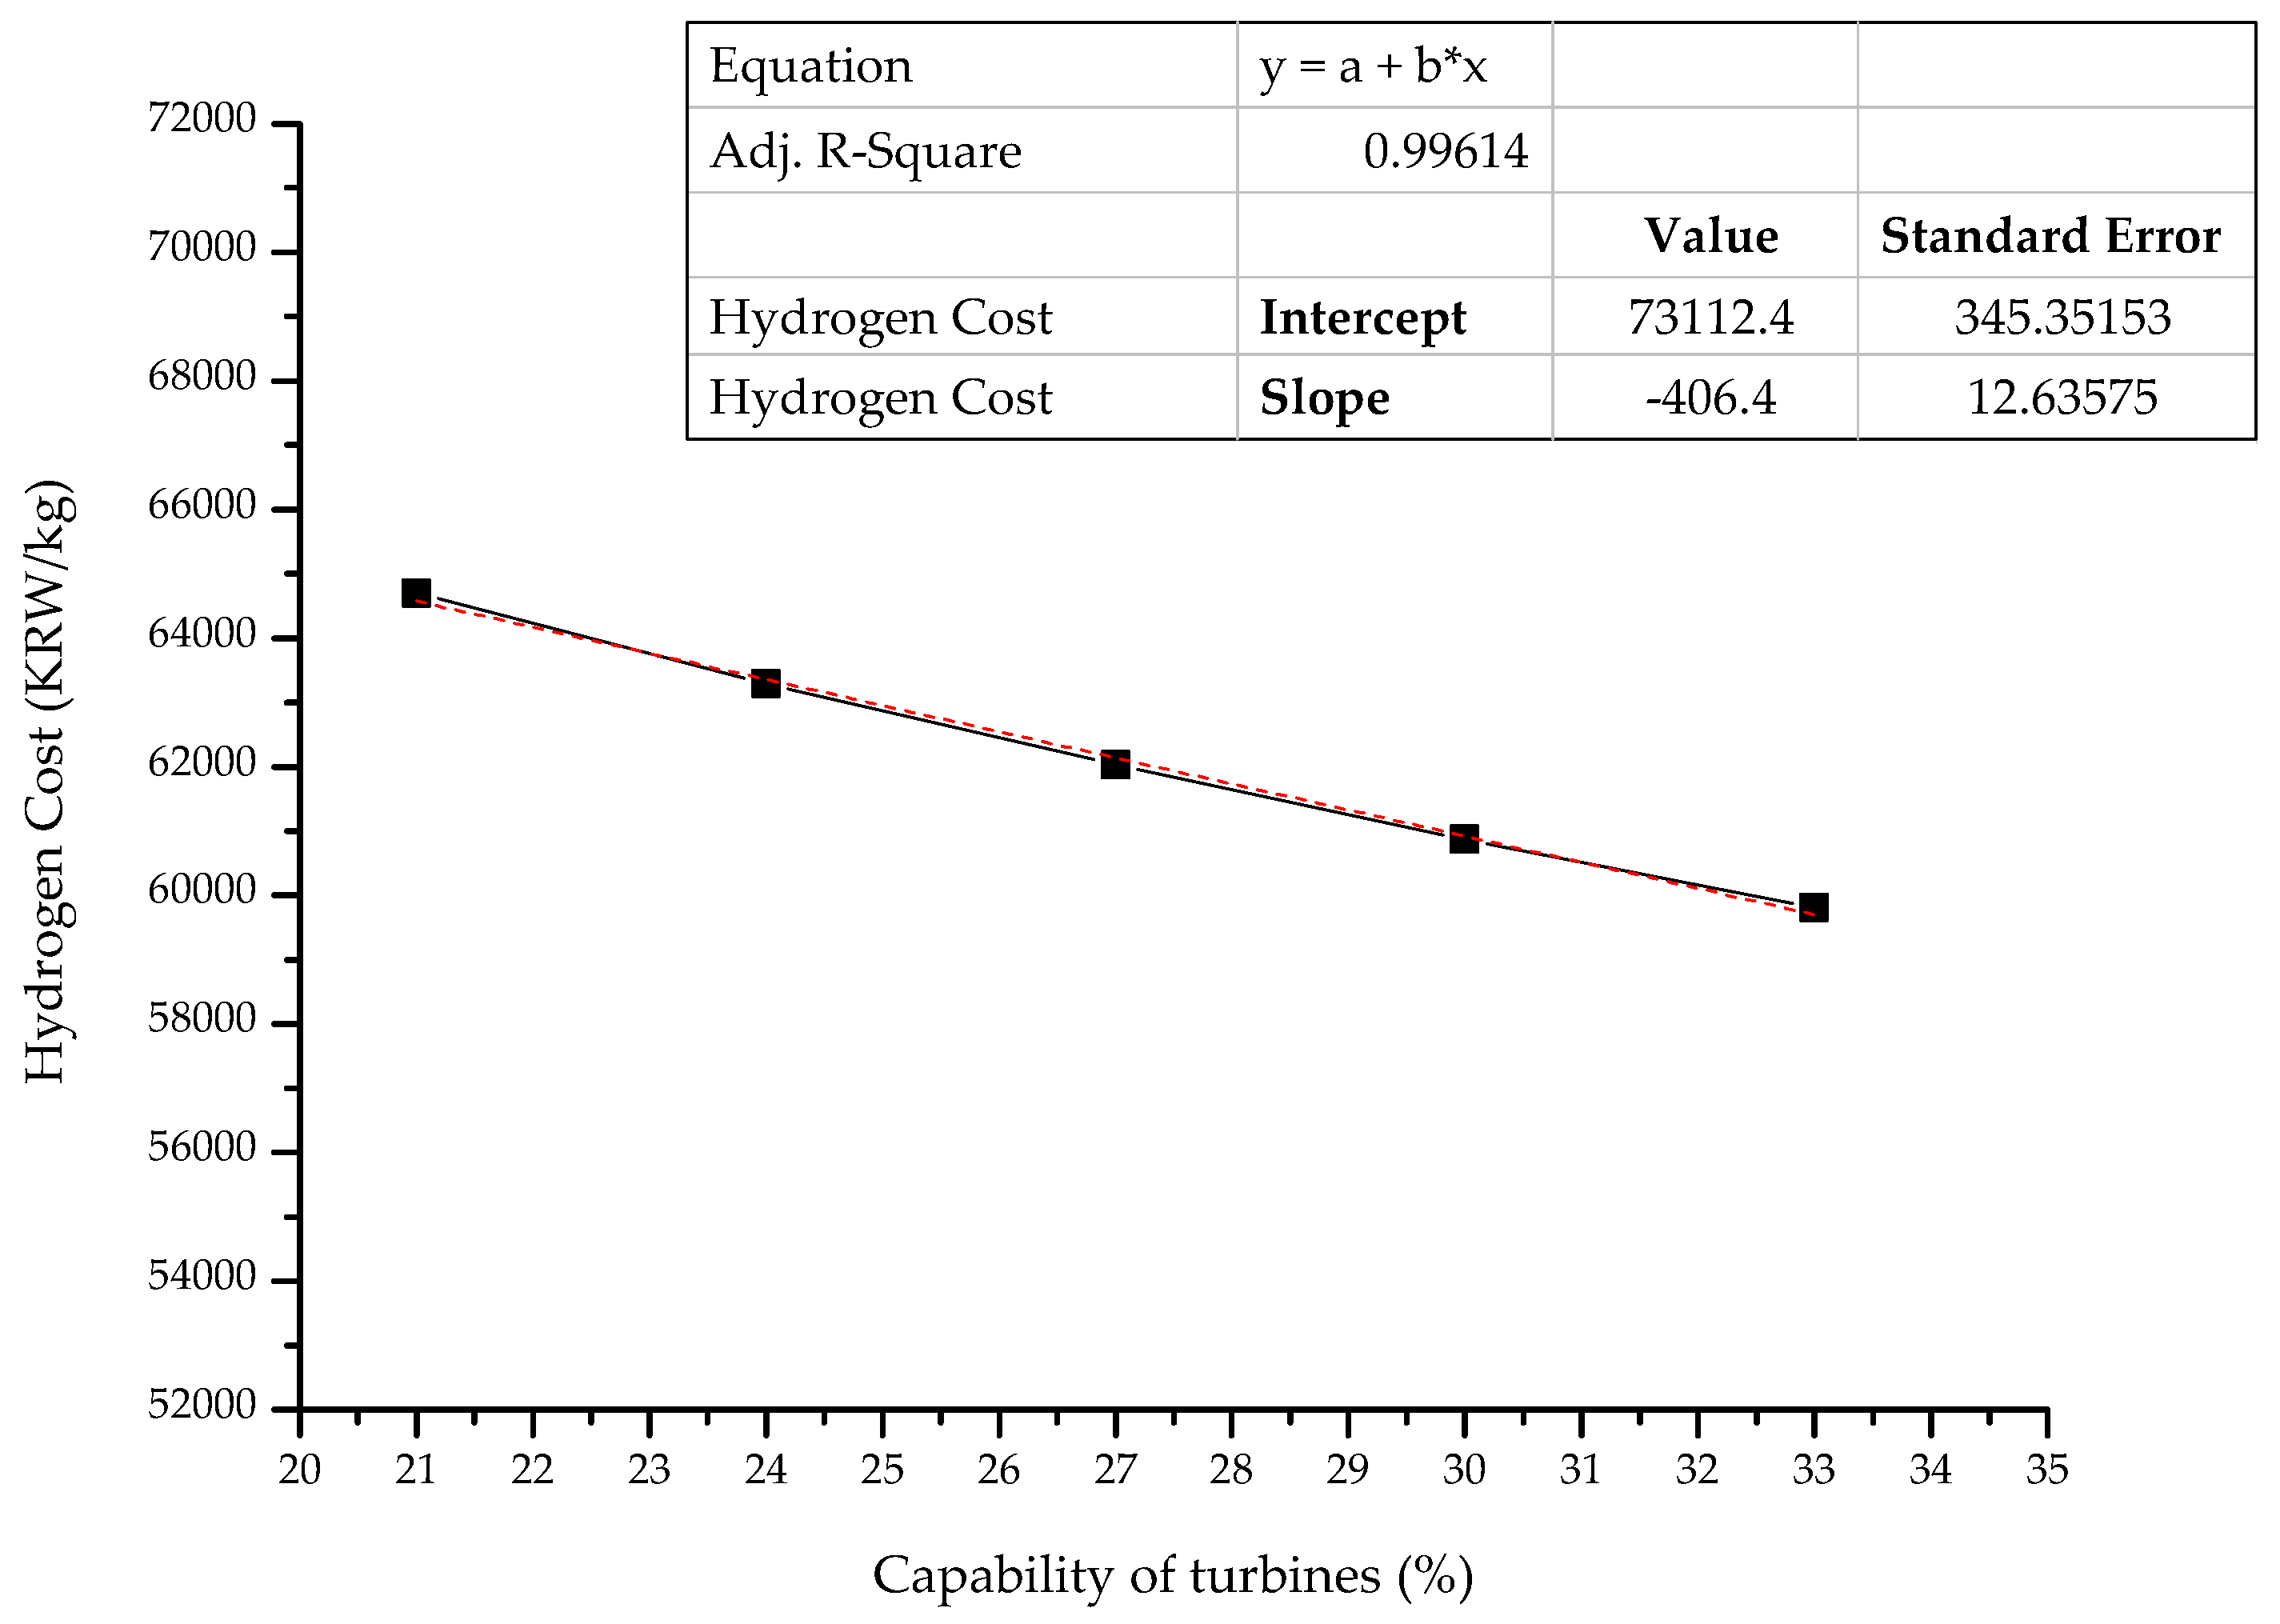
7.1. Variation in Hydrogen Cost Depending on the Capability of Wind Turbines

Analysis of the co-relationship between the hydrogen price and capability of wind turbines in the “H” wind farm was performed as the capability changes in a range of 21% to 33% in Figure 4. For immediate recognition of cost variance and comparison with other factors, the scale of the y-axis for every sensitivity analysis followed in Section 7 is fixed to be from KRW 52,000 to KRW 72,000.
The average capability of wind turbines in the “H” wind farm is 27%, which is applied to organizing previous scenarios in Section 6. If capability rises to 30%, the hydrogen cost could be reduced to KRW 60,871/kg (USD 44/kg). Otherwise, the capability falls to 21%, a normal capability of an onshore wind farm in South Korea. The hydrogen cost has to be adjusted to KRW 64,692/kg (USD 47/kg). As a result of regression analysis, when the capability of turbines in the “H” wind farm fluctuates by 1%, hydrogen cost will change by KRW 406 per kg.

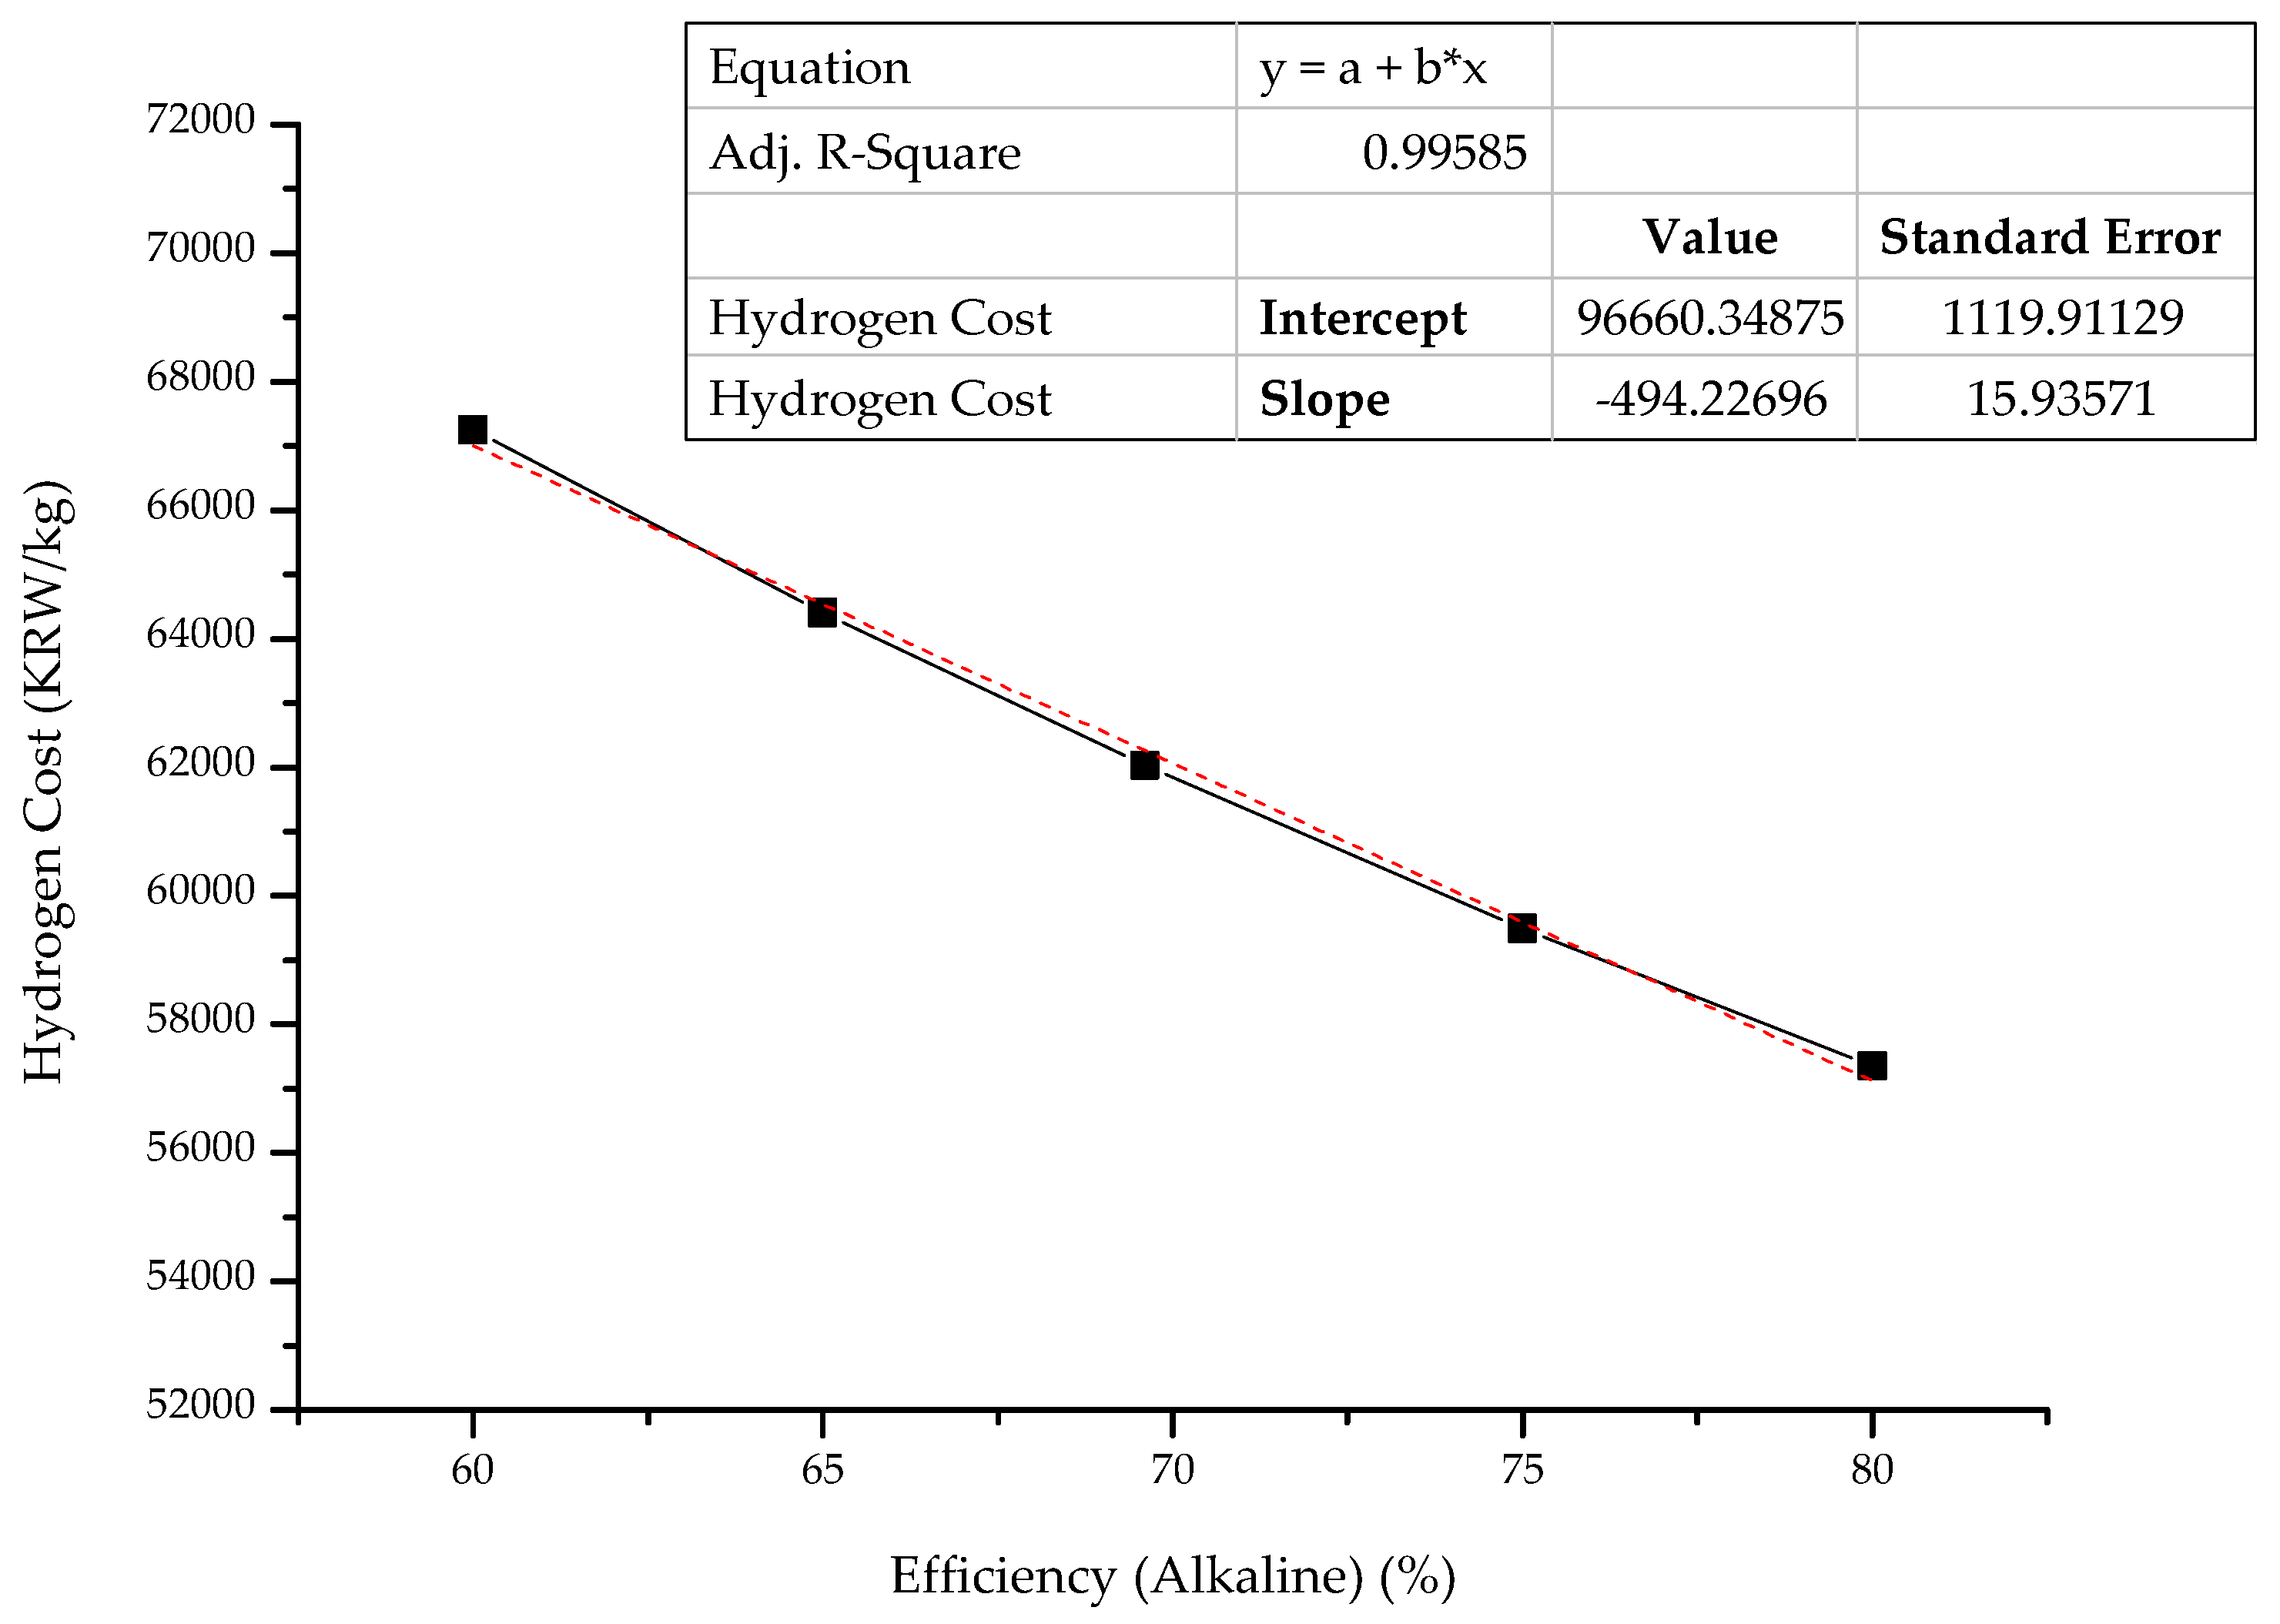
7.2. Variation in Hydrogen Cost Depending on the Efficiency of Alkaline-Type Water Electrolysis

The alkaline-type water-electrolysis efficiency is 69.6%, but the actual efficiency will be identified after the demonstration period. Sensitivity analysis was conducted to expect how hydrogen cost changes, as this efficiency is determined as the facility enters operation. See Figure 5 below.
If the efficiency of the water electrolysis becomes 60% during operation, the hydrogen cost will be KRW 67,250/kg (USD 48/kg), not KRW 62,029/kg (USD 45/kg), as suggested in Scenario I. If the efficiency improves through technology development by 80%, the hydrogen cost will be dropped to KRW 57,345/kg (USD 41/kg). When the alkaline water-electrolysis efficiency changes by 1%, sensitivity to hydrogen cost varies (KRW 494/kg).

7.3. Variation in Hydrogen Cost Depending on Efficiency of PEM-Type Water Electrolysis

PEM-type water-electrolysis efficiency is expected to be 56% with design data. As efficiency changes during operation, hydrogen price is expected to change as follows.
Variation in the hydrogen cost per 1% of the PEM-type water-electrolysis efficiency is investigated as KRW 326/kg (See Figure 6), which is less sensitive than alkaline-type water electrolysis. If the PEM-type water-electrolysis efficiency is 50%, the hydrogen cost will increase to KRW 64,032/kg (USD 46/kg). Otherwise, the efficiency increases to 65% and the cost may be reduced to KRW 59,287/kg (USD 43/kg).

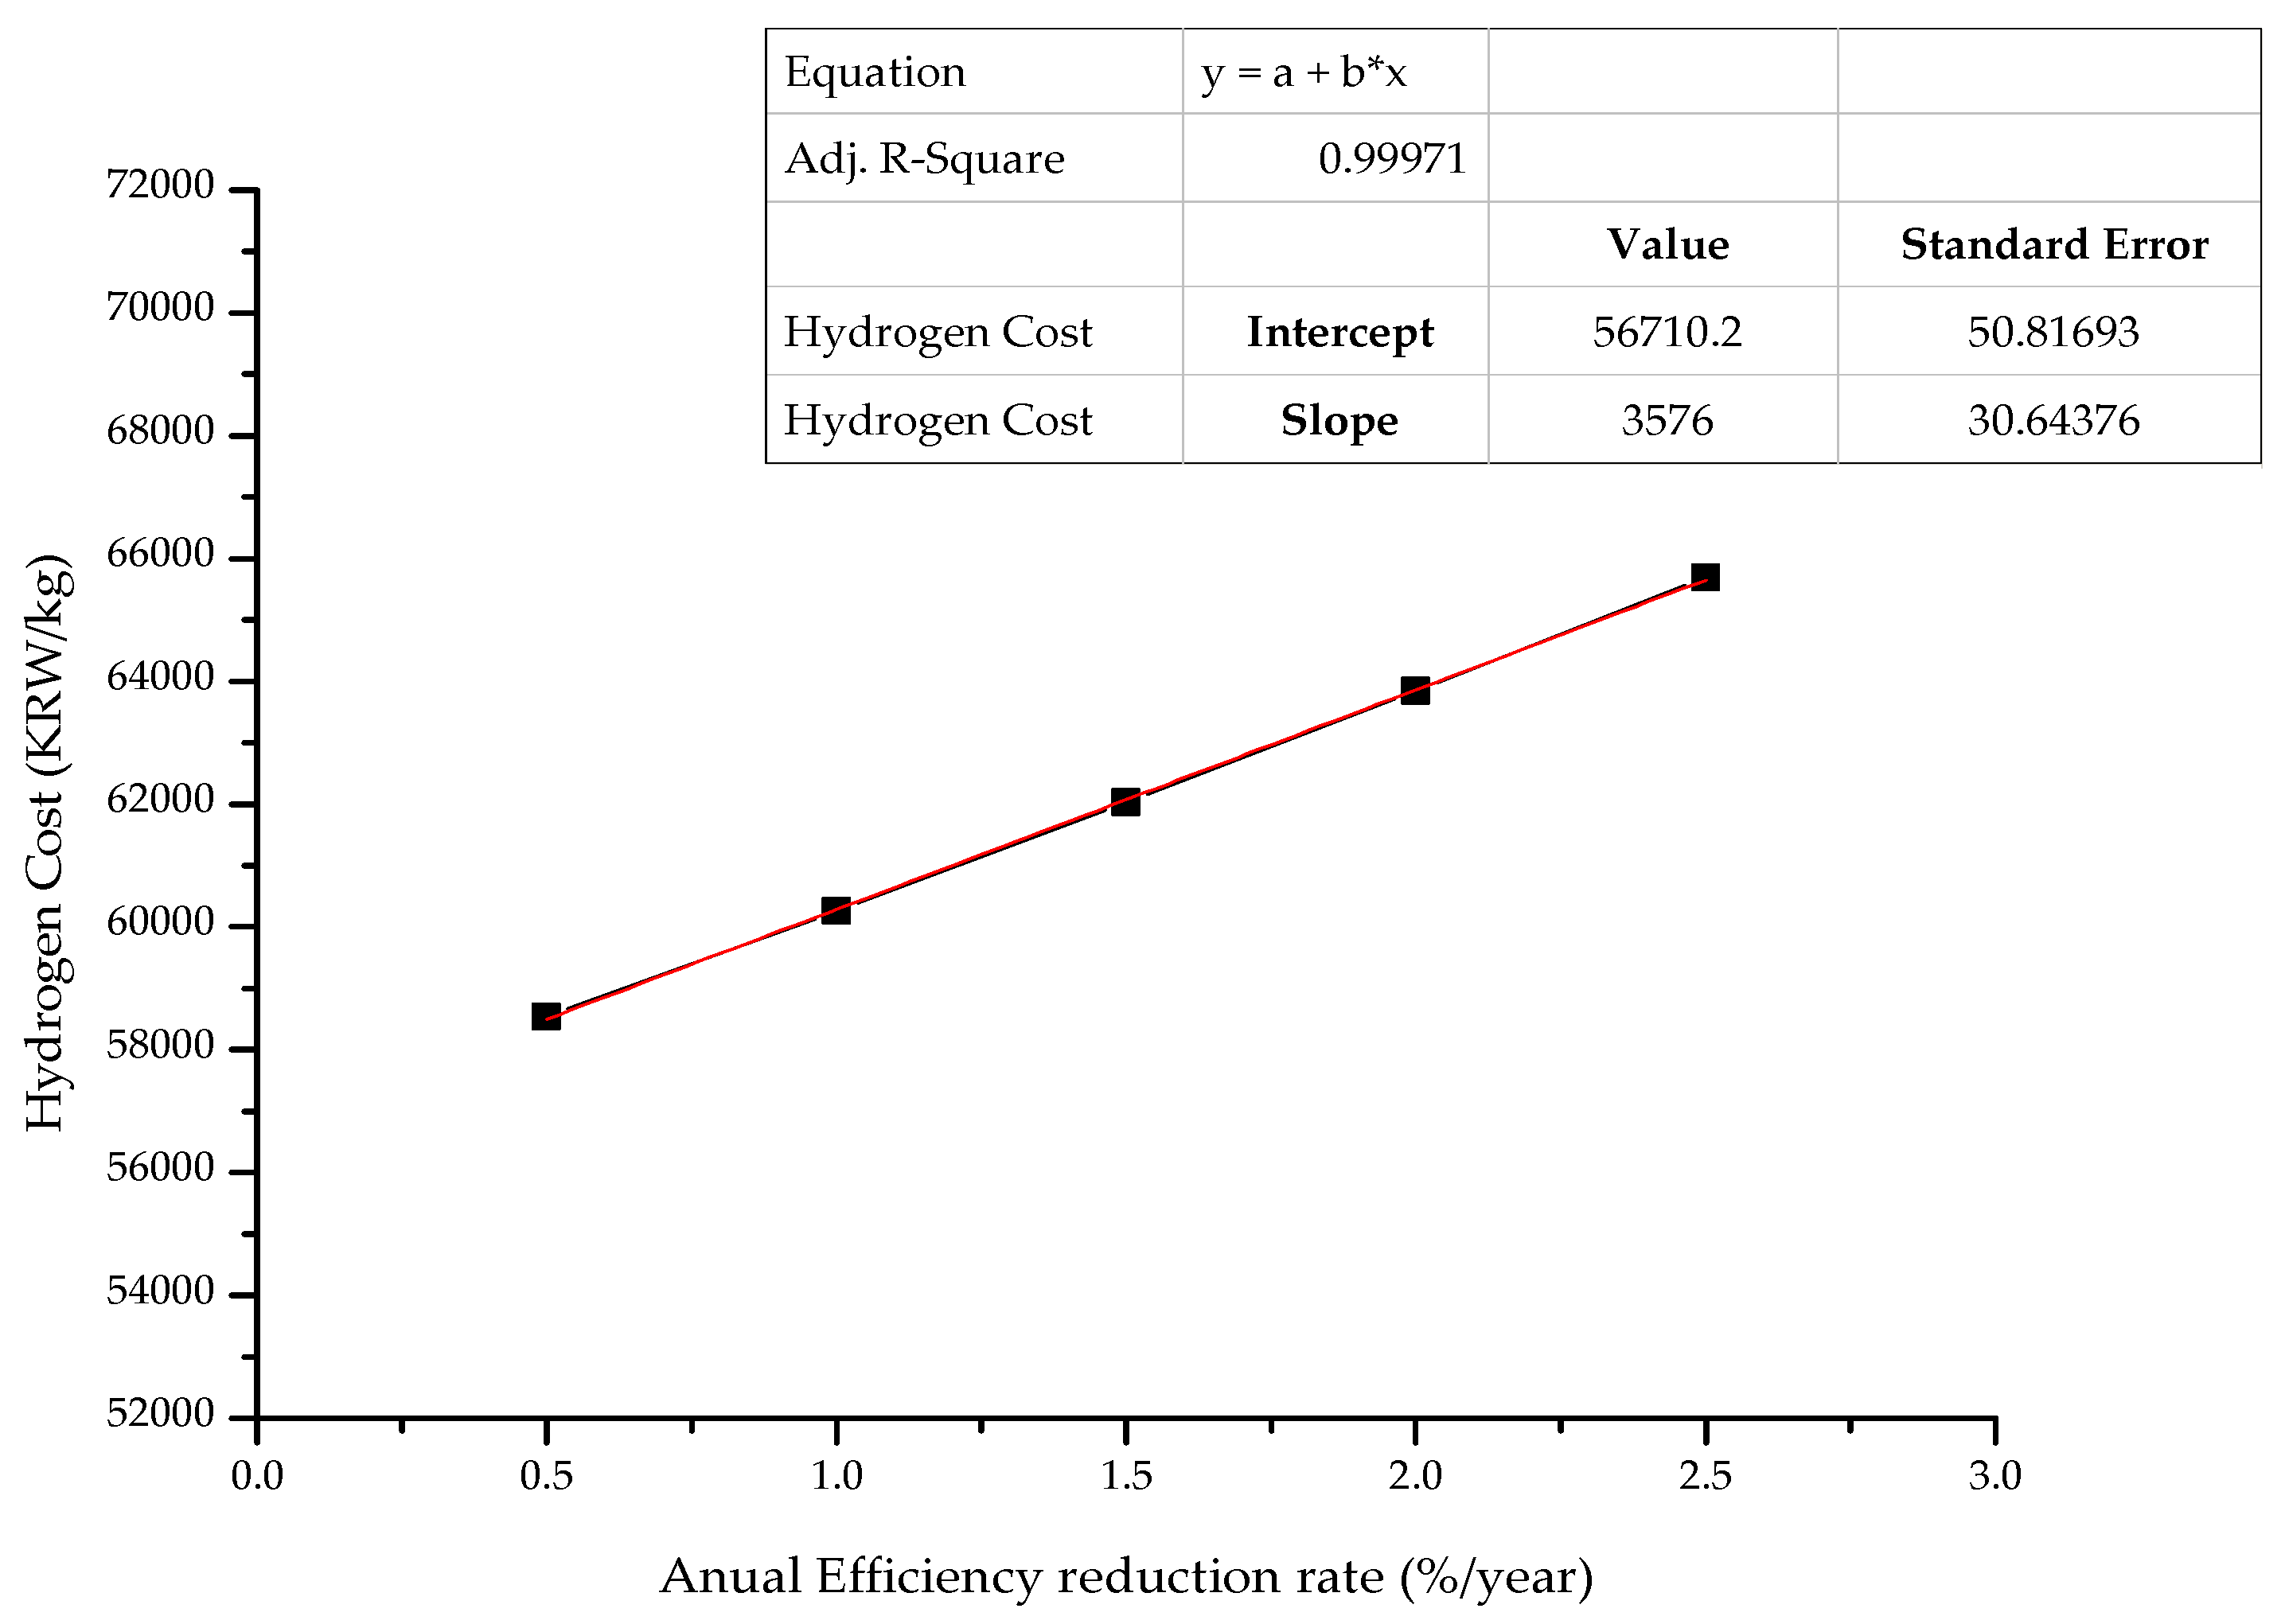
7.4. Variation in Hydrogen Cost Depending on Annual Reduction Rate of the Efficiency of the Electrolysis Stack

The water-electrolysis stack ages over the years, causing a gradual decrease in efficiency and leading to decreased power consumption for hydrogen production. The economic analysis was conducted with the assumption of a 1.5% reduction in efficiency every year for both alkaline and PEM types in Section 6. This annual reduction will be identified during the demonstration and commercial operation. This analysis estimated the variation in hydrogen cost according to changes in the annual reduction rate of efficiency for water electrolysis.
When the annual reduction rate of efficiency is 0.5%/year, the hydrogen cost will be calculated as KRW 58,543/kg (USD 42/kg) as shown in Figure 7 below. If the annual efficiency reduction is higher than expected and represents 2.5%/year, the hydrogen cost has to be changed to KRW 65,695/kg (USD 47/kg). Through regression analysis, 0.1% of the annual reduction for efficiency results in variation in the hydrogen cost to KRW 358/kg.

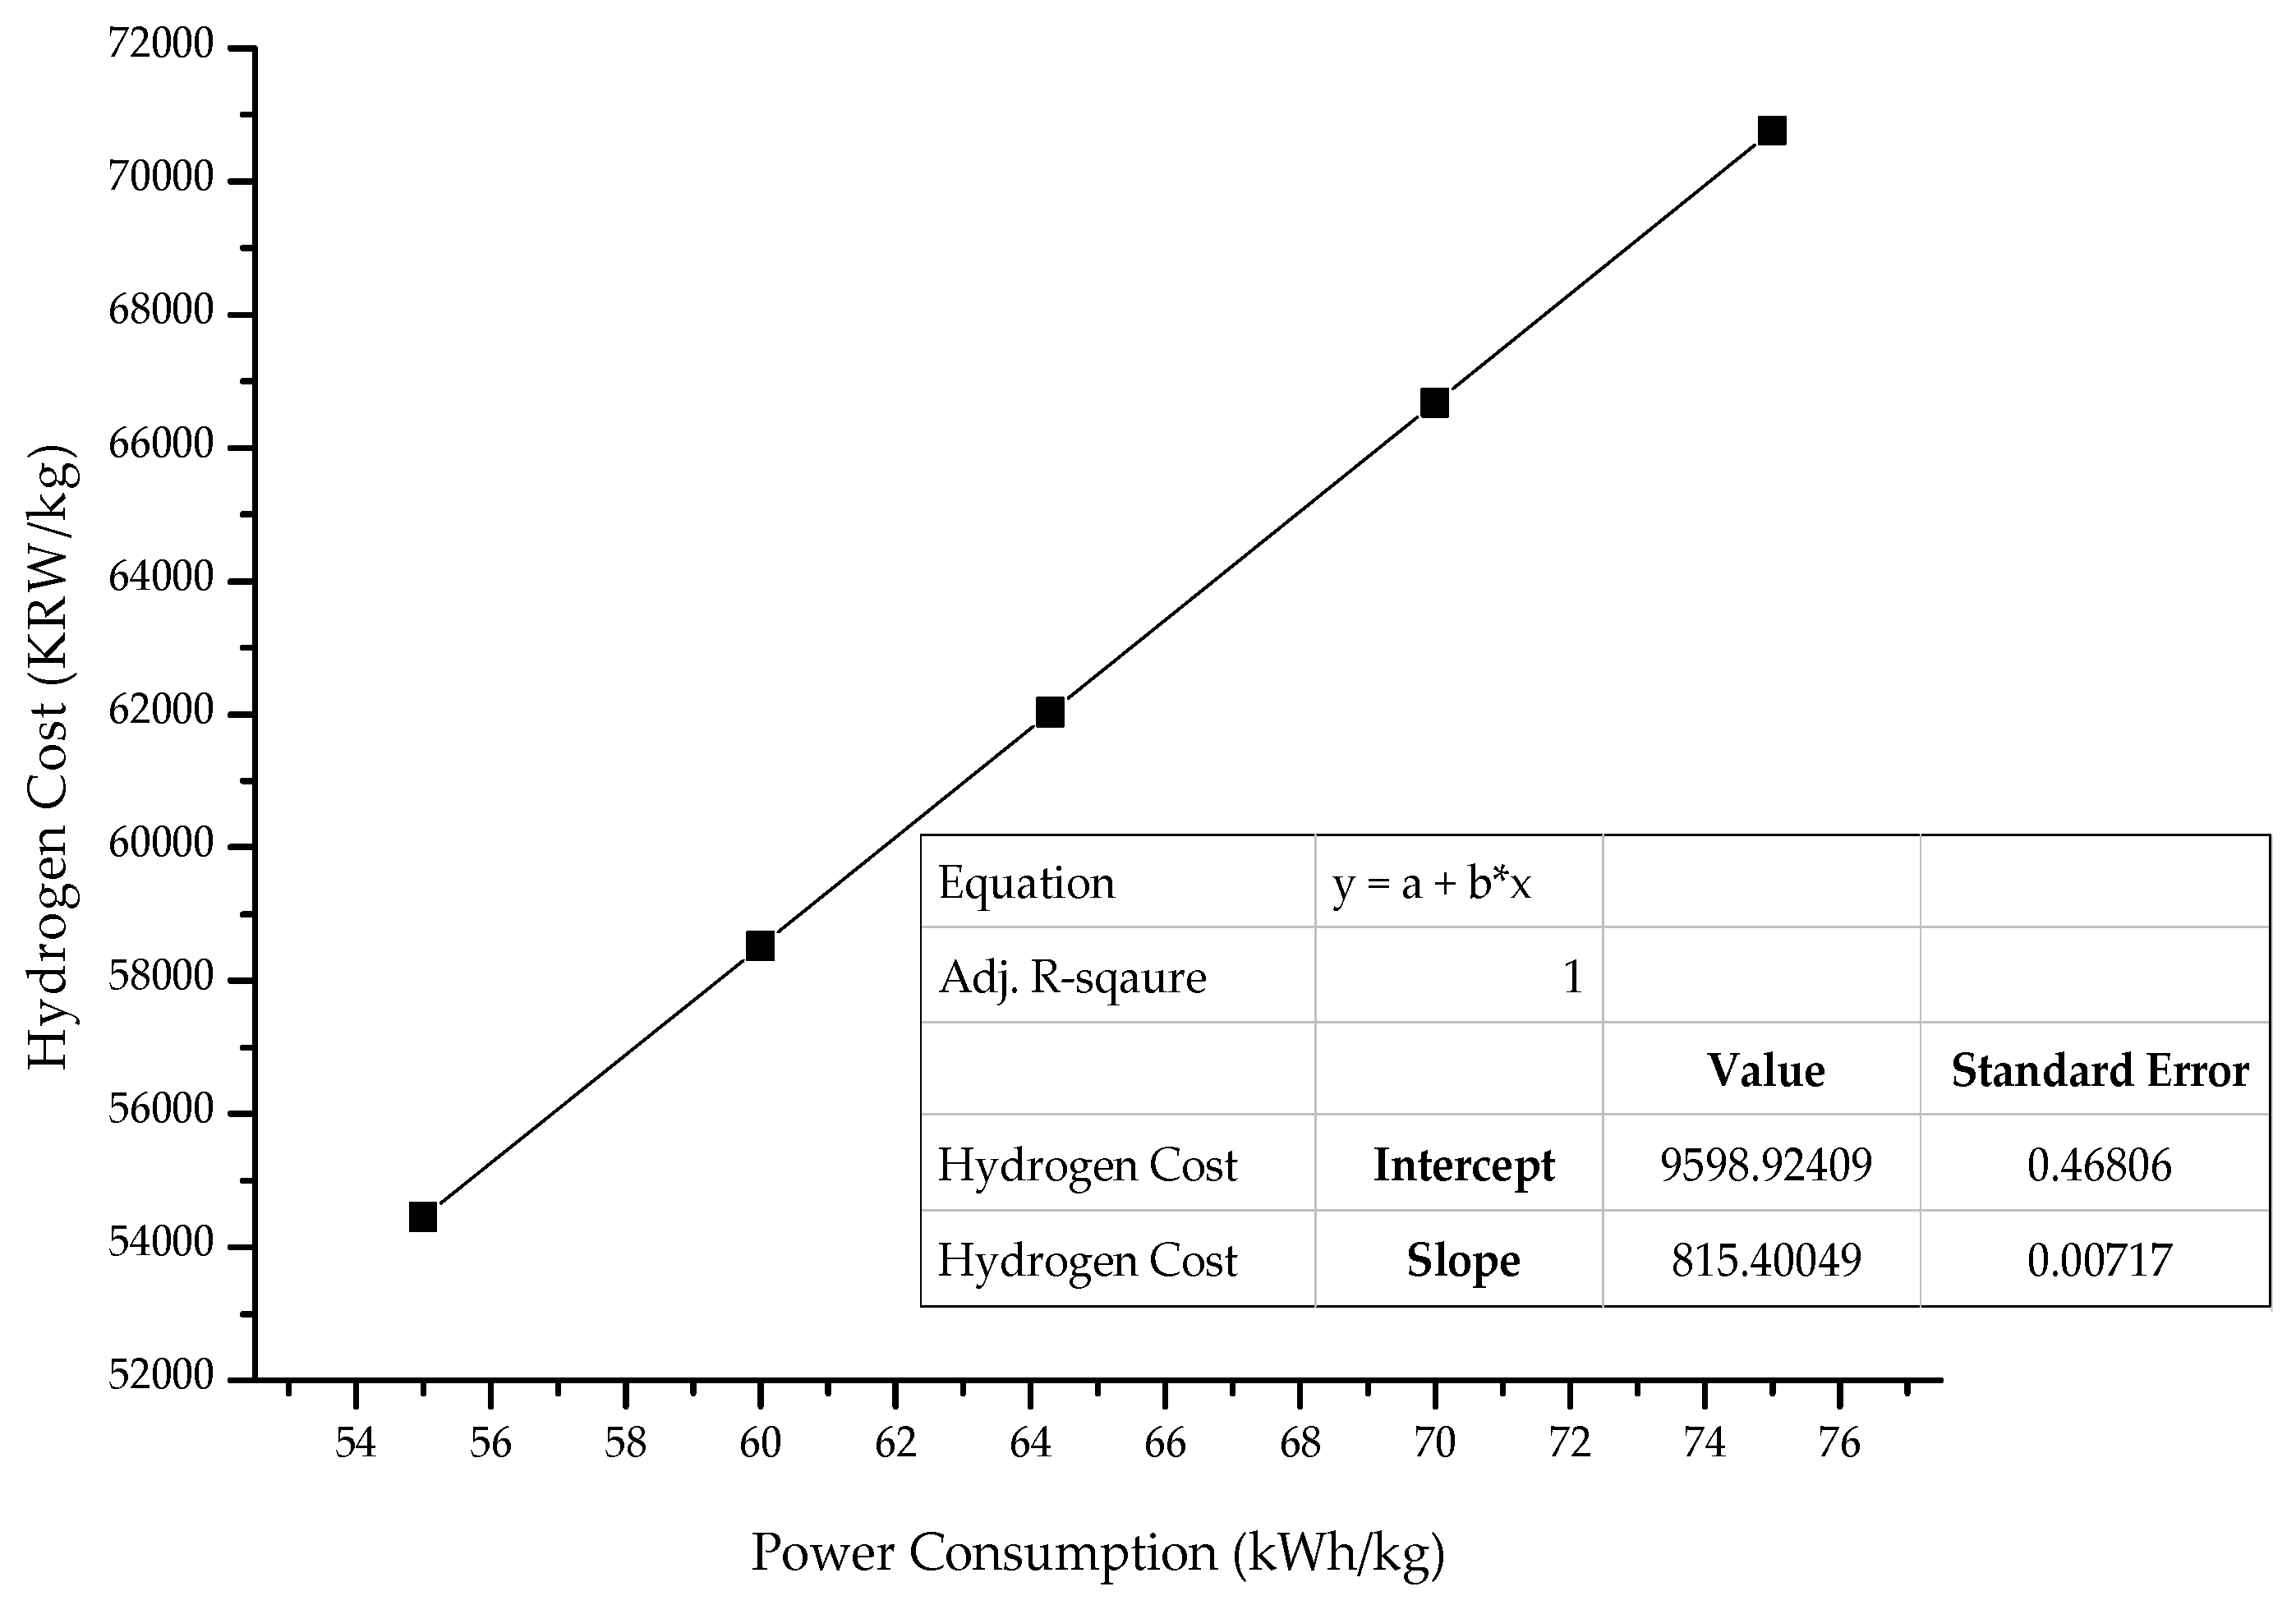
7.5. Variation in Hydrogen Cost Depending on Power Consumption for Hydrogen Production

Power consumption for hydrogen production in water electrolysis is an essential factor in hydrogen productivity. Power consumption is the electricity consumed for a unit weight (1 kg) of hydrogen production. When determining hydrogen cost, this power consumption value is directly divided by the total electricity supplied to the water electrolysis without any conversion or addition. Since this factor is an indicator that shows the facility’s performance and directly affects the hydrogen price, analysis is necessary to see how the hydrogen cost changes when this figure varies.
If the power consumption of hydrogen increases to 75 kWh/kg, the cost of hydrogen will rise to KRW 70,754/kg (USD 51/kg) as shown in Figure 8. However, if the power consumption improves to 55 kWh/kg, the hydrogen price will be KRW 54,446/kg (USD 39/kg). As shown in Figure 7, the slope (i.e., sensitivity) of the graph is comparatively steep compared to other regression analyses performed above. The sensitivity to hydrogen cost is KRW 815/kg per 1 kWh/kg.

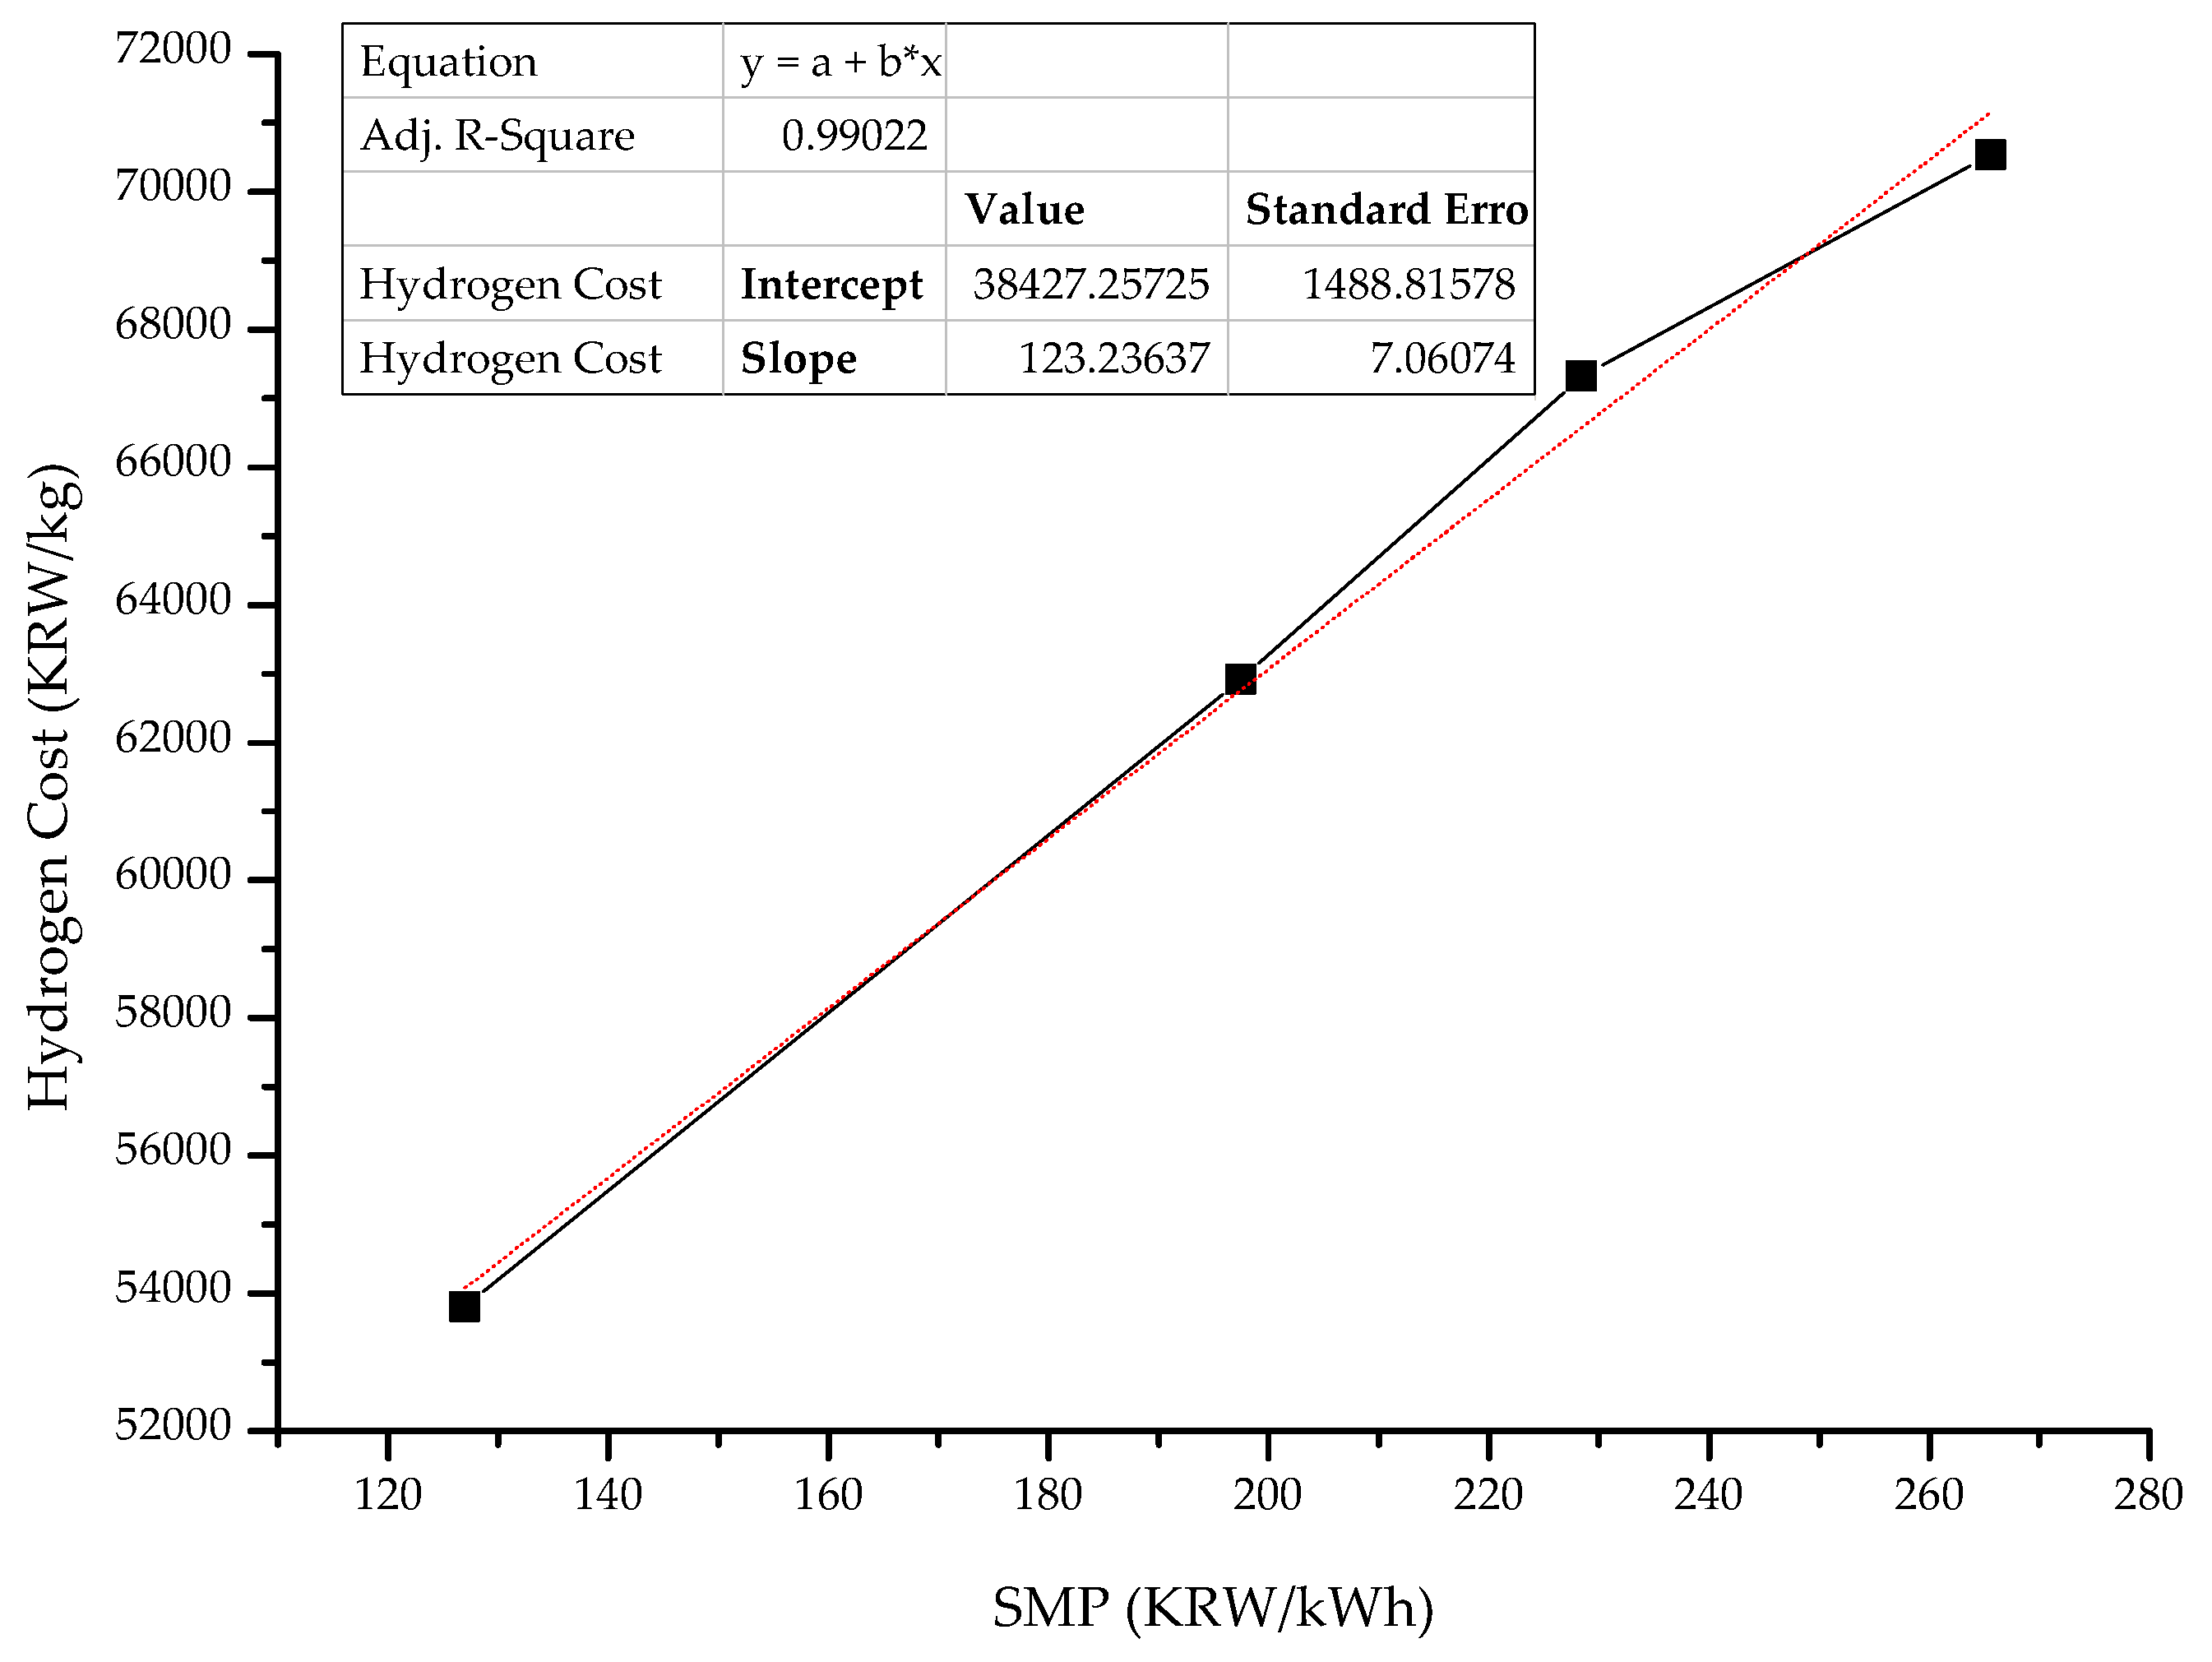
7.6. Variation in Hydrogen Cost Depending on SMP

As mentioned before, electricity and tap water are major raw materials used in producing hydrogen. Among these, electricity expenses charge around half (45%) of total expenses, as in Scenario I, which indicates that the price of purchasing electricity impacts the hydrogen costs greatly. In the calculation of hydrogen cost, expenses of purchasing grid electricity were applicable based on contract unit price (Equation (7)), and expenses of purchasing electricity for wind power were considered as opportunity expenses based on settlement unit price, which is the price sold to KEPCO when renewable energy generation companies trade this electricity.
SMP, the basis for calculating contract unit and settlement unit prices, has risen sharply since early 2022, as shown in Figure 9 and Figure 10. Reflecting the recent trend of electricity market price, SMP and settlement unit price for estimating raw material expenses were imported and averaged from the previous records from January to August 2022, as mentioned in Section 6.
If the market prices for electricity (i.e., SMP and settlement unit price) return to the price at a specific period previously, revision of hydrogen cost can be performed using the same economic analysis procedure described in Section 5. Updated and estimated hydrogen costs when applying the previous value of two factors (contract unit price and settlement unit price) are given in Table 28. Even within one year, a difference of up to KRW 16,734/kg (minimum KRW 53,805 and maximum KRW 70,539) occurred depending on changes in two unit prices.
Changes in the contract unit price and settlement unit price are related to changes in SMP. These have linear relations proportionally to each other. During the configuration presented in Table 28, the applicable SMP to the contract unit price was 127.0, 197.5, 265.6, and 228.4. Regression analysis with these SMPs and hydrogen costs was performed as shown in Figure 11 below.
When SMP varies by KRW 10/kWh, the hydrogen cost changes by KRW 1232 per kg (variation of only KRW 1/kWh SMP is not a concern in the market). This result implies that SMP is the most sensitive factor among all sensitivity analyses performed in Section 7.

7.7. Summary of Sensitivity Analysis

The sensitivity of the respective factor is given through the sensitivity analysis presented in Section 7.1, Section 7.2, Section 7.3, Section 7.4, Section 7.5 and Section 7.6 and is summarized as described in following table (Table 29).
The summary of sensitivity analysis identifies that SMP is the most influential factor in determining the hydrogen cost. The impact of SMP on the hydrogen economy implicates facility operation companies in determining business strategy in the future. When operating the water electrolysis, the employee should periodically monitor changes in SMP (including changes in settlement unit price) and update the hydrogen costs to obtain a competitive power for lowering hydrogen price when SMP decreases or to prevent loss from SMP increases by rising hydrogen price. Water-electrolysis companies are also recommended to find a way to purchase electricity (as a raw material) at a fixed price for a certain period.

8. Proposals for a Reduction in Hydrogen Cost

To support the supply chain, relevant corporations and organizations need to lower hydrogen costs regarding technical development and policy settlement. The hydrogen costs in a range from KRW 62,029/kg (USD 45/kg) to KRW 78,934/kg (USD 57/kg), estimated in the economic analysis based on scenarios in Section 5, are much higher than the future target of the hydrogen market price (KRW 3000/kg (USD 2/kg)), suggested by the Korean Government [27]. Several proposals are presented to lower the hydrogen cost during this economic analysis. Some could be applicable through optimizing operating techniques and control; otherwise, some may not be applied immediately. If these proposals can be realized through consultation and supplementation by related institutions, hydrogen costs can be reduced, and this green hydrogen will have a competitive power in the sales market.

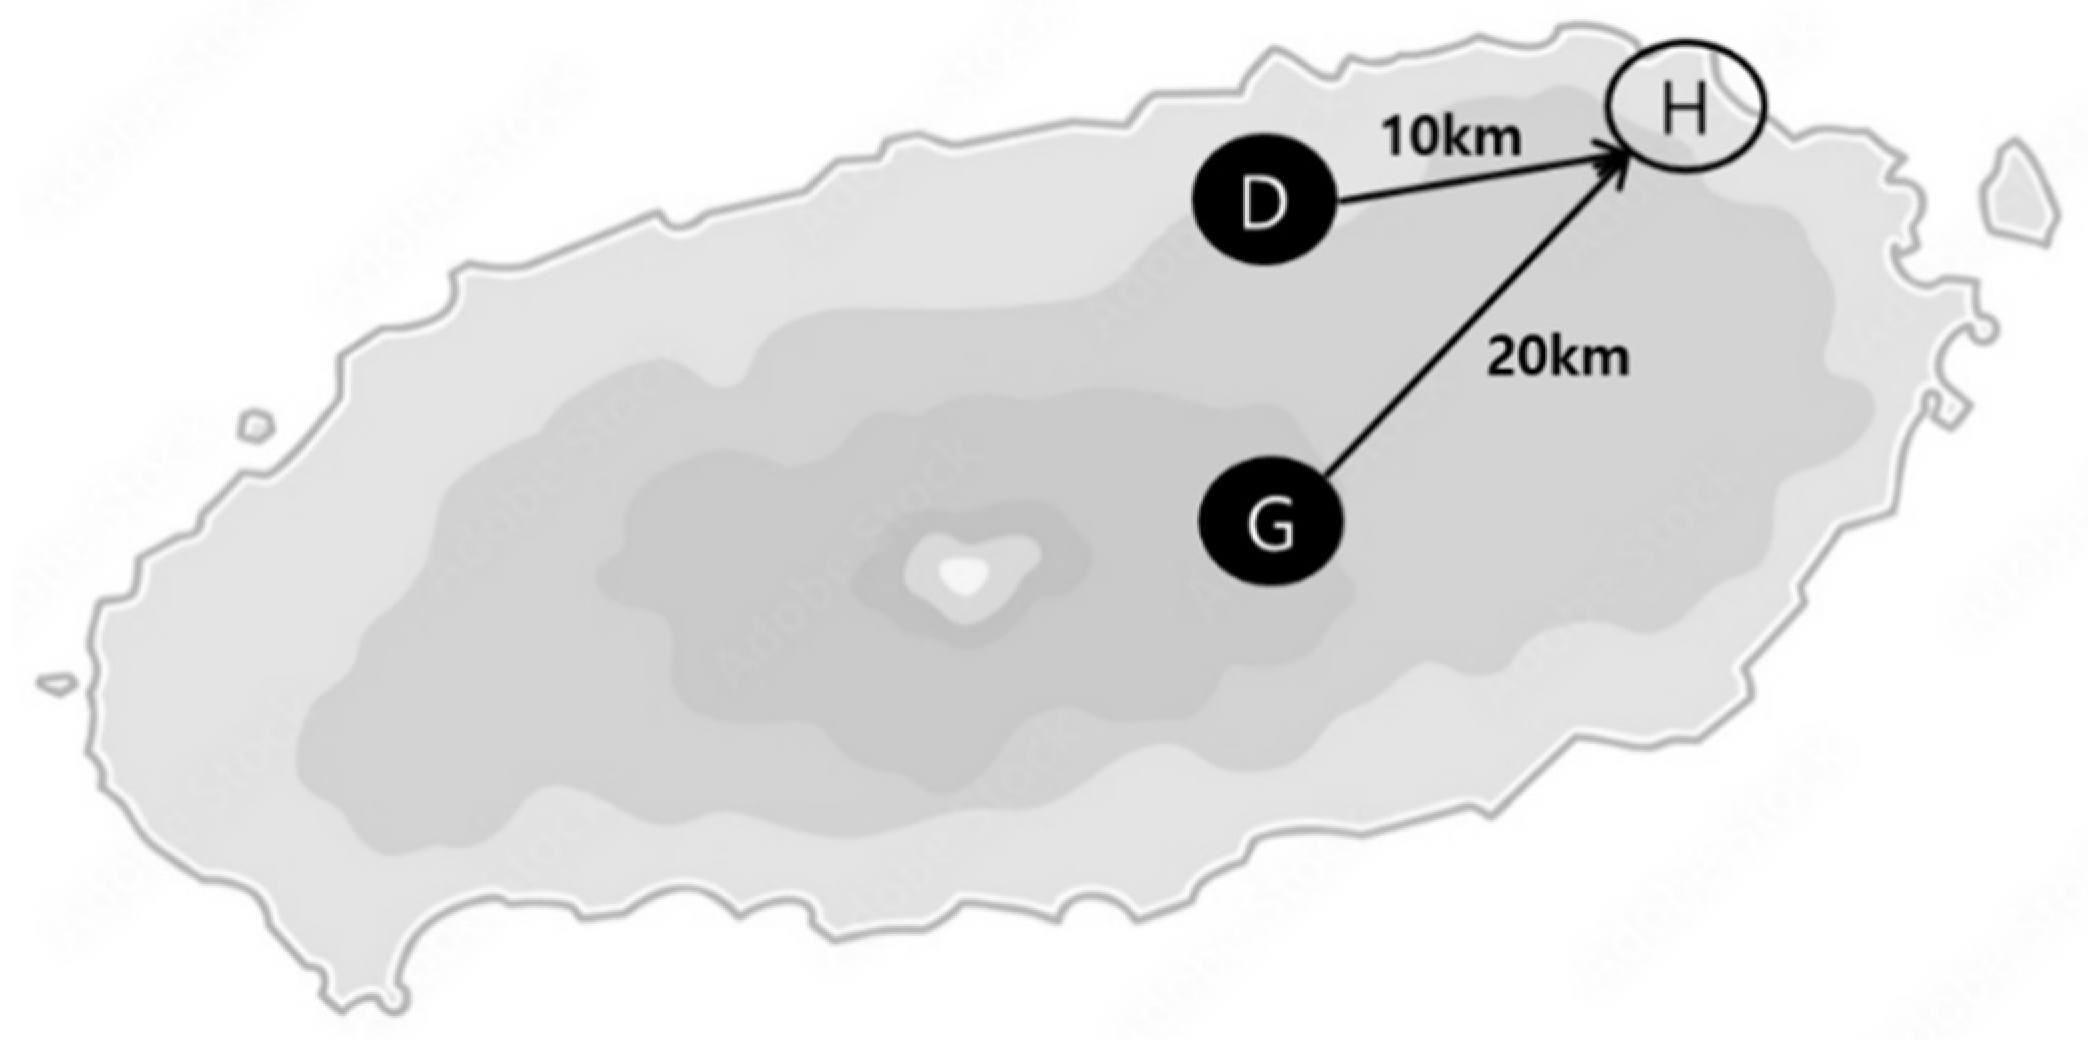
8.1. Absorption of Curtailment Assigned to Other Wind Farms—Scenario V

In the economic analysis of Scenarios I to IV in Section 6, hydrogen costs were estimated under the condition that curtailed electricity is supplied to the water electrolysis from only the “H’ wind farm.
Curtailment is forced on all wind farms and is not limited to the “H” wind farm. As the amount of generation from wind energy increases, the amount of curtailment increases proportionally. As of 2020, the amount of curtailed electricity for the “H” wind farm was 253 MWh, while 19,449 MWh occurred on the entirety of Jeju Island during the same period, as shown in Table 1.
If curtailed electricity from other wind farms can be used for this water-electrolysis facility, the amount of overall lost energy will be reduced. For a water-electrolysis operation company, additional raw materials for electrolysis can be obtained without any opportunity cost against electricity sales (i.e., for free) if curtailed energy from other wind farms is acquired.
When supplying curtailed electricity from other wind farms to the water electrolysis, a physical connection between wind turbines in other farms and the water electrolysis is not required because the curtailed energy is a conceptual number to be forced. The only instruction from the Korea Power Exchange (KPX) indicates that “the electricity generated, but not transmitted to the grid”. Therefore, the “assigned amount” imposed on other wind farms can be implemented at the “H” wind farm instead. The total amount of curtailed energy that the “H” wind farm has to implement will increase, whether in all wind farms or the water-electrolysis facility. Because electricity for sale and curtailed electricity are physically the same, all increased amounts of curtailed electricity can be provided by an “H” wind farm and supplied to the water electrolysis without any electricity expenses.
Furthermore, other wind farms can sell additional electricity without limit when the “H” wind farm executes curtailment instead. As this “transfer of curtailment” brings other wind farms to additional profits because of non-implementation of curtailment, the share of the profits between other wind farms and the “H” wind farm can be discussed. If the abovementioned system is settled, this transfer can be called a “curtailment trading system”.
In this proposal, economic analysis was conducted by assuming the absorption of curtailment from other wind farms and supplying them to the water-electrolysis facility (Scenario V). Two wind farms that will “transmit curtailment” to the “H” wind farm are selected on Jeju Island. Among farms there, the selection was limited to the farms owned by the same company as the “H” wind farm because if owners are different, considerations, such as transaction methods and tax issues, should be added, which may increase uncertainty for the estimation of hydrogen cost.
Therefore, only the transmission of curtailment within wind farms owned by the same company was set as a condition in Scenario V rather than trading between different companies. The owner of the “H” wind farm also operates “D” and “G” wind farms on Jeju Island, as shown in Figure 12. The assumption is made that the water electrolysis located near the “H” wind farm absorbs curtailment of the “D” and “G” wind farms and the “H” wind farm.
Hydrogen production can increase using this wasted energy, with slightly increased raw material expenses (only tap water expenses). The “D” and “G” wind farms can also have the advantage of non-implementation of curtailment, which prevents profit loss for the wind farm. As shown in Table 30, “D” and “G” wind farms have a larger capacity of wind turbines than the “H” wind farm and the amount of curtailed electricity is proportionally larger.
The premise of the economic analysis of hydrogen production by absorbing curtailment from other wind farms is as follows. The annual amount of curtailed electricity from “D” and “G” wind farms in the calculation is applied to previous records in 2021, 2,170,821 kWh/year and 1,396,1164 kWh/year, respectively. Other conditions are the same as Scenario I, shown in Table 31.
The amount of electricity supplied to the water electrolysis, including curtailed energy from the three wind farms, is presented in Table 32. Total supplied electricity is expected to be 15,153,822 kWh, which increased by 30.8% compared to the amount (11,586,837 kWh) in Scenario I. The amount of curtailed energy increased from 286,437 kWh to 3,853,422 kWh compared to Scenario I. As only a 5.8% ratio of the difference between wind power electricity “To be purchased (31.2%)” and “for free (25.4%)” is found in Table 32, a remarkable expense reduction is expected.
Whole expenses incurred during the entire business period are shown in Table 33. CAPEX is the same as in Scenario I. General operation expenses in OPEX also remain unchanged. Raw material expenses among OPEX slightly increased by 1.5% compared to Scenario I. Among these material expenses, electricity expenses (even though the amount of supplied electricity increased by 30.8%) are the same as in Scenario I. Since operating expenses for tube trailers are proportional to the amount of hydrogen transported (i.e., the amount of hydrogen produced), they increased proportionally by the same ratio of hydrogen production compared to Scenario I. Overall expenses slightly increased by 3.3% of those in Scenario I.
The average amount of hydrogen produced for each type of water electrolysis is presented in Table 34. The average daily hydrogen amount is 355 kg for whole years, a dramatically increased result against 272 kg in Scenario I. With only 3.3% of increased expenses (refer to Table 33), 83 kg more hydrogen can be produced (over 30%) daily.
The amount of hydrogen produced during the entire business period is 1,946,262 kg, which increased by 30.8% from the amount in Scenario I (1,488,141 kg). Dividing this amount by the total expenses estimated through Table 33, the LCOH is made as KRW 50,000/kg∙H2 (USD 36/kg∙H2), which is the result of a KRW 12,029 reduction (20% reduction) of the cost compared to Scenario I.
This economic analysis only dealt with the transfer of curtailment within wind farms operated by the same company, and further discussions on transactions of curtailment between wind farms between different owners should be conducted to promote the trading system. Through this, attempts to acquire curtailed energy from other wind farms are recommended. This suggestion is attractive because curtailment can be transmitted only through the settlement of trading systems without any facility investment or technology development.

8.2. Enhancing Hydrogen Production through Maximizing Power Supply Capacity—Scenario VI

Through the economic analysis in Section 6, this study figured out that increasing the operation time of water electrolysis to produce more hydrogen helps to reduce the hydrogen cost, even if expenses increase. In this suggestion, the assumption to maximize the amount of hydrogen production is made during fixed operation time (same as Scenario I). Factors regarding operation plan for Scenario VI is summarized in Table 35 below.
The water-electrolysis facility was designed with a capacity of 3.3 MW (alkaline 2 MW + PEM 1.3 MW). The available maximum capacity of the water-electrolysis facilities is 4 MW, reflecting the capacities of utilities installed before and after the water electrolysis, where these auxiliary utilities (0.7 MW) can be a buffer of electricity storage/transmission.
Scenario VI is made to increase hydrogen production by maximizing electricity capacity to 4 MW, which combines water-electrolysis capacity and utility capacity. Up to 17,520,000 kWh per year can be obtained by inverse calculation when an extension of supplied power for each source is made. Table 36 shows the required values for occupying the maximum facilities’ capacity possible by enhancing the supply of electricity to alkaline and PEM-type water electrolysis at a ratio of 2:1.3. Other conditions, except for the above, are the same as Scenario I. The total amount of electricity from each power source to the water electrolysis can be up to 18,430,465 kWh annually to maximize hydrogen production.
In this scenario, the curtailment of the “H” wind farm is the same, but the capacities of the wind turbines (4 MW) and the grid capacity (1.5 MW) are selectively adjusted to fill 18,430,465 kWh closely (see Table 37 and Table 38). Wind power generation capacity is increased to maximize the electricity supply, presented in Table 37, and grid electricity capacity is increased with the same purpose, presented in Table 38.
As indicated in Table 37, if the wind power capacity increases to the maximum capacity of 9.38 MW while the grid electricity capacity remains as it is, the total capacity becomes only 17,949,255 kWh, which is less than the required power (18,430,465 kWh) for maximum operation. This is due to the capability of wind turbines (i.e., reduction in the supplied amount). Further, as this assumption causes half (12 h of a day) of the total electricity generated by the “H” wind farm to be consumed for hydrogen production, a shortage of electricity supply to existing demanders might be made in the neighboring region on Jeju Island. This extreme assumption is excluded from hydrogen cost calculation accordingly.
In the case of fixing the capacity of the wind power and increasing the capacity of grid electricity, as shown in Table 38, the amount of total electricity becomes 18,156,837 kWh if the capacity of grid electricity increases from 1.5 MW to 3 MW and grid electricity can be supplied sufficiently from KEPCO; otherwise, an extension of the wind power supply is limited, as mentioned above. Economic analysis based on this condition was carried out as in Scenario VI. Other conditions are the same within Scenario I.
Overall expenses increased by 31.3% compared to Scenario I, as described in Table 39 below. CAPEX and general operating expenses in OPEX are equivalent to those in Scenario I. Expenses for raw material among OPEX increased by 55.8% compared to Scenario I because the expense for purchasing electricity increased, as supplied electricity significantly increased. As the amount of hydrogen production increased, operating expenses for tube trailer, which depend on the amount of hydrogen transportation, also increased by 59.1%.
The average amount of hydrogen produced was calculated and is shown in Table 40 based on the supplied electricity presented in Table 38. An average of 432 kg hydrogen can be produced per day in Scenario VI, whereas only 272 kg hydrogen can be produced per day in Scenario I, with an increase of 150 kg daily.
The amount of hydrogen produced during the entire business period is estimated to be 2,367,094 kg, with an increase of 59.1% compared to Scenario I (1,488,141 kg). The LCOH calculated is KRW 52,029/kg∙H2 (USD 37/kg∙H2), which can be reduced by KRW 10,000, and a 16% decrease compared to Scenario I.
Verification of capacities of whole facilities and whether the increased electricity exceeds the limit of respective capacity shall be conducted in advance to configure the grid power-supply system with the maximum capacity. In addition, an investigation of the availability for transportation by tube trailers shall be followed under this condition. Furthermore, discussions with KEPCO and KPX should be held to ensure that 3 MW of electricity can be supplied for 12 h daily in the electricity supply chain system.

8.3. Commercialization of Co-Product (Oxygen)—Scenario VII

As recognized through Equations (1) to (2), oxygen is also produced as half the hydrogen in the water electrolysis. Since produced hydrogen has a high purity of 99.999% or more, the purity of oxygen is expected to be the same as that of hydrogen. High-purity oxygen is used in various industries, such as medical care, semiconductor manufacturing, and water purification. This oxygen is considered a high-value product with a high price. According to an interview, the sales price of high-purity oxygen in South Korea is around KRW 150,000 (USD 108) per 47 L [29].
An estimation is made of how hydrogen cost is affected if oxygen produced through the water electrolysis is sold as a product in addition to hydrogen (Scenario VII). The basic conditions of Scenario VII are the same as in Scenario I as Factors regarding operation plan are shown in Table 41 and amount of electricity to be supplied to Water electrolysis are shown in Table 42 respectively.
Additional facilities are required to treat high-purity oxygen for commercialization. Separate storage tanks, compressors, piping lines, and concentration controllers will be needed [30]. An additional site to install them and related investment costs, including hiring additional employees, may be required. However, only the cost of hydrogen is of interest in this economic analysis. Investment in a facility for oxygen treatment and a configuring system is to be reflected in the calculation of oxygen cost. Considerations for all facilities and employees for purification, storage, and transfer of oxygen are separate from the hydrogen cost calculation and are excluded from this study accordingly. Instead, when the produced oxygen is commercialized, some part of expenses for oxygen and hydrogen can be shared with the hydrogen side and oxygen side at a ratio of 2:1 (same as production amount ratio) or 1:1 (as per portions of laboring times). Therefore, the allocation of expenses to the hydrogen and oxygen costs at a certain rate is possible, as presented in Table 43.
CAPEX can be shared with a production amount ratio of hydrogen and oxygen. Sixty-seven percent of CAPEX is charged as the expenses for hydrogen production and thirty-three percent as the expenses for oxygen production. Even though the expense of purchasing one tube trailer is included in CAPEX, this expense can be ignored due to its very small ratio compared to the total CAPEX. Allocation for breakdowns of OPEX is distinguished in that some should be allocated as per production volume or as per portion of laboring time proportionally, but others should not be because that (e.g., expenses for tube trailer operation) is incurred regardless of oxygen production. Since general operating expenses in OPEX are independent of production volume and employees will spend their working time on hydrogen and oxygen production, they are allocated equally to hydrogen and oxygen expenses (i.e., hydrogen expenses will decrease by half compared to the existing ones). Since the expenses of raw materials (electricity + tap water) are proportional to the production amount, the allocation ratio of hydrogen and oxygen should be 2:1. For expenses for the tube trailer, these shall be exclusively charged for hydrogen costs.
The expenses reflecting the commercialization of oxygen (share of expenses) are as follows (Table 44). As described above, most breakdowns in CAPEX and OPEX were reduced by 33% or 50%. Finally, the overall expenses were reduced by 34.7% compared to Scenario I.
The average amount of hydrogen production was calculated to be 272 kg per day, as there was no change from Scenario I. See Table 45 below.
As a result of dividing the total amount of hydrogen by the saved expenses, as referred to in Table 44, the LCOH is KRW 42,173/kg∙H2 (USD 30/kg∙H2), which is lower by KRW 19,856 (32% reduction) compared to Scenario I.
Commercialization of oxygen produced through water electrolysis is worth considering because oxygen can lower the hydrogen cost and earn additional profit through sales of high-purity oxygen. Several considerations, such as additional investment for oxygen production infrastructure, insufficient relationship to existing businesses (i.e., wind power generation and hydrogen distribution), and licensing and permission problems to register oxygen manufacturing and sales, should be made in advance. Above all, due to the isolated geography of Jeju Island, investigation and development of demand for high-purity oxygen in the limited area should be carried out as a priority.

9. Calculation of Opportunity Costs

In this section, opportunity cost was calculated to represent potential benefits when choosing other alternatives rather than establishing a P2G Green Hydrogen Production System. The formula [31] for calculating an opportunity cost is as follows.
Opportunity Cost = FO − CO
where FO = Return on best forgone option; CO = Return on chosen option
Currently, this economic analysis only estimates production costs of hydrogen without considering profits; therefore, profitability cannot be estimated and compared using techniques, such as Net Present Value (NPV) or Internal Rate of Return (IRR). Instead, “FO” in the above equation changed to “Electricity production cost on best forgone option” and “CO” to “Electricity production cost on chosen option”, respectively, to compare the production costs incurred producing and selling 1 kWh of electricity. The “CO” is applied to the costs from Scenario I, in which the lowest hydrogen cost was made among the suggested scenarios. Although Scenarios V to VII show lower hydrogen costs than those in Scenario I, practically applicable Scenarios are I to IV at this time, so selection of the costs among Scenarios V to VII was excluded.
There are two main options (where “FO” can be selected) that can be chosen instead of producing hydrogen by establishing the P2G system, as below.
(1)
No use of Curtailed electricity
As it is now, “discarding” the curtailed electricity can be carried out as an alternative. In this option, any facility investment is required and no additional production occurs. Therefore, “FO” is zero and calculation of opportunity cost will not be performed.
(2)
Storing curtailed electricity in ESS battery rather than converting to hydrogen
This option is to establish an ESS battery rather than the water-electrolysis facility without configuring and to store the curtailed electricity from the wind turbines in the battery. In this case, purchasing electricity made from wind turbines (originally for sale) and grid electricity for the purpose of producing hydrogen, such as Scenario I, is not required. Only the curtailed electricity will be moved to the battery for charging and the stored electricity will be sold to KEPCO when the whole amount of electricity supply is not excessive to demand. For this, facilities, such as power-supply system, power-conversion system, ESS battery, and utility operating system, are required while other facilities, such as water electrolysis, buffer tank, compressor, and tube trailer, are not necessary. As the lifetime of the ESS battery is fifteen years, no replacement of facilities within the accounting period (15 years) is required. There is no investment cost incurred due to replacement, only initial investment costs for purchase and construction of facilities are needed. Assumed that other conditions are same with Scenario I (See Table 46), the total investment cost is calculated as 33.8% of CAPEX in Scenario I, as shown in Table 47. In order to maintain consistency in comparing investment costs, the facility specifications were applied in the same way as in Scenario I. OPEX are calculated considering the cost for treating the curtailed electricity only. Under the same conditions as Scenario I, the amount of electricity to be stored in the battery is set at 286,437 kWh per year as in the initial year. The efficiency of ESS batteries is applied to 95% according to the design specifications, and annual efficiency reduction rate for the battery is assumed as 1% for every year. Table 48 shows the amount of electricity that can be stored and sold for entire years, considering annual efficiency reduction in the battery.
Dividing the total expenses by the total amount of electricity available for sale over the entire business period, the electricity production cost is KRW 7261.7 per 1 kWh (i.e., “FO” = KRW 7261.7/kWh). The Hydrogen production cost in Scenario I was KRW 62,029/kg and the power consumption was 64.3 kWh/kg, so the cost per kWh of electricity is converted as KRW 964.7 (i.e., “CO” = KRW 964.7/kWh).
If the ESS batteries are alternatively established to store curtailed electricity instead of the hydrogen production system (water-electrolysis facilities), there will be a difference of KRW 6297 (USD 5) per 1 kWh, which is 7.6-times more expensive.

10. Discussion

When organizing Scenarios I through IV, the initial intention was to lower the hydrogen cost by applying cheap raw material (electricity) expense at nighttime (“Off-peak Zone”), as described in Table 11, even if general operation expense in OPEX rises due to increases in employee wages. Since the current trend of SMP from January to August 2022 has a weak interrelationship with the peak time zone prescribed by MOTIE, research will continue to find the best operation hours and time zone with a combination of inexpensive wages and the cheapest SMP, regardless of peak zones.
In the future, a further study will follow to reduce hydrogen costs with respect to renewable energy policies, such as Jeju-specialized Demand Response, Clean Hydrogen Energy Portfolio Standards, Power Purchase Agreement, and so on.

11. Conclusions

In this study, an economic analysis was conducted for producing green hydrogen through water electrolysis by receiving electricity from various power sources. The economic analysis was carried out by calculating hydrogen production costs with the LCOH technique. The object of economic analysis is a P2G system, which will be developed by establishing a water-electrolysis facility near the “H” wind farm on Jeju Island.
Four scenarios were organized by varying operating days, hours, and working times for the water electrolysis. For each scenario, the number of employees, the wage-determining system, and SMP changed, and these major factors led to variations in hydrogen expenses, amount, and production costs. According to the scenarios, the estimated hydrogen cost is KRW 62,029 (USD 45) to KRW 78,934 (USD 57) per kg·H2. The largest portion of the expenses was occupied by raw material expenses (electricity and water expenses), which was 47.0%, as in Scenario I.
Sensitivity analysis was performed based on Scenario I, which resulted in the lowest hydrogen cost. Factors were selected as capability of wind turbines in the “H” wind farm, efficiency of alkaline-type water electrolysis, efficiency of PEM-type water electrolysis, the annual reduction rate of efficiency for electrolysis stack, power consumption for unit hydrogen production, and SMP to compare the variation in hydrogen cost against the change in the dependent variables. The most sensitive factor was identified as SMP with a KRW 1232/kg sensitivity for a change of KRW 10/kWh.
As the hydrogen costs estimated through Scenarios I to IV are higher than the target of hydrogen sales price suggested by the Korean Government, three proposals were provided to reduce hydrogen costs through Scenarios V to VII. To lower hydrogen costs as suggested and estimated in the proposals, such as absorption of curtailment assigned to other wind farms (estimated cost KRW 50,000/kg (USD 36/kg)), enhancing hydrogen production through maximizing power supply capacity (estimated cost KRW 52,029/kg (USD 37/kg)) and commercialization of co-product (oxygen: estimated cost KRW 42,173/kg (USD 30/kg)) may be discussed further.
In addition, efforts from related corporate organizations to lower hydrogen costs are necessary. Water-electrolysis operation companies should periodically monitor SMP trends and update the hydrogen sales price by reflecting SMP change, which is the most influential factor in hydrogen cost. In addition, as proposed in Section 10, researchers may analyze the SMP trend to find the best time for operation using the lowest electricity rate. Research and development institutions and companies can use the sensitivity analysis results in Section 7 to set their strategy for development to reduce hydrogen costs. Research and development should be carried out to reduce the annual reduction rate for efficiency of electrolysis stack or power consumption for hydrogen production, which have high sensitivity to the hydrogen cost. The government and related agencies should provide policies for supporting the hydrogen cost, such as subsidies, to promote hydrogen production and the supply chain.

Author Contributions

Writing—original draft preparation, Y.C.; Writing—review and editing, S.L.; Formal analysis, J.L. (Jinseok Lim); Methodology, J.L. (Jaewoo Lee). All authors have read and agreed to the published version of the manuscript.

Funding

This research was funded by the Korea Institute of Energy Technology Evaluation and Planning (KETEP) and Ministry of Trade, Industry and Energy (MOTIE) of the Republic of Korea (Research No. 20208801010010).

Data Availability Statement

Not applicable.

Conflicts of Interest

The authors declare no conflict of interest.

References

  1. Korea Power Exchange (KPX). Status for Electric Generation Facilities. 2021, p. 3. Available online: https://epsis.kpx.or.kr/epsisnew/selectEkifBoardList.do?menuId=080402&boardId=040200 (accessed on 3 September 2022).
  2. Jeju Special Self-Governing Province. Available online: https://www.jeju.go.kr/cfi/intro/purpose.htm (accessed on 30 October 2022).
  3. Korea Power Exchange. Available online: https://new.kpx.or.kr/menu.es?mid=a10402030000 (accessed on 30 October 2022).
  4. Kim, D.; Kim, B. Record of Curtailment and Analysis of Unavailable Electricity for Onshore Wind Farm in Jeju Island; The Korean Hydrogen and New Energy Society (KHNES): Daejeon, Korea, 2021; p. 7. [Google Scholar]
  5. Jeju Special Self-Governing Province. Action Plan for CFI. 2030. pp. 25–26. Available online: https://www.jejuenergy.or.kr/index.php/board?act=down&seq=2357&serial=2&bd_bcid=gallery_energy&page= (accessed on 30 October 2022).
  6. Energy & Environment News (Korean Press). Available online: http://www.e2news.com/news/articleView.html?idxno=228955 (accessed on 30 October 2022).
  7. Shibata, Y. Economic Analysis of Hydrogen Production from Variable Renewables. Inst. Energy Econ. 2015, 10, 26–46. [Google Scholar]
  8. Yates, J.; Daiyan, R.; Patterson, R.; Egan, R.; Amal, R.; Ho-Baille, A.; Chang, N.L. Techno-Economic Analysis of Hydrogen Electrolysis from Off-Grid Stand-Alone Photovoltaics Incorporating Uncertainty Analysis. Cell Rep. Phys. Sci. 2020, 1, 100209. [Google Scholar] [CrossRef]
  9. Matute, G.; Yusta, J.M.; Correas, L.C. Techno-Economic Modelling of Water Electrolysers in the Range of Several MW to Provide Grid Services While Generating Hydrogen for Different Applications: A Case Study in Spain Applied to Mobility with FCEVs. Int. J. Hydrogen Energy 2019, 44, 17431–17442. [Google Scholar] [CrossRef]
  10. Andrea, M.F.; Sara, R.H.; Luca, D. Techno-Economic Analysis of In-Situ Production by Electrolysis, Biomass Gasification and Delivery Systems for Hydrogen Refuelling Stations: Rome Case Study. Energy Procedia 2018, 148, 82–89. [Google Scholar] [CrossRef]
  11. Ko, A.; Sung-ho Park, S.K. The Economic Feasibility Analysis of 100-MW Power-to-Gas System. Clean Technol. 2020, 26, 55–64. [Google Scholar]
  12. Gim, B.; Kim, J.; Ko, H. Economic Evaluation of Domestic Low-Temperature Water Electrolysis Hydrogen Production. In Transactions of the Korean Hydrogen and New Energy Society; Dankook University: Seoul, Republic of Korea, 2011; Volume 22, pp. 562–566. [Google Scholar]
  13. Energy Newspaper (Korean Press). Available online: http://www.energy-news.co.kr/news/articleView.html?idxno=84282 (accessed on 20 October 2022).
  14. Lee, A. Focus on Hydrogen Economy and Investment Strategy. In Proceedings of the Seminar on the Development Strategy for the Promotion of the Hydrogen Economy and Clean Ammonia Cycle, Seoul, Republic of Korea, 17 March 2022; Presentation Material. pp. 14–19. [Google Scholar]
  15. Korean Statistical Information Service. Available online: https://kosis.kr/statHtml/statHtml.do?orgId=101&tblId=DT_1J20005&vw_cd=MT_ZTITLE&list_id=P2_6&seqNo=&lang_mode=ko&language=kor&obj_var_id=&itm_id=&conn_path=MT_ZTITLE (accessed on 3 September 2022).
  16. Gongsanggongsa (Korean Press). Available online: http://www.public25.com/news/articleView.html?idxno=342 (accessed on 3 September 2022).
  17. Electric Power Statistics Information System. Available online: https://epsis.kpx.or.kr/epsisnew/selectEkmaSmpSmpChart.do?menuId=040201 (accessed on 3 September 2022).
  18. Ordinance on the Issuance of Supply Certificates and the Operation of the Transaction Markets (Revised on 2 September 2022), Korea Energy Association (KEA). p. 71. Available online: https://www.knrec.or.kr/biz/pds/related/view.do?no=623 (accessed on 2 December 2022).
  19. Kang, B.; Jeju Energy Corporation, Jeju-si, Republic of Korea. Personal communication, 2022.
  20. Daily Today (Korean Press). Available online: http://www.dtoday.co.kr/news/articleView.html?idxno=532545 (accessed on 3 September 2022).
  21. Korea Power Exchange. Statistics on Electricity Market in 2021. p. 147. Available online: https://epsis.kpx.or.kr/epsisnew/selectEkifBoardList.do?menuId=080401&boardId=040100 (accessed on 30 October 2022).
  22. Korea Energy Association. Advanced and Renewable Energy Portfolio Standard (RPS) System–Competitive Bid Announcement for Fixed Price Contract for Wind Power in 2022. p. 13. Available online: https://rps.energy.or.kr/CST_O1/O1_90_01_190_pubpop.do (accessed on 30 October 2022).
  23. JEJU Waterworks Authority. Available online: http://www.jeju.go.kr/jejuwater/square/rates/rate-standard/standard03.htm (accessed on 3 September 2022).
  24. Hojoon, B.; Jeju Energy Corporation, Jeju-si, Republic of Korea. Personal communication, 2022.
  25. Article 20. Of the Jeju Special Self-Governing Province Ordinance on the Wind Resource Sharing Fund and Article 5 of the Ordinance on the Permission for Wind Power Project and Designation of Districts. Available online: https://jeju.go.kr/cfi/parti/share.htm (accessed on 18 October 2022).
  26. Ministry of Trade, Industry and Energy [Press Release]. Available online: http://motie.go.kr/motie/ne/presse/press2/bbs/bbsView.do?bbs_seq_n=164278&bbs_cd_n=81&currentPage=1&search_key_n=&cate_n=&dept_v=&search_val_v= (accessed on 3 September 2022).
  27. Electric News (Korean Press). Available online: https://www.electimes.com/news/articleView.html?idxno=305239 (accessed on 30 October 2022).
  28. Kim, D.; Jeju National University, Jeju-si, Republic of Korea. Personal communication, 2022.
  29. Gas News (Korean Press). Available online: http://www.gasnews.com/news/articleView.html?idxno=60968 (accessed on 30 October 2022).
  30. Korea Occupational Safety and Health Agency (KOSHA). Technical Guide for Oxygen Supply Facility (KOSHA GUIDE P-32-2012). Available online: https://search.naver.com/p/crd/rd?m=1&px=706&py=189&sx=706&sy=189&p=hGFfpsprvmZssnQhiChssssstHh-349120&q=%EC%82%B0%EC%86%8C%EA%B3%B5%EA%B8%89%EC%84%A4%EB%B9%84%EC%9D%98+%EC%95%88%EC%A0%84%EA%B8%B0%EC%88%A0%EC%A7%80%EC%B9%A8&ie=utf8&rev=1&ssc=tab.nx.all&f=nexearch&w=nexearch&s=qriMsgkZMCKB29RF14%2BFxg%3D%3D&time=1669976744383&abt=%5B%7B%22eid%22%3A%22SHP-AD-UP%22%2C%22vid%22%3A%2218%22%7D%5D&a=web_gen*D.link&r=1&i=a00000fa_e231e853ed03055038568484&u=https%3A%2F%2Fwww.kosha.or.kr%2FextappKosha%2Fkosha%2Fguidance%2FfileDownload.do%3FsfhlhTchnlgyManualNo%3DP-32-2012%26fileOrdrNo%3D3&cr=1 (accessed on 2 December 2022).
  31. Investpedia. Available online: https://www.investopedia.com/terms/o/opportunitycost.asp#toc-formula-and-calculation-of-opportunity-cost (accessed on 15 November 2022).
Figure 1. Flowchart of the hydrogen production process through water electrolysis.
Energies 15 09317 g001
Figure 2. Procedure for estimating hydrogen cost.
Energies 15 09317 g002
Figure 3. Cumulative efficiency of hydrogen production for each type of water electrolysis.
Energies 15 09317 g003
Figure 4. Correlation between the capability of wind turbines in the “H” Wind Farm and hydrogen cost *. * x-axis: capability of turbines (%), y-axis: hydrogen cost (KRW/kg). Solid line: y-values connecting line, Dot line: Regression line.
Energies 15 09317 g004
Figure 5. Correlation between efficiency of water electrolysis (alkaline type) and hydrogen cost *. * x-axis: Efficiency for Alkaline-Type Water Electrolysis (%), y-axis: Hydrogen Cost (KRW/kg). Solid line: y-values connecting line, Dot line: Regression line.
Energies 15 09317 g005
Figure 6. Correlation between efficiency of water electrolysis (PEM type) and hydrogen cost *. * x-axis: Efficiency for PEM-Type Water Electrolysis (%), y-axis: Hydrogen Cost (KRW/kg). Solid line: y-values connecting line, Dot line: Regression line.
Energies 15 09317 g006
Figure 7. Correlation between annual reduction rate of efficiency for water electrolysis and hydrogen cost *. * x-axis: Annual Efficiency Reduction Rate(%/year), y-axis: Hydrogen Cost(KRW/kg). Solid line: y-values connecting line, Dot line: Regression line.
Energies 15 09317 g007
Figure 8. Correlation between power consumption for producing hydrogen and hydrogen cost *. * x-axis: Power Consumption (kWh/kg), y-axis: Hydrogen Cost (KRW/kg). Solid line: y-values connecting line, Dot line: Regression line.
Energies 15 09317 g008
Figure 9. The trend of the weighted average of SMP on Jeju Island for a recent year * [17]. * x-axis: Year/Month, y-axis: SMP Average (KRW/kWh).
Energies 15 09317 g009
Figure 10. The trend of the settlement unit price for renewable energy for a recent year * [17]. * x-axis: Year/Month, y-axis: Settlement Unit Price (KRW/kWh).
Energies 15 09317 g010
Figure 11. Correlation between SMP and hydrogen cost *. * x-axis: SMP (KRW/kWh), y-axis: Hydrogen Cost (KRW/kg). Solid line: y-values connecting line, Dot line: Regression line.
Energies 15 09317 g011
Figure 12. Transmission of curtailment from neighbor wind farms to “H” wind farm.
Energies 15 09317 g012
Table 1. Frequency and amount of curtailment on Jeju Island [4].
Description/Year201520162017201820192020
No. of occurrence for curtailment3616174677
Amount of curtailed electricity(MWh)15225213011366922319,449
Amount of whole power supplied(MWh) *348,188466,133537,994536,566549,944574,481
Ratio of curtailment0.04%0.05%0.24%0.25%1.68%3.39%
* Sum of total wind power generation capacity on Jeju Island.
Table 2. Specification for P2G hydrogen-production system.
CategoryDescription
AddressJeju-si, Jeju Special Self-Governing Province, Republic of Korea
Capacity of water electrolysis3.3 MW
Name of connected wind farm“H” Wind farm
Capacity of wind turbinesMax. 9.38 MW *
Productivity of hydrogen200 kg/day (avg.)
Max. 600 kg/day
* Sum of capacity for whole wind turbines in “H” wind farm.
Table 3. Specification for water-electrolysis system.
Equipment DescriptionTypeSpecification
Water electrolysisAlkaline2 MW
PEM1.3 MW
Power-supply system 0.10 kWh/Nm3 (Loss rate)
Power-conversion system 0.15 kWh/Nm3 (Loss rate)
Buffer tank D.P. 10 bar
Compressor D.P. 250 bar
ESS battery 2 MW
Table 4. Premise subject to project execution for calculating hydrogen cost.
DescriptionValueRemarks
Period of business15 years
Max. capacity of electricity from the wind turbine to be input4 MWAs per the operation plan
Max. capacity of electricity from the grid to be input1.5 MWAs per the operation plan
Amount of curtailed electricity286,437 kWh/yearSame as the record of the “H” wind farm in 2021
Minimum no. of employees for operation of water electrolysisTwo persons per one shiftAs per the operation plan
Lifetime of stack (alkaline)Five yearsDesign lifetime
Lifetime of stack (PEM)Eight yearsDesign lifetime
Lifetime of ESS15 yearsDesign lifetime
Capability of “H” wind farm27%Average of the wind farm
No. of tube trailers3
(1 for purchase + 2 for lease)
As per the operation plan
Inflation rate1.0%/yearAverage of relevant indices * from Statistics Korea (2015~2019) [15]
Salary growth rate2.9%/yearAverage increase rate of government officers’ salary (2015~2019) [16]
Ratio of loan-
SMP (system margin price)Average of January to August 2022 on JejuAs notified in Korea Power Exchange (KPX) [17]
REC weight factor1.2
(Onshore wind turbine)
Ordinance [18]
RECKRW 20As per Jeju Energy Corporation [19]
* household price index, fresh food index, agricultural and petroleum exclusion index, and food and energy exclusion index.
Table 5. Specification for facilities for the production of green hydrogen.
ParametersValueRemarks
Efficiency of the power-supply system98%From design data
Efficiency of power conversion system97%From design data
Efficiency of water electrolysis (PEM)56%Referenced from the value of the other company [12]
Efficiency of water electrolysis (alkaline)69.6%From design data
Annual reduction rate of efficiency for stack (PEM)1.5%/yearAssumption
Annual reduction rate of efficiency for stack (alkaline)1.5%/yearAssumption
Ratio between supplied electricity (alkaline: PEM)2:1.3Same as the capacity ratio
Power consumption for the production of hydrogen64.3 kWh/kgReferenced from the value of neighboring facility [20]
Amount of water consumption for electrolysis30 tons/dayAs per the operation plan
Electric loss rate during transmission & distribution0%Assumption
Table 6. Time of occurrence for CAPEX during the entire business period.
YearInitial InvestmentInvestment for Replacement
1stEPC * cost for the whole facility (initial)
2nd
3rd
4th
5th
6th 1st replacement cost for alkaline stack
7th
8th
9th 1st replacement cost for PEM stack
10th
11th 2nd replacement cost for alkaline stack
12th
13th
14th
15th
* E (Engineering), P (Procurement), C (Construction).
Table 7. Breakdown and ratio of respective items for CAPEX.
CategoryBreakdown DescriptionRatio
Procurement
(incl. engineering fee)
Procurement of the whole P2G system (initial)60.4%
Procurement of tube trailer (1 no.)1.6%
Procurement of stack (alkaline)
(for two times replacement)
6.4%
Procurement of stack (PEM)
(for one-time replacement)
7.7%
ConstructionConstruction of the whole P2G system (initial)20.1%
Construction of stack (alkaline)
(for two times replacement)
2.6%
Construction of stack (alkaline)
(for one-time replacement)
1.3%
Table 8. Breakdown and basis of calculation for respective items for OPEX.
Breakdown DescriptionBasis of CalculationRemarks
Basic salaryKRW 44 million/year
(initial year)
Average of a corporation operating “H” wind farm in 2019
Performance salary16.91% of the basic salaryAverage of similar three corporations
Extra benefit
  • 2.3% of basic salary (Scenario I)
  • 100% of basic salary (Scenario II)
  • 80% of basic salary (Scenario III)
  • 150% of basic salary (Scenario IV)
Assumption
Retirement benefit12.45% of the basic salaryAverage of similar three corporations
Welfare expenses14.41% of the basic salaryAverage of similar three corporations
Travelling & transportation expenses0.53% of the basic salaryAverage of similar three corporations
Communication expenses2.80% of the basic salaryAverage of similar three corporations
Water cost30.37% of the basic salaryAverage of similar three corporations
Taxes, utility bills0.64% of depreciation costAverage of similar three corporations
O&M costs *19.66% of depreciation costAverage of similar three corporations
Insurance costs *6.16% of depreciation costAverage of similar three corporations
Vehicle maintenance costs2.04% of the basic salaryAverage of similar three corporations
Education and training costs1.07% of the basic salaryAverage of similar three corporations
Expenses for print0.08% of the basic salaryAverage of similar three corporations
Expenses for meeting0.48% of the basic salaryAverage of similar three corporations
Expenses for Consumables *0.30% of depreciation costAverage of similar three corporations
Payment fee19.20% of the basic salaryAverage of similar three corporations
Supporting fee for the villageKRW 132 million/yearAverage of similar three corporations
Interests costsN/A
Corporate tax expensesNot considered
Grid electricity expensesContract unit price
= Avg. of SMP (Jeju)
+ 1.2 × REC
SMP: Avg. of Jan. to Aug. 2022 in Jeju [17]
Wind turbine electricity costsKRW 220.4/kWhSettlement unit price
(2022/Jeju/Wind power) [17]
Expenses for tap water *KRW 359,410 per dayContracted price (Industrial, 300 mm Dia.) [24]
Rental costs for tube trailers (2 nos.) *KRW 5 million/monthAssumption
Operating costs for tube trailers (3 nos.)KRW 4800/kg·H2From quotation [25]
* expenses affected by the inflation rate.
Table 9. Allocation of depreciation cost.
YearEPC Cost for Whole Facility (Initial)1st Replacement Cost for Alkaline Stack2nd Replacement Cost for Alkaline Stack1st Replacement Cost for PEM Stack
1st1/15
2nd1/15
3rd1/15
4th1/15
5th1/15
6th1/151/5
7th1/151/5
8th1/151/5
9th1/151/5 1/8
10th1/151/5 1/8
11th1/15 1/51/8
12th1/15 1/51/8
13th1/15 1/51/8
14th1/15 1/51/8
15th1/15 1/51/8
Table 10. Amount of hydrogen produced for the respective year.
YearAmount of Hydrogen
1sta (1)
2nda × (1 − x (2))
3rda × (1 − x)2
4tha × (1 − x)3
5tha × (1 − x)4
6tha × (1 − x)5
7tha × (1 − x)6
8tha × (1 − x)7
9tha × (1 − x)8
10tha × (1 − x)9
11tha × (1 − x)10
12tha × (1 − x)11
13tha × (1− x)12
14tha × (1 − x)13
15tha × (1 − x)14
(1) Initial amount of hydrogen produced. (2) Annual reduction rate for efficiency of water electrolysis.
Table 11. Classification of peak time which affects electricity rate * [26].
ClassificationOff-PeakMid-PeakOn-PeakRemarks
Time22:00 to 08:0008:00 to 16:0016:00 to 22:00for Jeju
* Applicable to general/industrial/educational/electric vehicle charging tariff.
Table 12. Factors and their values are subject to the operation plan (Scenario I).
FactorValueRemarks
No. of days of operation365 days/year
Operation time09 to 2112 h/day without a break
SMP average203.4009 to 16: Mid-peak
16 to 21: On-peak
Contract unit price227.40SMP + weight factor × REC
No. of employees62 × 3
O/T factor1.8
Table 13. The annual amount of electricity to be supplied to water electrolysis (Scenario I).
Source of ElectricityCapacityElectricity SuppliedRatioRemarks
Curtailment 286,437 kWh2.5%
Wind turbines4 MW4,730,400 kWh40.8%Capability reflected
Grid1.5 MW6,570,000 kWh56.7%
Total 11,586,837 kWh100.0%
Table 14. Estimation of whole expenses and breakdown (Scenario I).
CategorySub-CategoryExpensesRatioRemarks
CAPEX A18.4%EPC for initial & replacement
OPEXGeneralB26.3%Corporation operating expenses
(incl. wages)
MaterialC47.0%
  • Water consumption
  • Electricity consumption
Tube
trailer operation
D8.3%Fuel costs, driver expenses
Total E *100%
* E = A + B + C + D.
Table 15. The average daily amount of hydrogen produced for each year (Scenario I).
YearAvg. Amount of H2
(PEM)
Avg. Amount of H2
(Alkaline)
Total
1st104198301
2nd102195297
3rd100192293
4th99189288
5th97186284
6th96184280
7th95181275
8th93178271
9th92175267
10th90173263
11th89170259
12th88168255
13th86165251
14th85163248
15th84160244
Average93178272
Table 16. Factors and their values are subject to the operation plan (Scenario II).
FactorValueRemarks
No. of days of operation365 days/year
Operation time22 to 0812 h/day without a break
SMP average212.5222 to 08: Off-peak
Contract unit price236.52SMP + weight factor × REC
No. of employees62 × 3
O/T factor2.5
Table 17. The annual amount of electricity to be supplied to water electrolysis (Scenario II).
Source of ElectricityCapacityElectricity SuppliedRatioRemarks
Curtailment 286,437 kWh2.5%
Wind turbines4 MW4,730,400 kWh40.8%Capability reflected
Grid1.5 MW6,570,000 kWh56.7%
Total 11,586,837 kWh100.0%
Table 18. Estimation of whole expenses and breakdown (Scenario II).
CategorySub-CategoryExpensesRatioRemarks
CAPEX 100% of A
(equivalent)
17.4%EPC for initial & replacement
OPEXGeneral116.7% of B
(16.7% increase)
29.0%Corporation operating expenses
(incl. wages)
Material102.25% of C
(2.5% increase)
45.6%
  • Water consumption
  • Electricity consumption
Tube trailer
operation
100% of D
(equivalent)
8.0%Fuel costs, driver expenses
Total 105.4% of E
(5.4% increase)
100%
Table 19. The average daily amount of hydrogen produced for each year (Scenario II).
YearAvg. Amount of H2
(PEM)
Avg. Amount of H2
(Alkaline)
Total
1st104198301
2nd102195297
3rd100192293
4th99189288
5th97186284
6th96184280
7th95181275
8th93178271
9th92175267
10th90173263
11th89170259
12th88168255
13th86165251
14th85163248
15th84160244
Average93178272
Table 20. Factors and their values are subject to the operation plan (Scenario III).
FactorValueRemarks
No. of days of operation240 days/year
Operation time09 to 188 h/day
Break time: 1 h (12 to 13)
SMP average187.1109 to 16: Mid-peak
16 to 18: On-peak
Contract unit price211.11SMP + weight factor × REC
No. of employees22 × 1
O/T factor1
Table 21. The annual amount of electricity to be supplied to water electrolysis (Scenario III).
Source of ElectricityCapacityElectricity SuppliedRatioRemarks
Curtailment 286,437 kWh5.5%
Wind turbines4 MW2,073,600 kWh39.5%Capability reflected
Grid1.5 MW2,880,000 kWh55.0%
Total 5,240,037 kWh100.0%
Table 22. Estimation of whole expenses and breakdown (Scenario III).
CategorySub-CategoryExpensesRatioRemarks
CAPEX 100% of A
(equivalent)
33.1%EPC for initial & replacement
OPEXGeneral49.46% of B
(50.54% decrease)
23.4%Corporation operating expenses
(incl. wages)
Material43.15% of C
(56.85% decrease)
36.6%
  • Water consumption
  • Electricity consumption
Tube trailer
operation
45.22% of D
(54.78% decrease)
6.9%Fuel costs, driver expenses
Total 55.4% of E
(44.6% decrease)
100%
Table 23. The average daily amount of hydrogen produced for each year (Scenario III).
YearAvg. Amount of H2
(PEM)
Avg. Amount of H2
(Alkaline)
Total
1st71136207
2nd70134204
3rd69132201
4th68130198
5th67128195
6th66126192
7th65124189
8th64122187
9th63121184
10th62119181
11th61117178
12th60115176
13th59114173
14th59112170
15th58110168
Average64123187
Table 24. Factors and their values are subject to the operation plan (Scenario IV).
FactorValueRemarks
No. of days of operation240 days/year
Operation time23 to 088 h/day
Break time: 1 h (03 to 04)
SMP average209.3123 to 08: Off-peak
Contract unit price233.31SMP + weight factor × REC
No. of employees22 × 1
O/T factor2
Table 25. The annual amount of electricity to be supplied to water electrolysis (Scenario IV).
Source of ElectricityCapacityElectricity SuppliedRatioRemarks
Curtailment 286,437 kWh5.5%
Wind turbines4 MW2,073,600 kWh39.5%Capability reflected
Grid1.5 MW2,880,000 kWh55.0%
Total 5,240,037 kWh100.0%
Table 26. Estimation of whole expenses and breakdown (Scenario IV).
CategorySub-CategoryExpensesRatioRemarks
CAPEX 100% of A
(equivalent)
31.4%EPC for initial & replacement
OPEXGeneral57.20% of B
(42.80% decrease)
25.6%Corporation operating expenses
(incl. wages)
Material45.55% of C
(54.45% decrease)
36.5%
  • Water consumption
  • Electricity consumption
Tube trailer
operation
45.22% of D
(54.78% decrease)
6.5%Fuel costs,
driver expenses
Total 58.6% of E
(41.4% decrease)
100%
Table 27. The average daily amount of hydrogen produced for each year (Scenario IV).
YearAvg. Amount of H2
(PEM)
Avg. Amount of H2
(Alkaline)
Total
1st71136207
2nd70134204
3rd69132201
4th68130198
5th67128195
6th66126192
7th65124189
8th64122187
9th63121184
10th62119181
11th61117178
12th60115176
13th59114173
14th59112170
15th58110168
Average64123187
Table 28. Estimation of hydrogen cost applying electricity price in the previous period.
Year & MonthContract Unit Price 1 (kWh/KRW)Settlement Unit Price 2 (kWh/KRW)Hydrogen Price (KRW/kg)
2021.10.172.4124.353,805
2022.01.257.0197.962,917
2022.04.338.7244.370,539
2022.07.294.0238.867,317
1 Average of the corresponding month. Jeju SMP. 2 Average of corresponding month, Wind energy.
Table 29. Summary of sensitivity analysis.
FactorVariation of Unit Factor
(Explanatory Variable)
Variation of Hydrogen Cost
(Outcome Variable)
Capability of wind turbines1%KRW 406/kg
Efficiency of water electrolysis (alkaline)1%KRW 494/kg
Efficiency of water electrolysis (PEM)1%KRW 326/kg
Annual reduction rate of efficiency for water electrolysis0.1%KRW 358/kg
Power consumption for producing hydrogen1 kWh/kgKRW 815/kg
SMPKRW 10/kWhKRW 1232/kg
Table 30. Annual curtailment record for “H” and neighbor wind farms [4,28].
Wind FarmCapacityCurtailed Energy (kWh)
2018201920202021
‘D’30 MW186,6511,573,0812,722,5052,170,821
‘G’15 MW213,5701,067,2392,169,8611,396,164
‘H’9.38 MW705720,251252,537286,437
Table 31. Factors and their values are subject to the operation plan (Scenario V).
FactorValueRemarks
No. of days of operation365 days/year
Operation time09 to 2112 h/day without a break
SMP average203.4009 to 16: Mid-peak
16 to 21: On-peak
Contract unit price227.40SMP + weight factor × REC
No. of employees62 × 3
O/T factor1.8
Table 32. The annual amount of electricity to be supplied to water electrolysis (Scenario V).
Source of ElectricityCapacityElectricity SuppliedRatioRemarks
Curtailment
(‘H’ + ‘D’ + ‘G’)
3,853,422 kWh25.4%
Wind turbines4 MW4,730,400 kWh31.2%Capability reflected
Grid1.5 MW6,570,000 kWh43.4%
Total 15,153,822 kWh100%
Table 33. Estimation of whole expenses and breakdown (Scenario V).
CategorySub-CategoryExpensesRatioRemarks
CAPEX 100% of A
(equivalent)
17.8%EPC for initial & replacement
OPEXGeneral100% of B
(equivalent)
25.4%Corporation operating expenses
(incl. wages)
Material101.5% of C
(1.5% increase)
46.2%
  • Water consumption
  • Electricity consumption
Tube trailer
operation
130.8% of D
(30.8% increase)
10.6%Fuel costs, driver expenses
Total 103.3% of E
(3.3% increase)
100%
Table 34. The average daily amount of hydrogen produced for each year (Scenario V).
YearAvg. Amount of H2
(PEM)
Avg. Amount of H2
(Alkaline)
Total
1st135259394
2nd133255388
3rd131251383
4th129247377
5th127244371
6th126240366
7th124236360
8th122233355
9th120229349
10th118226344
11th116223339
12th115219334
13th113216329
14th111213324
15th110210319
Average122233355
Table 35. Factors and their values are subject to the operation plan (Scenario VI).
FactorValueRemarks
No. of days of operation365 days/year
Operation time09 to 2112 h/day without a break
SMP average203.4009 to 16: Mid-peak
16 to 21: On-peak
Contract unit price227.40SMP + weight factor × REC
No. of employees62 × 3
O/T factor1.8
Table 36. Reverse calculation of required supply amount for occupying maximum capacity.
DescriptionValueRemarks
Max. power consumption for water electrolysis (PEM)3,865,018 kWhAs of the initial year
Power to be supplied for max. power consumption (PEM)6,901,818 kWhAs of the initial year
Max. power consumption for water electrolysis (alkaline)7,390,255 kWhAs of the initial year
Power to be supplied for max. power consumption (alkaline)10,618,182 kWhAs of the initial year
Max. power supply to water electrolysis (PEM + alkaline)17,520,000 kWh/year
Max. power supply before water electrolysis (PEM + alkaline)18,430,465 kWh/yearReverse calculation of efficiencies for the power-supply system and power-conversion system
Table 37. The annual amount of electricity with the enhancement in wind power capacity.
Source of ElectricityCapacityElectricity SuppliedRatioRemarks
Curtailment 286,437 kWh1.6%
Wind turbines9.38 MW11,092,788 kWh61.8%Capability reflected
Grid1.5 MW6,570,000 kWh36.6%
Total 17,949,225 kWh100.0%
Table 38. The annual amount of electricity with the enhancement in grid capacity (Scenario VI).
Source of ElectricityCapacityElectricity SuppliedRatioRemarks
Curtailment 286,437 kWh1.6%
Wind turbines4 MW4,730,400 kWh26.1%Capability reflected
Grid3 MW13,140,000 kWh72.4%
Total 18,156,837 kWh100.0%
Table 39. Estimation of whole expenses and breakdown (Scenario VI).
CategorySub-CategoryExpensesRatioRemarks
CAPEX 100% of A
(equivalent)
14.0%EPC for initial & replacement
OPEXGeneral100% of B
(equivalent)
20.0%Corporation operating expenses
(incl. wages)
Material156.0% of C
(56.0% increase)
55.8%
  • Water consumption
  • Electricity consumption
Tube trailer
operation
159.1% of D
(59.1% increase)
10.2%Fuel costs, driver expenses
Total 131.3% of E
(31.3% increase)
100%
Table 40. The average daily amount of hydrogen produced for each year (Scenario VI).
YearAvg. Amount of H2
(PEM)
Avg. Amount of H2
(Alkaline)
Total
1st165315480
2nd162310472
3rd160306465
4th157301458
5th155296451
6th153292445
7th150288438
8th148283431
9th146279425
10th144275419
11th142271412
12th139267406
13th137263400
14th135259394
15th133255388
Average148284432
Table 41. Factors and their values are subject to the operation plan (Scenario VII).
FactorValueRemarks
No. of days of operation365 days/year
Operation time09 to 2112 h/day without a break
SMP average203.4009 to 16: Mid-peak
16 to 21: On-peak
Contract unit price227.40SMP + weight factor × REC
No. of employees62 × 3
O/T factor1.8
Table 42. The annual amount of electricity to be supplied to water electrolysis (Scenario VII).
Source of ElectricityCapacityElectricity SuppliedRatioRemarks
Curtailment 286,437 kWh2.5%
Wind turbines4 MW4,730,400 kWh40.8%Capability reflected
Grid1.5 MW6,570,000 kWh56.7%
Total 11,586,837 kWh100.0%
Table 43. Allocation of expenses with commercialized oxygen production cost.
CategorySub-CategoryH2O2Remarks
Amount of production 2nn
CAPEX 67%33%
OPEXGeneral50%50%
Material67%33%
Tube trailer
operation
100%-
Table 44. Estimation of whole expenses and breakdown (Scenario VII).
CategorySub-CategoryExpensesRatioRemarks
CAPEX 67% of A
(33% decrease)
18.8%EPC for initial & replacement
OPEXGeneral50% of B
(50% decrease)
20.1%Corporation operating expenses
(incl. wages)
Material67% of C
(33% decrease)
48.2%
  • Water consumption
  • Electricity consumption
Tube trailer
operation
100% of D
(equivalent)
12.8%Fuel costs, driver expenses
Total 65.3% of E
(34.7% decrease)
100%
Table 45. The average daily amount of hydrogen produced for each year (Scenario VII).
YearAvg. Amount of H2
(PEM)
Avg. Amount of H2
(Alkaline)
Total
1st104198301
2nd102195297
3rd100192293
4th99189288
5th97186284
6th96184280
7th95181275
8th93178271
9th92175267
10th90173263
11th89170259
12th88168255
13th86165251
14th85163248
15th84160244
Average93178272
Table 46. Factors and their values are subject to the operation plan.
FactorValueRemarks
No. of days of operation365 days/year
Operation time09 to 2112 h/day without a break
No. of employees62 × 3
O/T factor1.8
Table 47. Estimation of whole expenses and breakdown.
CategorySub-CategoryExpensesRatioRemarks
CAPEX 33.8% of A19.1%EPC for initial investment
OPEXGeneral32.2% of B80.9%Corporation operating expenses
(incl. wages)
MaterialNone-
  • Water consumption
  • Electricity consumption
Tube trailer
operation
None-Fuel costs, driver expenses
Total 32.5% of E100%
Table 48. The annual amount of electricity to be stored in the ESS Battery.
YearAmount of ElectricityRemarks
1st286,437 kWhEfficiency of the battery: 95%
2nd269,394kWh
3rd266,700 kWh
4th264,033 kWh
5th261,393 kWh
6th258,779 kWh
7th256,191 kWh
8th253,629 kWh
9th251,093 kWh
10th248,582 kWh
11th246,096 kWh
12th243,635 kWh
13th241,199 kWh
14th238,787 kWh
15th236,399 kWh
Average3,808,024 kWh
Publisher’s Note: MDPI stays neutral with regard to jurisdictional claims in published maps and institutional affiliations.

