Abstract
Recent studies show that hybrid powertrains with dual clutch transmission are becoming more common. This is mainly influenced by the fact that they have higher efficiency, allow power-on shifting, and are more compact. However, the electric motor attached to the primary shaft of the transmission might represent some critical issues in statics and dynamics due to additional torque, inertia, and working irregularities. This paper aims to investigate the influence of the electric motor integration in the transmission on the reliability of the overall system. The focus is on the investigation of potential over stresses of the ICE bearings due to the bending of the gearbox primary shaft. To achieve the aim, the static and the rotor dynamic analysis of the inner and outer primary shafts is performed. The numerical analyses show the potential critical issues that can arise from the excessive manufacturing and assembling tolerances, the interaction of the e-machine torque irregularities and inertia with the bending dynamics of the primary shafts.
1. Introduction
New ambitious targets on the amount of CO2 emissions set by European Commission [1,2] require implementation of even more efficient technologies from car manufacturers. Since the last decade of the 20th century, a wide variety of different technologies and policies aiming the reduction of vehicle fuel consumption and emissions at different vehicle and infrastructure level are widely implemented [3,4]. Most regulations in the past were focused on the reduction of the pollutants. The real motivation to the hybridization is the more stringent limit to the emissions. This reduction is not achieved by simple ICE tuning and pushes towards hybrids [5].
Hybridized powertrains can be generally of a dedicated or an add-on type [6,7]. Dedicated Hybrid Transmissions (DHT) use custom designed transmissions that can be mostly of a planetary gear train type [6,7]. Add-on types are obtained by adding an Electric Motor (EM) to conventional powertrain at different positions. Based on the position of the electric motor they can be of P0 to P5 types [7,8]. Add-on type hybrid transmissions are gaining great interest of the manufacturers as they can be developed as hybridization kits [9]. In this regard, most hybridization kits are obtained by integrated design of the Dual Clutch Transmissions (DCT) and the electric machine to obtain a Hybrid Dual Clutch Transmissions (HDT). The choice of the DCT as transmission is largely driven by the fact that they have high efficiency, simple construction, lower inertia in case of the adoption of wet clutches and smooth gear shifting [9,10]. Furthermore, DCT can allow power-on gear shifting. All this makes it the architecture of choice in many hybrid solutions [11,12,13]. The use of DCT as a part of HEV (i.e., HDT) allows the Internal Combustion Engine (ICE) and the EM to be engaged at different gears, thus improving the overall performance and efficiency of the system [9,14].
From the vehicle drivability and Noise, Vibration, and Harshness (NVH) point of view, the presence of two excitation sources (ICE and EM) affects the behavior of the powertrain during transient operating modes (frequent changes from electric to conventional or hybrid modes) [10,15,16]. On the other hand, the presence of the EM gives the possibility to attenuate the vibration in the driveline [15,16,17] and improve the gear shifting process [18]. Furthermore, the HEV control strategy can reduce the fatigue damage of the drivetrain components [19]. Even though traditionally the Equivalent Consumption Minimization Strategy (ECMS) is typically used to reduce the fuel consumption [8] and not the fatigue damage, the work [19] shows that the life of the drive shaft can be increased by 26% implementing the ECMS by proper settings of the objective function.
The vibration in the driveline can also be reduced by a Dual Mass Flywheel (DMF) instead of single mass one [20]. In this component a primary and a secondary mass are connected by means of springs (helical arc, spiral) to decouple the ICE from transmission. The same component has demonstrated to be effective in improving the fuel efficiency and the passenger’s comfort [21].
The torsional behavior of the DCT influences the comfort of the vehicle. Therefore, several works are addressed to study the clutch actuation control with numerical simulations and their experimental validation [10,22,23,24]. These actuation strategies help to achieve higher comfort levels during the operation mode change.
Extensive research was performed to investigate the service life of critical components of a conventional powertrain, such as bearings, shafts, and springs. According to engine bearing manufacturers statistics [25], 34% of failures in the engine bearings occur due to misassembly, misalignment and overloading. These failure modes can be caused by the deflections of the transmission input shaft and the crankshaft, coupling them with excessive manufacturing tolerances. The crankshaft bearing life is influenced by several factors, among them the radial clearances [26], their misalignments [27], operation speeds [26], and lubrication regimes [28]. The transmission components life is mainly affected by the loading time history, shaft bending, and life of the support bearings [29]. In addition, the backlash in gears, synchronizers, and differential amplifies the NVH [30]. The fatigue of the spring element [21] and the wear of bearings/bushings are instead the main factors influencing the life of the DMF. Generally, in conventional powertrains, ICE and gearbox have a misalignment during assembling and is supported by the inner clearance of the DMF that is relatively small. Therefore, even small misalignment of the gearbox input shaft linked to electric machine torque could possibly result in reaching the critical values close to the inner clearance of the DMF [31] and generate an undesired radial force and bending moment on the DMF bushings and crankshaft bearings. The deflection of the fast-spinning transmission shafts at different critical speeds could also influence the overall misalignment of the shaft during the operation [32].
Summarizing the literature available on the topic it can be noted that the main failures that might occur in engine and DMF bearings and bushings are caused by excessive misalignment and relative motion of the shafts, and DMF primary and secondary masses in axial, radial, and torsional directions. The additional electromagnetic and inertia torque coming from the electric motor can increase the radial deflections of the DCT shafts and negatively affect the life of several components (mainly the bushings of the DMF and crankshaft bearings). Even though there are several works focused on the numerical and experimental analysis of the torsional dynamics of the DCT and HDT [10,14,22,23,24]. However, to the authors’ knowledge, there are no works in the literature that focuses on the bending dynamic issues of DCT or HDT. Hence, this work studies the influence of the electric motor of a P2.5 hybrid transmission on the displacement of the primary shaft and its misalignment based on numerical analysis. Additionally, there is no analysis on bending-torsional coupling of the HDT from static and dynamic point of view.
The aim of the present paper is to study the influence of the above-mentioned factors on the potential damage of the ICE and DMF bearings and bushings. The novelty of the work lies in the study of the influence of the electromagnetic and inertia torque of the electric machine on the flexural deflection of the gear shafts and on the modification of the natural frequencies in the rotor dynamic case. The coupling between torsional and flexural behavior highlights the potential static and dynamic issues that might arise during the integration of ICE with HDT module. The emerging trend in automotive industry is integration of HDT from external suppliers with the in-house ICE. Therefore, the practical utility of the study is to understand the possible operational issues of the integrated HDT and ICE module.
The HEV powertrain configuration analyzed in this study is shown in Figure 1. The power sources are an ICE, which is connected to a DMF to reduce the engine torque’s cyclic irregularity and an EM, which is connected to the gearset with even gear numbers. Both are combined with a DCT consisting of two separate friction clutches C1 and C2 as well as two sub-gearsets.
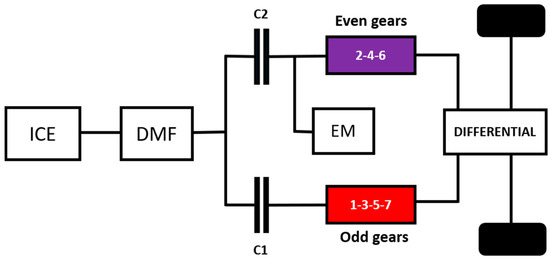
Figure 1.
Hybrid dual clutch transmission architecture.
The first part of the paper deals with static analysis where different operating modes of the hybrid DCT transmission are considered and the static deflection due to the torque of the electric motor in different operating modes is calculated using a FEM.
In the second part the rotor dynamic analysis is performed using DYNROT, a FEM code to study the dynamics of the rotating parts (Campbell diagram and mode shapes) including the effect of EM and ICE torque irregularities on the displacement at the input splines of the inner primary shaft. Finally, the results are discussed, and the values of deflections are compared with those indicated in the service manuals for normal operation of the DMF to highlight potential critical issues.
2. Methodology
The present section describes the methodology used to carry out the static and rotor dynamic analysis on the HDT.
The general layout of the HDT that will be used for the static and rotor dynamic analysis is shown in Figure 2. The ICE is connected to the DMF, whose output is coupled to the two input splines of dual clutch system C1 and C2. The two clutches transmit the torque to the inner (IPS) and outer primary shaft (OPS) of the drivetrain including even and odd gears, respectively. The EM is installed above the primary shaft, its pinion (G1) transmits torque to the outer primary shaft by means of an idler (G2). The inner and outer primary shafts are supported by ball bearings BB1 and BB2 while the inter shaft needle bearings NB1 and NB2 are installed between the two primary shafts.
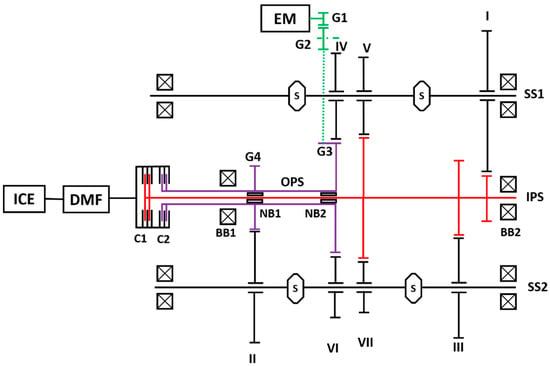
Figure 2.
Stick diagram of a generic hybrid dual clutch transmission.
The reverse gear as well as the final gear connected to the differential are not represented in Figure 2.
2.1. Static Analysis
The aim of the present section is to evaluate the deflections of the HDT primary shaft due to the transmitted torque, including the contribution of the EM. Figure 3 shows the layout of the FEM model used for the static analysis. Starting from the top, the EM is connected to the pinion gear (G1) that delivers the torque to the idler (G2). This torque is then transmitted to the gear (G3) on the outer primary shaft (OPS) and finally to the secondary shafts (not shown). The outer and inner primary shafts are supported using the ball bearings BB1 and BB2. While needle bearings NB1 and NB2 are installed between the inner and outer primary shafts. As the main possible criticality could arise on the primary shaft due to the coupling between the HDT and ICE, therefore, this shaft is considered in the study. Furthermore, it is the one that exchanges the radial load between the two modules.
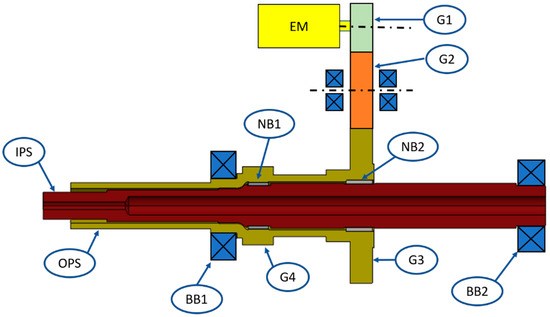
Figure 3.
Setup for the static analysis.
The FEM modeling has been carried out in SOLIDWORKS simulation software. The shafts have been modelled as solid parts with material properties of AISI 4340. The ball bearings are modeled as stiffness element reacting just in radial and axial direction. The needle bearings are modeled as inter-shaft stiffness element acting just in the radial direction. The bearings stiffnesses are summarized in Table 1. The radial stiffness of the ball bearing was estimated using the Hertz theory [33,34] while the needle bearings stiffness using the Palmgren theory [35].

Table 1.
Bearing stiffness values.
FEM analysis has been performed in three operating modes:
- 4th gear in boost and recuperation
- 2nd gear in boost and recuperation
- ICE + EM in 4th gear boost
2.1.1. Scenario 1: 4th Gear in Boost and Recuperation
With reference to Figure 4, the operating mode of the EM (b-boost, c-recuperation) defines the directions of the forces acting on the driving and driven helical gear. In Figure 4, the EM provides a torque of 55 Nm rotating in clockwise direction seen from left hand side. This is then delivered to the idler (G2) which engages to the helical gear (G3) on the outer primary shaft. The forces exchanged between the gears are calculated [36] as follows:
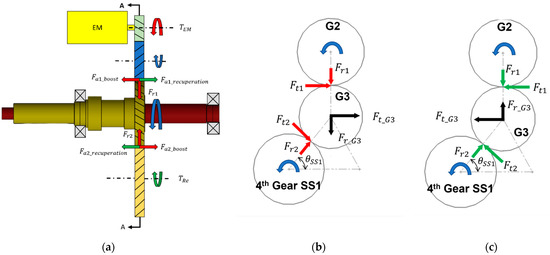
Figure 4.
Fourth gear: (a) front view; (b) left hand side view in boost mode; (c) left hand side view in regeneration mode.
The tangential force () at the driven gear (G3) is given by:
where, indicates the pitch diameter of the helical gear G3, is EM Torque (56 Nm taken as 70% of the Maximum torque, that is equal to 80 Nm [9]) and is gear ratio between the EM pinion gear (G1) and the outer primary shaft gear (G3).
The radial and axial forces at the driven gear (G3) are given by:
where, β is gear helix angle (25°) and ϕ is helical gear normal pressure angle (20°).
In Figure 4 only the forces acting on the outer primary shaft have been depicted for simplification purposes. These forces are the ones generated due to the EM torque and will cause the deflection in the shaft. In Figure 4b is considered the EM in boost mode where the torque is being transferred from the G2 (driver) gear to the G3 (driven) gear, resulting in the tangential, radial and axial forces depicted with red arrows (A-A plane). This torque is then delivered from G3 gear to the 4th gear on the secondary shaft 1 resulting in the forces and . The resultant forces acting on the G3 gear on the outer primary shaft are shown with black arrows. Similarly, the EM in recuperation mode, as shown in Figure 4c, will receive the torque from G2 gear that is delivered from the 4th gear on the secondary shaft 1 to the gear G3. Hence, the direction of tangential and axial forces will be opposite to the boost case.
The forces on the gear G3 used for the FEM simulation are calculated as follows:
In boost case:
In recuperation case:
While the axial forces used for FEM simulation remain the ones depicted in Figure 4a.
2.1.2. Scenario 2: 2nd Gear in Boost and Recuperation
Similar to the 1st scenario, the EM works in both boost and recuperation mode even if the torque path is different, as the EM delivers the torque to the OPS using the gears G1-G2-G3 (Figure 3) and it is finally delivered to the 2nd gear on the secondary shaft 2 using the helical gear (G4). Therefore, there are 2 helical gears on the OPS transmitting torque as depicted in Figure 5a. In Figure 5b,c the force contribution coming from the G3 and G4 gears is shown in boost and recuperation mode, respectively. G3 gear forces work in B-B plane and are shown with solid lines, while the G4 gear forces work in A-A plane and are shown with dashed lines.
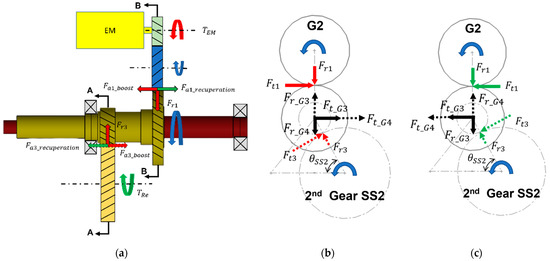
Figure 5.
Second gear: (a) front view; (b) side view in boost mode; (c) side view in regeneration mode.
The forces on the gear G3 and G4 that will be used for the FEM simulation are calculated as follows:
In boost case:
In recuperation case:
While the axial forces used for FEM simulation remain the ones depicted in Figure 5.
2.1.3. Scenario 3: ICE + EM in 4th Gear Boost
In this scenario torque from both the power sources (ICE and EM) is considered, with the EM operating in boost mode only. In Figure 6a the forces due to the torque from ICE and EM are shown. The EM torque is introducing the forces on gear G3 similar to the 4th gear boost mode, in addition there are forces due to torque of ICE that will act on the gear G3 depicted using the light blue lines. As a result, the forces experienced by gear G3 will be higher compared to the other two scenarios and is considered as the scenario with maximum torque that can be transferred by the transmission. The total torque that can be transmitted by the HDT is taken as 80% of the maximum torque mentioned in the manufactures catalogue [9]. In Figure 6b the force acting in the A-A plane are shown.
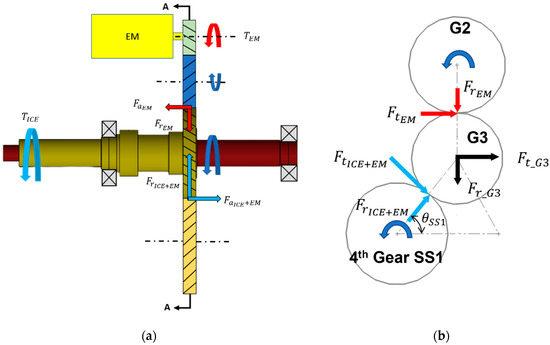
Figure 6.
ICE +EM in 4th gear: (a) front view; (b) side view.
The forces on the gear G3 that will be used for the FEM simulation are calculated as follows:
In boost case:
For both cases, the axial forces used for FEM simulation remain the ones depicted in Figure 6a.
2.1.4. Numerical Simulation Parameters
The mesh used for the FEM analysis is curvature-based tetrahedron mesh as shown in Figure 7a,b. The mesh density is chosen considering the computational cost and the convergence of the deflection results as shown in convergence plot in Figure 7c. It can be seen that the displacement results saturate with the increase of the mesh density. Hence, mesh with maximum element size of 1.5 mm is selected. The quality of the mesh elements is also an important aspect and could influence the results. Therefore, the FE mesh elements were run through an element quality check based on the aspect and Jacobian ratio. 99.8% of the elements fall under the aspect ratio of 3, with the maximum aspect ratio reaching the value of 6. Based on the Jacobian ratio results, no distorted elements were detected.

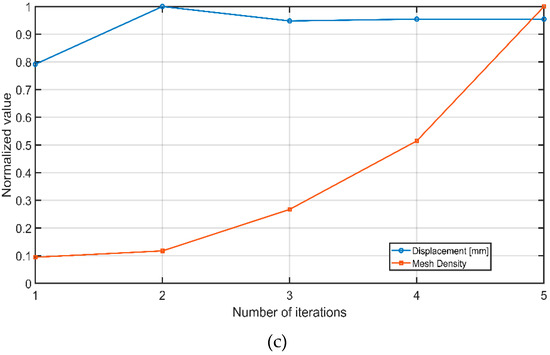
Figure 7.
(a) Mesh used for the FEM analysis: (b) zoom view; (c) convergence plot.
For the FEM analysis, the axial length of the primary shaft is considered equal to 325 mm, while the average inner and outer diameters corresponding to the inner shaft are 12 and 28 mm and for the outer shaft are 31 and 40 mm respectively, typical for a DCT. For the rest, the geometrical and inertial properties of a 7 speed DCT (7DCT300) are used in the simulation for the calculations. The details can be inferred from the Appendix A.
2.2. Static Analysis Results
In this section, the results obtained from the Solidworks FEM simulation for the static analysis are presented and discussed. In Table 2 the deflection at the end of the IPS is summarized for all the 3 scenarios presented before. In 2nd gear boost and recuperation mode the displacement reaches a maximum value of 46 μm (Figure 8) compared to the 4th gear, where it reaches a value of 79 μm (Figure 9). The deflection in 2nd gear is less compared to other scenarios due to presence of the BB1 next to G4, where the forces are applied. The maximum displacement is seen when the torque is transmitted from both the power sources that can reach up to 120 μm as shown in Figure 10.

Table 2.
The displacement results table.

Figure 8.
Fourth gear results: (a) boost; (b) recuperation.

Figure 9.
Second gear results: (a) boost; (b) recuperation.
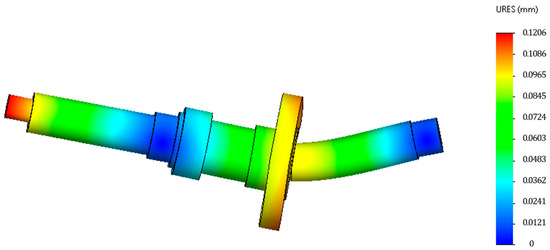
Figure 10.
ICE + EM in 4th gear boost result.
2.3. Rotor Dynamic Analysis
In this section are presented the modeling and results of the rotor dynamic analysis carried out using DYNROT FEM code [37] developed in MATLAB environment at our University. The main objective is to compute the deformations of the HDT primary shaft at the DMF side caused by the irregularities of the ICE and EM.
The model is shown in Figure 11. The inner and outer primary shafts have been modeled using Timoshenko beam elements (63 in total). The material properties for the beam elements are defined as AISI 4340. The ball bearings BB1 and BB2 are modeled as spring elements with the radial stiffness reported in Table 1. Each of the two needle bearings NB1 and NB2 is modeled as a combination of three spring elements working in parallel with stiffness equal to one third of the radial stiffness of the corresponding needle bearings.
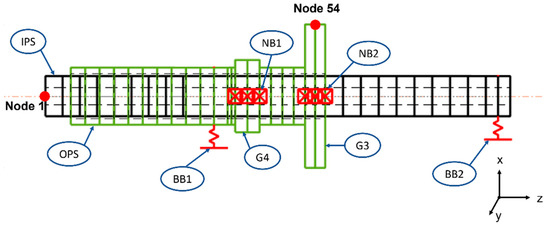
Figure 11.
FEM model using DYNROT code for the dynamic analysis.
The rotating parts are assumed to be axially symmetrical so that linearized equation of motion for the undamped system in complex coordinate frame can be written as follows [38]:
where, M is mass matrix, G is gyroscopic matrix, K is stiffness matrix, F is vector of unbalances, is vector of complex coordinates and is rotation speed.
The model includes 55 nodes in total with 2 complex degrees of freedom each, resulting in 110 degrees of freedom. The nodal displacements and rotations in complex coordinates involved in the flexural behavior are where , , and are the nodal displacements and rotations. The axial displacement and the torsional rotation are 2 additional real degrees of freedom that take the axial and torsional behavior into account, respectively. Each node has thus a total of 2 complex plus two real degrees of freedom. For this analysis only the flexural and torsional behavior are studied.
The model is used to determine the rotor Campbell diagram and critical speeds with the corresponding mode shapes. The effect of EM is evaluated considering two kind of dynamic effects:
- Effect of EM inertia torque during shafts angular accelerations.
- Effect of EM torque irregularities.
Both effects produce a torque that translates in contact forces acting on gears G1-G2-G3. Therefore, the problem has been studied by computing at varying speeds the transfer functions between the radial displacement at node 1 and the forces acting on node 54 as shown in Figure 11.
For transformation of the matrices from complex coordinates to real coordinates, the formulation in [33] has been used. Hence, the in complex coordinates is changed to in real coordinates.
The equation of motion to study the flexural behavior in X-Y coordinates is written as in Equation (19). The description of variables is given in Table 3.

Table 3.
Description of the variables.
Each node in real coordinates has four degrees of freedom compared to two degrees of freedom in complex coordinates. So, there are 220 degrees of freedom in total to describe the flexural behavior of the rotating system.
Dynamic Equation (19) can be reported, with explicit spin speed, in the state space representation in the following way, for X-Y behavior. The matrices are described in Table 4.

Table 4.
Description of the matrices.
Finally, the transfer function between the displacement at node 1 and force at node 54 is computed from the state space that is used to calculate the displacement in the scenarios discussed later. The transfer function for different values of is depicted below in Figure 12 and Figure 13. It can be seen that there are two peaks corresponding to the natural frequencies at 586 and 763 Hz. In Equation (19), it can be seen that the gyroscopic matrix () is speed dependent and as a result the gyroscopic effect increases with the speed. Hence, in Figure 13, the absolute value of the transfer function increases with increase in speed.
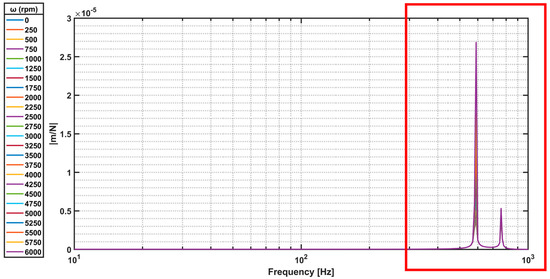
Figure 12.
Transfer function plotted at different .
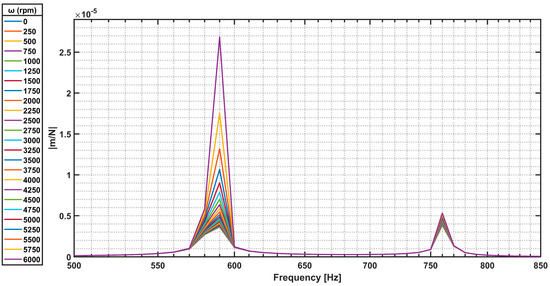
Figure 13.
Transfer function plotted at different (zoom to the region of interest).
.
The block shown in Figure 14 is used to calculate the displacement at the node 1, using the transfer function values shown in Figure 12. The inputs are , (forces generated due to ICE or EM torque irregularities which are described in the next subsection) and the frequency of the applied forces (2nd order harmonics for the ICE irregularities and 3rd order harmonics for the EM torque irregularities) and the output is displacement at node 1.

Figure 14.
Transfer function block used to calculate the displacement.
2.3.1. Scenario 1: Effect of EM Inertia Torque
Torque irregularities coming from the ICE (2nd order) plays a crucial role in the vibrations and deflections in the transmission. In this scenario, as depicted in Figure 15, the effect of the angular acceleration acting at the input of the transmission on the generation of the EM inertia torque are analyzed.
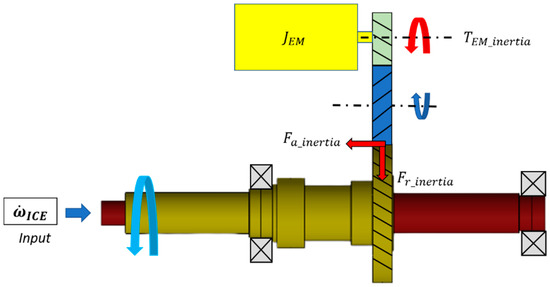
Figure 15.
Setup for the EM inertia torque calculations.
The speed of the ICE can be written as:
where, is the average ICE speed and represents the rotational speed irregularity that is present due to the 2nd order harmonics of the ICE.
The angular acceleration can be obtained by differentiating the Equation (22).
The EM inertia torque is then calculated as follows:
where, is the inertia of the EM, is the angular acceleration due to the torque irregularities and is the gear ratio between primary shaft and EM.
Inertia torque acts on gear G3 and generates tangential , radial ) and axial ) forces with a frequency that corresponds to the 2nd order harmonics of the ICE, which produces the displacement at the front end of IPS.
2.3.2. Scenario 2: Effect of EM Torque Irregularities
Similar to ICE torque irregularities, the EM also have torque irregularities. The most important is represented by the 3rd order frequencies of the EM speed (). EM torque irregularities () generate tangential , radial ) and axial ) forces that acts on the gear G3 as shown in Figure 16 and produce the displacements at the input of the inner primary shaft. In this scenario is considered as 1% of the total torque being transmitted by the EM, that is a function of the speed of the EM.
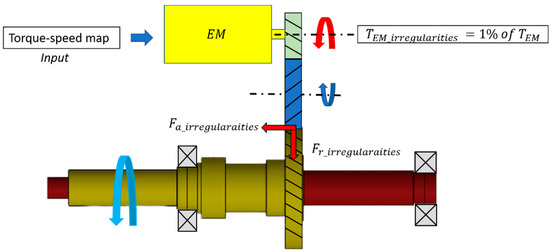
Figure 16.
Description of the torque transmission path.
3. Results and Discussion
Rotor Dynamic Analysis Results
In this section, the results obtained from the rotor dynamic analysis carried out with DYNROT FEM code are presented and discussed. Campbell diagram for the model in Figure 11 is shown in the Figure 17. From the Campbell diagram it can be seen that there are two natural frequencies of the system at 586 and 763 Hz calculated at 0 rpm that can reach up to 590 and 764 Hz at 6000 rpm due to variation of the stiffness matrix in Equation (19) with speed. As far as the critical speeds are concerned, it can be seen that in the working range of the ICE from 800 to 6000 rpm, no critical speeds are present for synchronous speed. Moreover the 2nd and 4th order ICE harmonics do not show any critical speeds either. The only critical speed exists for the 3rd order harmonics of the EM, which is at 4700 rpm.
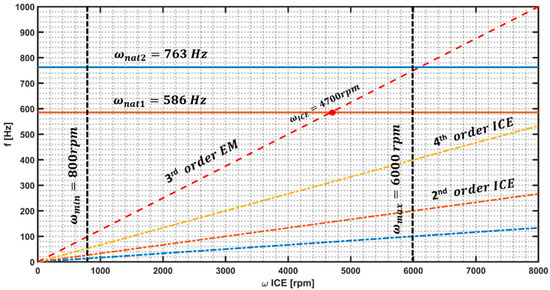
Figure 17.
Campbell diagram.
The mode shape for the first critical speed is reported below in Figure 18. It can be seen that the IPS and OPS both have a deflection at the ends.

Figure 18.
Mode shape: (a) 3D view; (b) 2D view.
Figure 19 shows the displacement due to the EM inertia torque. It can be seen that the displacement increases as the increase. This can be attributed to the fact that the torque irregularities coming from the ICE increases with increase in the speed of ICE up to a certain rpm (2500 rpm). Above this speed the angular acceleration is considered constant and the increase in displacement at higher rpm is due to the high value of the transfer function that are dependent on speed.
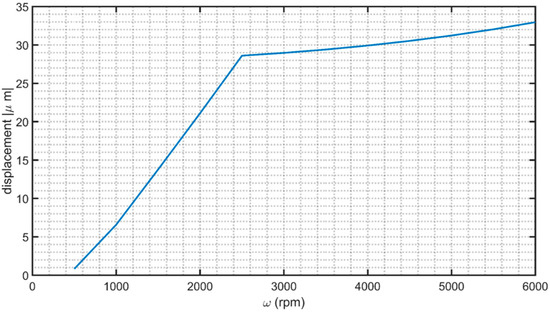
Figure 19.
Displacement results for EM inertia torque.
Figure 20 shows the displacement due to the EM torque irregularities. It can be seen that the displacement reaches a maximum value of 92 μm at . This is due to the fact that at this speed the 3rd order harmonics of the EM intersects with the first natural frequency as seen in the Campbell diagram (Figure 17).
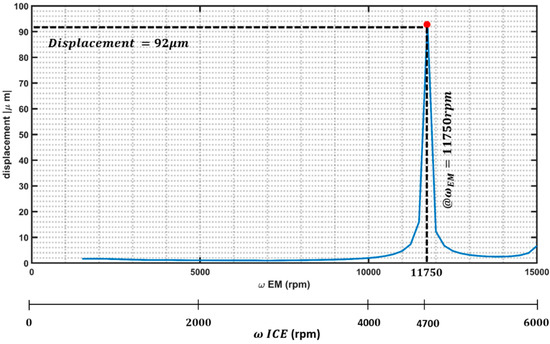
Figure 20.
Displacement results for EM torque irregularities.
4. Conclusions
Multiple sources of excitation and frequently changing operating modes may introduce potential issues in terms of reliability for P2.5 hybrid powertrain with dual clutch transmission. The paper presents static and rotor dynamic analysis of the HDT in terms of radial displacements that arises at the DMF level due to additional torque transmission from the EM. The responsible of such radial displacement is the gear train transmission that links the EM to the primary shaft. The torque is transmitted by a tangential/radial/axial force causing bending on the primary shafts. Static analysis show that the maximum displacement of the shaft end can reach 120 μm in the case of torque transmission from both the power sources. On the other hand, rotor dynamic analysis shows that the displacements due to EM inertia torque are not high and can reach up to 33 μm at 6000 rpm, while they can reach up to 92 μm due to the EM torque irregularities. The combined static and dynamic effects can lead up to a maximum displacement of 242 μm, which is below the critical values (1.6 mm) indicated in service manual of the DMF manufactures [27]. However, this radial displacement can be amplified due to the manufacturing and assembling tolerances of the HDT and may reach close to the critical values of the radial gap in the DMF. Therefore, the manufacturing and assembling tolerances should be kept below the critical values of the DMF clearance, including the deflection coming from the EM torque transmission.
Author Contributions
Conceptualization, I.K., S.R., N.A. and A.T.; Data Curation, I.K.; Formal Analysis, I.K., S.R., N.A. and A.T.; Investigation, I.K., S.R. and N.A.; Methodology, N.A. and A.T.; Project Administration, N.A. and A.T.; Resources, I.K. and S.R.; Software, I.K.; Supervision, N.A. and A.T.; Validation, I.K. and A.T.; Visualization, I.K.; Writing—Original Draft, I.K. and S.R.; Writing—Review and Editing, I.K., S.R., N.A. and A.T. All authors have read and agreed to the published version of the manuscript.
Funding
This research received no external funding.
Institutional Review Board Statement
Not applicable.
Informed Consent Statement
Not applicable.
Data Availability Statement
Data is not available due to restrictions.
Acknowledgments
This work was developed in the framework of the activities of the Interdepartmental Center for Automotive Research and Sustainable Mobility (CARS) at Politecnico di Torino (www.cars.polito.it, accessed on 13 December 2021).
Conflicts of Interest
The authors declare no conflict of interest.
Appendix A
For this study, the DCT data used is from the 7-speed transmission from Magna (7DCT300) [39]. Gear ratios of the DCT used in this work are given below in the Table A1:

Table A1.
7DCT300 Gear ratios.
Table A1.
7DCT300 Gear ratios.
| Transmission type: | Dual clutch |
| Number of gears: | 7 |
| Gear ratios (overall): | |
| I | 4.462 (18.63) |
| II | 2.824 (11.79) |
| III | 1.805 (7.54) |
| IV | 1.262 (5.27) |
| V | 0.964 (4.03) |
| VI | 0.771 (3.22) |
| VII | 0.638 (2.66) |
| Final drive ratio: | 4.176 (4.733 for 3rd and 5th gear) |
Detailed CAD data regarding the DCT can be assessed from [40].
References
- Regulation (EU) 2019/631 of the European Parliament and of the Council. Available online: https://eur-lex.europa.eu/legal-content/EN/TXT/PDF/?uri=CELEX:32019R0631&from=EN (accessed on 1 July 2021).
- 2030 Climate Target Plan. Available online: https://ec.europa.eu/clima/policies/eu-climate-action/2030_ctp_en (accessed on 1 July 2021).
- Shaheen, S.A.; Lipman, T.E. Reducing greenhouse emissions and fuel consumption. IATSS Res. 2007, 31, 6–20. [Google Scholar] [CrossRef]
- Amati, N.; Tonoli, A.; Castellazzi, L.; Ruzimov, S. Design of electromechanical height adjustable suspension. Proc. Inst. Mech. Eng. Part D J. Automob. Eng. 2017, 232, 1253–1269. [Google Scholar] [CrossRef]
- Ehsani, M.; Gao, Y.; Longo, S.; Ebrahimi, K.M. Modern Electric Hybrid Electric and Fuel Cell Vehicles, 3rd ed.; CRC Press: Boca Raton, FL, USA, 2018; Volume 82, p. 793. [Google Scholar]
- Chen, H.; Li, L.; Küçükay, F. Study of series-parallel and power-split DHT for hybrid powertrains. Automot. Innov. 2021, 4, 23–33. [Google Scholar] [CrossRef]
- Sieg, C.; Küçükay, F. Benchmarking of dedicated hybrid transmissions. Vehicles 2020, 2, 100–125. [Google Scholar] [CrossRef]
- Rahmeh, H.; Bonfitto, A.; Ruzimov, S. Fuzzy Logic vs Equivalent Consumption Minimization Strategy for Energy Management in P2 Hybrid Electric Vehicles. In Proceedings of the 22nd International Conference on Advanced Vehicle Technologies (AVT), St. Louis, MO, USA, 17–19 August 2020; Volume 4. [Google Scholar]
- Blessing, U.C.; Meissner, J.; Schweiher, M.; Hoffmeister, T. Scalable hybrid dual-clutch transmission. Auto Tech. Rev. 2015, 4, 46–51. [Google Scholar] [CrossRef]
- Huang, W.; Zhang, J.; Huang, J.; Yin, C.; Wang, L. Optimal speed regulation control of the hybrid dual clutch transmission shift process. World Electr. Veh. J. 2020, 11, 11. [Google Scholar] [CrossRef]
- Joshi, A.S.; Shah, N.P.; Mi, C. Modeling and simulation of a dual clutch hybrid vehicle powertrain. In Proceedings of the 2009 IEEE Vehicle Power and Propulsion Conference, Dearborn, MI, USA, 7–10 September 2009. [Google Scholar]
- Walker, P.; Zhu, B.; Zhang, N. Powertrain dynamics and control of a two speed dual clutch transmission for electric vehicles. Mech. Syst. Signal Processing 2017, 85, 1–15. [Google Scholar] [CrossRef]
- Liang, J.; Walker, P.D.; Ruan, J.; Yang, H.; Wu, J.; Zhang, N. Gearshift and brake distribution control for regenerative braking in electric vehicles with dual clutch transmission. Mech. Mach. Theory 2019, 133, 1–22. [Google Scholar] [CrossRef]
- Mrochen, M.A.; Sawodny, O. Modeling and simulation of a hybrid dual-clutch transmission powertrain. IFAC-PapersOnLine 2018, 51, 886–891. [Google Scholar] [CrossRef]
- Qin, Y.; Tang, X.; Jia, T.; Duan, Z.; Zhang, J.; Li, Y.; Zheng, L. Noise and vibration suppression in hybrid electric vehicles: State of the art and challenges. Renew. Sustain. Energy Rev. 2020, 124, 109782. [Google Scholar] [CrossRef]
- Brandl, S.; Biermayer, W.; Graf, B.; Resch, T. Hybrid vehicle’s NVH challenges and influences on the NVH development. SAE Tech. Pap. Ser. 2016. [Google Scholar] [CrossRef]
- Walker, P.D.; Zhang, N. Active damping of transient vibration in dual clutch transmission equipped powertrains: A comparison of conventional and hybrid electric vehicles. Mech. Mach. Theory 2014, 77, 1–12. [Google Scholar] [CrossRef]
- Kim, S.; Choi, S.B. Cooperative control of drive motor and clutch for gear shift of hybrid electric vehicles with dual-clutch transmission. IEEE/ASME Trans. Mechatron. 2020, 25, 1578–1588. [Google Scholar] [CrossRef]
- Sezer, V. Driving shaft lifetime enhancement by hybrid electrification. Proc. Inst. Mech. Eng. Part D J. Automob. Eng. 2018, 233, 572–584. [Google Scholar] [CrossRef]
- Galvagno, E.; Vigliani, A.; Calenda, G. Dual-Mass flywheel with torque limiter: An effective solution for overtorque suppression in automotive transmission. SAE Tech. Pap. Ser. 2020. [Google Scholar] [CrossRef]
- Maffiodo, D.; Sesana, R.; Paolucci, D.; Bertaggia, S. Finite life fatigue design of spiral springs of dual-mass flywheels: Analytical estimation and experimental results. Adv. Mech. Eng. 2018, 10, 168781401877847. [Google Scholar] [CrossRef]
- Laukenmann, M.A.; Sawodny, O. Model-Based control of a clutch actuator used in hybrid dual-clutch transmissions. Mechatronics 2021, 77, 102585. [Google Scholar] [CrossRef]
- Mrochen, M.A.; Sawodny, O. Analysis and control of hybrid powertrains equipped with dual-clutch transmissions. In Proceedings of the 2020 American Control Conference (ACC), Denver, CO, USA, 1–3 July 2020. [Google Scholar]
- Galvagno, E.; Velardocchia, M.; Vigliani, A. Torsional oscillations in automotive transmissions: Experimental analysis and modelling. Shock Vib. 2016, 2016, 5721960. [Google Scholar] [CrossRef]
- Engine Bearing: Failure Analysis And Correction, Aftermarket, Mahle. Available online: https://www.mahle-aftermarket.com/media/local-media-north-america/pdfs-&-thumbnails/catalogs-and-literature/engine-bearings/ceb-2-1114-engine-bearing-failures-brochure.pdf (accessed on 12 December 2021).
- Haneef, M.D.; Randall, R.B.; Peng, Z. Wear profile prediction of IC engine bearings by dynamic simulation. Wear 2016, 364–365, 84–102. [Google Scholar] [CrossRef]
- Jang, J.Y.; Khonsari, M.M. On the wear of dynamically-loaded engine bearings with provision for misalignment and surface roughness. Tribol. Int. 2020, 141, 105919. [Google Scholar] [CrossRef]
- Haneef, M.D.; Randall, R.B.; Smith, W.A.; Peng, Z. Vibration and wear prediction analysis of IC engine bearings by numerical simulation. Wear 2017, 384–385, 15–27. [Google Scholar] [CrossRef]
- Naunheimer, H.; Bertsche, B.; Ryborz, J.; Novak, W. Design of gearwheel transmissions for vehicles. Automot. Transm. 2010, 237–277. [Google Scholar]
- Galvagno, E.; Guercioni, G.; Vigliani, A. Sensitivity analysis of the design parameters of a dual-clutch transmission focused on NVH performance. SAE Tech. Pap. 2016. [Google Scholar] [CrossRef]
- LuK Common Dual Mass Flywheel Issues. Available online: https://www.techtips.ie/LuK/common-dual-mass-flywheel-issues.pdf (accessed on 12 December 2021).
- Taplak, H.; Parlak, M. Evaluation of gas turbine rotor dynamic analysis using the finite element method. Measurement 2012, 45, 1089–1097. [Google Scholar] [CrossRef]
- Wilcock, D.F.; Booser, E.R. Bearing Design and Application; McGraw-Hill Company, Inc.: New York, NY, USA, 1957. [Google Scholar]
- El-Sayed, H.R. Stiffness of deep-groove ball bearings. Wear 1980, 63, 89–94. [Google Scholar] [CrossRef]
- Technical Report—NSK. Available online: http://www.nsk-literature.com/en/technical-report/offline/download.pdf (accessed on 12 December 2021).
- Maitra, G.M. Handbook of Gear Design; Tata McGraw-Hill Education: New York, NY, USA, 1994. [Google Scholar]
- Genta, G.; Delprete, C.; Bassani, D. DYNROT: A finite element code for rotordynamic analysis based on complex co-ordinates. Eng. Comput. 1996, 13, 86–109. [Google Scholar] [CrossRef]
- Genta, G. Vibration of Structures and Machines: Practical Aspects; Springer Science & Business Media: Berlin, Germany, 2012. [Google Scholar]
- Automobile Catalog: The Complete Catalog of Cars Since 1945. Available online: https://www.automobile-catalog.com/auta_details1.php (accessed on 12 December 2021).
- DeVincent, E. Getrag DCT new modular platform from 100 Nm to 500 Nm. In Proceedings of the 7th International CTI Symposium, Detroit, MI, USA, 13–15 May 2013. [Google Scholar]
Publisher’s Note: MDPI stays neutral with regard to jurisdictional claims in published maps and institutional affiliations. |
© 2022 by the authors. Licensee MDPI, Basel, Switzerland. This article is an open access article distributed under the terms and conditions of the Creative Commons Attribution (CC BY) license (https://creativecommons.org/licenses/by/4.0/).