Abstract
This article presents an overview of the graphical user interfaces (GUIs) developed at CEA/SERMA (Service d’Études des Réacteurs et de Mathématiques Appliquées) in Saclay, France, which have been used for over forty years by engineers and scientists to build geometries and meshes for general-purpose lattice transport calculations (neutrons and photons). Several applications make use of these calculations, from fuel assembly to full core design, criticality and safety, needing consistency check of the geometry and input properties before starting any lattice calculation. The software pattern design of the GUIs is briefly discussed, showing also the rationale behind the two interfaces for the construction of the geometries for simple fuel assemblies and complex motifs including the reflector (colorsets). The new GUI, ALAMOS, specifically developed for APOLLO3® with a Python Application Programming Interface (API), is here presented as the successor of Silène, which was the first GUI released in the 1990s to serve APOLLO2 calculations. The considerable experience gained by Silène over the years with plenty of various applications has provided a crucial support for the development of ALAMOS.
1. Introduction
In recent years, lattice transport computer codes have been able to treat larger and larger problems in size thanks to the great advancements in computational power and the algorithms’ efficiency. The complex geometry of heterogeneous heavy reflector problems provides significant examples of application. Both deterministic and Monte Carlo computer codes solving the Boltzmann transport equation need thorough geometry and mesh design work.
Different types of mesh are often necessary for the same technological geometry, being the one delimiting the different material zones. Geometries are in general of unstructured type and meant for general-purpose MOC (Method of Characteristics) solvers and CPM (Collision Probability Method) solvers, which require in addition tracking data for the angular discretization [1]. Monte Carlo codes need to assign volume tallies onto the cell elements instead. Both need to assign material data and other properties to the cells of the mesh. Complex geometries are usually obtained by the combination of more elementary ones. For instance, assemblies are made of pin cells and cores by assemblies and reflector.
There is however also the need of producing structured geometries that show uniform patterns. The full core geometry normally shows both geometry types. The main difference between structured and unstructured geometries lies in the way data for points, lines and surfaces are stored. The structured type makes use of basic shapes (mainly polygons and circles) represented by prescribed equations whose coefficients can be varied by the user. By connectivity, the structured type can take advantage of previously stored data of neighboring cells when storing data of a given cell, which moreover allows saving memory for global storage. It follows that the amount of storage needed by the unstructured type is normally larger.
The need for dedicated tools to assist the user with the preparation of input data appeared to be evident since the earliest release of APOLLO2 in the 1980s [2,3]. APOLLO2 was the first deterministic neutron transport computer code developed at SERMA offering CPM and MOC capabilities by the solver TDT (Two- and Three-Dimensional Transport). The graphical user interface (GUI) Silène was specifically developed for TDT, which used unstructured geometries. Silène also integrated the post-processing of results. Later, Silène extended the support of geometry and mesh generation to the Monte Carlo code TRIPOLI-4® [4]. The tool allowed sharing work applications efficiently among users with easy backup, by unifying the data model and by checking its consistency. Silène was an original, intuitive and successful product distributed with all major releases of APOLLO2.
TDT was later integrated and upgraded in APOLLO3® [5], still taking advantage of the mesh generation by Silène. Now APOLLO3® also offers the PN DG-FEM solver NYMO (PN stands for spherical harmonics and DG-FEM for discontinuous Galerkin Finite Element Method), which can input the same mesh used by TDT. ALAMOS was expressly developed for APOLLO3® as a new GUI, relying on the extensive experience gained with Silène in over thirty years, and fully operating in the framework of the SALOME platform. (“SALOME: The Open Source Integration Platform for Numerical Simulation”, https://salome-platform.org/. accessed on 30 December 2021) In addition to Silène, ALAMOS offers a more user-friendly and comprehensive programming interface that allows users to build their own portable and extensible applications in Python, creating simple scripts, advanced modules, and specialized packages. At present, Silène has achieved its final maturity level and will not receive any significant update or support in the near future. Although Silène is now considered as a legacy code, it still serves as an experimental tool to explore advanced needs and to check the feasibility of innovative functionalities for ALAMOS.
The production of geometry and material input data for Monte Carlo codes was motivated initially by verification and validation needs. Both Silène and ALAMOS can setup input data for TRIPOLI4® calculations [4]. Two-dimensional calculations are the typical case for lattice calculations, and especially to prepare homogenized crosssections for full-core calculations. Three-dimensional lattice calculations are usually limited to two-dimensional geometries that have been axially extruded, with multiple axial levels. Other three-dimensional transport calculations used for instance in radiation protection and shielding applications are not the object of this work.
The purpose of this work is to give an overview of the GUIs developed at SERMA for over forty years in order to support many engineering applications with lattice transport computer codes. The problem geometries treated by the GUIs are briefly presented in Section 2, while the software architecture of the two products is discussed in Section 3. The data models used to represent the geometry objects are explained in Section 4. Section 5 is dedicated to illustrating typical problems from fuel design and nuclear engineering, with some examples of advanced use cases. A conclusion follows in Section 6.
2. Geometry and Problem Definition
Fuel assemblies (FA) used in nuclear reactors are based on a lattice geometry, possibly framed with an outer metal box and contoured with water gaps. A lattice is a regular pattern of fuel pin cells arranged according to a Cartesian grid, such as in PWR and BWR FAs, or a hexagonal grid, such as in VVER and fast reactors. The repetition of the same fuel pin cells in the pattern, and in general, the fact that the same kinds of basic geometric elements are constantly used to build the final drawing allows the efficient use of object-oriented programming concepts and the optimized storage of structured geometry. The second is however a milder advantage since unstructured geometry storage is often preferred since it allows the description of more general drawings.
A geometry is defined as a collection of points and lines in the plane, forming a wireframe. The same holds for extruded three-dimensional geometries showing different planes along the axis. Lines can be curvilinear and belong to different types of conic surfaces intersecting the plane. Lines can be represented in parametric form or by points. In the second case, two points are sufficient for straight lines, one point plus a value for the radius are needed for circles, while at least three points are needed for others, such as arcs of circles. Alternatively, information about the curvature is needed for other arc types. These last are usually neglected since they are rarely employed in engineering applications. The reference frame is Cartesian, also in the case of lattices with hexagons and triangles.
The APOLLO’s solvers do not need to approximate cylinders by polygons, so that the GUIs output geometric data with no approximations. Although the GUIs dispose of functions calculating various kinds of intersections between lines and surfaces, the tracking data needed by the MOC and CPM solvers are calculated by specific APOLLO routines. Lines keep information about the identifiers of the neighboring cells to ease the calculation of tracks and chords, thus implementing the notion of connectivity. This information is exported by the GUIs to external files together with temperature and material property assignments using an APOLLO-specific text input format. Boundary conditions are handled independently from the GUIs by APOLLO3®, which makes use of predefined keywords for the set of geometrical transformations representing the equations for the unknown flux that apply on all boundaries. This technique avoids the use of numerical or literal identifiers for the different lines building the outer boundary.
3. Software Architecture
As anticipated from Section 2, the GUIs make ample use of object-oriented programming concepts when drawing the full geometry and meshing. This section presents the software architecture of Silène and ALAMOS. These tools offer graphical and textual user interfaces to support lattice calculations by APOLLO3®. The graphical interfaces are interactive and display responsively the modifications to the drawings after the user’s selection.
The software design pattern adopted by Silène and ALAMOS is the Model-View-Controller (MVC) pattern. As indicated by the name, this pattern is based on three components: a model, a view and a controller. The model contains all the data structure that is dynamically built by the user’s actions through the interface. The view displays to screen the data by visual representations: plots, tables, charts, etc. The controller receives and validates input data from the user, calls actions and passes data to the model.
Silène was developed in Java, the programming language supported by Oracle, and has been running since Java standard edition 8 (a release with long-term support) [2,6,7]. Along with the compiler, Java is distributed with all libraries for serialization, graphics, documentation, internationalization, database management and more, without needing particular customization for the specific operative system used or for the computer architecture. A single precompiled executable is generated running on the Java virtual machine. Silène programming is object oriented with all entities defined as objects. There are two working modes. The component mode operates with structured geometries, such as cells, grids, boxes and variables, while the drawing mode is meant for unstructured geometries, which use nodes, equations, meshes and regions. Silène also handles boundary conditions. Objects are stored and handled (created, modified and deleted) by linked lists, where they are identified by pointers. At any time, the user can find them by their order number in the lists.
ALAMOS makes extensive use of the Python libraries provided in the framework of the SALOME platform. SALOME provides a large set of tools, called modules, for general pre and post processing of numerical simulations. Indeed, ALAMOS has been developed as a module of SALOME to take advantage of its module MEDCoupling, which is a library specialized in operations with fields defined upon unstructured geometries, representing scalar, vector and tensor quantities (among other rich functionalities). ALAMOS is almost entirely programmed with a Python API (Application Programming Interface) accessing SALOME’s C++ functions. ALAMOS defines the model, the view and the controller by three different Python classes. The view is composed of three types of widget: a tab widget displaying the geometry under construction; an info widget displaying information about the sizes, the identifiers of the different elements and other properties; and a tree widget gathering all geometry objects, distinguished by their names. The model is based on a standard Python structure, using a timestamp mechanism to detect out-of-date data, and hence trigger a view refresh. Finally, the controller has been implemented using an “action queue” where each user request in the interface, such as drawing a circle, assigning a value to a field, or others, is encoded as an action that is stored in a dedicated incremental list. This mechanism serves two purposes. The first is that it allows one to easily undo a previous action, which is very useful when in the middle of a designing process, while the second is that it allows the recording of the whole sequence of actions performed by the user in a Python script. Besides, this last feature becomes highly valuable for a sensitivity study in an automated context where the full geometry must be regenerated many times by varying a few parameters, or variables, through the same script. Eventually, a Python interpreter in a dedicated window panel will soon be integrated into the ALAMOS interface (interpreter widget), thus allowing the user to promptly test advanced operations directly on the sketched geometry.
4. Data Models
The data models of the two GUIs are presented separately in this section. Objects are generally drawn or described by components in Silène, and by layers in ALAMOS. Both store geometry, material and other data, such as information about the relationship with the other objects, but using different programming languages, and mostly, a different level of abstraction. In particular, Silène makes use of many specialized classes that must have been defined beforehand by the developers, whereas ALAMOS exploits the object-oriented approach more effectively, letting users define new high-level classes more easily.
4.1. The Model of Silène
The data model of Silène relies on collections that are coherent sets of all geometrical components used for a particular study. Complex geometries are always decomposed into the most basic geometries. Silène adopts different operating modes for the two types of geometries by creating regular or structured components or by drawing unstructured shapes. Although the modes are distinct, the user can work simultaneously on both, until achieving the final result by combining the two modes. A structured model can be converted into an unstructured one at any time, which allows using mesh refinement methods from the unstructured mode on structured geometry, and conversely, the simplification of unstructured geometry down to a structured one.
In the component mode, the regular geometries can be sketched visually by selecting values for the different object properties through window panels, or described by the symbolic interpreted language of Silène using a text editor. Ten types of elementary components are available: medium (homogeneous material), cell (cylindrical, rectangular and hexagonal), grid (rectangular, hexagonal and hexagonal within a rectangle), box (rectangular and hexagonal) and motive (unstructured geometry). Any component can be inserted into another, regardless of exact matching between the corresponding outer frames thanks to transformations such as rotation, symmetry and reduction to complete the pattern. The user can access the numerous properties of each component on a specific window. The concept of variables was added to ease the user’s work by resolving the dependencies among related components. Boolean, Integer, Double and String global consistency. As an example, the cell side is generally the same for multiple different pin cells, and a simple change in value takes global scope. Derived components can be defined using existing components by specifying only the differences in their definitions. A derived component inherits its properties from its parent component and successive derivations (from derived components) are allowed. Derivation may consist of the replacement of a referenced sub-component, the modification of a dimension, etc. The use of derived components improves the readability of a collection.
In the drawing mode, the user describes any arbitrary geometry that can be set by equations: the supported equations are for straight-line segments, circles and arcs of circles. A set of nodes (points) is defined first with equations joining the nodes, the meshes are then assigned on the area delimited by the equations, and the media (material properties) are in turn assigned to the meshes. This approach is flexible because the geometry is described locally. The code does not know the shape of the geometry, nor the meshes. Many functionalities are available to assist the user during the drawing work. Some are elementary, allowing the creation and removal of nodes and equations, with automated renumbering and ordering of the elements in the model. New nodes can be added on existing lines by positioning relative to existing nodes (about 20 different ways). Media modifications, starting from simple changes in names, apply to all cells of the mesh after assignment. Additionally, Silène is capable of defining output zones and of applying boundary conditions. Silène integrates continuous checking of geometry consistency to prevent openness and concavity in the geometry model. It is possible to combine geometries by functionalities taking on global scope: import methods for the insertion of a mesh into another, side junction, mesh superposition or overwrite, up to the splitting of a geometry into its constituents. Import can work on multiple levels, such as from cells in the assembly, to assemblies in blocks of assemblies, and blocks in the reactor core. A special treatment is reserved for the insertion of holes in heavy reflectors from a collection.
A core geometry can contain thousands of media names because of fuels with different enrichments. The user can make use of media with generic attributes and names, called simply generic media, to avoid potential issues with the generation of all media at once. In fact, specific media can be generated on-the-fly from generic ones. For the generation of multiple geometries from a template, Silène allows users to make their own APIs for batch execution with pre-programmed actions, still using its own symbolic language.
4.2. The Model of ALAMOS
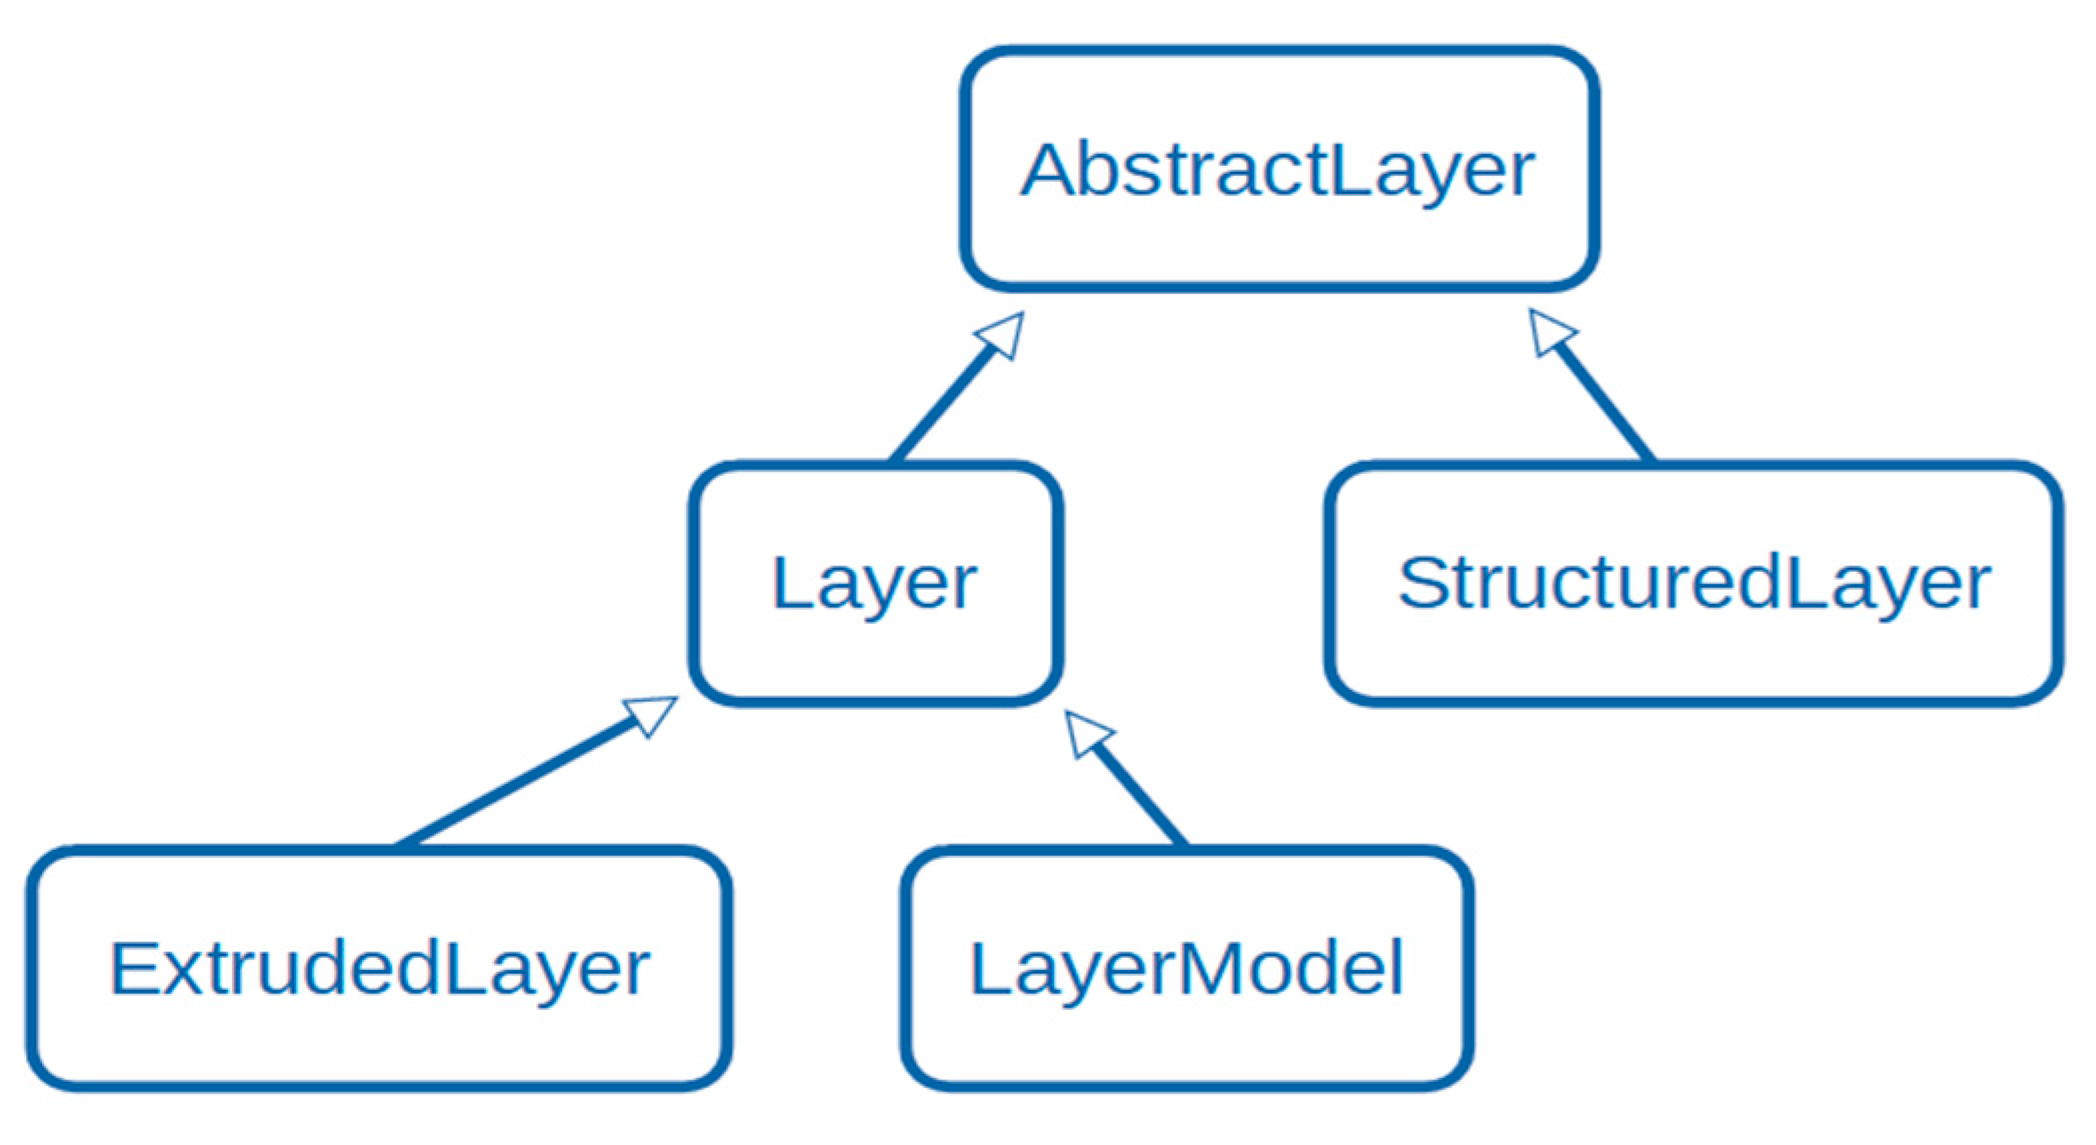
The ALAMOS data model is based on the object layer that is constituted of a geometry made of points and lines, upon which fields of properties and references are associated (see below). In the Python implementation depicted briefly in Figure 1, all layers derive from the abstract Python class “AbstractLayer” that contains all the information of the property fields defined on the geometry. Only the class “LayerModel” contains the methods necessary for visualization and geometry export to file, being also the only one exploited by View. All layers need a conversion to a LayerModel instance to be sketched on the tab widget. Two main types of layers can be instantiated, namely structured and unstructured layers, with class names “StructuredLayer” and “Layer”, respectively, still drawing two-dimensional geometries. The reason for the short class name for the unstructured layers is that they were the first to be implemented, being still the default ones for the code. Extruded patterns are defined internally as collections of multiple layers of the same class, allowing for different axial configurations in both geometry and materials, depending on the specifications and requirements of the flux solver used next for the calculations.
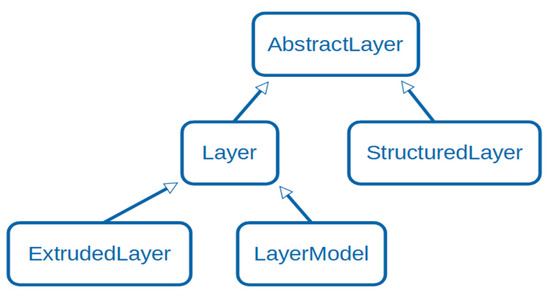
Figure 1.
Simplified UML class diagram of the ALAMOS data model based on layers.
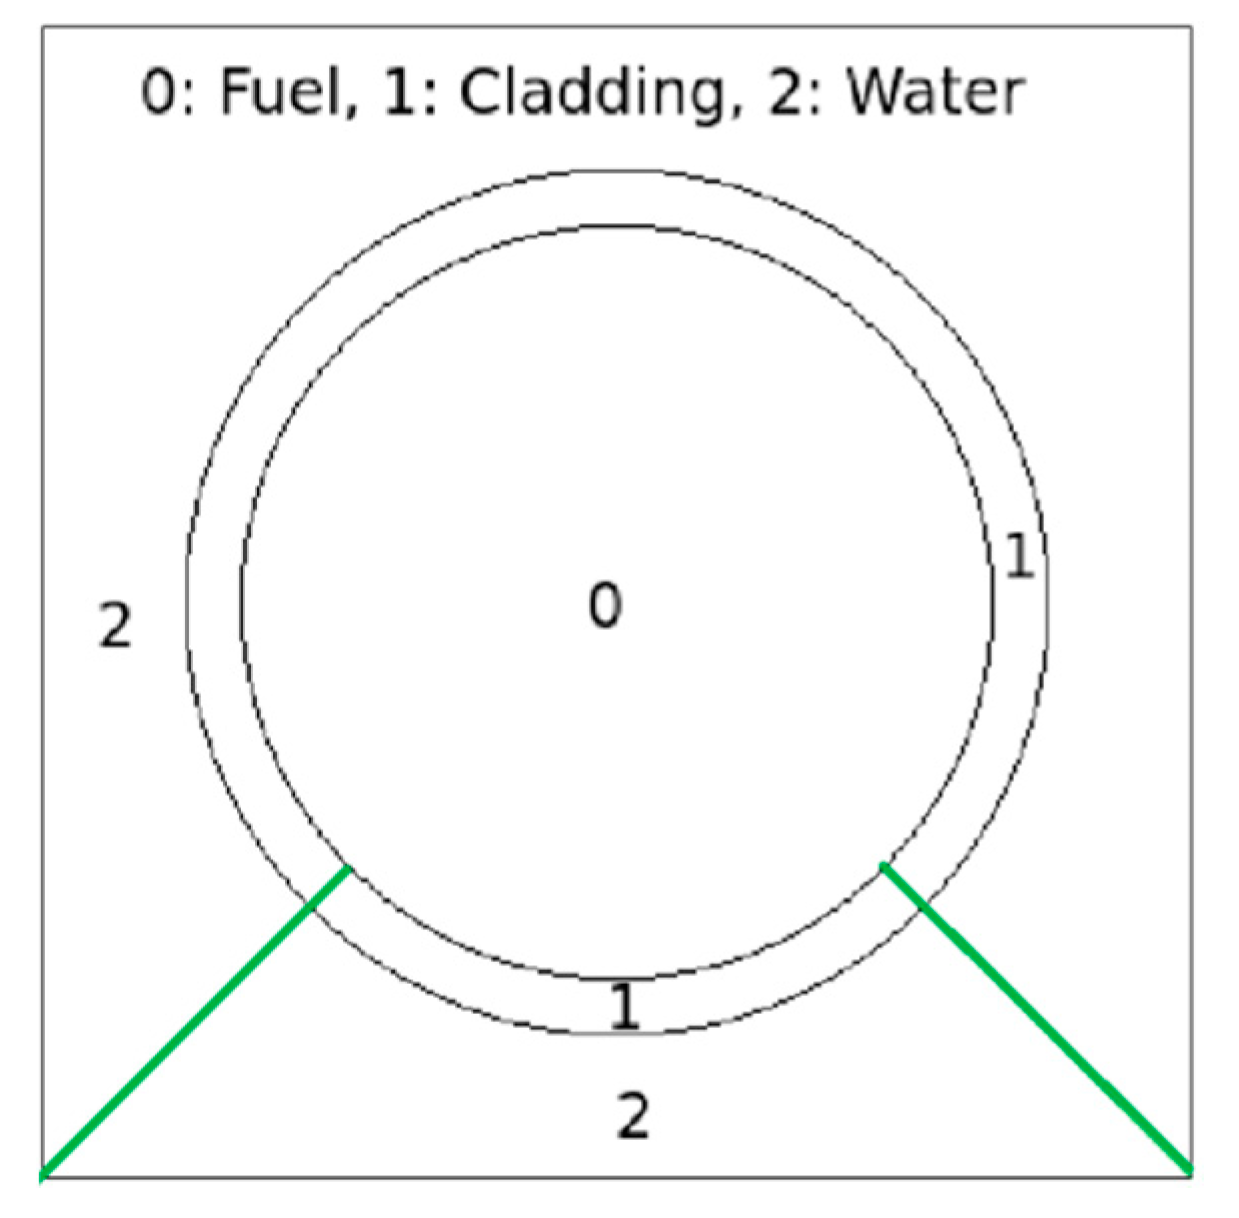
In the unstructured case, points and segments are stored by an object of the type “MEDCouplingUMesh” from the SALOME library MEDCoupling. The geometrical pattern is actually considered as a classical FEM unstructured mesh (FEM stands for Finite Element Method) represented in the open-source MED format, where the lines joining the points yield mesh cells. This format cannot handle cells whose boundaries are not connected, such as in the case of a circle inserted into a square. Indeed, the intermediate zone between the square and the circle has two disjointed boundaries. Therefore, ALAMOS introduces the concept of metacell, namely the union set of neighboring MED cells. In the square/circle case, the intermediate region is decomposed into two different MED cells, which are grouped into a single metacell by the ALAMOS engine in order to ensure consistent visualization and handling. The user works only with metacells and ALAMOS automatically adds the construction lines to obtain a suitable mesh in MED format; see Figure 2. Such a procedure comes with a constraint: when drawing nested elements, the user must start from the outer one, which encloses all the others. This applies to all elements recursively. The construction lines are hidden by default, but can be displayed in the tab widget by switching on the corresponding option. Alternatively, a MED file can be exported and opened on other SALOME viewers, such as PARAVIS that use MED as the default format. The MEDCoupling library offers many functionalities, such as calculation of cell surfaces and centers of mass, and detection of the intersection of two arbitrary patterns. This last functionality is at the core of the drawing mechanism. In fact, every time the user defines a line crossing the existing pattern, new intersections must be computed to form the new pattern.
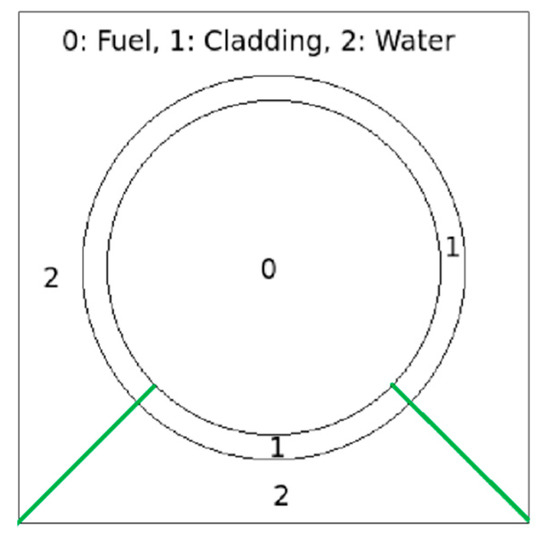
Figure 2.
Construction of fuel pin cell with legend of the materials and the numbering of metacells.
Structured layers serve mainly for IDT calculations. IDT (Integro-Differential Transport) is another flux solver of APOLLO3® based on the method of discrete ordinates and short characteristics (MOC), which is optimized for problems using Cartesian spatial meshes comprising homogeneous and heterogeneous cells. Structured layers describe a few primitive layers by means of basic shapes, implemented through non-parametric equations. Two kinds of structured layers are available: grids and cells. The former can be of Cartesian or hexagonal type, while the latter describes general pin cells, with or without fuel, as control rods or guide tubes. Cells are composed of a bounding shape (rectangular, circular or hexagonal box) in which concentric circles are located. Although cells can be inserted in a grid layer to build a typical fuel lattice, an internal conversion to an unstructured layer is required before visualization on screen.
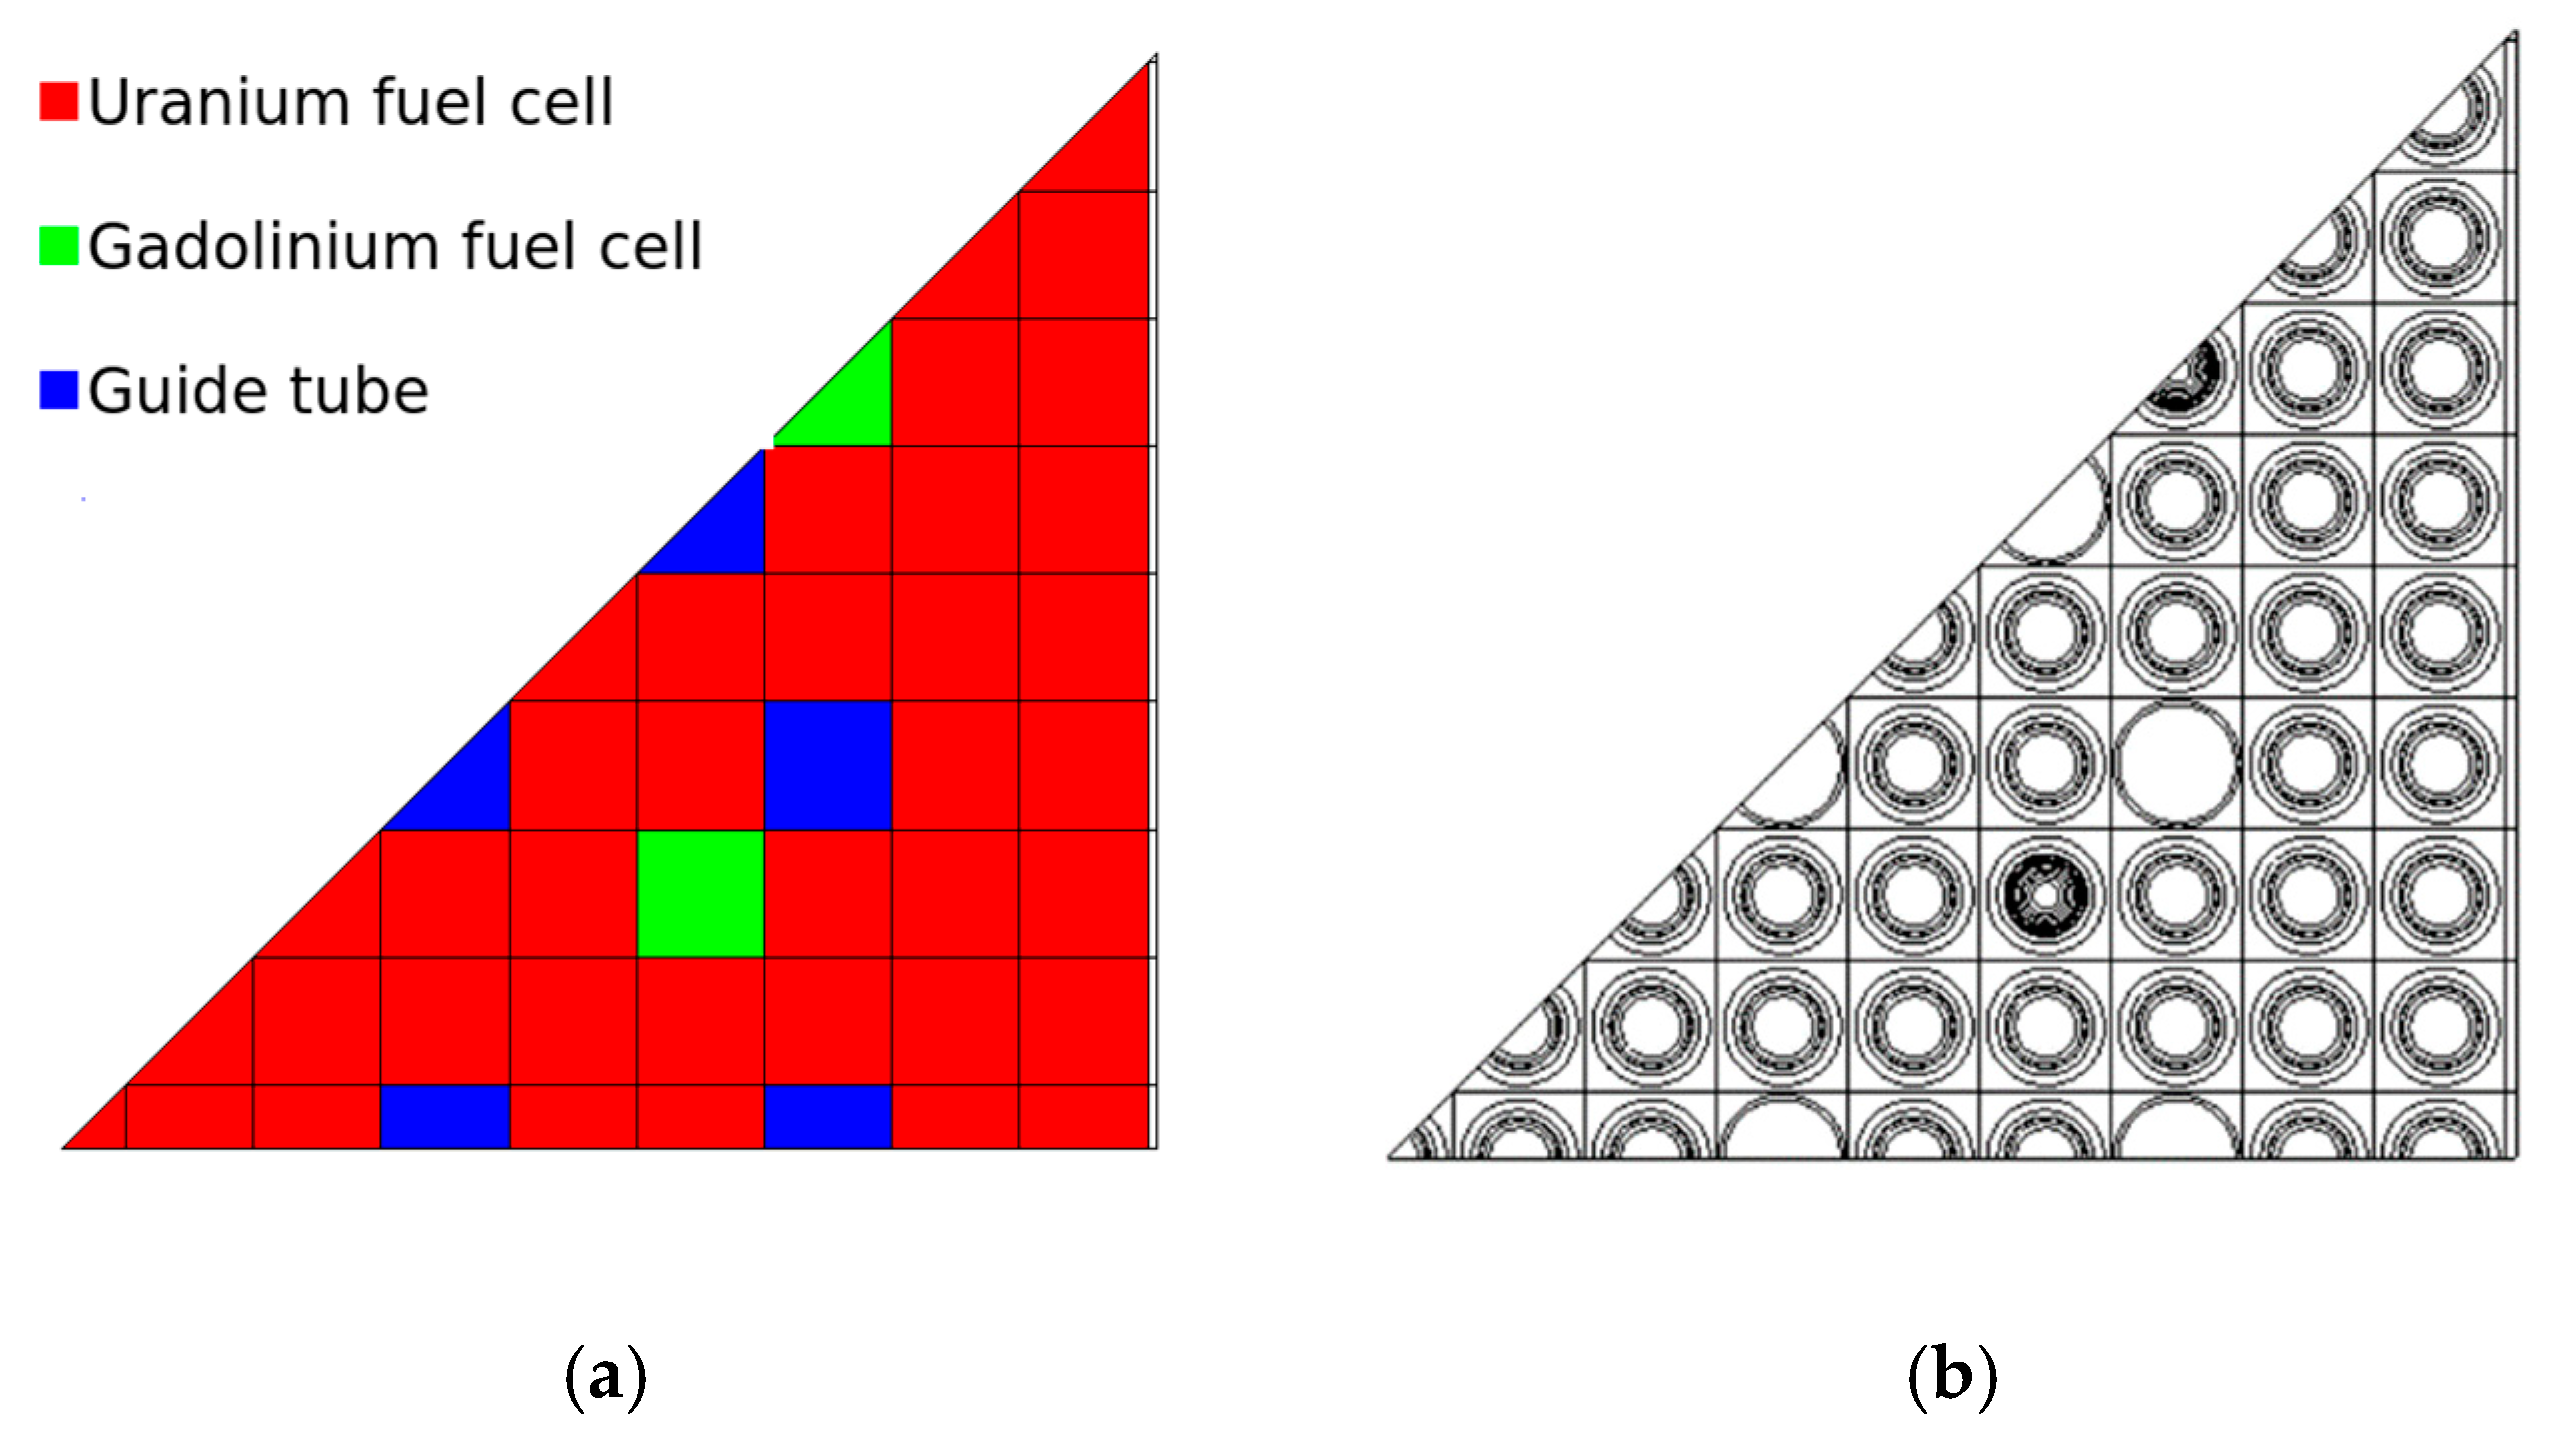
For unstructured layers only, set operations are available to build more complex layers from simpler ones. Layers can then overlap with partial intersection or be joined by union. It is possible to insert layers inside an existing layer by means of a reference assignment. In particular, the relationship to make the insertion, also called as reference, is specified by using the identifiers of the metacell to insert into a given hosting metacell. The action of flattening the new geometry by importing the referenced layers in the hosting one is called dereferentiation. This action is also available as an in-place operation. The referencing relationship stored in the top layer can be completed by Euclidean geometric transformations (rotation, reflection and translation). With respect to other affine transformations, only scaling is supported while dereferencing. If the size of the inserted pattern does not match the target insertion cell, a rescaling operation is automatically performed (with a warning). Multiple nesting can be achieved by recurrence up to a maximum depth level of 10. A simple example of dereferentiation used to build a PWR FA poisoned with gadolinium is shown in Figure 3. As shown in the figure, reference assignment can only be used for the regions hosting other elements; in fact, the tiny water gap at the edge was not affected after the action of dereferencing because no reference was specified and needed therein.

Figure 3.
Construction of PWR assembly eighth by dereferentiation. (a) Grid layer with reference map. (b) Dereferenced output.
5. Examples of Typical and Advanced Use Cases
This section presents a few examples of ordinary and advanced geometries needed by lattice transport calculations. We include among the former the geometries of the different fuel assembly types chosen for a given core cycle, and complex configurations with the reflector for the latter.
All assembly geometries follow given patterns, especially in PWR, with a grid inserted into a framing box to take into account possible water gaps, like in Figure 3. Pin cells with fuel rods or guide tubes are inserted by reference assignment in the cells of the grid. BWR assemblies contain more details, but they can still be sketched by base patterns; a BWR FA from the OECD/NEA Benchmark ATRIUM-10 (10-9Q) [8] is illustrated in Figure 4a as an example. Only the minimal portion of the assembly is described in order to achieve faster calculations by exploiting the available symmetries through the use of proper boundary conditions. The fundamental fuel elements are the different types of fuel pins, which must be created beforehand. Both GUIs offer dialog boxes to define these elements, in addition to their scripting languages; see Figure 4b. The dialog boxes can be inspected at any time to access the variables’ names and values.
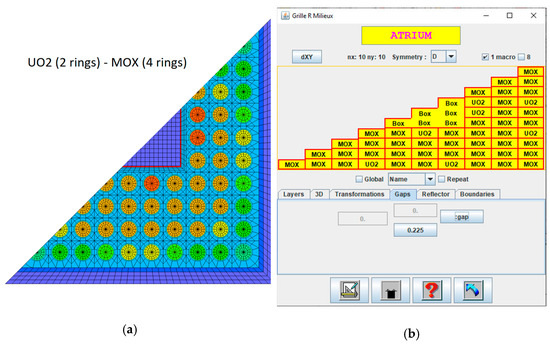
Figure 4.
ATRIUM-10 (10-9Q) BWR FA with diagonal symmetry by Silène. (a) Flux distribution color map. (b) Component dialog box.
The user usually draws three different meshes per assembly, that is one for the self-shielding calculation, one for the flux calculation (using self-shielded cross sections), and a coarsened one for the homogenization of reaction rates. The last smears the contour of the technological geometry by retrieving a simple grid of homogenized cells. Specific properties are applied to these cells with ALAMOS in order to enable the creation of the homogenization media by the coloriage mechanism of APOLLO3® when the geometry is processed at input. The homogenization step in APOLLO codes needs information about the volume correspondence between the starting and the output geometries, called EquiGeom in APOLLO’s nomenclature. GUIs calculate directly EquiGeom data with export to file on demand. Again, the file with EquiGeom data uses the APOLLO-specific text format.
The first two kinds of meshes depend on the solver used next, and mostly on the calculation scheme adopted to match the target accuracy in a maximum amount of runtime. An example with the three meshes follows in Figure 5 for a VVER FA (13AU type from the X2 benchmark problem [9]) that contains stiffener plates, and tubes extending out of the hexagonal grid. Self-shielding calculations performed by APOLLO codes often employ the fine-structured method, also known as the Livolant–Jeanpierre method, in combination with a CPM solver in space, which can treat from a few pin cells up to the entire portion of the assembly under calculation. The multi-cell approximation can be selected when the assembly is not too heterogeneous to achieve faster calculations. The corresponding mesh needs to be refined only in the regions containing resonant nuclides, i.e., the fuel, which means in practice adding concentric rings in the pellet area. After producing self-shielded cross sections, flux calculations follow by MOC solvers, where mesh refinement is necessary also in the non-fuel regions. The GUIs are capable of automatically applying the windmill scheme [10] to achieve higher accuracy in the pin corners, showing peaks of thermal flux in the moderator. Of course, the user can select other types of mesh refinement.
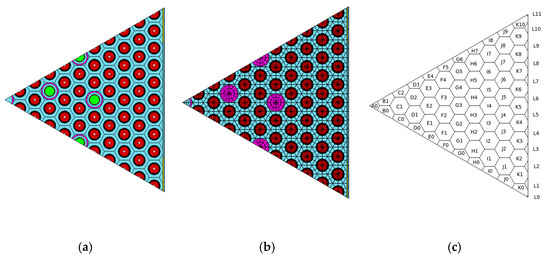
Figure 5.
Different calculation meshes drawn on a sector of VVER FA showing 60o rotational symmetry. (a) Self-shielding mesh with material color map. (b) Flux calculation mesh with temperature color map. (c) Homogenization grid with lexicographic naming scheme.
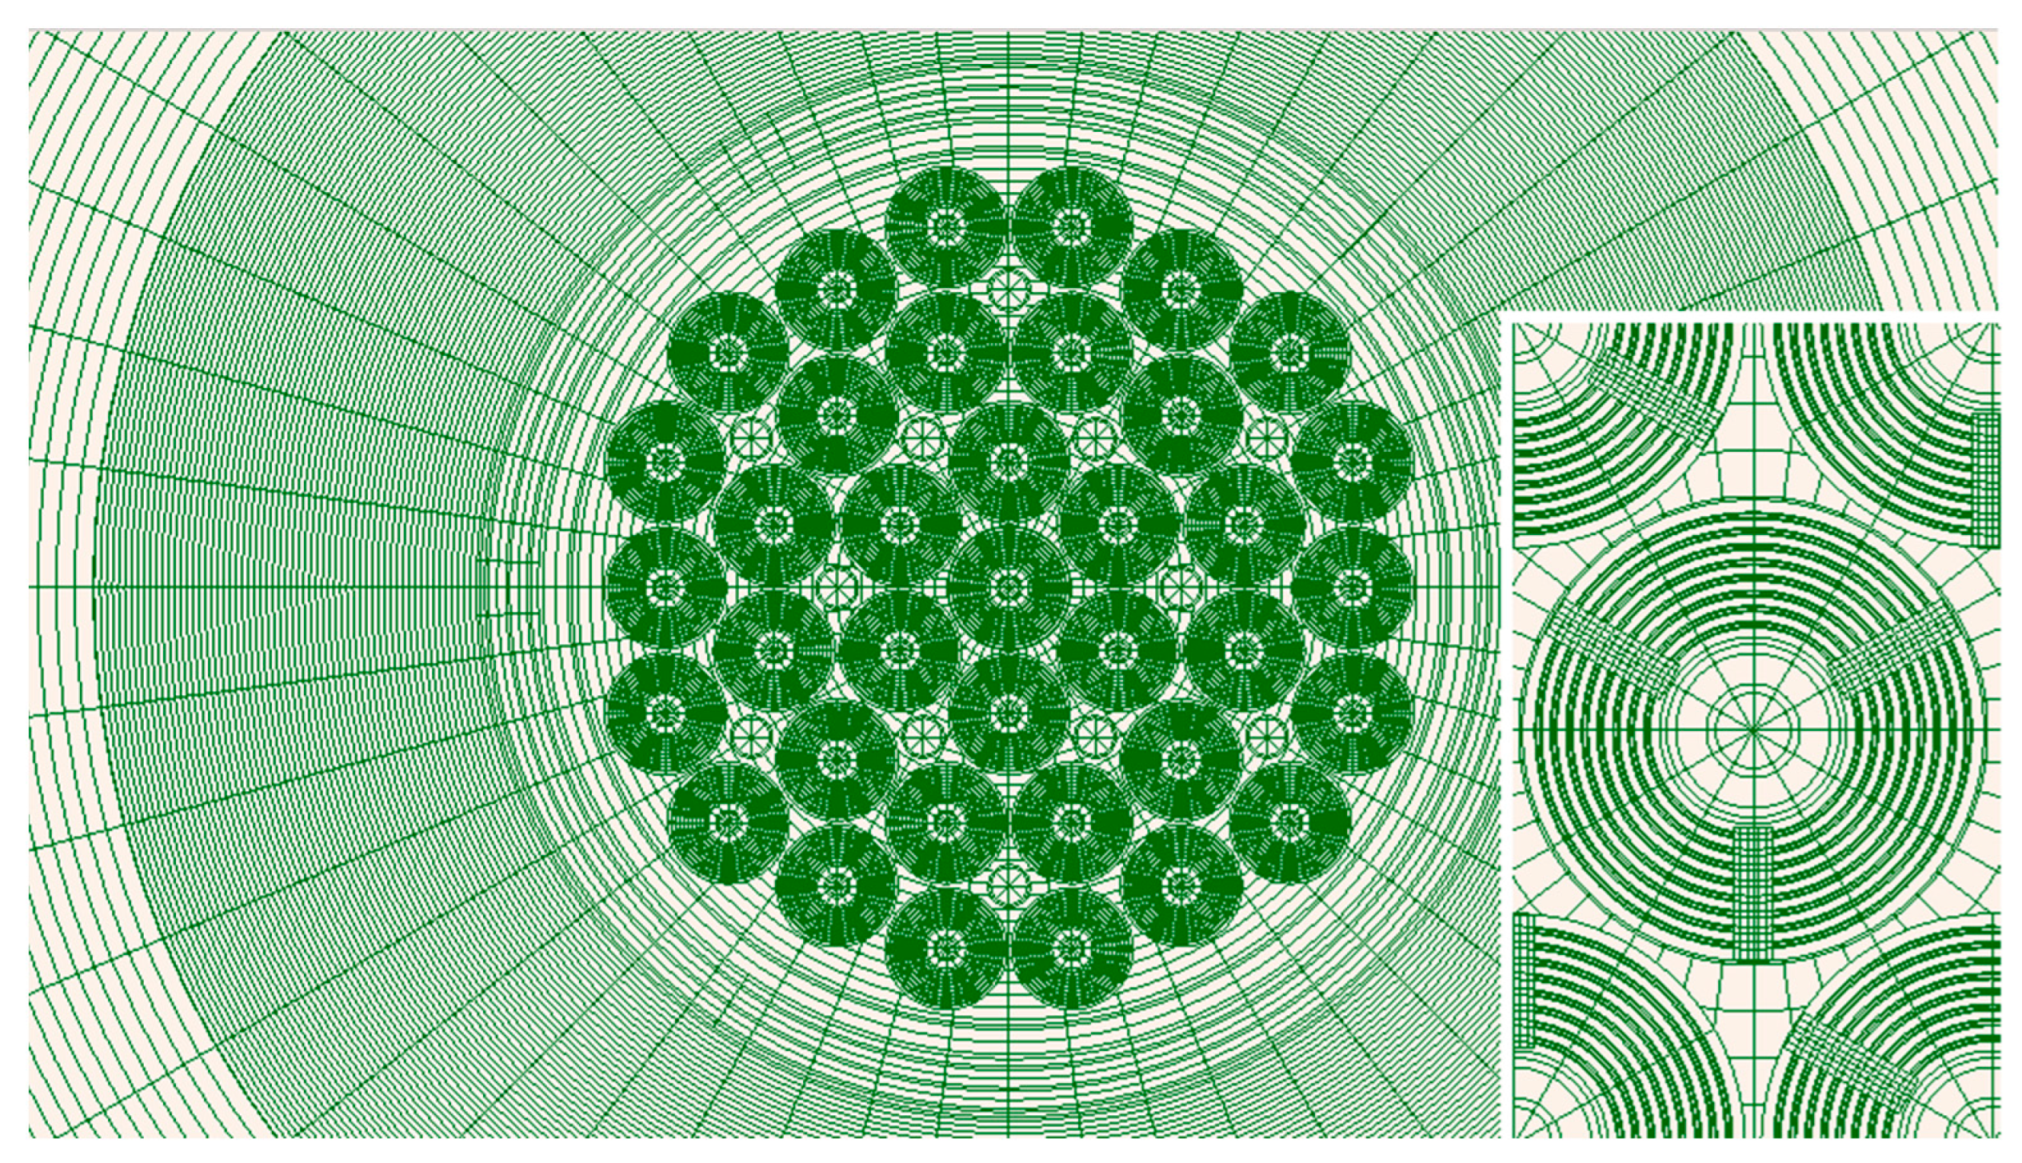
Many experimental facilities, such as material test reactors, show very complex geometry patterns that can be efficiently drawn by our GUIs, thanks to the many functionalities available for unstructured geometries. A radial cut of the Jules Horowitz Reactor (JHR) [11] produced by ALAMOS is illustrated in Figure 6, together with a particular detail of the unit cell, showing broad use of element overlap and automatic mesh recalculation by the method intersector2d.
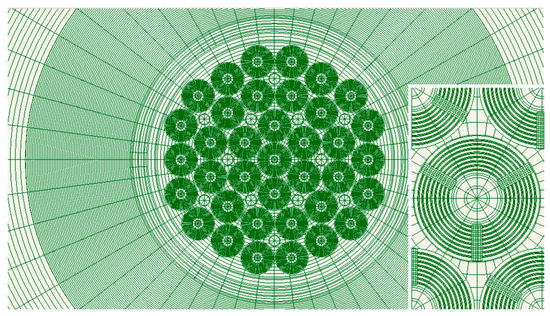
Figure 6.
Jules Horowitz Research Reactor radial cut and unit cell by ALAMOS.
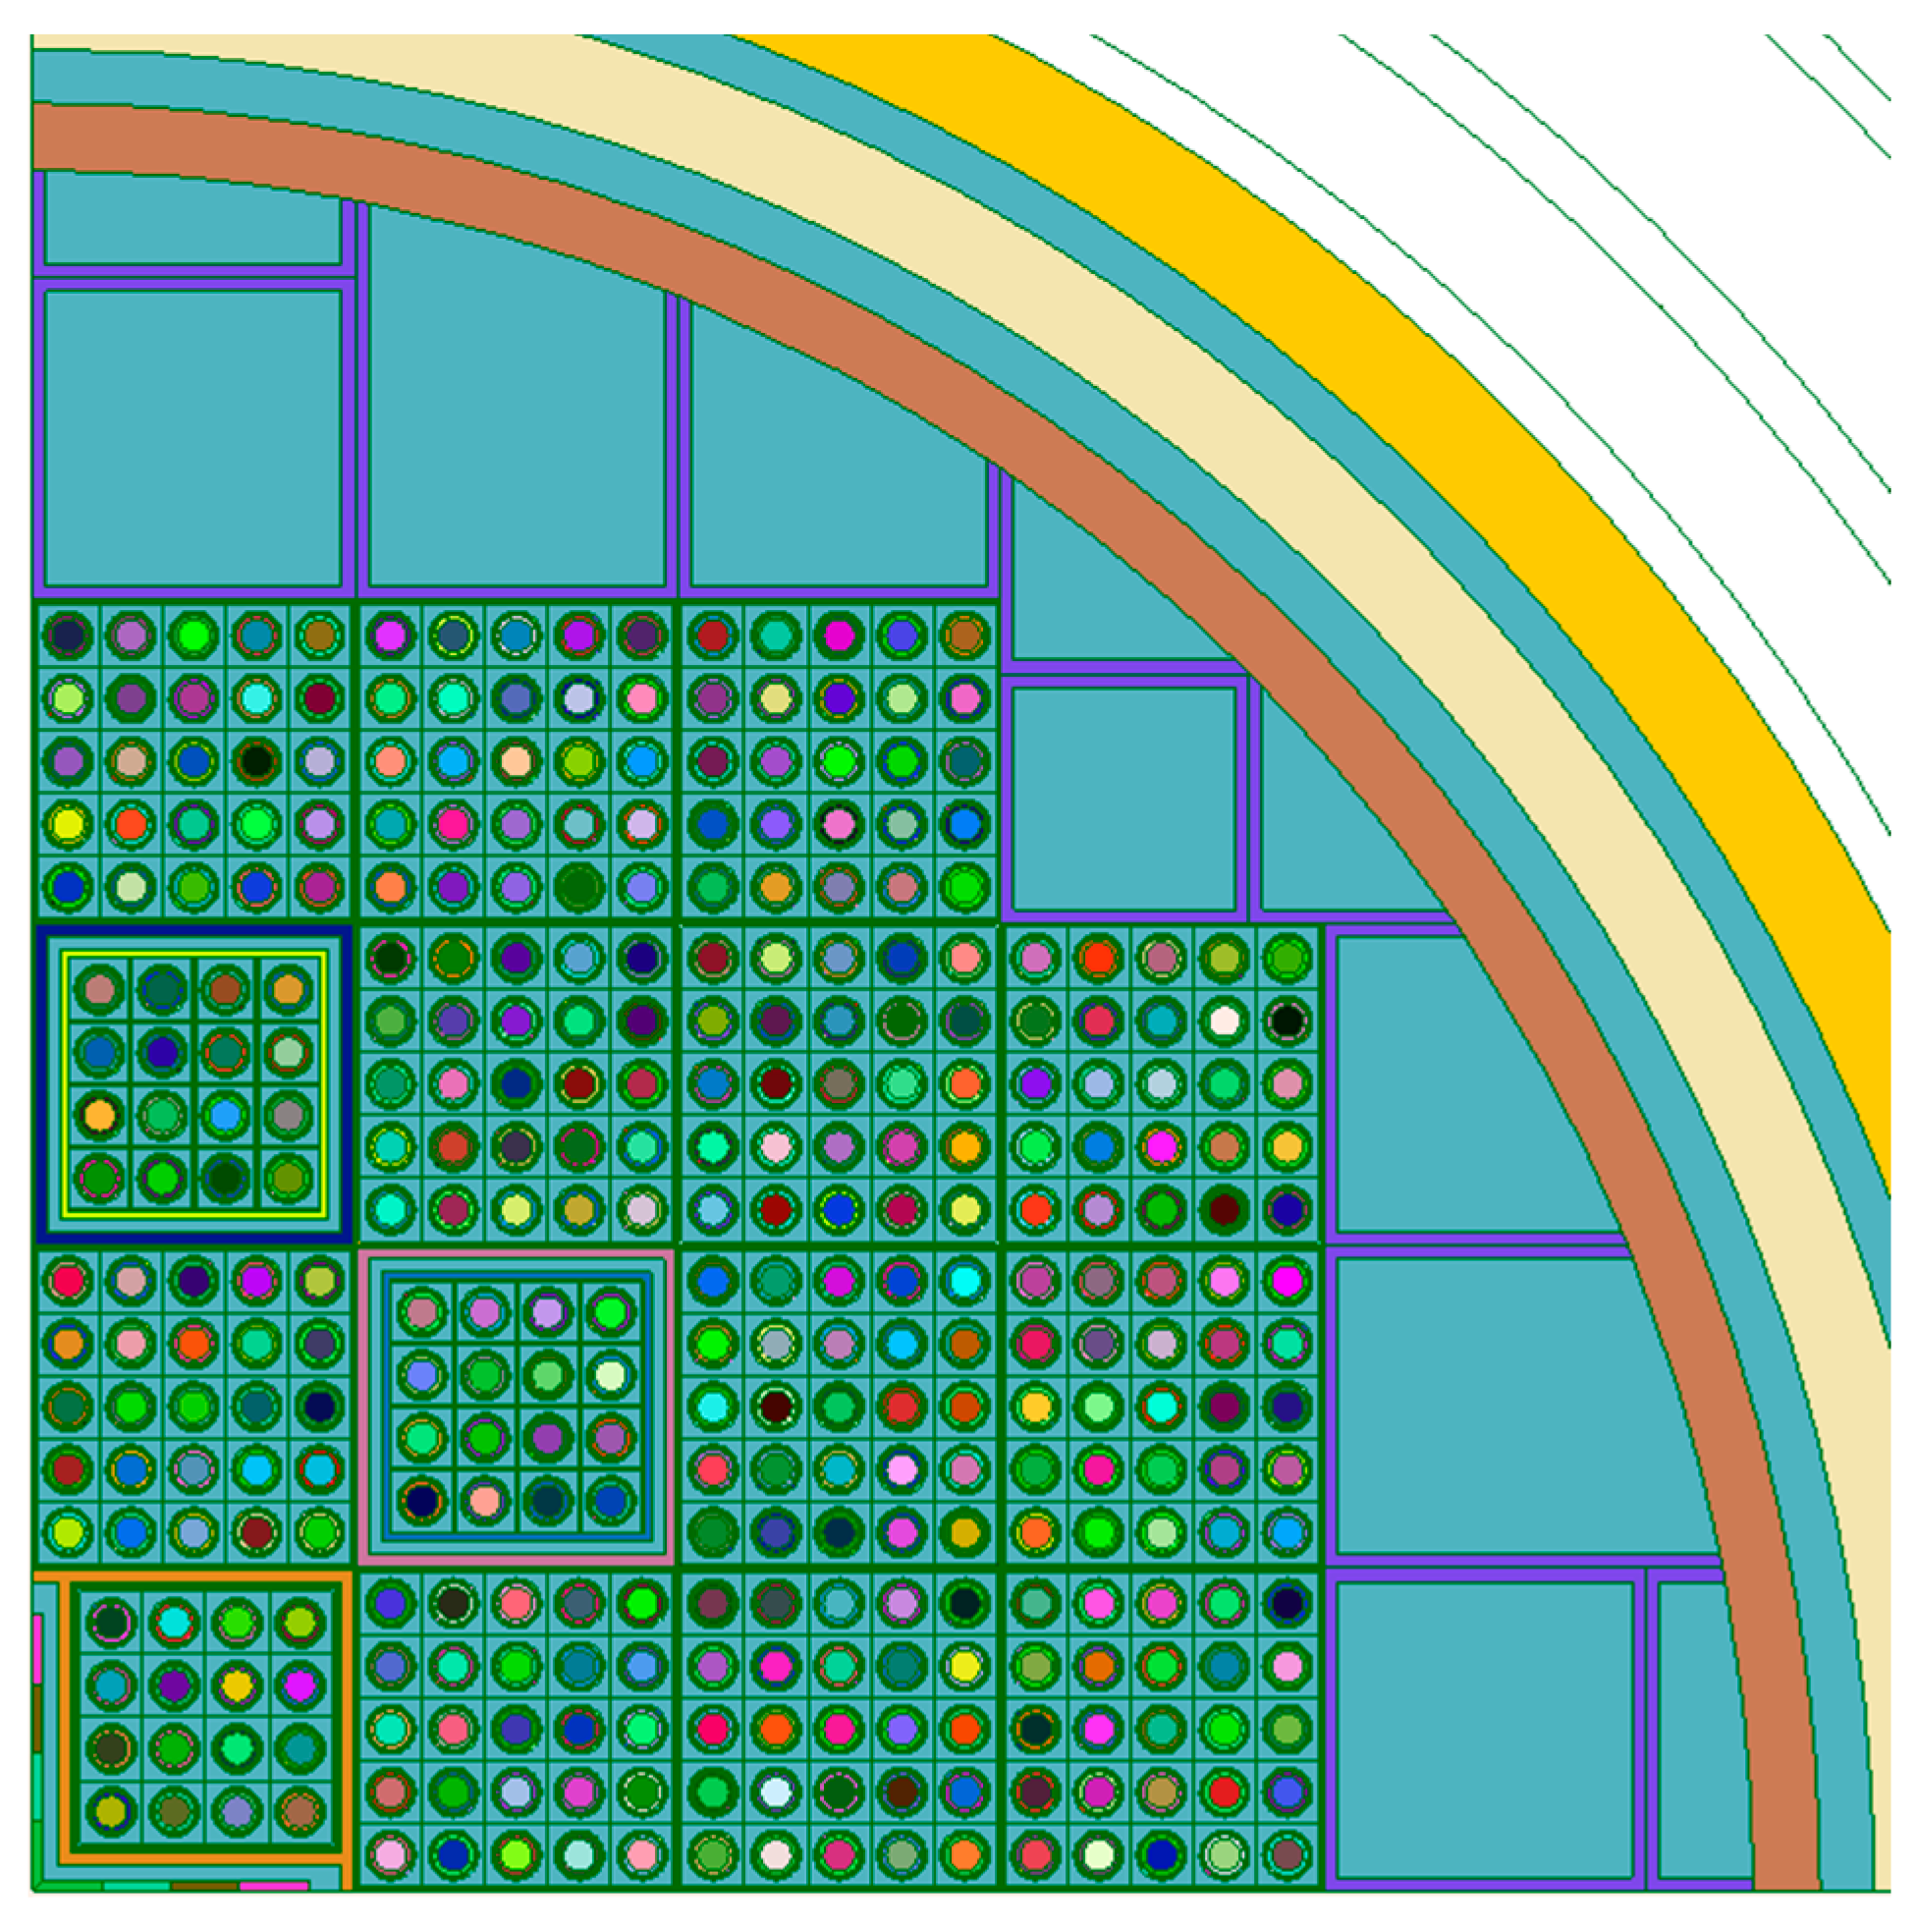
The core layout of the SPERT-III facility [12] is illustrated in Figure 7, with a colored map for the properties identifying the resonant nuclides used in the self-shielding calculations over the full north-east quadrant. Despite the fact that the fuel pins are all the same, different colors are automatically selected to request different self-shielded cross sections spatially. The central assembly is positioned with an offset with respect to the outside lattice because of the presence of the cruciform rod. The calculation domain can be limited only to the regions of interest as far as the domain remains of convex type. With reference to this figure, the regions in white are excluded from the calculation domain, thus using a rounded boundary that sets the outside to void (according to the input boundary conditions). This allows to perform faster calculations.

Figure 7.
North-east quadrant of the SPERT-III core by ALAMOS (self-shielding property map).
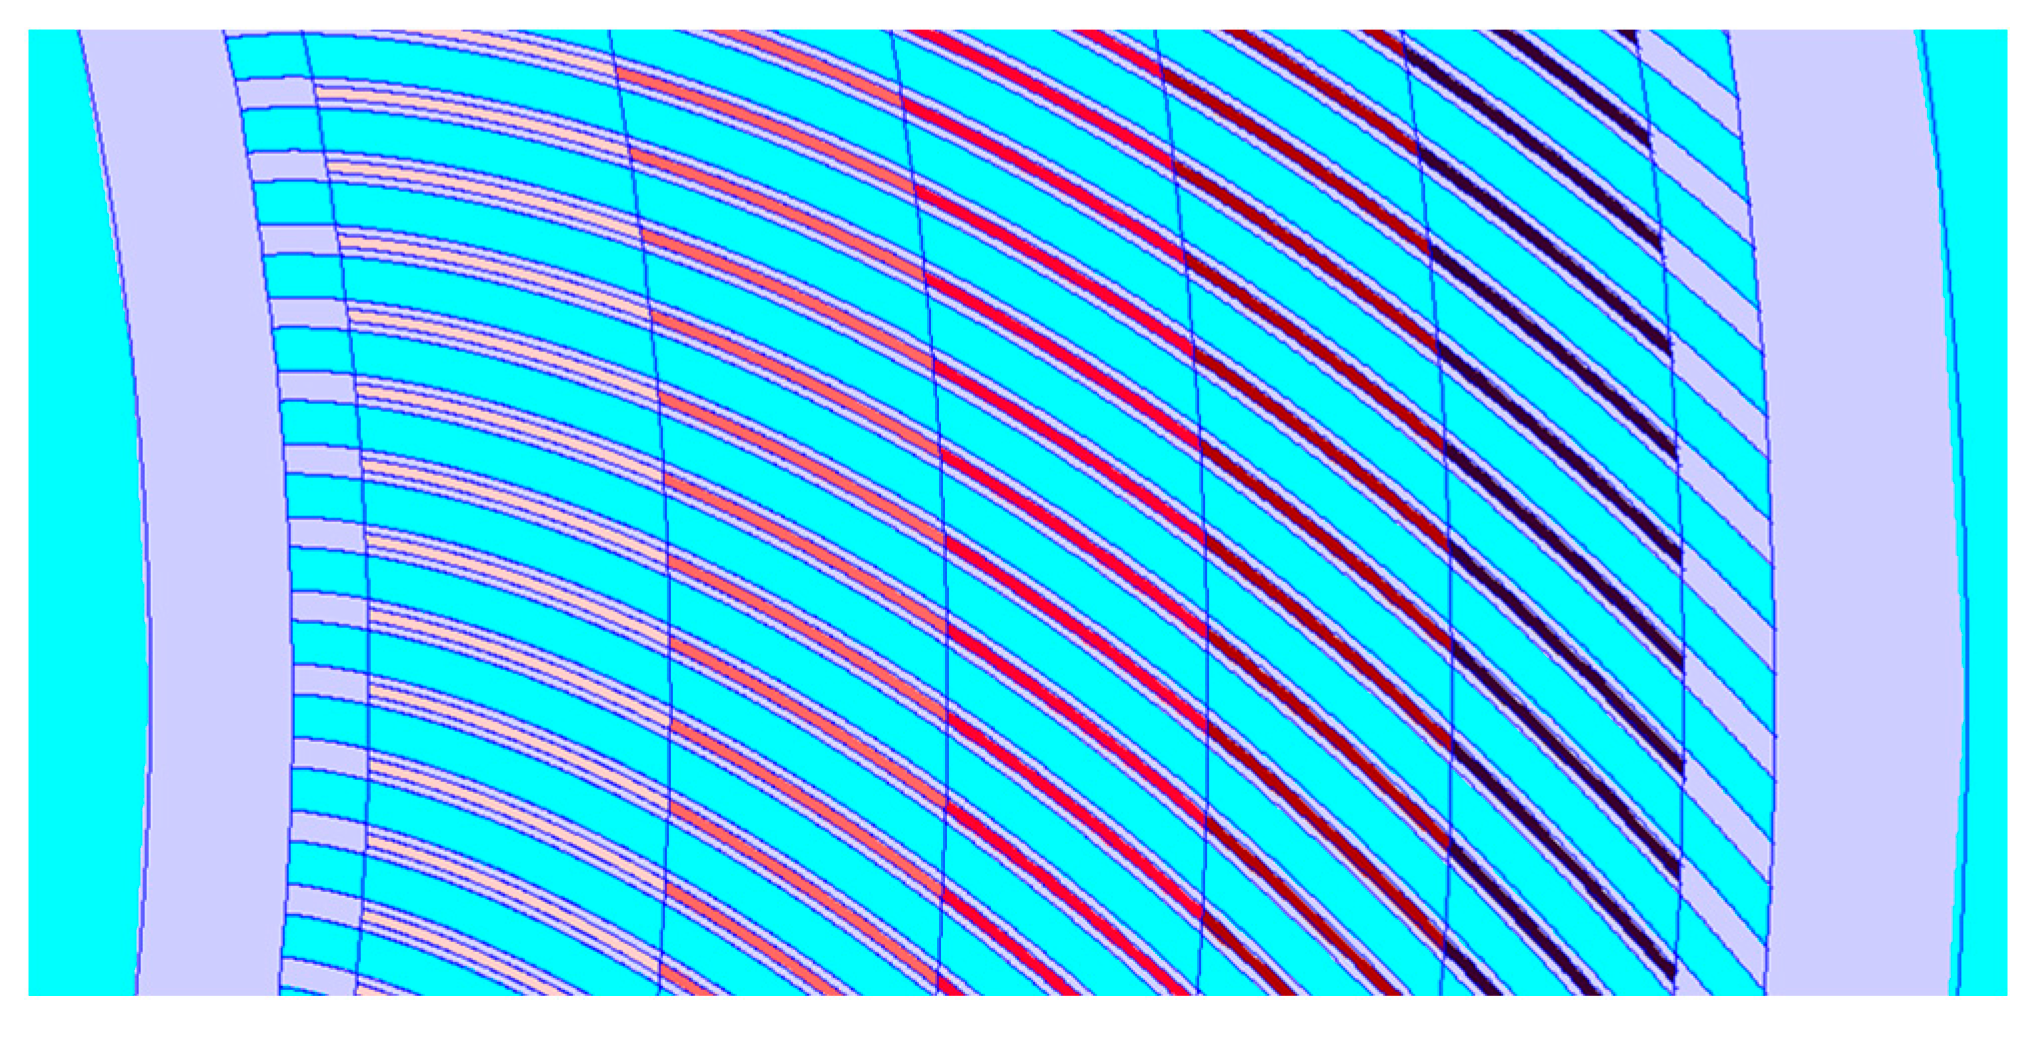
The high flux reactor (RHF) at the Institute Laue–Langevin (ILL) in Grenoble, France, contains fuel plates curved as circle involutes [13,14]. A model produced by Silène is available in Figure 8, showing a portion of the annular core hosting the UAlx fuel plates enclosed in aluminum cladding (gray). Heavy water (light blue) is used as the coolant, moderator and reflector. The plates are split in different zones marked by different colors to track spatial depletion in burnup calculations. The plates draw channels of constant thickness. The full core can be easily reproduced by rotating the same channel 280 times around the central axis. However, the channel itself is a thin and elongated component whose meshing for the calculations of the flux distribution requires specific attention.
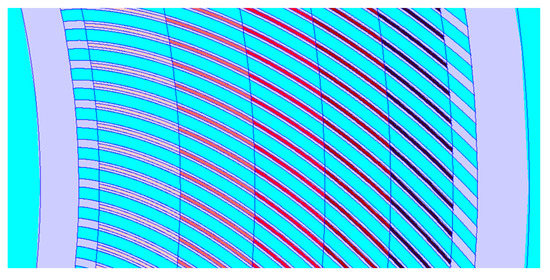
Figure 8.
Partial representation of the annular core section of the RHF reactor by Silène.
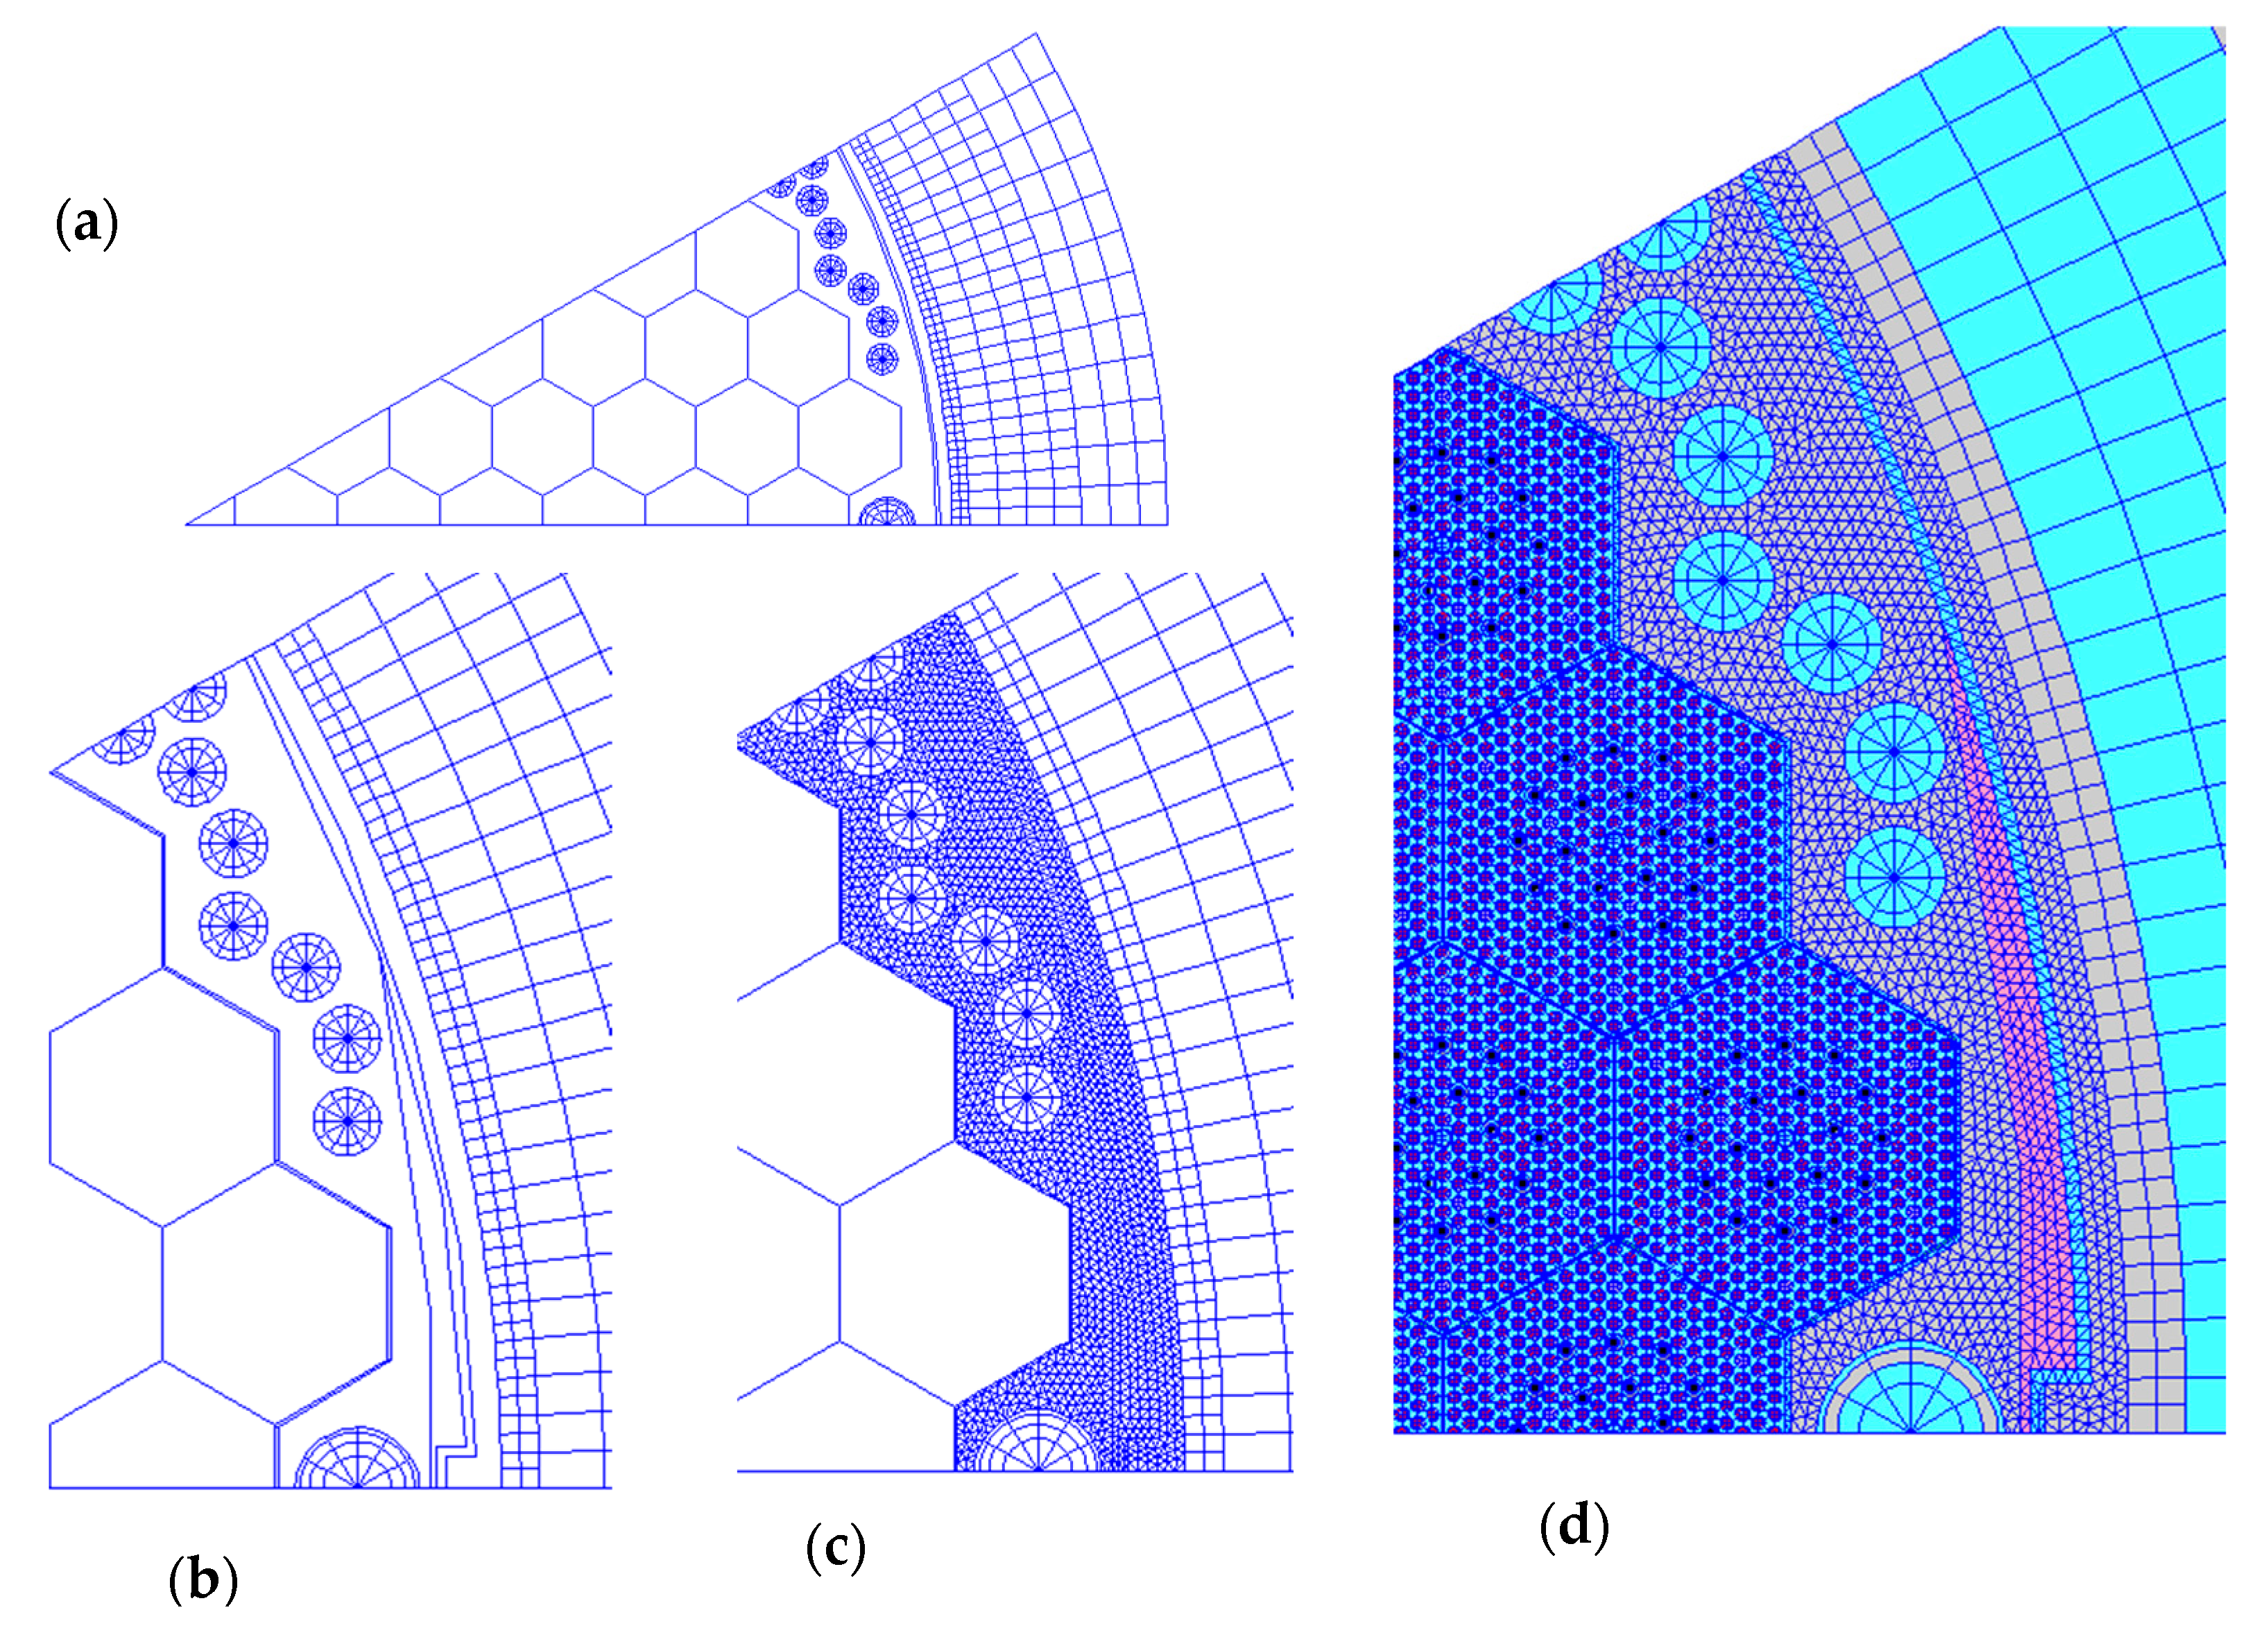
Both GUIs offer mesh generators based on triangles and quadrangles that are capable of treating any closed surface. Silène makes use of Mygale, a dedicated mesher originally developed at SERMA for the solvers MINOS/MINARET, now distributed with APOLLO3®, whose algorithm is based on Delaunay triangulation, while ALAMOS uses NETGEN2D (SALOME’s plugin) on the metacells. This functionality is particularly useful when creating reflector geometries. Figure 9 shows different snapshots of a core radial section (30°) with the heavy reflector as specified by the X2 VVER-1000 benchmark problem [9]. In order, the model is first built by components in (a), the basket and the water gap next to the reflector are added by APIs in (b), a triangle mesh is applied in the reflector region in (c), yielding (d) as the final result after the FA import. There are no approximations on the positioning of the holes in the reflector, used for instrumentation and cooling. Steps (a) and (b) are almost immediate, while mesh generation in (c) takes less than a minute on a medium-range laptop computer with Java virtual machine using 2GB of maximum memory allocation, without multi-threading. The import of the hexagonal assemblies in (d) takes about 30 s, for a total of 32,625 cells in the mesh.
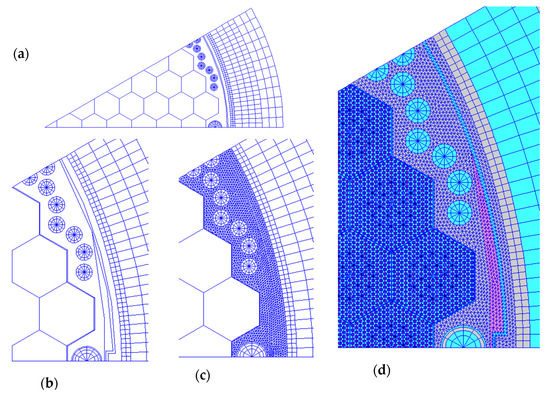
Figure 9.
X2 VVER-1000 heavy reflector model by Silène. The model is first built by components in (a), the basket and the water gap next to the reflector are added by APIs in (b), a triangle mesh is applied in the reflector region in (c), yielding (d) as the final result after the FA import.
6. Conclusions
SERMA has a long tradition in the R&D of mathematical methods and computer codes for lattice transport and reactor calculations. Two GUIs have been developed in the last thirty years to assist reactor engineers and physicists to build the geometries and the spatial meshes, and to assign the material property maps on the same geometries. Back in the 1990s, APOLLO2 was released with Silène, the first GUI entirely developed in Java by Zarko Stankovski, capable of generating all geometry models needed by MOC and CPM solvers. Silène has now achieved its final state of maturity and will not undergo any major upgrade.
With the advent of APOLLO3®, a new GUI working on the SALOME platform and offering a Python (v3) API was developed, taking advantage of the fast-growing Python programming language and of the FEM library MEDCoupling to manage unstructured geometry models. The considerable background and experience with many applications in research and industry gained by Silène provided a significant contribution to the development of ALAMOS. Specifically, the many functionalities offered by Silène were replaced by the methods available in MEDCoupling after careful rationalization and thorough classification, following the basic operations of set algebra, and above all enhanced intersector algorithms.
Both GUIs agree with the MVC software design patterns. The performance in the generation time and memory occupation of complex geometry models is a crucial requirement for the development of the GUIs. The user can reproduce all FA models typical of light water reactors, up to highly elaborate patterns with multiple fuel assemblies including standard and heavy reflectors. A radial plane of a power reactor core can count several millions of points after enhanced mesh refinement, with the total storage space in the order of gigabytes for the full core (about a few tens of radial planes). Users expect to generate their drawings quickly, say in minutes at the most. Three-dimensional models can be reproduced by extrusion showing multiple two-dimensional planes along the third axis.
In addition to geometry preparation, the setup of input material data with standard external libraries for lattice calculations is expected as a major future development. Despite the large variety of existing applications with different geometry models, new requests of support for novel and original geometries are still filed, confirming that after many years, GUIs for lattice transport computer codes remain popular and highly valued products for both research and industry.
Author Contributions
Conceptualization, D.T.; methodology, D.T., A.B. and Z.S.; software, F.B., A.B. and Z.S.; data curation, D.T., F.B. and Z.S.; writing—original draft preparation, D.T., A.B. and Z.S.; writing—review and editing, D.T. All authors have read and agreed to the published version of the manuscript.
Funding
This research received no external funding.
Institutional Review Board Statement
Not applicable.
Informed Consent Statement
Not applicable.
Data Availability Statement
Not applicable since no data needed for this article.
Acknowledgments
The authors are grateful to the many colleagues who contributed to the development of Silène and ALAMOS. ALAMOS developers thank the SALOME team, and especially Nabil Ghodbane for his prompt and kind support.
Conflicts of Interest
The authors declare no conflict of interest.
References
- Bell, G.I.; Glasstone, S. Nuclear Reactor Theory, Van Nostrand Reinhold Company; US Atomic Energy Commission: Washington, DC, USA, 1970.
- Sanchez, R.; Stankovski, Z. SILENE and TDT: A Code for Collision Probability Calculations in XY geometries. In Proceedings of the ANS Annual Meeting, San Diego, CA, USA, 20–24 June 1993. [Google Scholar]
- Sanchez, R.; Zmijarevic, I.; Coste-Delclaux, M.; Masiello, E.; Santandrea, S.; Martinolli, E.; Villate, L.; Schwartz, N. APOLLO2 year 2010. Nucl. Eng. Technol. 2010, 42, 474–499. [Google Scholar] [CrossRef] [Green Version]
- Brun, E.; Damian, F.; Diop, C.M.; Dumonteil, E.; Hugot, F.X.; Jouanne, C.; Lee, Y.K.; Malvagi, F.; Mazzolo, A.; Petit, O.; et al. TRIPOLI-4®, CEA, EDF and AREVA reference Monte Carlo code. Ann. Nucl. Energy 2015, 82, 151–160. [Google Scholar] [CrossRef]
- Schneider, D.; Dolci, F.; Gabriel, F.; Palau, J.-M.; Guillo, M.; Pothet, B. APOLLO3® CEA/DEN deterministic multi-purpose code for reactor physics analysis. In Proceedings of the International Conference PHYSOR2016 “Unifying Theory and Experiments in the 21st Century”, Sun-Valley, ID, USA, 1–5 May 2016. [Google Scholar]
- Stankovski, Z. “La Java de Silène” A GRAPHICAL USER INTERFACE FOR 3D PRE & POST PROCESSING: STATE-OF-THE-ART AND NEW DEVELOPPEMENTS. In Proceedings of the Joint International Conference on Mathematics and Computational Methods Applied to Nuclear Science and Engineering (M&C 2011), Rio de Janeiro, RJ, Brazil, 8–12 May 2011. [Google Scholar]
- Stankovski, Z. Implementation of component concept in SILENE 2D/3D pre-post processing GUI. In Proceedings of the International Topical Meeting on Mathematics & Computation and Supercomputing in Nuclear Applications (M&C + SNA 2007), Monterey, CA, USA, 15–19 April 2007. [Google Scholar]
- Organisation for Economic Co-operation and Development; Nuclear Energy Agency. Physics of Plutonium Fuels, BWR MOX Benchmark, Specification and Results; OECD/NEA Technical Report, Nuclear Science Committee; OECD/NEA: Paris, France, 2003; Volume 7. [Google Scholar]
- Bilodid, Y.; Fridman, E.; Lötsch, T. X2 VVER-1000 benchmark revision: Fresh HZP core state and the reference Monte Carlo solution. Ann. Nucl. Energy 2020, 144, 107558. [Google Scholar] [CrossRef]
- Santamarina, A.; Bernard, D.; Blaise, P.; Leconte, P.; Vaglio, C.; Vidal, J.-F. Recent advances in accurate neutronic calculation of GEN-3 LWR reactors. Ann. Nucl. Energy 2016, 87, 68–75. [Google Scholar] [CrossRef]
- Lebreton, M.; Politello, J.; Vidal, J.F.; Rimpault, G. A full reference APOLLO3® deterministic scheme for the JHR material testing reactor. In Proceedings of the EPJ Web of Conferences; EDP Sciences: Les Ulis, France, 2021; Volume 247, p. 06003. [Google Scholar]
- Zoia, A.; Brun, E. Reactor physics analysis of the SPERT III E-core with Tripoli-4®. Ann. Nucl. Energy 2016, 90, 71–82. [Google Scholar] [CrossRef] [Green Version]
- Bergeron, A.; Dionne, B.; Calzavara, Y. Neutronics Conversion Analyses of the Laue-Langevin Institute (ILL) High Flux Reactor (RHF). In Technical Report Nuclear Engineering Division ANL/GTRI/TM-14/15; Argonne National Lab (ANL): Argonne, IL, USA, 2014. [Google Scholar]
- Campioni, G.; Desbrière, B. HFR advanced computation’s models. In Proceedings of the Joint International Conference on the Physics of Reactors ‘Nuclear Power: A Sustainable Resource’, Casino-Kursaal Conference Center, Interlaken, Switzerland, 14–19 September 2008. [Google Scholar]


Publisher’s Note: MDPI stays neutral with regard to jurisdictional claims in published maps and institutional affiliations. |
© 2022 by the authors. Licensee MDPI, Basel, Switzerland. This article is an open access article distributed under the terms and conditions of the Creative Commons Attribution (CC BY) license (https://creativecommons.org/licenses/by/4.0/).