Abstract
In order to join efforts to develop high-fidelity multi-physics tools for research reactor analysis, the KIT is conducting studies to modify the coupled multi-physics codes developed for power reactors. The coupled system uses the Monte Carlo Serpent 2 code for neutron analysis and the Subchanflow code for thermo-hydraulic analysis. Serpent treats temperature dependence using the target motion sampling method and Subchanflow was previously extended and validated with experimental data for plate-type reactor analysis. This work present for the first time the steady-state and transient neutron and thermo-hydraulic analysis of an MTR core defined in the IAEA 10 MW benchmark using Serpent2/Subchanflow. Important global and local parameters for nominal steady-state conditions were obtained, e.g., the lowest and highest core plate/channel power/temperature, the radial and axial core power profile at the plate level, and the core coolant temperature distribution at the subchannel level. The capabilities of Serpent2/Subchanflow to perform transient analysis with on-the-fly motion of the control plates were tested, namely with fast and slow reactivity insertion. Based on the unique results obtained for the first time at the subchannel and plate level, it can be stated that the coupled Serpent2/Subchanflow code is a very promising tool for research reactor safety-related investigations.
1. Introduction
A large number of research reactors, among others of TRIGA and MTR design, are being operated all over the world for different purposes, such as training, medical application, the irradiation of different specimens, etc. For licensing and safety assessments of these reactors, mainly diffusion-based neutron and one-dimensional thermal-hydraulic simulation tools are used. In recent decades, several thermohydraulic studies for research reactors have been based on autonomous system/subchannel codes, which were adapted for this purpose in different ways, e.g., the use of equivalent plates and heuristic methods [1,2,3]. No research has focused on the high-fidelity simulation of the MTR core using Monte Carlo codes coupled with thermohydraulic subchannel codes.
It is worth mentioning that MTR reactors present some particular characteristics, such as: small cores of complicated geometry, downward and upward mass flow, specific correlations for rectangular channels, low operating pressure, high-density power, and low fuel and cladding temperature. As a result, the standardization of safety parameters to ensure proper operation and analysis is limited [4]. In general MTR cores are small compared with power reactor cores, in which each square fuel assembly consists of thin fuel plates assembled in parallel that construct narrow square sub-channels for coolant flow. The cores are surrounded by a radial reflector and the core and reflector region can have different irradiation devices.
Efforts have been made towards safety analysis in research reactors, such as the use of Technique for systems with limited data [5], the description of small cores with thermohydraulic codes of systems/subchannels coupled with neutron diffusion codes [6], and more recently, in 2016 and 2021, some authors started to study the application of Monte Carlo codes coupled with thermohydraulic codes to investigate individual MTR fuel assemblies or representative MTR channel geometries [4,7]. At KIT, investigations are underway to modify the high-fidelity multi-physics coupled codes, e.g., Serpent2/Subchanflow, developed for power reactors within the European H2020 McSAFE project [8], for safety evaluations of research reactors. It is worth mentioning that Subchanflow was previously extended, adapted and validated to describe the conduction and heat transfer of plate-type fuel assemblies, including downflow [9,10].
The updated coupled version Serpent2/Subchanflow, like its predecessor versions, makes use of the simple fixed-point iteration known as the Picard method for the iteration between the N-TH [8,11,12]. In addition, the relaxation of the exchanged TH fields is usually applied to improve the stability of the convergence; as a result, it is capable of static, depletion and transient simulations [13]. In this paper, we describe for the first time the thermal–hydraulic and neutron physics analysis (static and transient) of an MTR core defined in the framework of the IAEA 10 MW benchmark in [14] and [15] using the extended dynamic version of Serpent2/Subchanflow.
This work is composed of five chapters. The second chapter describes the benchmark problem including all the geometrical specifications and initial operating conditions of the IAEA-10 MW benchmark, including the core specifications for the static and transient calculations. Section 3 deals with the computational tools used for thermo-hydraulic and neutronic core analysis, presents the neutronic and thermo-hydraulic models developed at the plate and subchannel level for the MTR core, and gives the specifications of the static and transient simulations, including the convergence criteria and simulation environment. Section 4 discusses selected results obtained for the steady-state simulations with the coupled Serpent2/Subchanflow code at the nominal core, as well as the main results of the fast and slow reactivity insertion scenarios.
Finally, a summary and outlook are given in Section 5.
2. Benchmark Problem
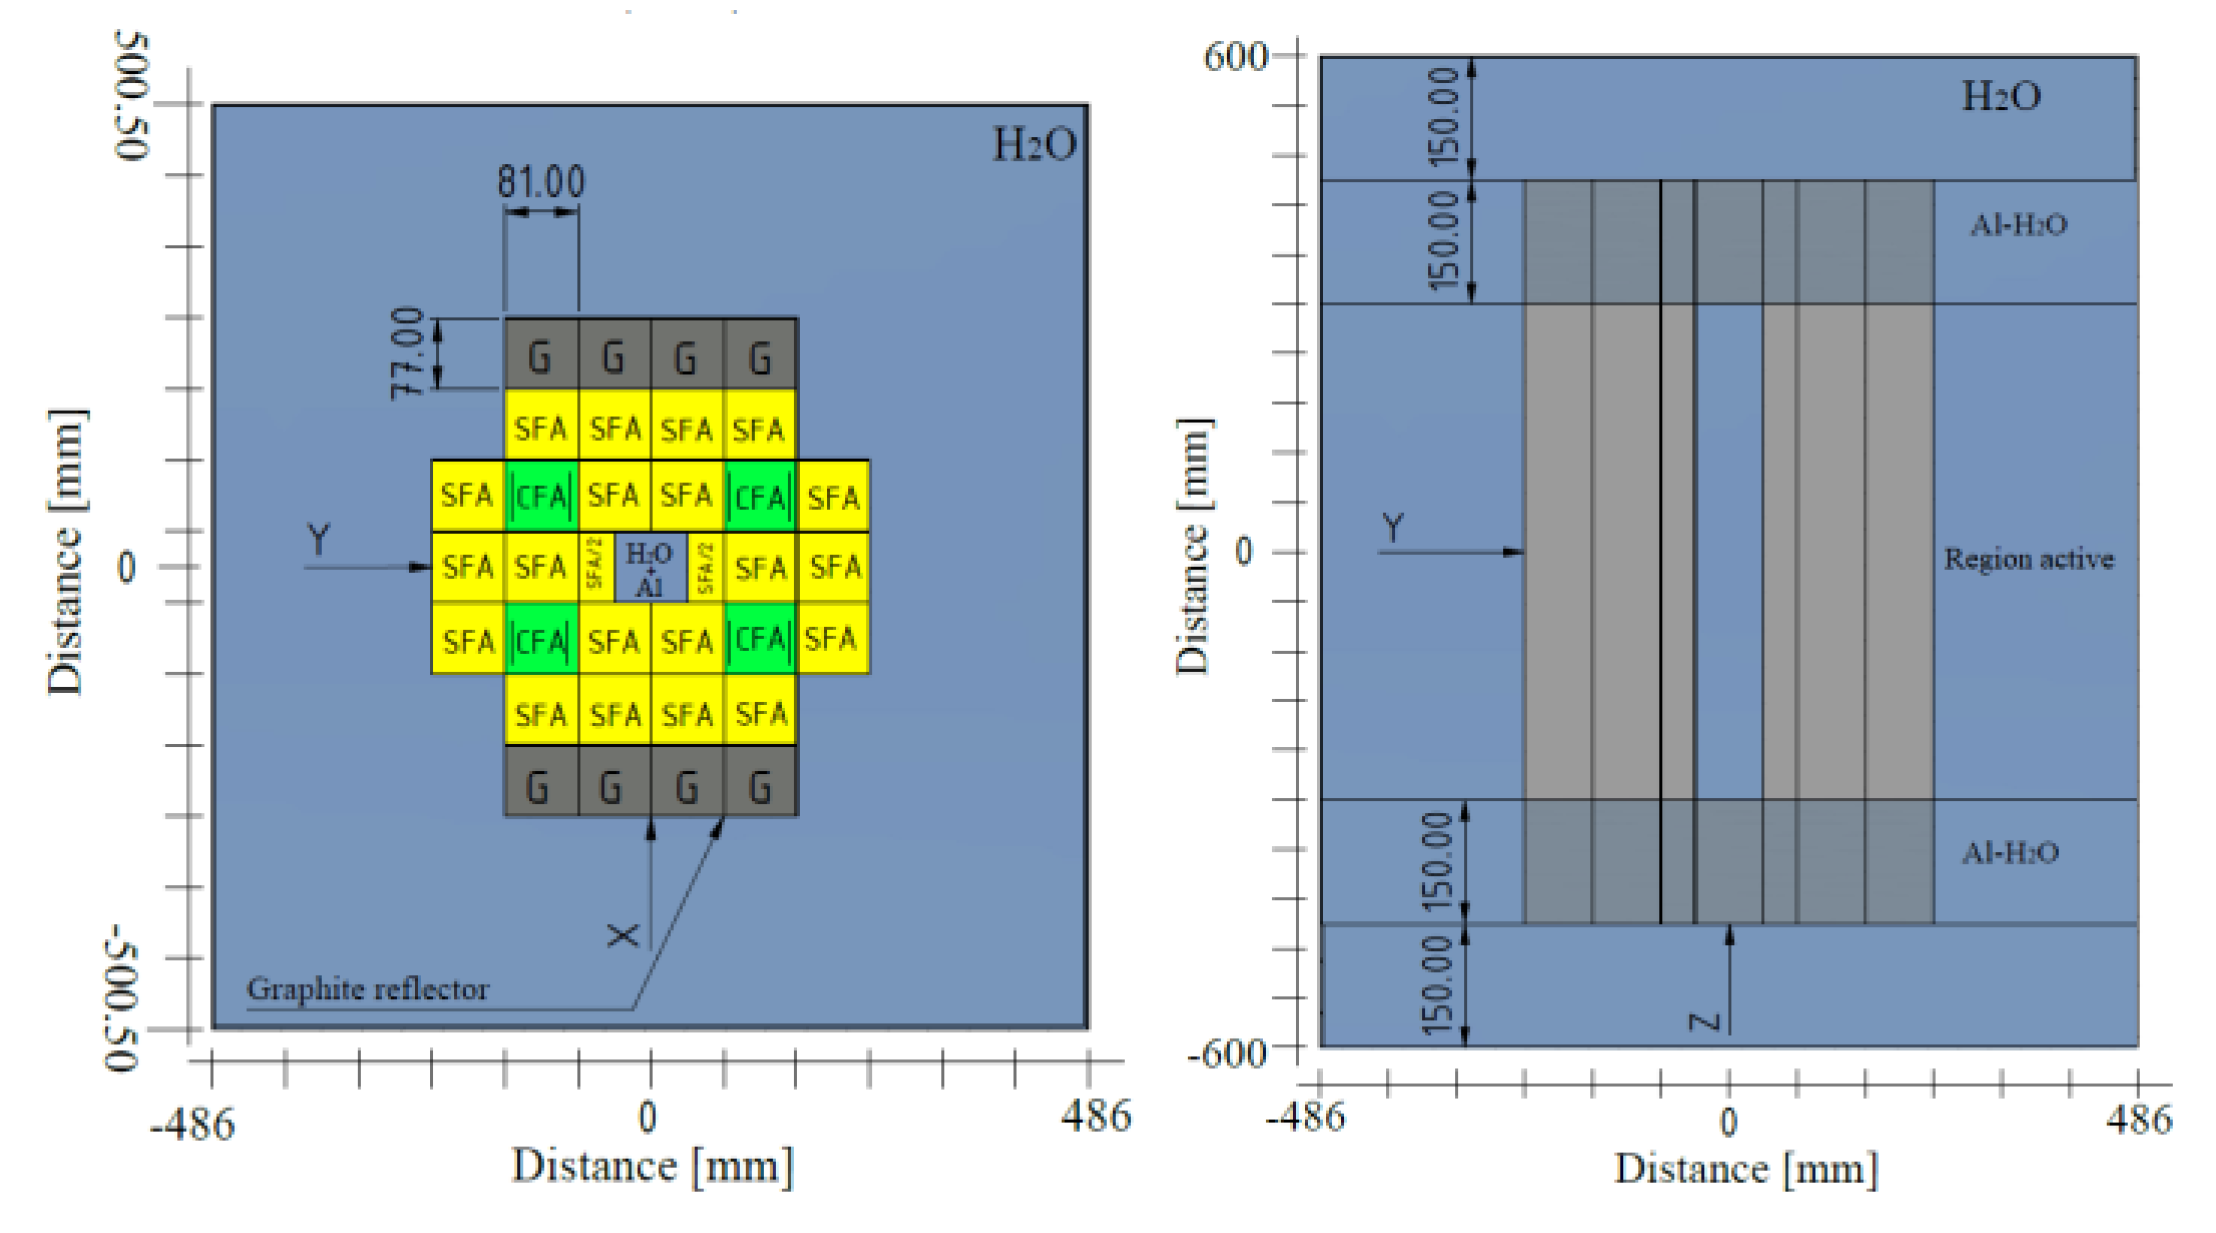
The reactor data and the transient scenarios used for these investigations are provided and defined in the IAEA-10 MW benchmark [14,15]. The IAEA-10 MW Highly Enriched Uranium core consists of a 5 × 6 grid core containing 21 Standard Fuel Assemblies (SFAs) and 4 Control Fuel Assemblies (CFAs). It is radially reflected by graphite on two opposite sides and surrounded by light water, as shown in Figure 1. In addition, according to recommendations [15] (p. 15), a 77 mm × 81 mm aluminum block containing a 50 mm water-filled square hole on each side should be considered in the analysis.
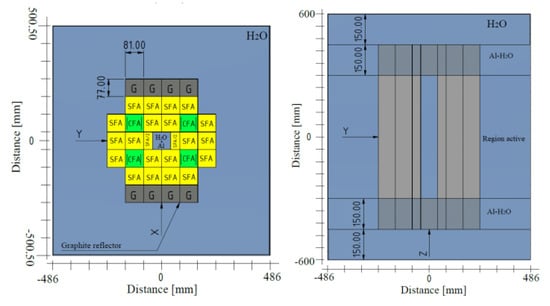
Figure 1.
Radial (left) and axial (right) cuts of the MTR core.
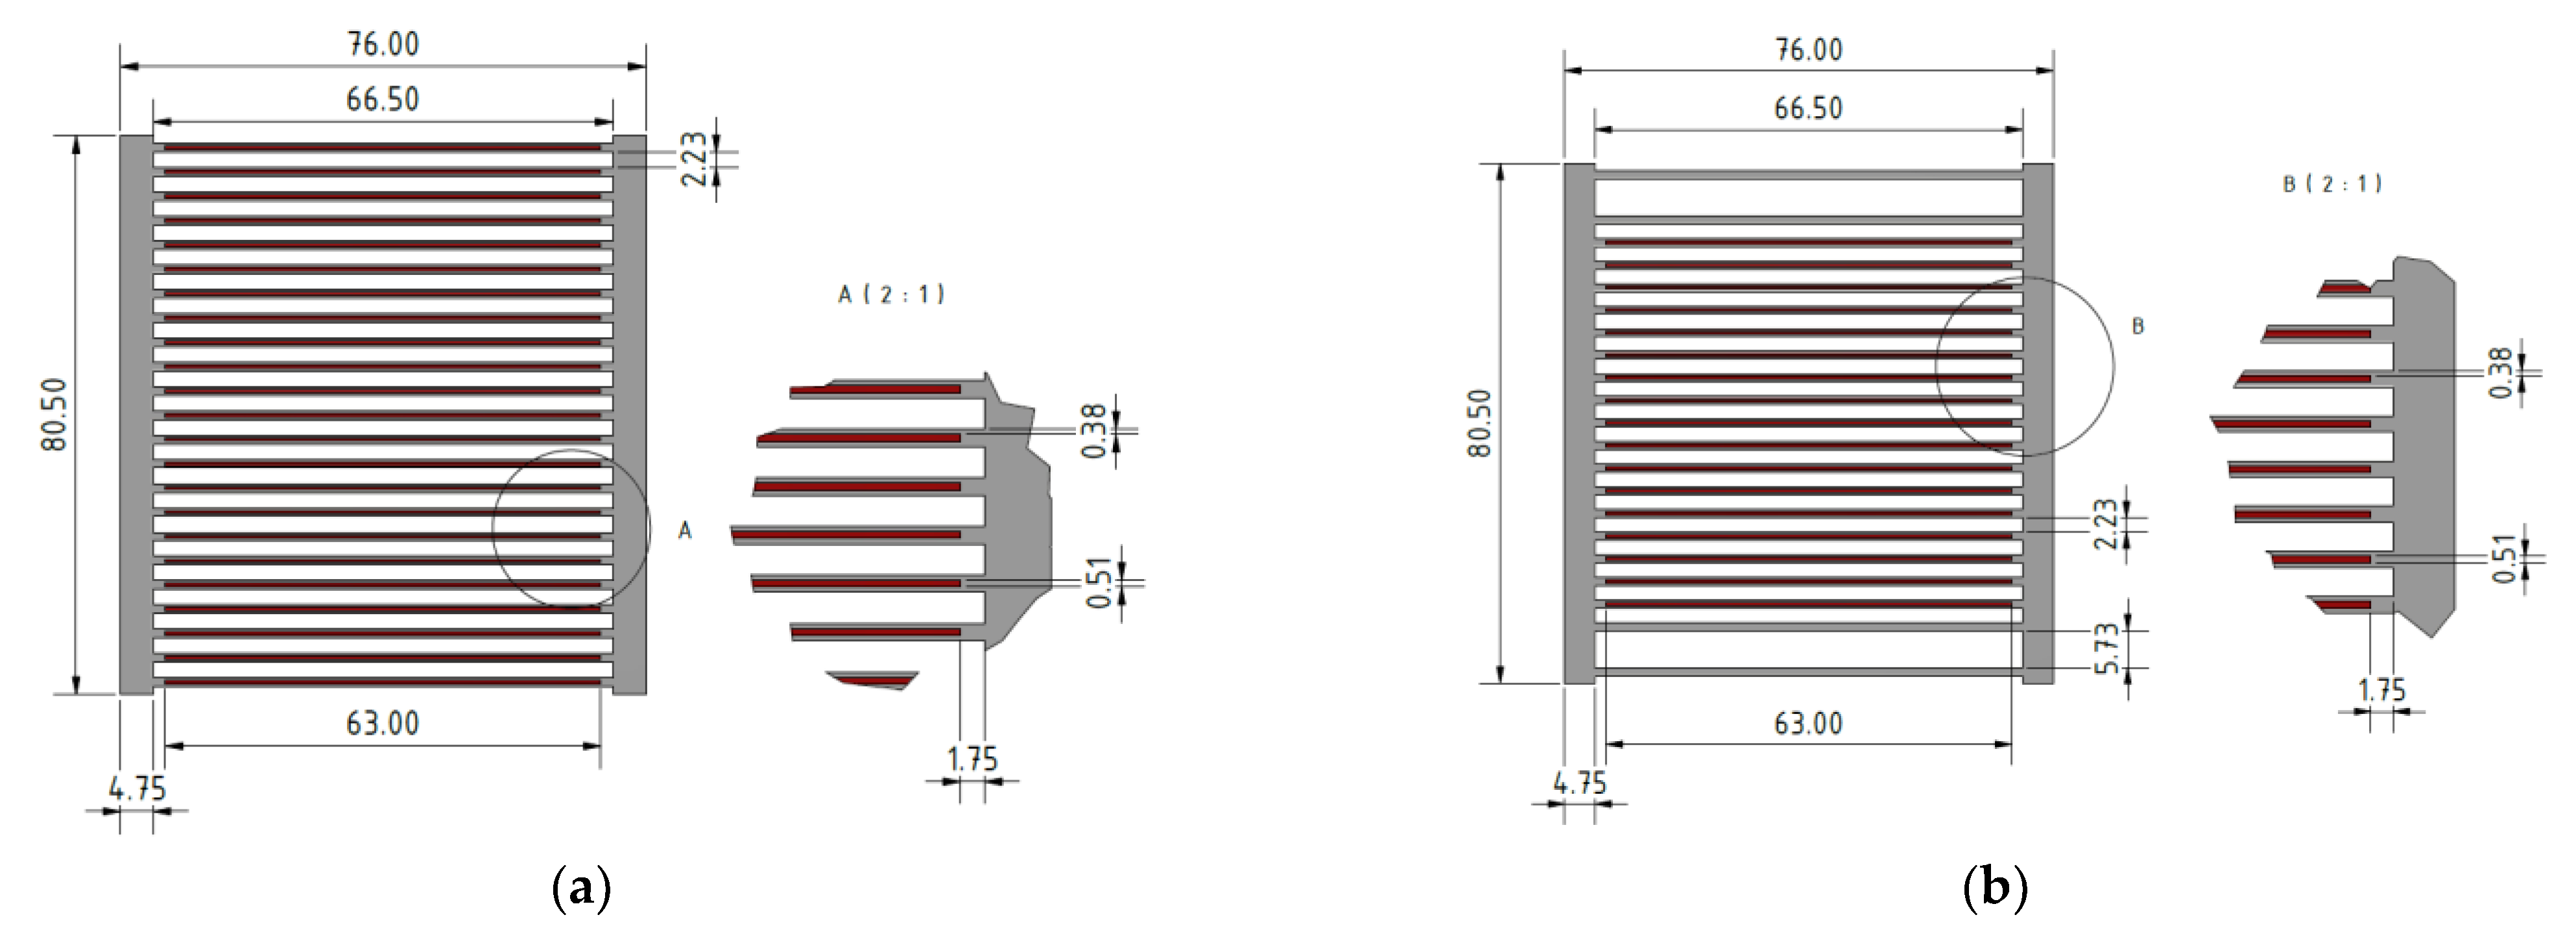
The SFA has 23 plates and the CFA has 17 plates. At the end of the CFA, there is a special region of 5.73 mm where the absorber material (may be B4C, AgInCd, or Hf) is housed. Each CFA contains two absorber blades, with a total of eight blades in the whole core. In Figure 2, the AgInCd absorber blades are shown. To maintain the core symmetry, each half fuel assembly (SFA/2) in the center of the core has 12 plates.

Figure 2.
Dimensions in mm of: (a) Standard Fuel Assembly, 23 plates; (b) Control Fuel Assembly, 17 plates.
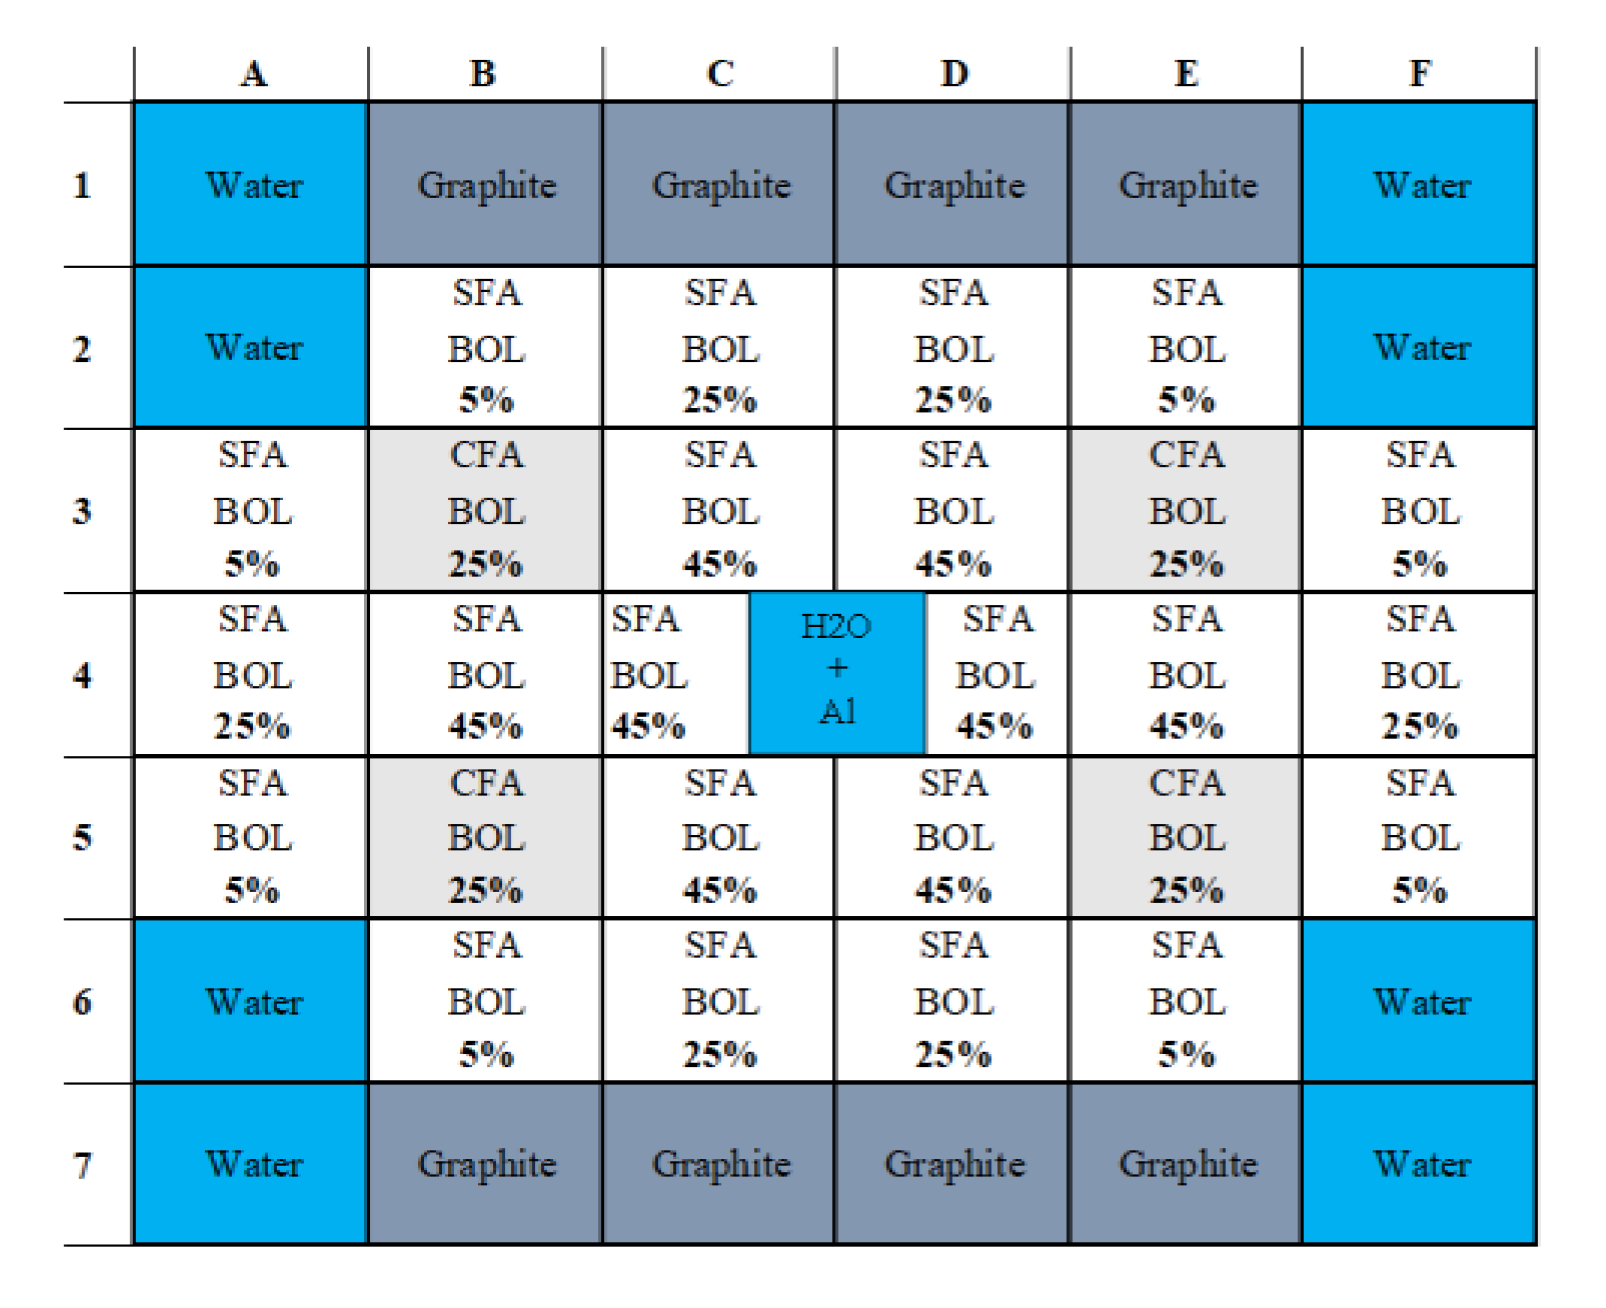
The dimensions of the absorber blades are shown in Figure 3 and were taken from [15] (p. 17) and [16]. The core configuration for Beginning of Life (BOL) is shown in Figure 4 and the atomic density of HEU is taken from [17].
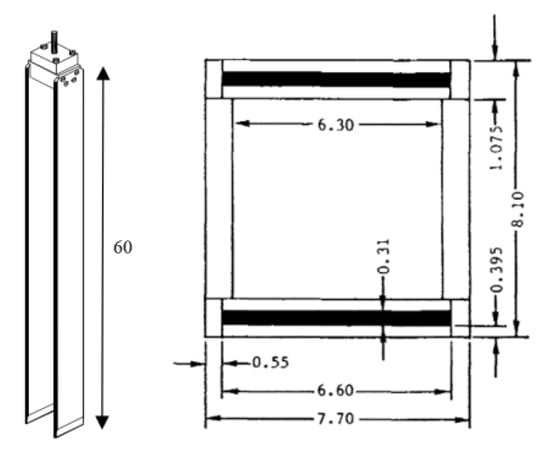
Figure 3.
Absorber blade elements, dimensions in cm.

Figure 4.
MTR core configuration for Beginning of Life (BOL) as a function of U depletion.
2.1. Steady-State Core Specifications
Table 1 contains all the information required for the creation of a thermo-hydraulic Subchanflow model. The values shown there will be used for the steady-state simulation at nominal power, i.e., 10 MW.

Table 1.
Key thermal–hydraulic parameters of the e IAEA MTR benchmark.
2.2. Transient Core Specifications
The benchmark problem presented in [15] consists of two different types of accidents: reactivity-initiated accident (RIA) and loss-of-flow accident (LOFA). In this work, only the two RIA scenarios are examined, namely the fast and slow reactivity insertion. Table 2 shows the main characteristics.
Table 2.
Transient characteristics for IAEA MTR benchmark.
3. Methodology
This section summarizes the calculation tools, methods, model and assumptions that are utilized in this work. It includes a short description of the extended Subchanflow code and Serpent Monte Carlo code.
3.1. The Neutronic Code Serpent 2
The Serpent 2 is a Monte Carlo code developed by VTT, Finland. It is a multi-purpose 3D continuous-energy Monte Carlo code that uses the standard ACE format Nuclear Data Libraries (NDL) to perform static and dynamic 3D core calculations [18].
The multi-physics interface (IFC) is designed for the coupling of Serpent 2 to external, e.g., thermal–hydraulic solvers [19,20]. The interface allows the exchange of thermo-hydraulic parameters, e.g., density and/or temperature of the coolant and the temperature of the fuel and cladding between the thermal–hydraulic solver (e.g., Subchanflow) and Serpent 2. Therefore, a definition of a mesh that superimposes the thermo-hydraulic fields with the geometrical Serpent 2 model is needed [21]. In the present work, the IFC type 22 was used. The effect of the coolant density and fuel temperature on the neutron multiplication are handled in Serpent 2 through the rejection sampling techniques combined with target motion sampling (TMS) [22,23].
3.2. The Thermal–Hydraulic Code Subchanflow
Subchanflow was developed at the Karlsruhe Institute of Technology (KIT) for the thermal–hydraulic analysis of BWR, PWR, VVER, LWR reactors [24]. The analysis of Material Testing Reactor (MTR) was first introduced in [10]. The validation of Subchanflow for MTR cores was presented at the European Research Reactor Conference RRFM 2020 [9].
Subchanflow solves three mixture conservation equations for upward and downward flow of water/steam mixtures in subchannels. The needed steam/water properties are calculated based on the IAPWS-97 formulation. The exchange of mass and momentum between the neighbor subchannels is described by an addition conservation equation for cross-flow. The heat conduction in rod and plates is solved with the standard finite volume method. The relevant heat transfer coefficient between fuel and coolant is determined by empirical correlations for power reactors and narrow square channels of MTR fuel. Additional constitutive equations are also implemented in the code to mathematically close conservation equations, e.g., to predict the void fraction, wall friction, turbulent mixing, etc. The code is validated for LWR and MTR cores using relevant experimental data.
3.3. Coupled Neutronic/Thermal–Hydraulic Calculation Scheme Based on Serprnt 2/Subchanflow
The master–slave internal coupling of Serpent v2.1.3.1 (Master) and Subchanflow v3.7 (Slave) has been used for the neutronic and thermal–hydraulic analysis of the IAEA-10 MW core. The version of Subchanflow used by [8] was extended with models relevant for MTR cores as described in [9,10]. The updated coupled Serpent2/Subchanflow version makes use of the simple fixed-point iteration known as the Picard method for the iteration between the N-TH [8,11,12]. Pure neutron transport simulations are considered in this work. Constant energy deposition per fission mode Serpent default is used and to handle the fuel temperature, a Doppler-weighted average is selected [25]. In addition, relaxation of the exchanged TH fields is usually applied to improve the stability of the convergence; as a result it is capable of static, depletion and transient simulations [13]. The coolant and structures such as fuel plate claddings are not heated directly. To handle material temperatures, Serpent includes on-the-fly temperature processing, called the TMS (target motion sampling) routine, which addresses Doppler resonance broadening by considering the thermal motion of the target cores explicitly.
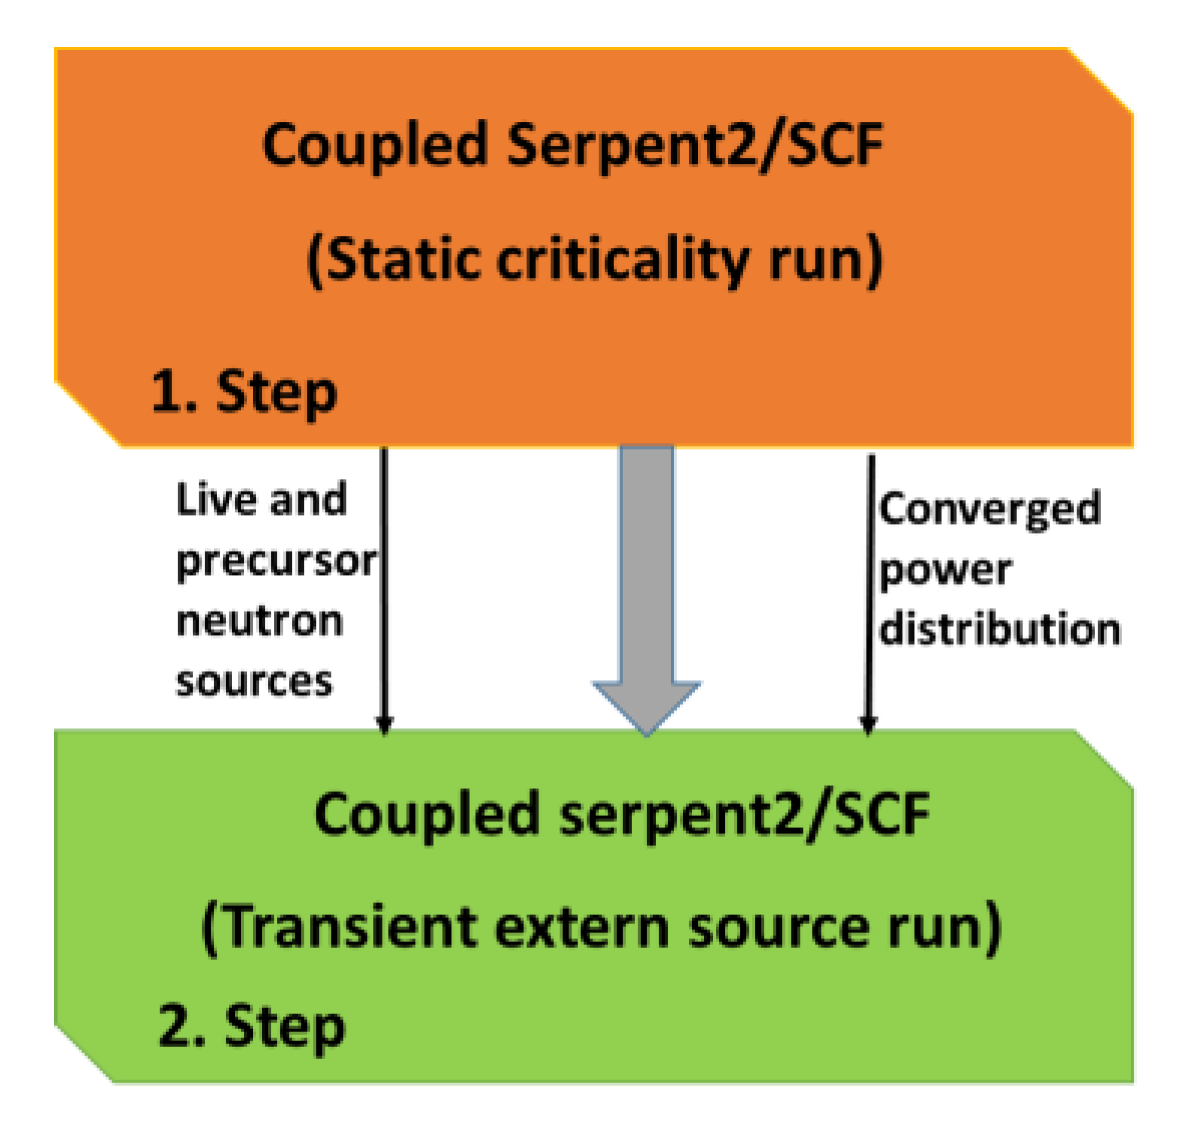
The transient calculations scheme using Serpent2/Subchanflow is based on a two-step approach, as shown in Figure 5. First, a coupled static criticality calculation must be carried out to obtain two external sources: one with neutrons travelling with position, direction and energy identified as live neutrons, and another one with the precursor population that will generate the delayed neutrons [26].

Figure 5.
Transient two-step approach for coupling calculations.
During the first step, the distributions of live and precursor neutrons are recorded in specific files (Serpent 2 dump files).
After step one, the transient external source calculations start using the initial live neutron and delayed neutron precursor distributions previously stored in the dump files. According to the coupling approach, an initial SCF run is performed using the converged power profiles predicted by Serpent 2 during the static coupled calculation of step 1.
The IFC is updated for each time interval, Serpent 2 internally stores the temperatures and densities predicted, and finally a linear interpolation between the beginning of the time interval and the end of the time interval is performed to obtain the actual values, e.g., temperature and density at the interaction moment [27].
3.4. Serpent Models and Assumptions
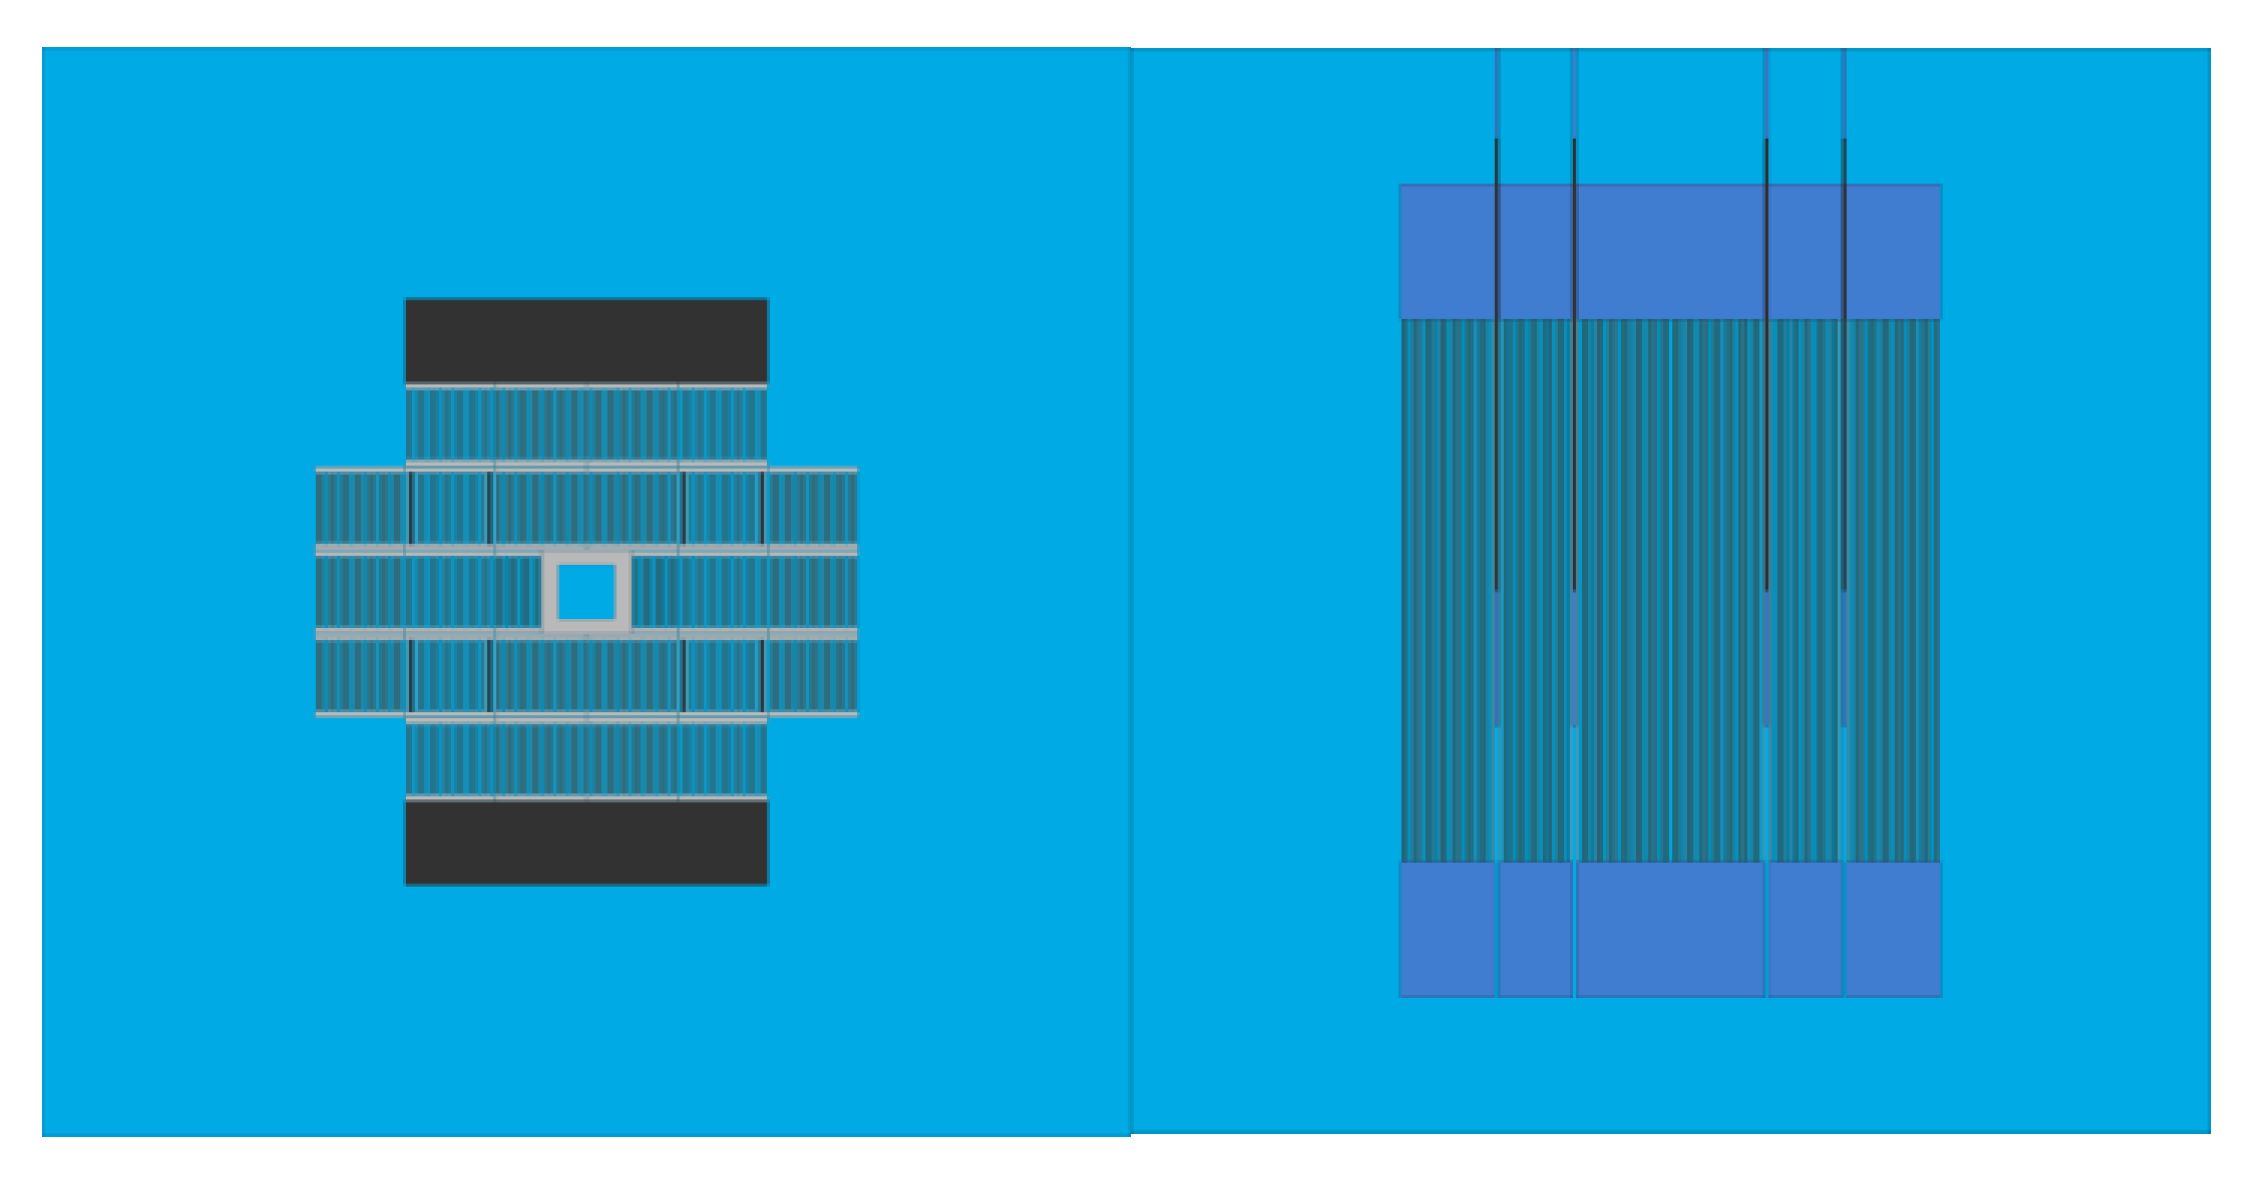
A very detailed Serpent core model is developed, as shown in Figure 6. There, the radial (left) and axial core discretization is shown, where each plate is represented separately according to the MTR core specifications [14,15]. For the neutronic calculations, the following aspects are considered for the static coupled N/TH simulation:
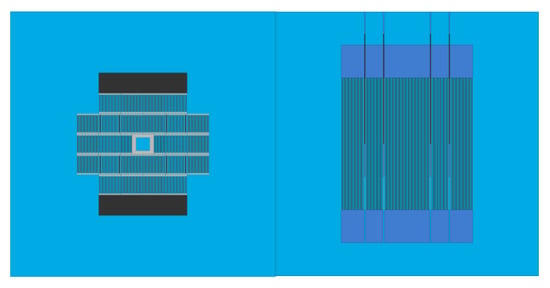
Figure 6.
Serpent 2 model of the MTR IAEA-10 MW core: radial (left) and axial (right) discretization including the reflector zones (black and dark blue).
- Nuclear data library: ENDF/B-VII.0.
- Interface type 22 is used for the data transfer between Serpent 2 and Subchanflow.
- Axially, each plate is subdivided by 20 axial zones.
- The absorber material is made of AgInCd.
- Criticality calculation is performed with 20 inactive cycles followed by 200 active cycles, each consisting of 150,000 histories.
The dynamic external source Serpent 2 calculation is performed for two RIA scenarios with the following parameters:
- Fast Reactivity Insertion Accident (FRIA): neutron population of 8.0 × 10⁵ particles with 200 batches.
- Slow Reactivity Insertion Accident (SRIA): neutron population of 1.6 × 10⁶ particles with 200 batches.
This detailed core model allows for a plate/subchannel level simulation of the core with Serpent2/Subchanflow.
3.5. Subchanflow Model and Assumptions
A detailed Subchanflow model was developed where each rectangular flow channel is represented separately, as shown in Figure 7. The following assumptions were made:
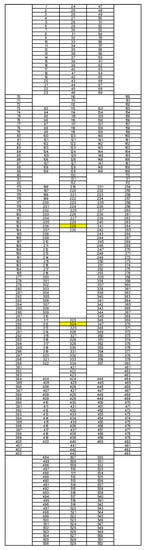
Figure 7.
Numbering of the plates and coolant channels for the radial mapping between SSS and SCF.
- A plate-centered model resolving each channel as a subchannel.
- For the heat conduction, each plate is subdivided radially into 3 and 2 cells for fuel and cladding, respectively.
- The Blasius and Colburn correlations are used for the friction factor and the heat transfer coefficient, respectively, based on previous validation work [10].
- In total, 552 plates and channels are considered in the core model.
- Axial discretization of each channel in 20 nodes.
3.6. Convergence Criteria and Computer Environment
The coupled code Serpent2/Subchanflow was compiled in the Debian 4.9.88-1+deb9u1 LINUX machine consisting of 48 logical cores. The main characteristics of the machine are: Intel(R) Xeon(R) Gold 5118 CPU @ 2.30 GHz. When performing coupled Serpent2/Subchanflow simulations, the coupled system will stop the iterative process when pre-defined convergence criteria for selected thermal–hydraulic parameter are fulfilled. The convergence parameters, e.g., for the fuel temperature, are fixed based on the norm according to Equation (1)
where identifies the iteration step, defines the positions and is the convergence criteria. To obtain a good convergent solution with minimal statistical noise, the following values were recommended by [28]. In this work, the following convergence criteria are used: , and . Additionally, the conservative relaxation factor of is used to relax the thermal–hydraulic fields, as is shown in Equation (2). There, stands for the iteration step, for the positions and for the thermal–hydraulic fields, which may be , or .
4. Results
4.1. Selected Parameters of the Steady-State Simulation
In the frame of the investigations performed here, a steady-state coupled calculation with Serpent2/Subchanflow is required for the following reasons:
- To find the critical position of the control rods (plates of AgInCd) of the MTR core for full power operation, i.e., to achieve a multiplication equal factor to one ();
- To evaluate the key thermal–hydraulic and neutron physical parameters of the core that correspond to the initial conditions before transient analysis is performed;
- To obtain the precursor and live neutrons sources for the following transient external source simulation.
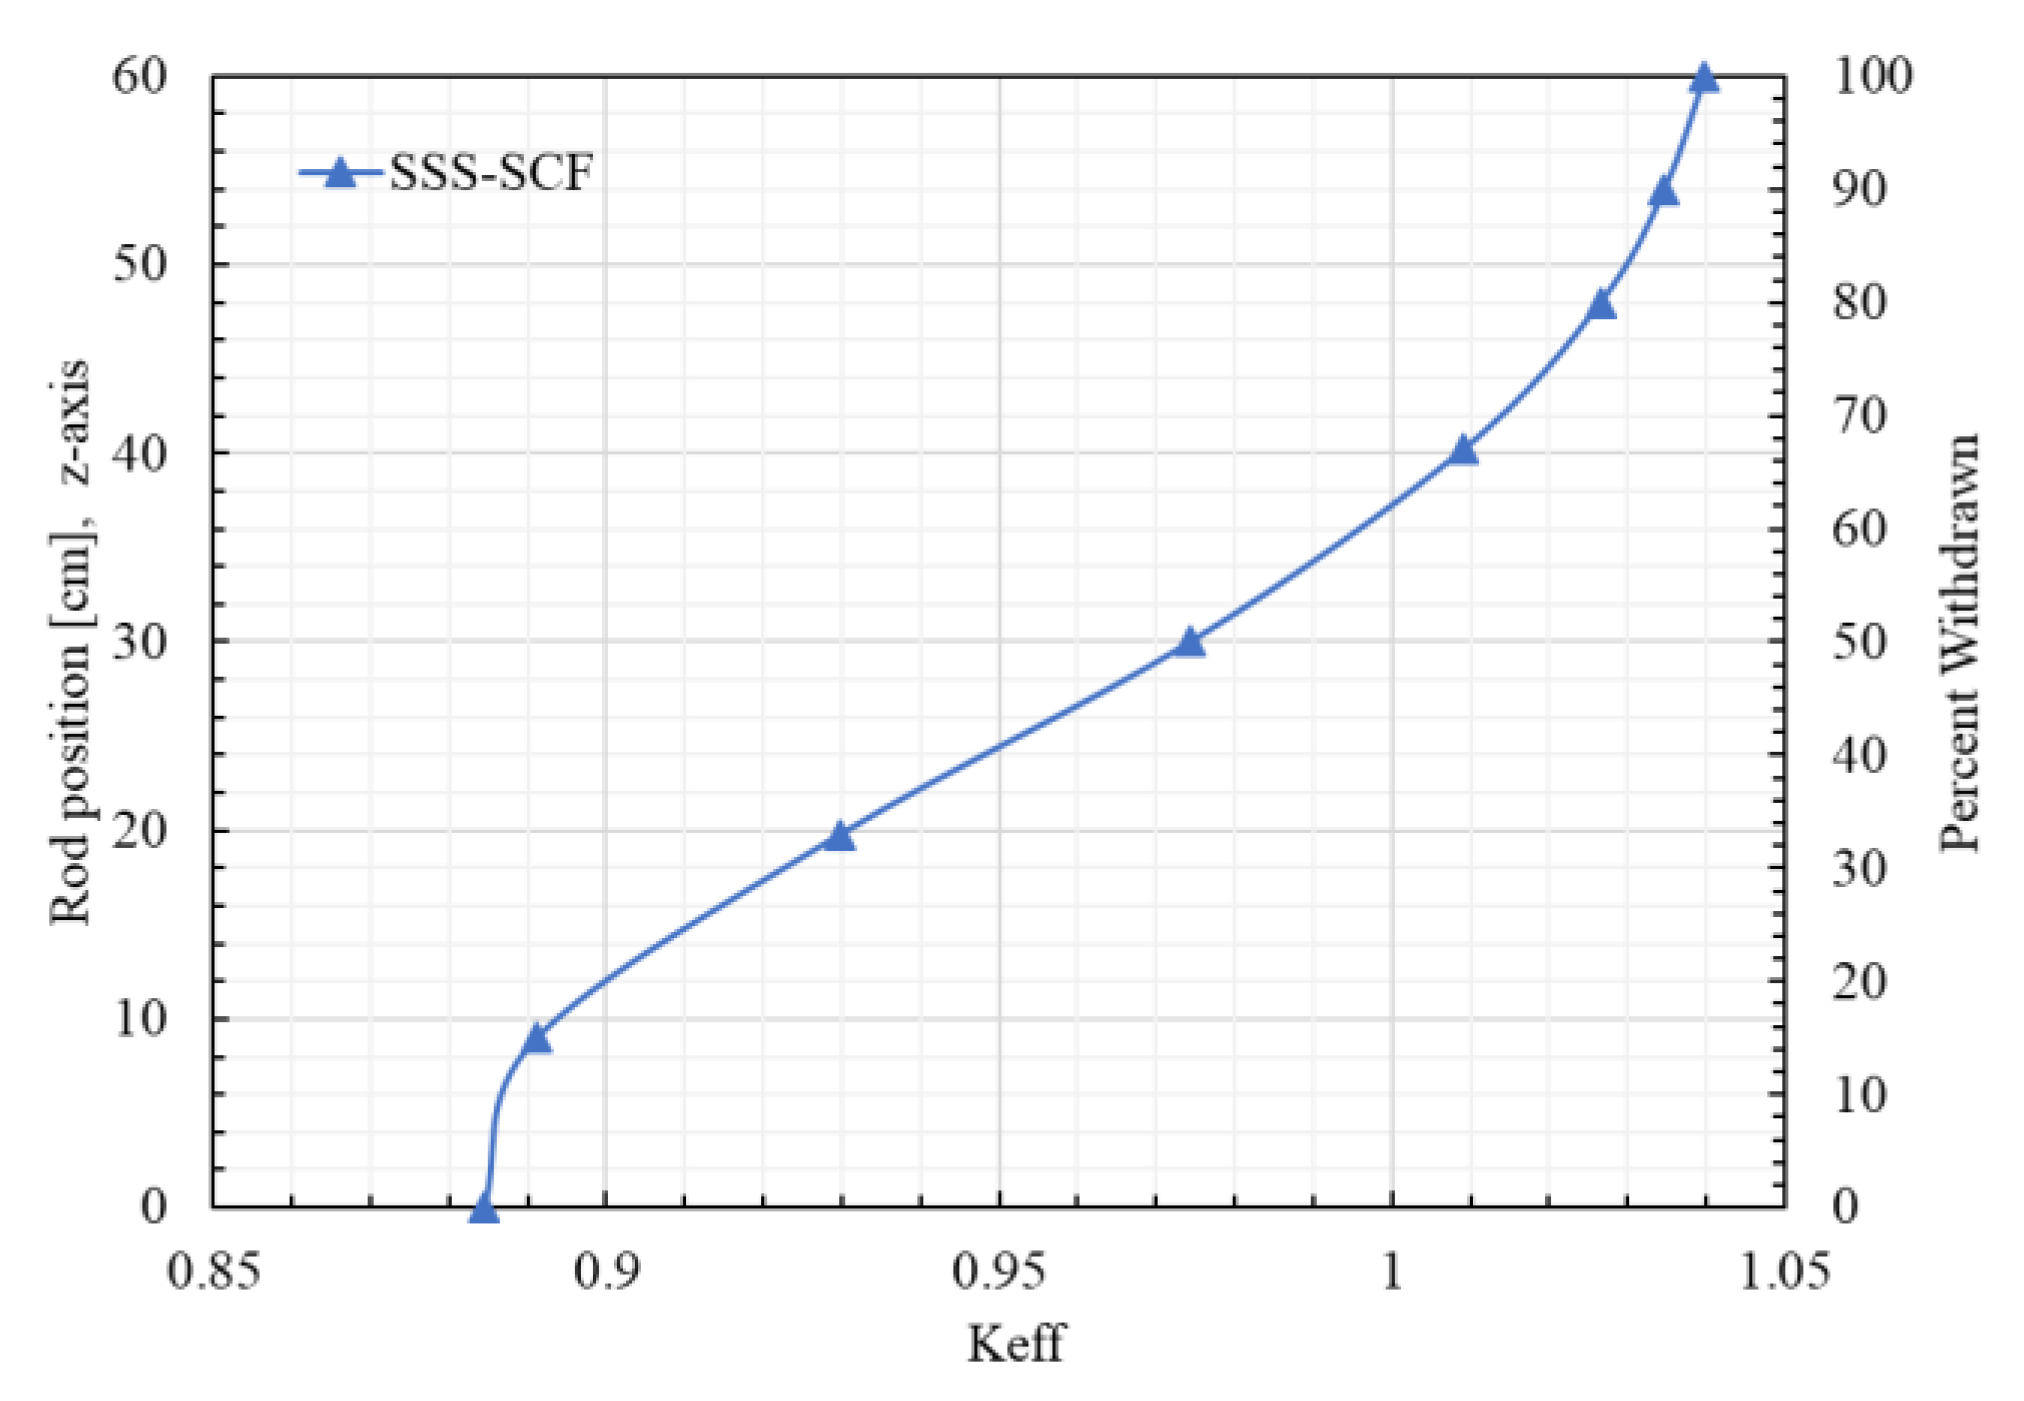
Figure 8 shows the variation of the effective multiplication factor () for different positions (0 cm: full inserted, 60 cm: full withdraw) of the eight control plates for the MTR core loaded with HEU at BOL conditions, as predicted by Serpent2/Subchanflow. In Table 3 the critical control rod position determined by a linear interpolation between two points at 30 cm and 40.2 cm from the bottom position of the active region is exhibited, with the error bar and the statistical uncertainty of the multiplication factor.
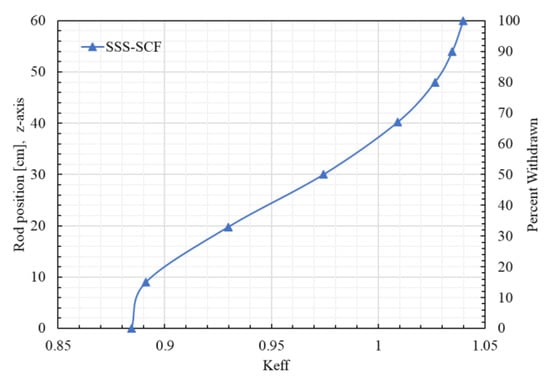
Figure 8.
depending on the control rod position for HEU and BOL benchmark cores.
Table 3.
Control rod position.
For the thermal–hydraulic parameters shown in Table 1, Serpent2/Subchanflow predicted a core heat-up of 47.64 K compared with a value of 46.70 K predicted by the code MERSAT (AECS) [29].
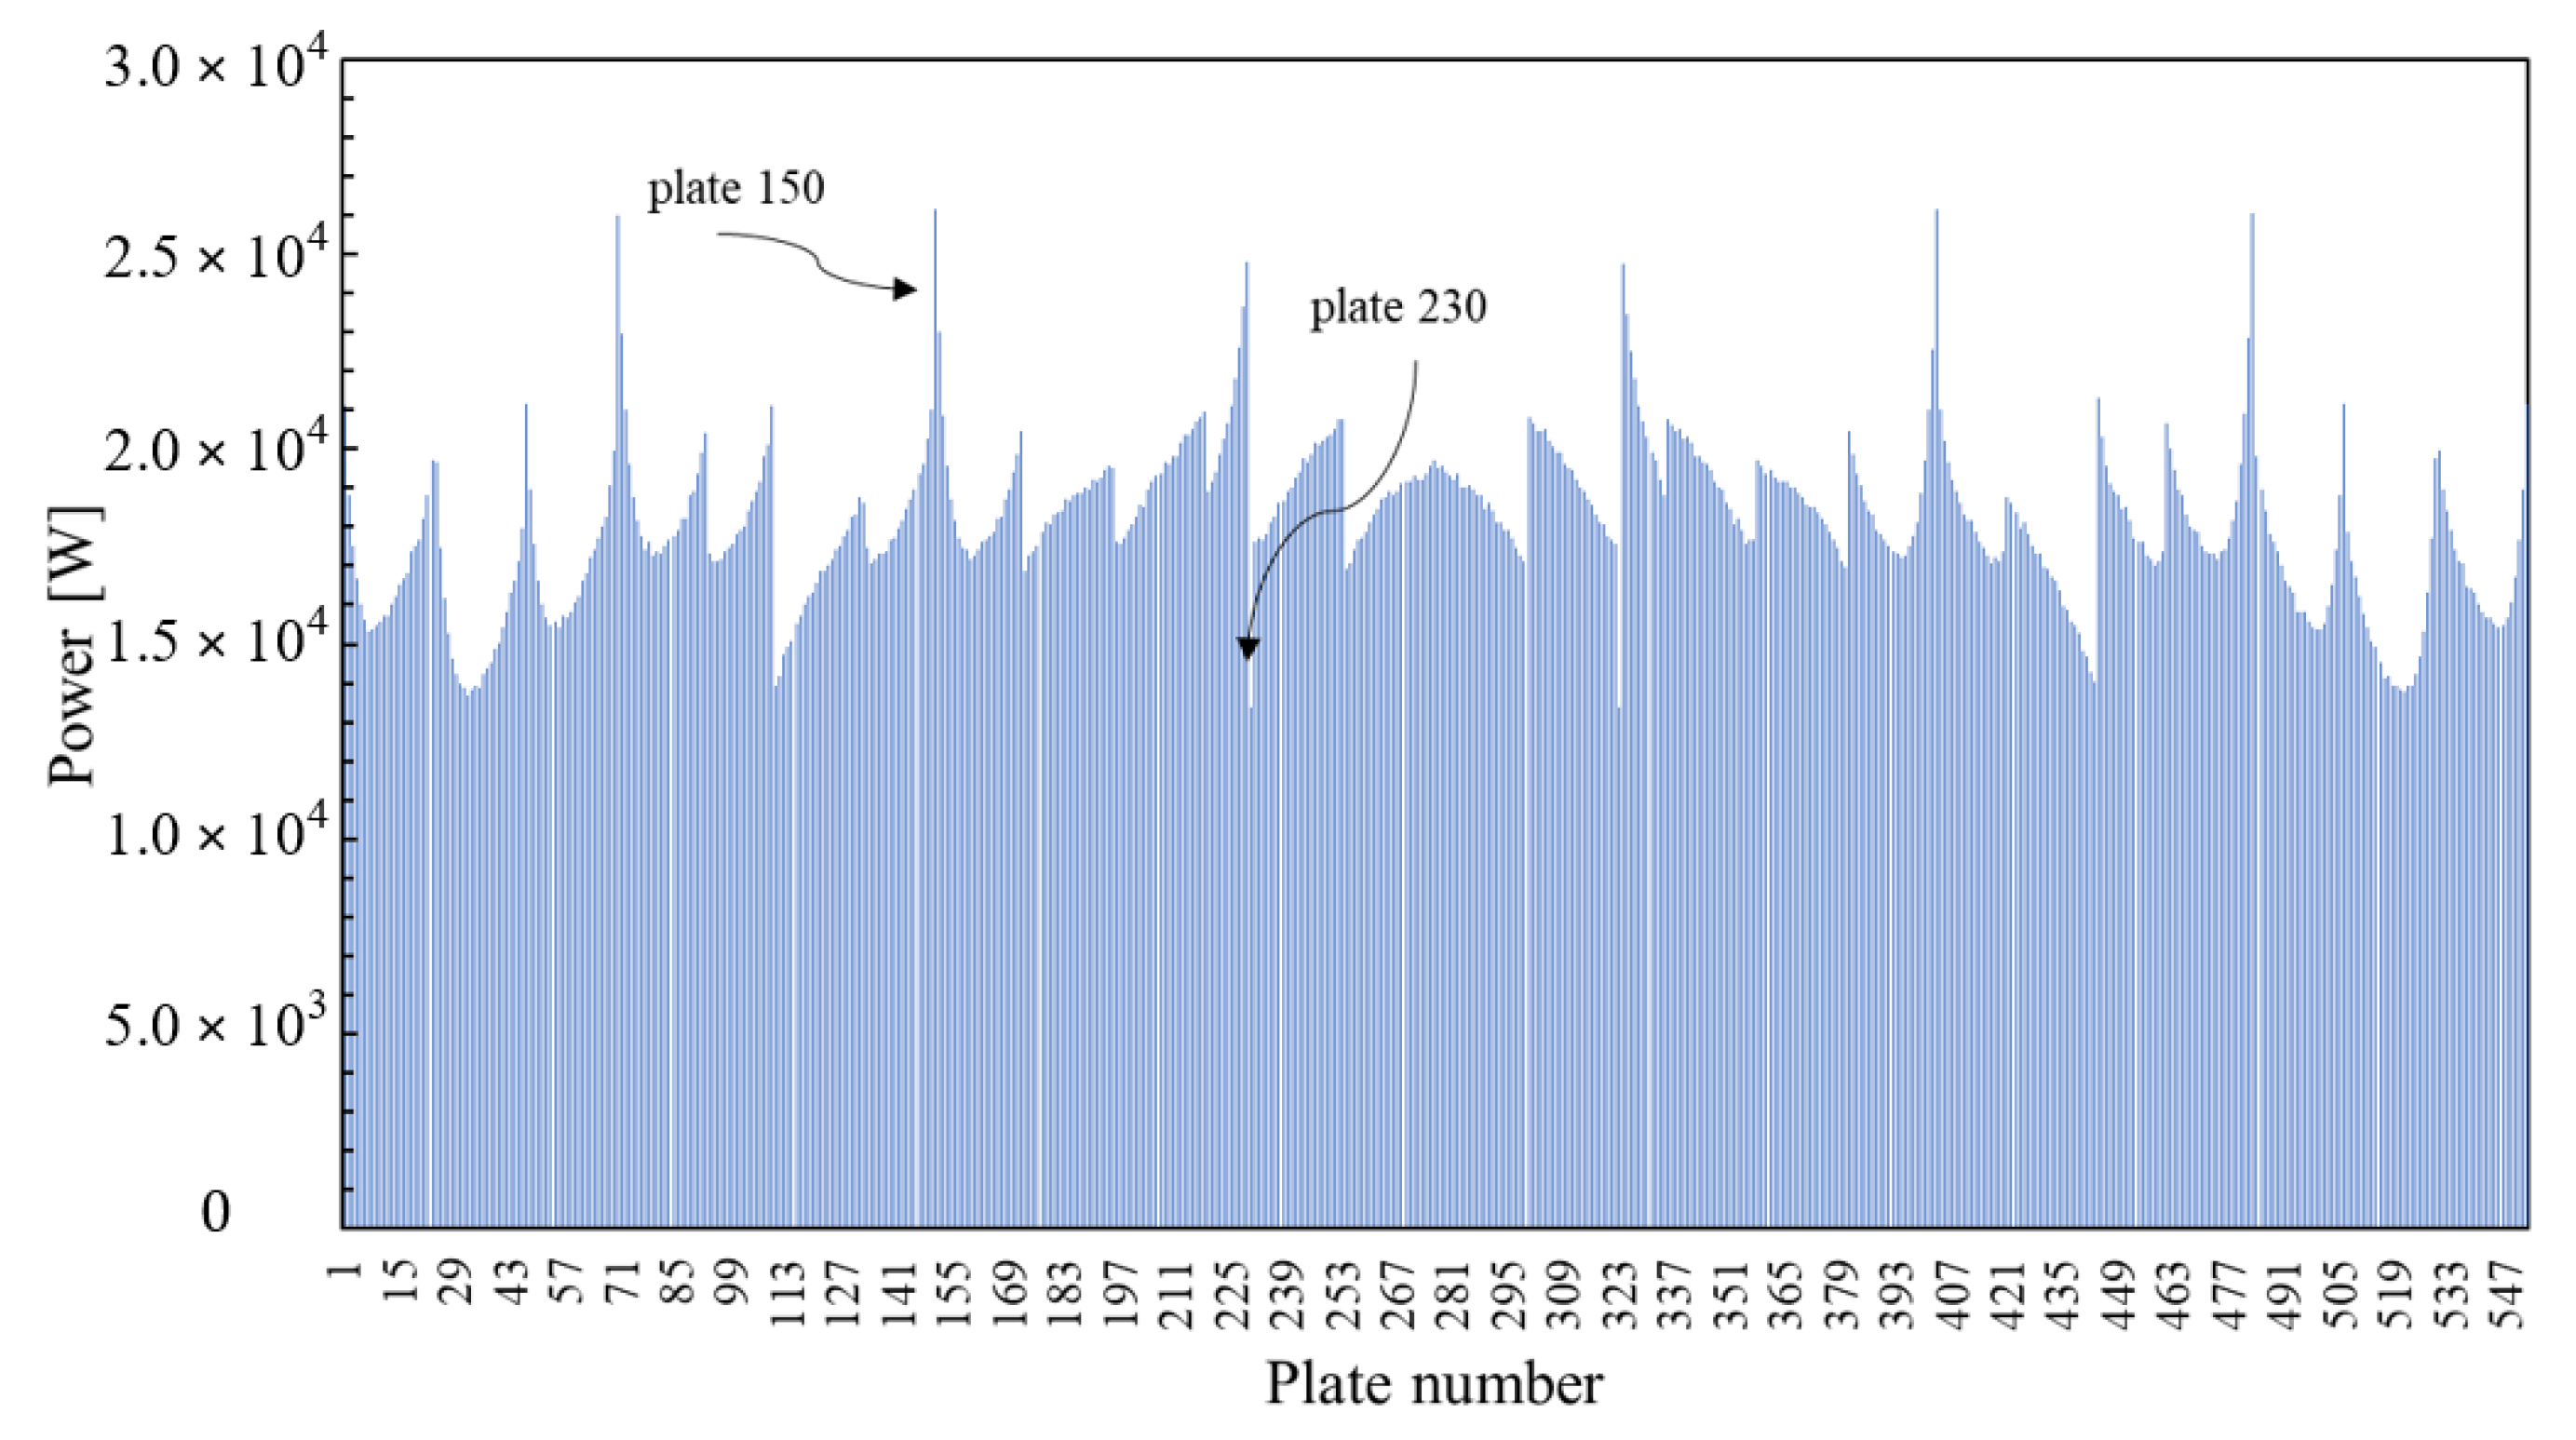
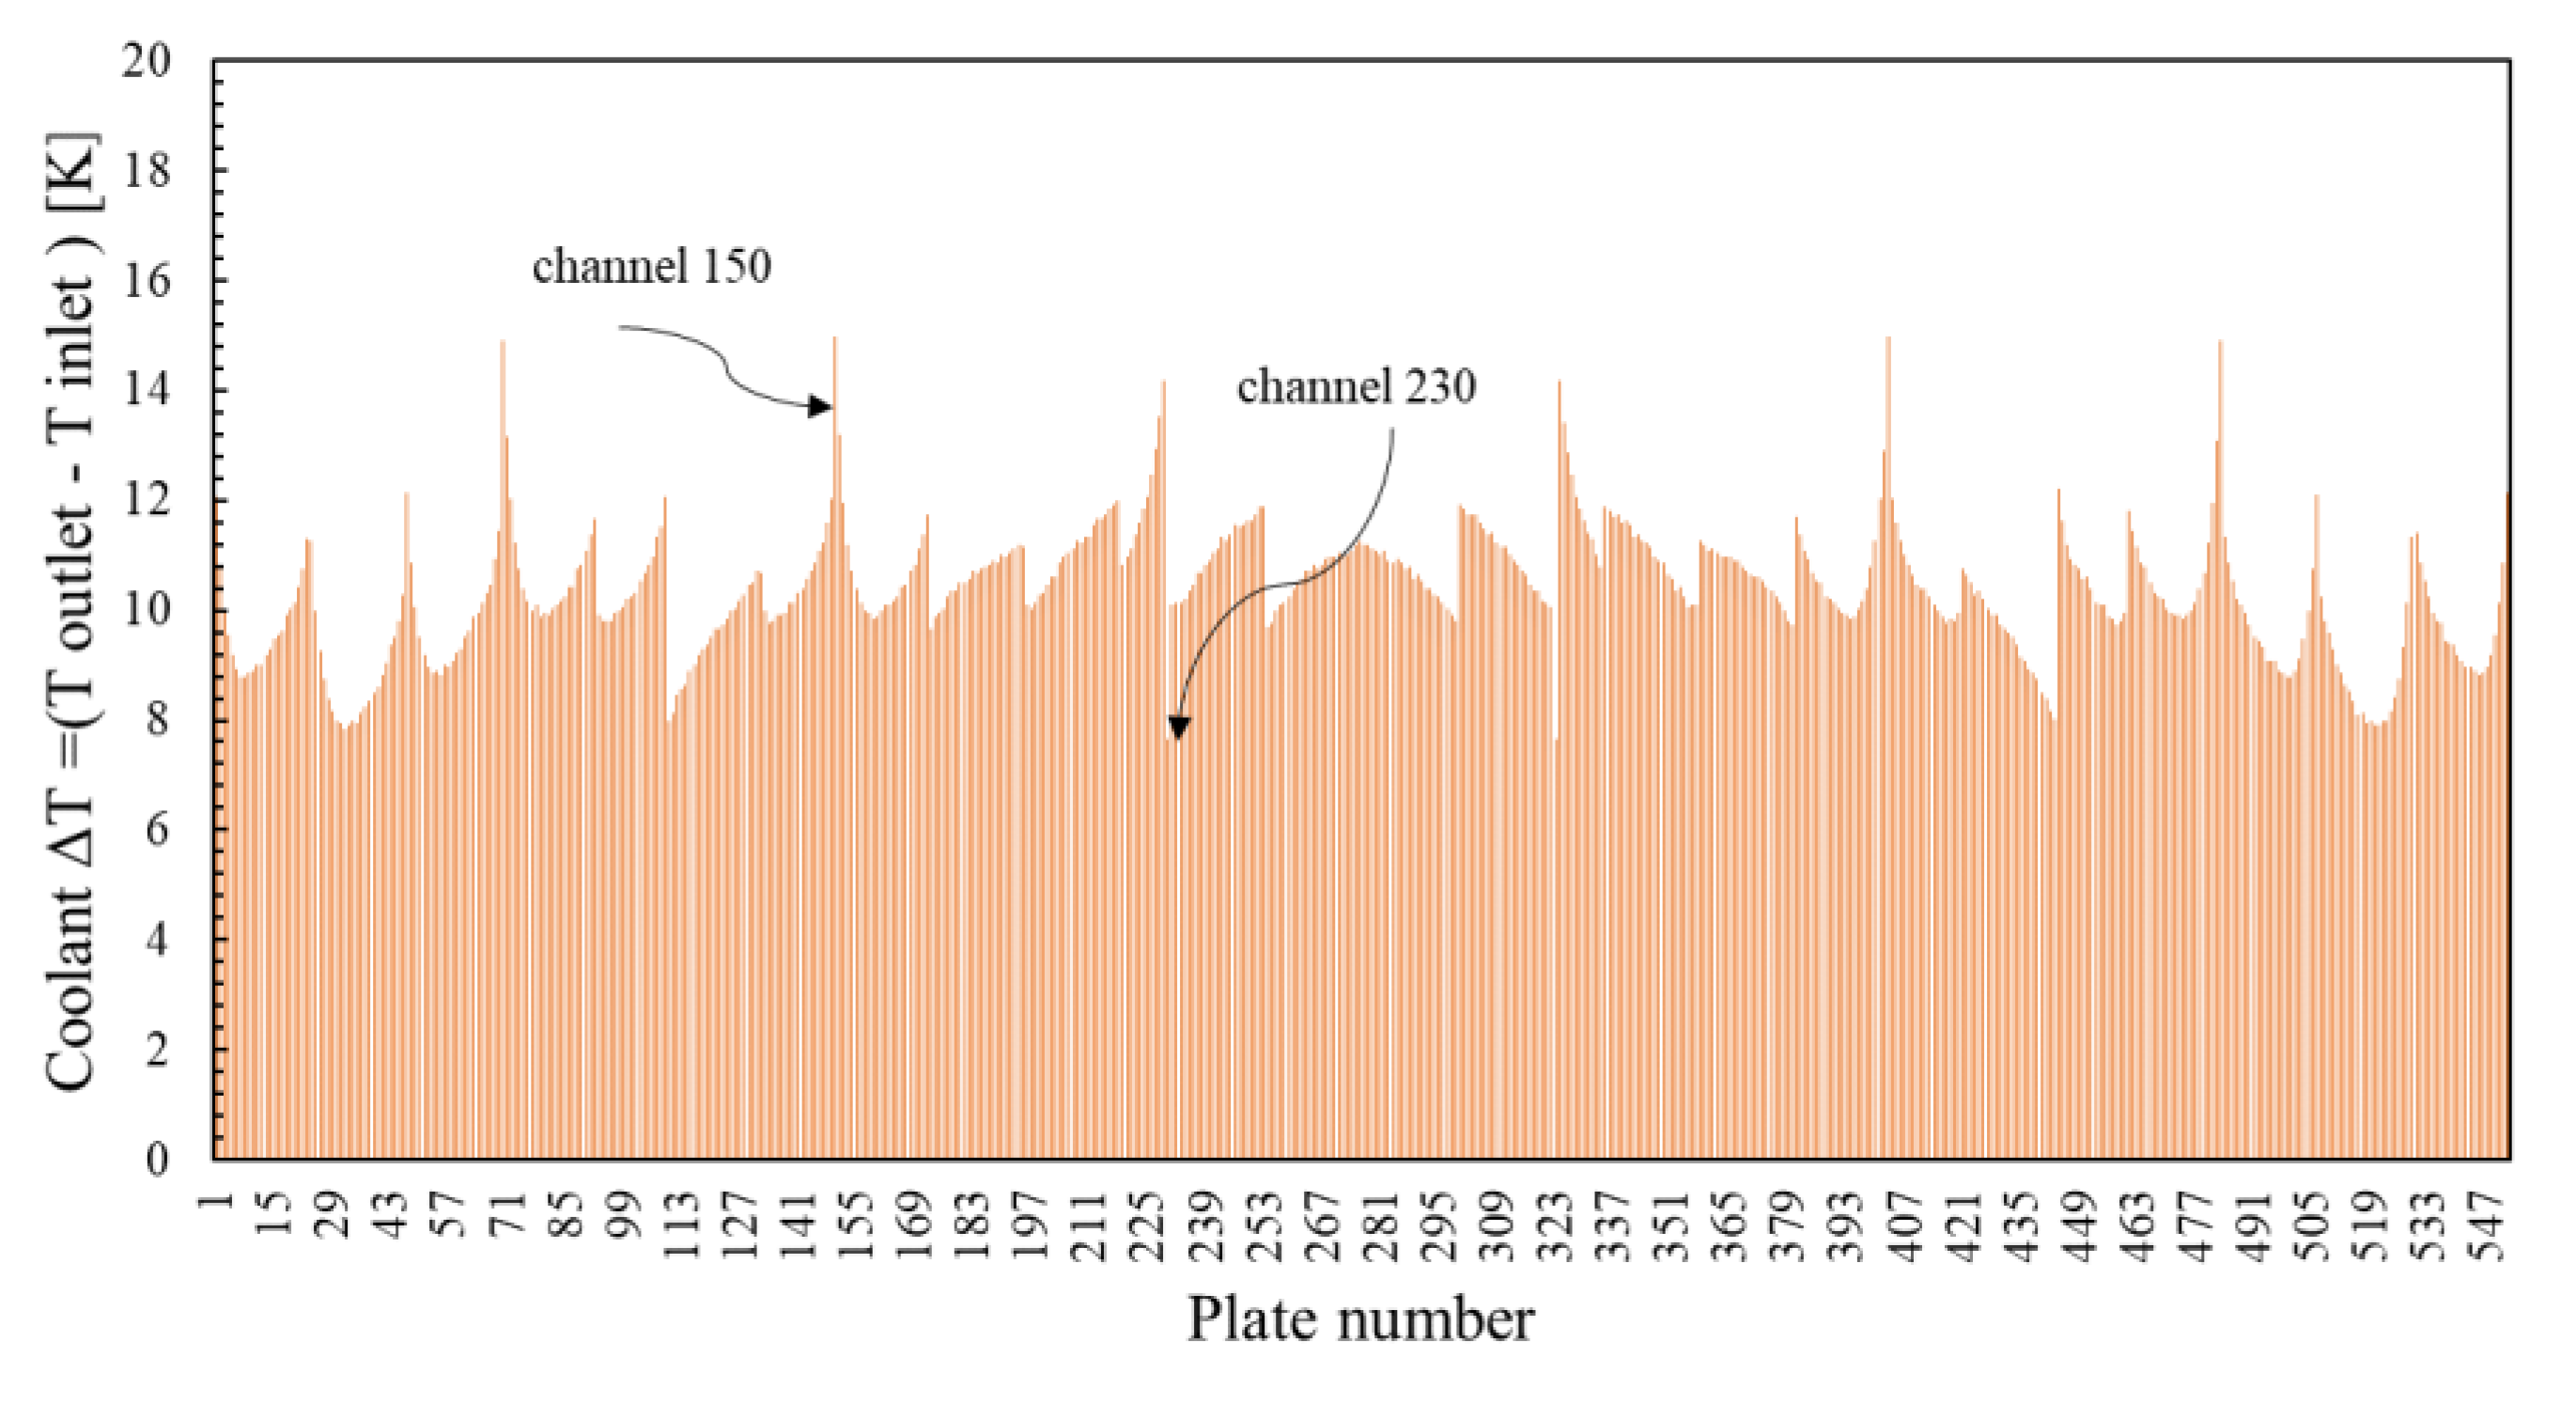
The novel capabilities of the Serpent2/Subchanflow simulations at the plate/subchannel level make it possible to evaluate the behavior of each fuel plate and subchannel considering the local feedbacks between neutronics and thermal–hydraulics. The plate-by-plate power distribution of the MTR core is shown in Figure 9, where the location of the plates with minimum and maximum power can be easily identified. Additionally, Figure 10 shows the coolant heat-up of each channel of the core, where again the location of the subchannel with the hottest and coldest coolant temperature can be identified.
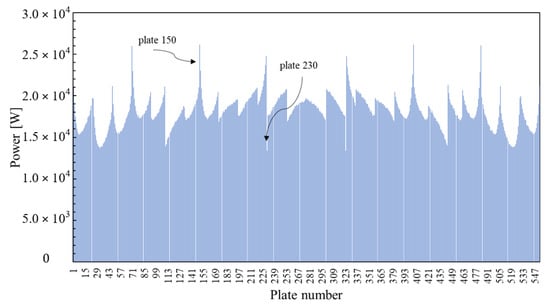
Figure 9.
Plate power predicted by Serpent2/Subchanflow, where the plates with the minimum and maximum power are indicated.
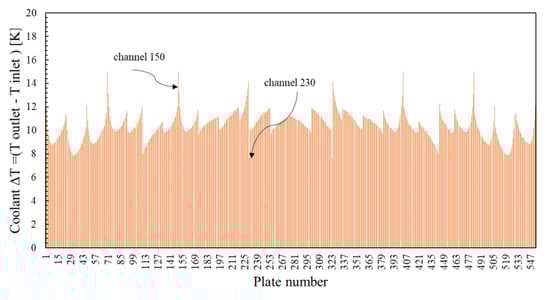
Figure 10.
Coolant heat-up for each subchannel predicted by Serpent2/Subchanflow: the channels with minimum and maximum heat-up are identified.
According to Figure 7 the hottest plate/channel (# 150) is in a standard fuel assembly located at coordinate (B, 2) and the coldest plate/channel (# 230) is located at coordinate (C, 4) (see Figure 4).
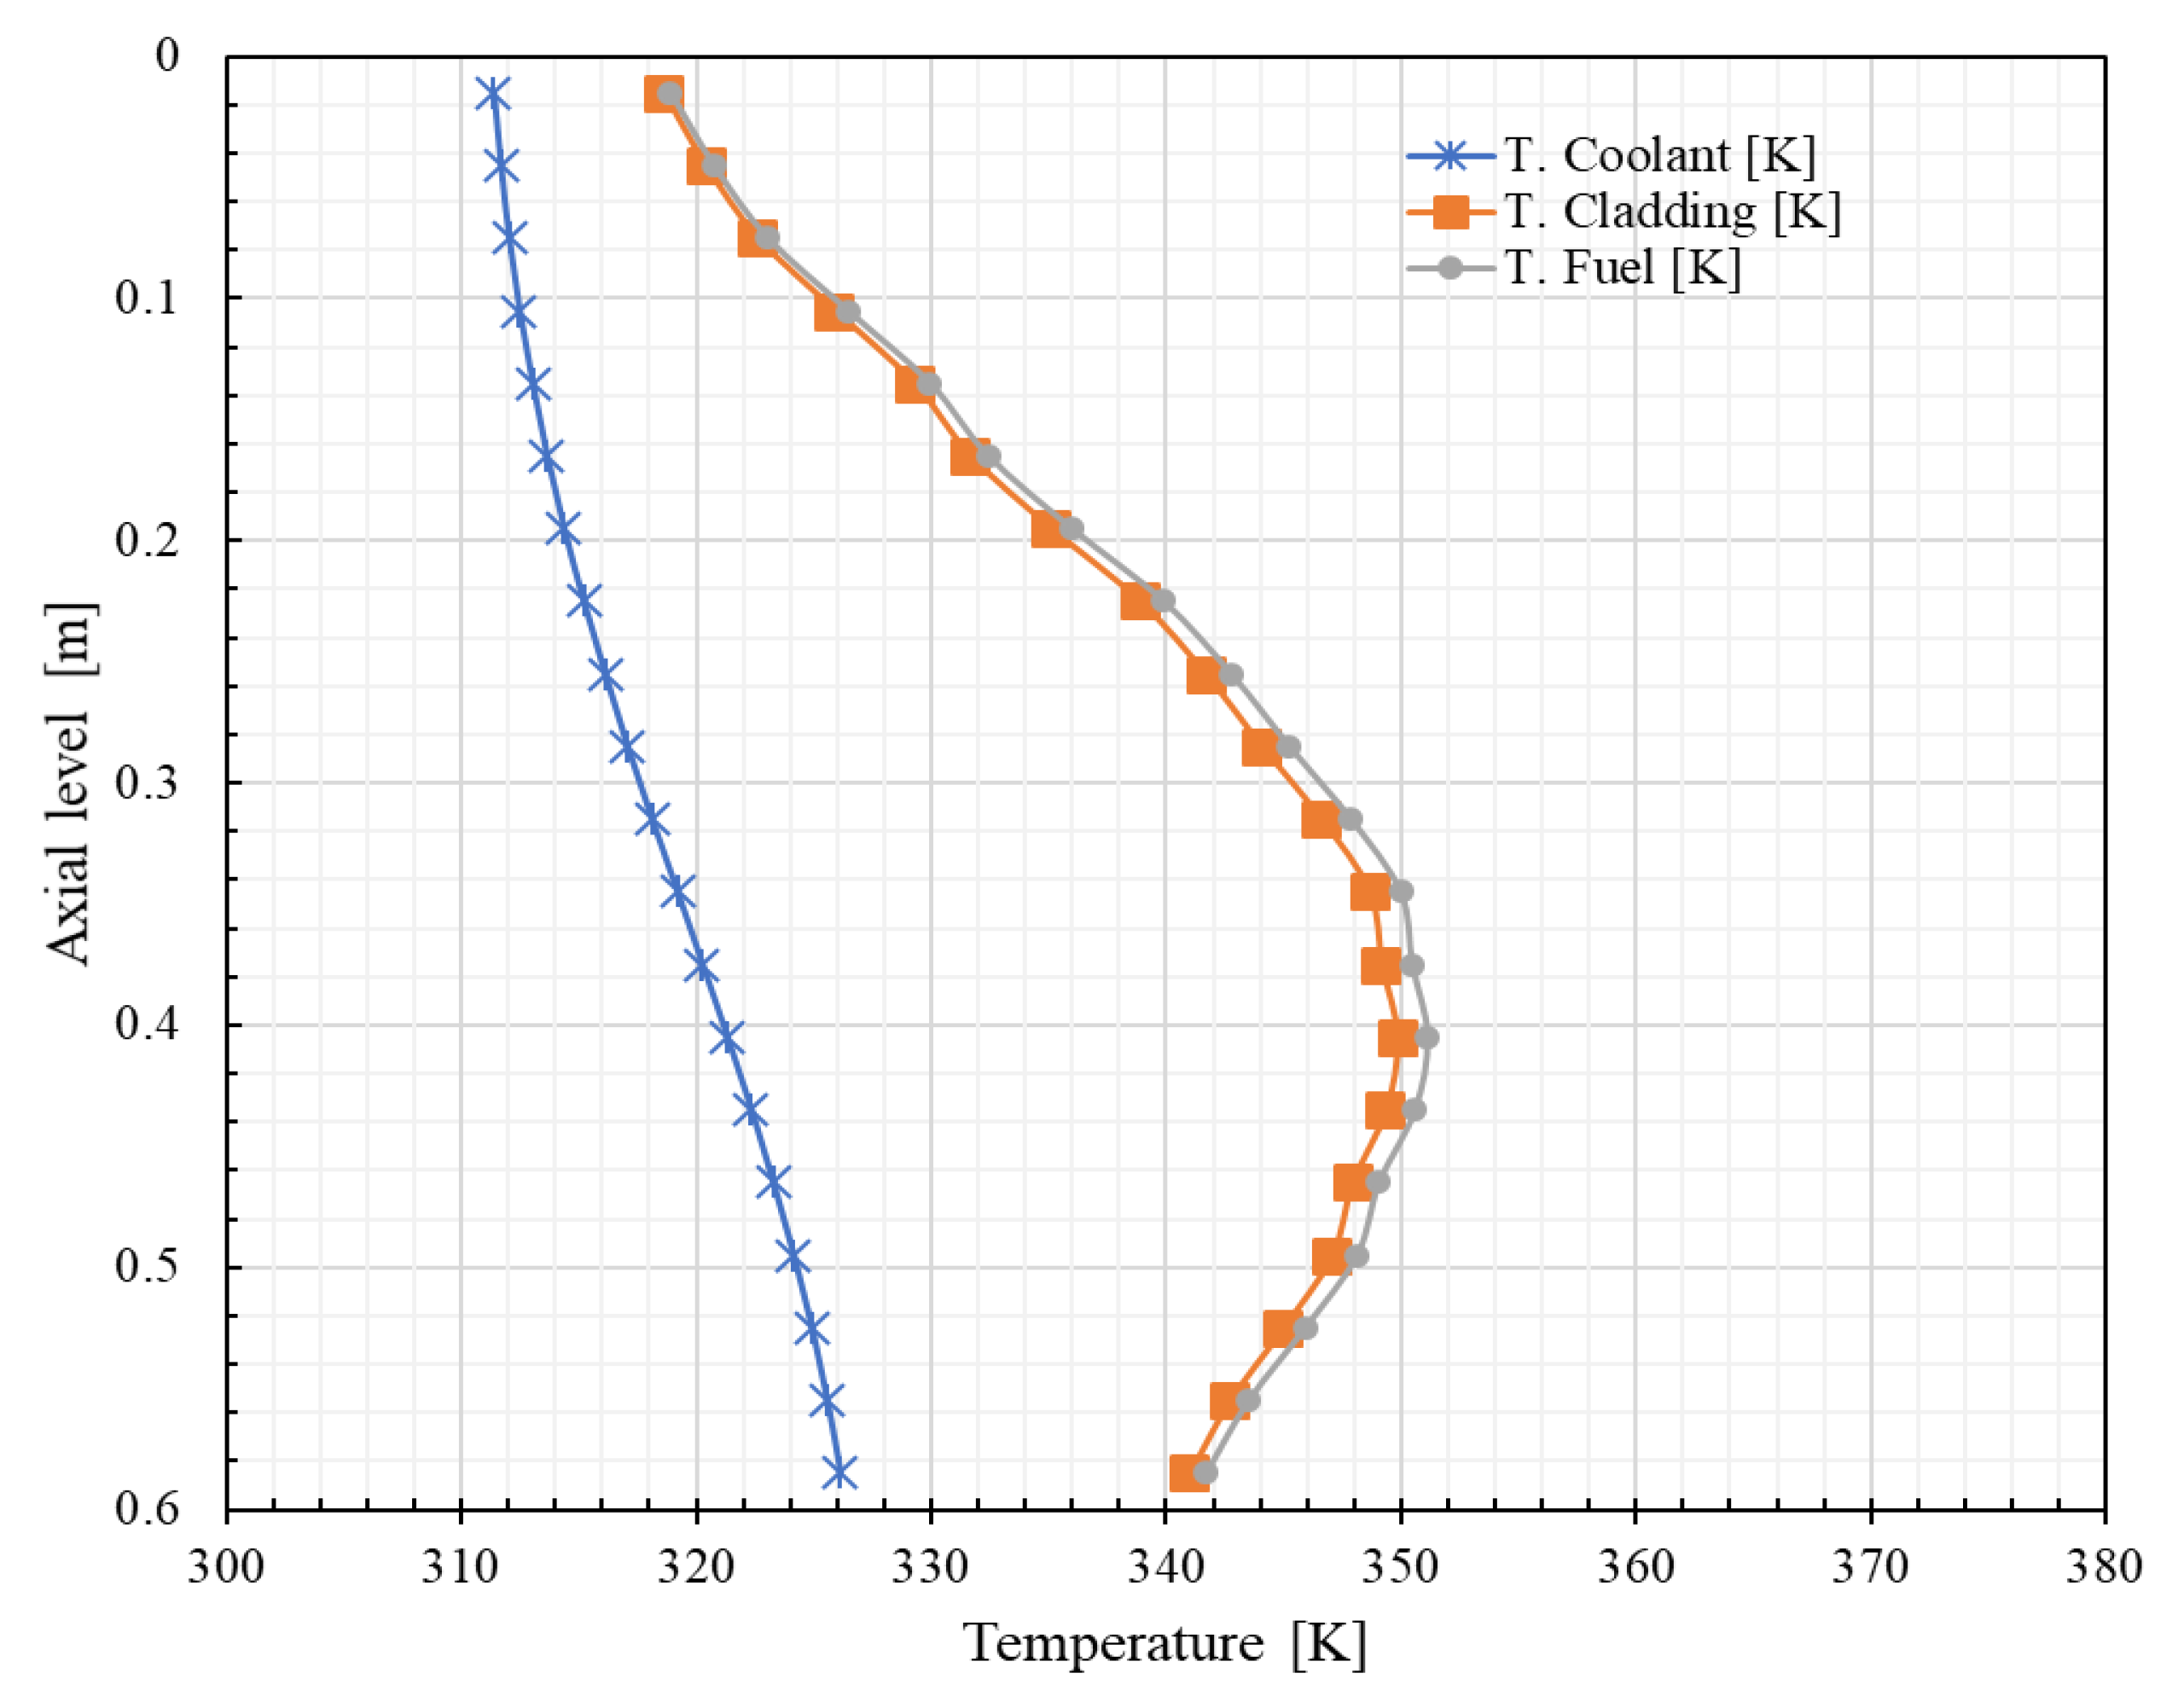
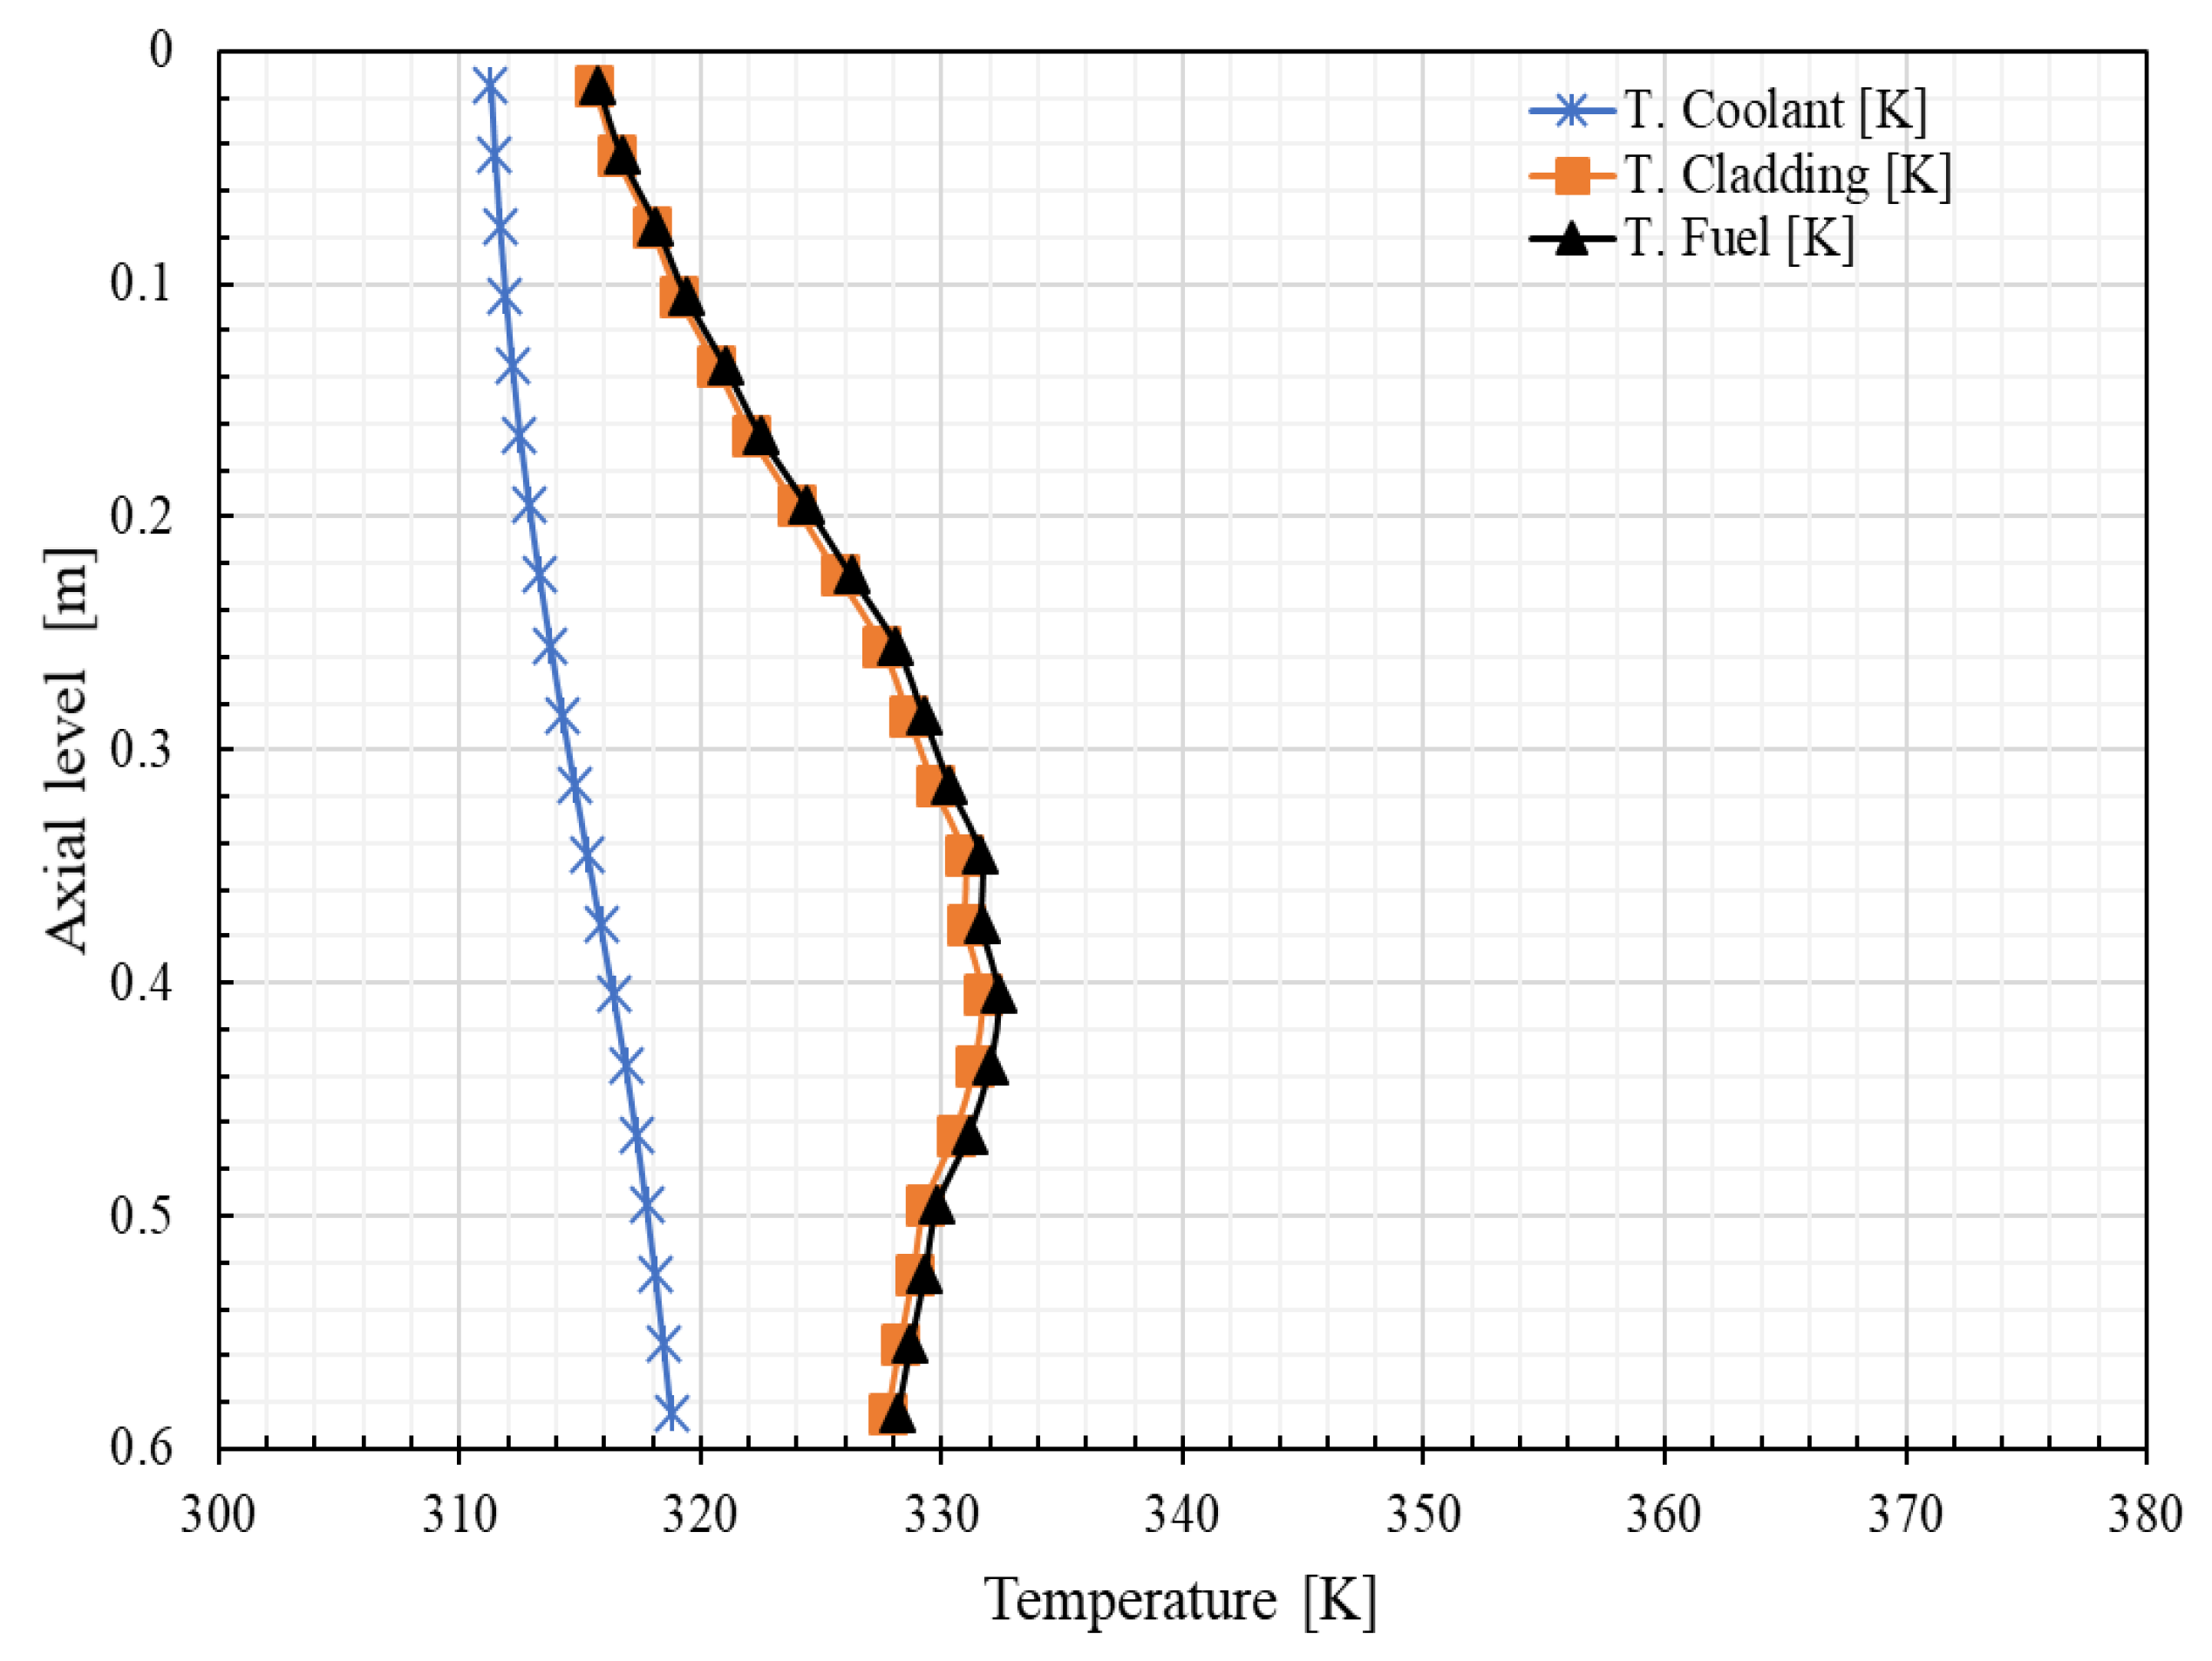
Finally, Figure 11 and Figure 12 show the axial temperature distribution profiles of the coolant, cladding and fuel of the hottest and coldest plate. The maximum coolant temperature value of 326.13 K is located at the core outlet (lowest part of the active region) and the coldest is 318.81 K. On the other hand, the maximum cladding and fuel temperatures for the hottest plate are at 40 cm measured from the top of the active region: 351.13 K and 349.81 K, respectively. The value of the coldest plate amounts to 332.6 K, while the one of the cladding amounts to 331.7 K.
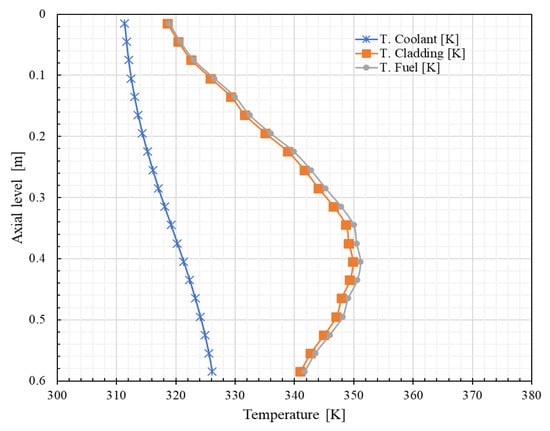
Figure 11.
Axial temperature distribution for the hottest plate/channel.
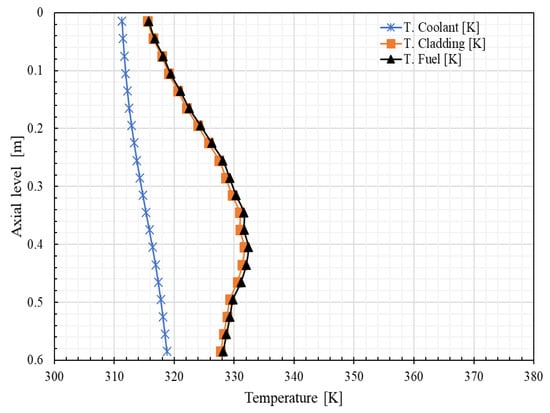
Figure 12.
Axial temperature distribution for the coldest plate/channel.
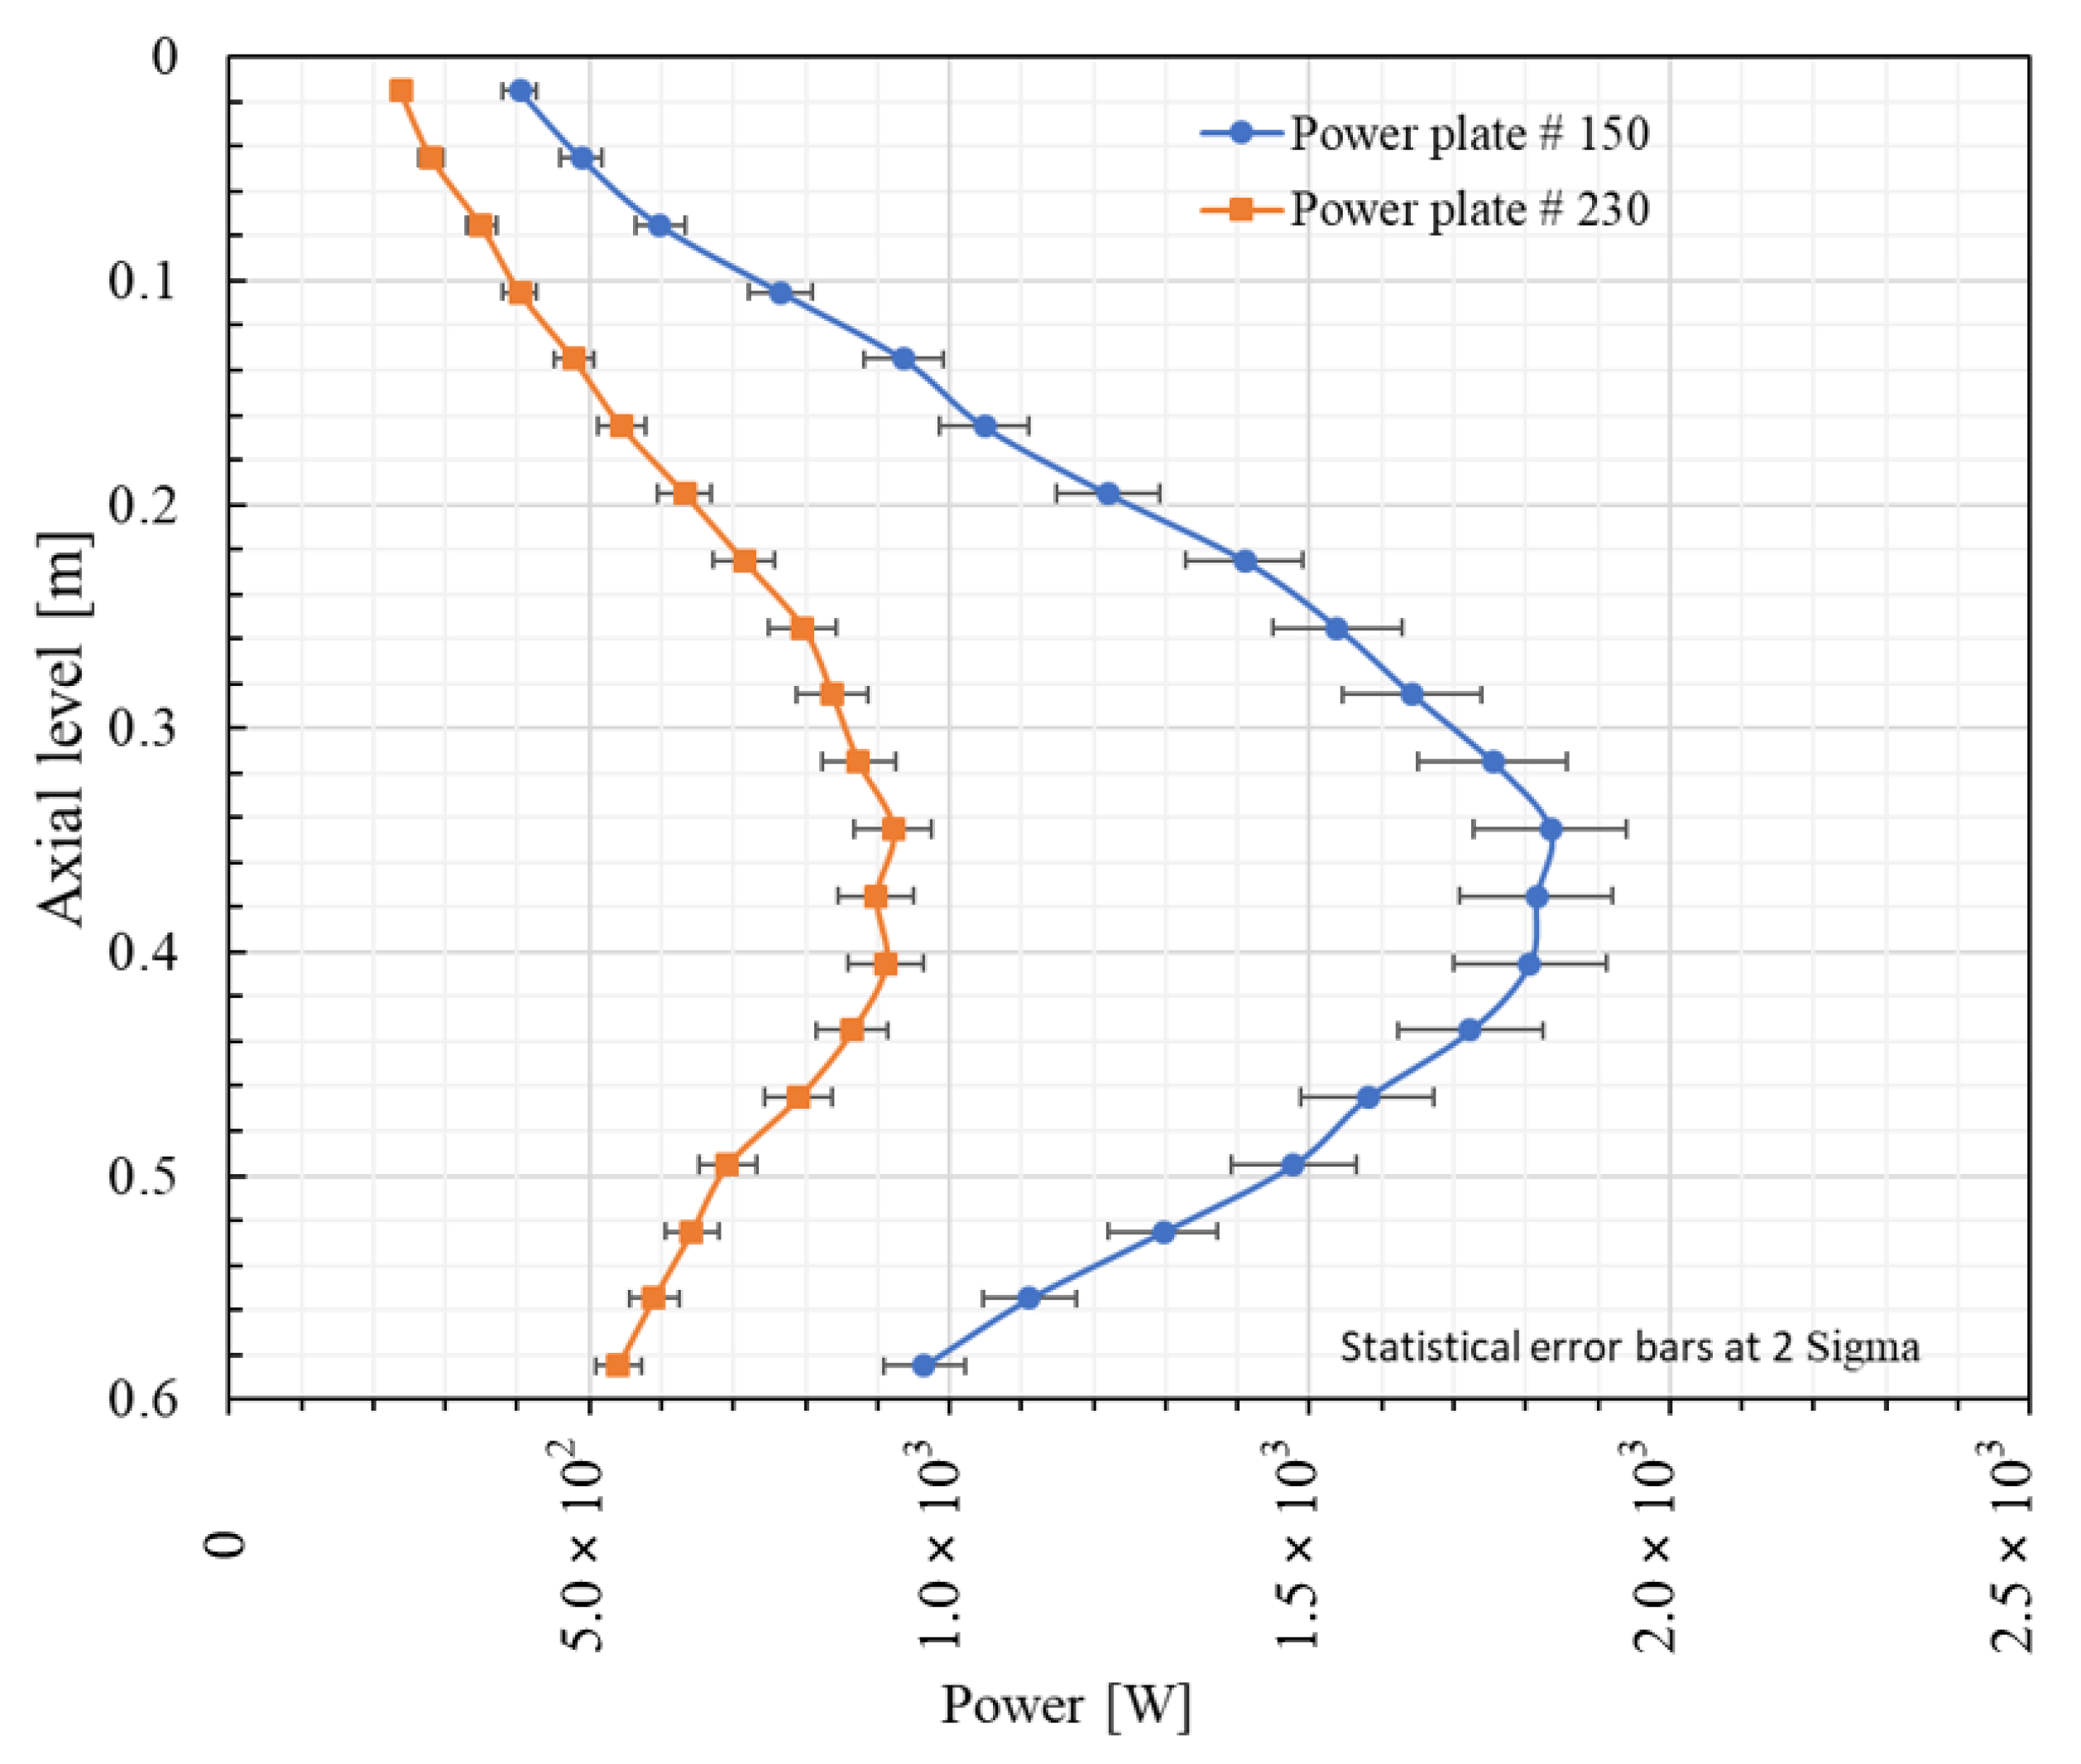
In Figure 13, the axial power distribution of the 150 (hottest) and 230 (coolest) plates is exhibited with a statistical error of 2σ. The maximum power values are in the range of 37 cm to 40 cm measured from the top of the active region. The curves are not symmetrical due to the fact that the eight control plates of AgInCd are partly inserted and due to the coolant downward flow.
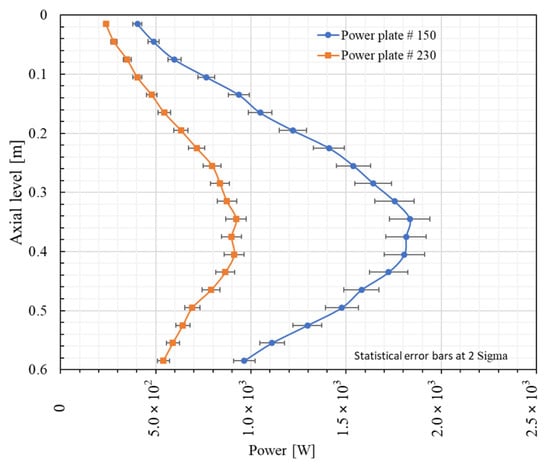
Figure 13.
Axial power distribution of the plate # 150 (highest) and # 230 (lowest): identification of the plate with minimum and maximum power possible.
Critical source: A critical steady-state full 3D model of the IAEA-1 W benchmark is obtained as a first step to generate the required sources of live and precursor neutrons for the transient calculation. The convergence of thermal–hydraulic parameters is the same as that handled in Section 3.6. The stationary core conditions are characterized by a control rod position of measured from the bottom of the active region and a value of , respectively.
4.2. Simulation of the RIA Transients
An RIA is classified as a design basis accident for a research reactor, and hence it must be analyzed in any safety study. Due to its relevance for safety, the RIA scenarios are defined at cold zero power (CZP) conditions where the coolant and the fuel have the same low temperature. Here, the fast and slow reactivity insertion defined in the IAEA 10 MW benchmark will be analyzed with Serpent2/Subchanflow [15].
4.2.1. Control Rod Movement Scenarios
Figure 14 shows the movements of the control plates at each time interval for the fast RIA scenario (FRIA). In the time interval (Δt1 = 0.5 s), the control plates are extracted at a constant speed of 0.61 0.1 cm/s. As consequence, it is observed that the reactivity increases linearly from 0$ to 1.5063$ 0.007485. After 0.5 s the control plates remain at rest for Δt20.09 s, the reactivity continues increasing up to a maximum of 1.6037$ 0.007485. Then, it starts to decrease due to the Doppler Effect and control plate insertion. This starts at 0.59 s with a velocity of −41 0.1 cm/s, up to a value of −5.998$ .
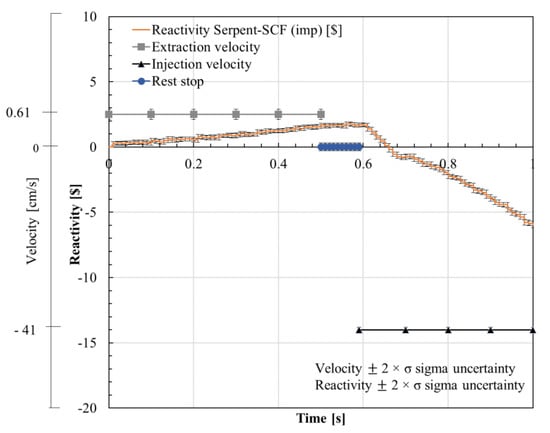
Figure 14.
Control rod movements for FRIA (1.5$/0.5 s).
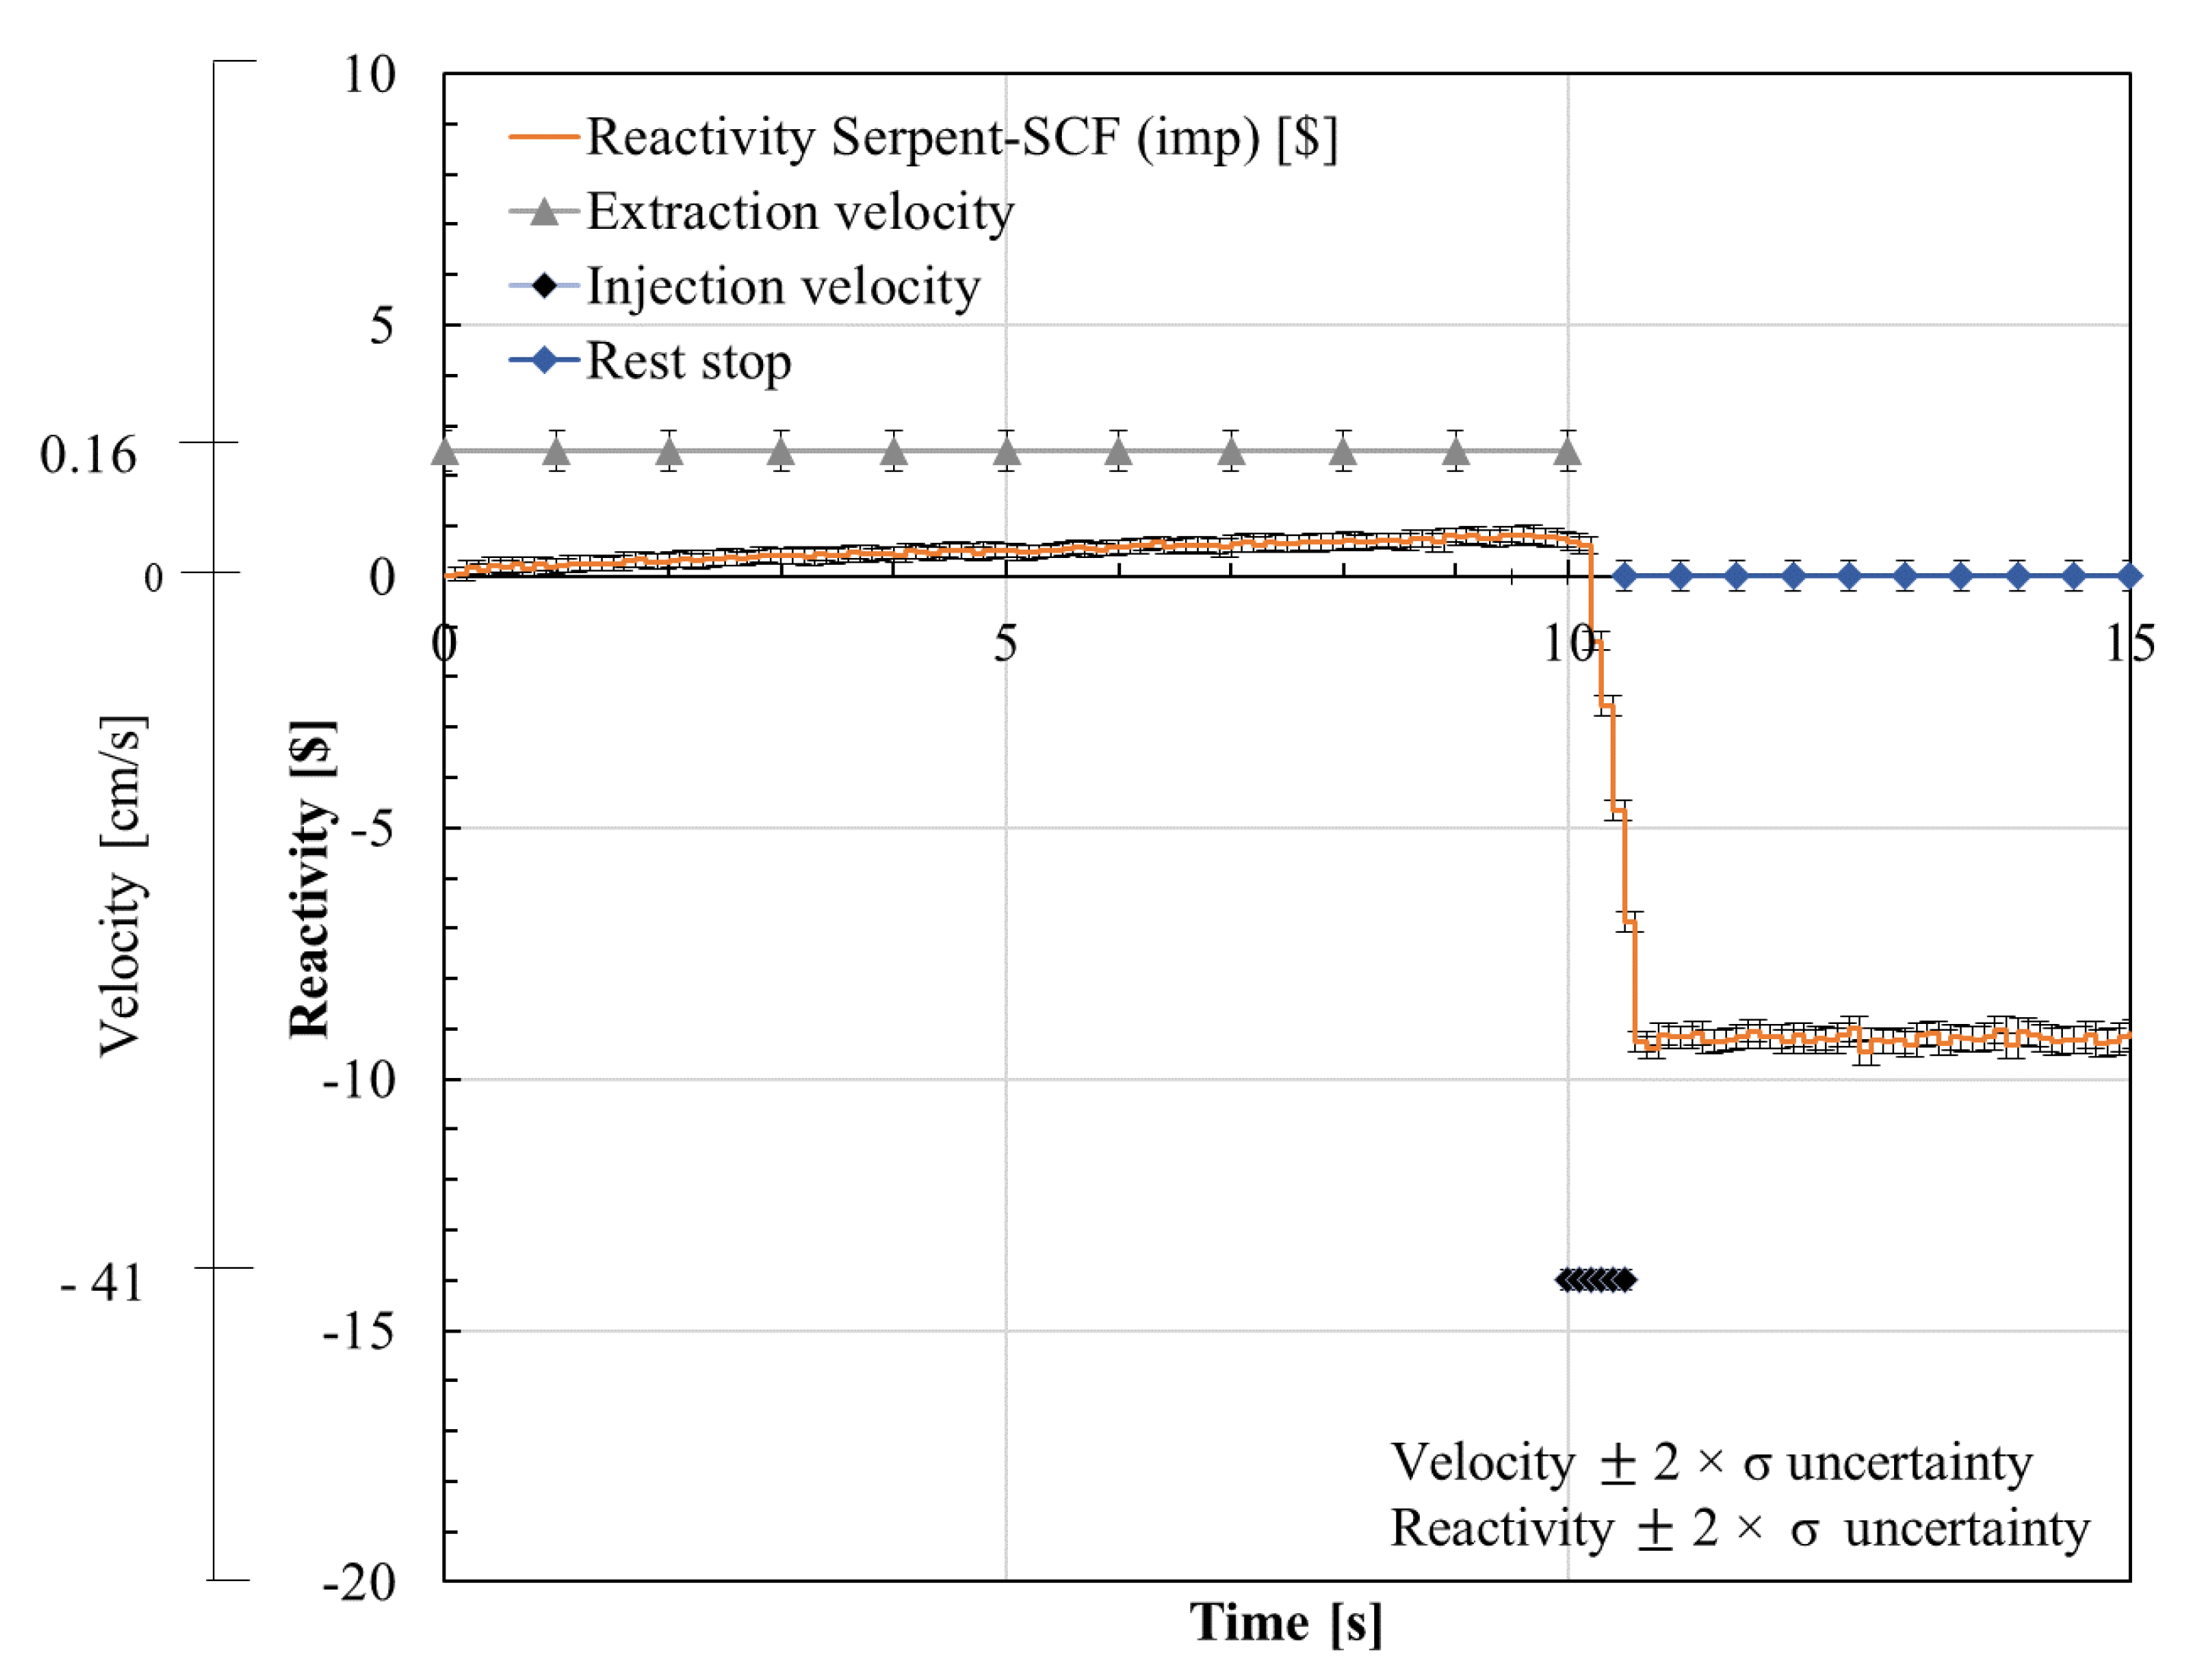
The control plate movements for the slow RIA (SRIA) event are presented in Figure 15. For Δt1 = 10 s, the control plates are extracted with a constant velocity of 0.16 0.1 cm/s leading to a reactivity increase of 1.0051$ . After the 10 s, the control plates are inserted with a constant velocity of −41 0.1 cm/s during Δt2 = 0.5 s, causing a reactivity decrease to −9.0027$ 0.007485. Finally, after the 10.5 s, the control plates remain at rest.
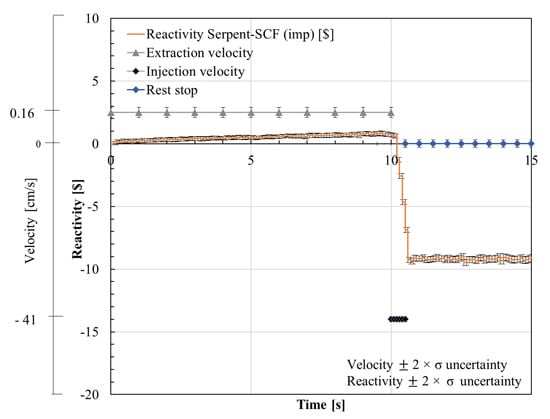
Figure 15.
Control rod movements for SRIA (1$/10 s).
4.2.2. Power and Reactivity Evolution for the Fast Reactivity Insertion (FRIA 1.5$/0.5 s)
The large reactivity insertion in the case of the FRIA scenario leads to prompt supercritical reactor condition. The scenario is characterized as follows:
- Steady-state conditions at cold zero power conditions, i.e., 1 W.
- From the stationary reactor condition, a positive reactivity insertion of 1.5$ during 0.5 s.
- The reactor is shutdown when the trip set point is achieved, i.e., W with a delay time of 25 ms (10$, 0.5 s insertion time).
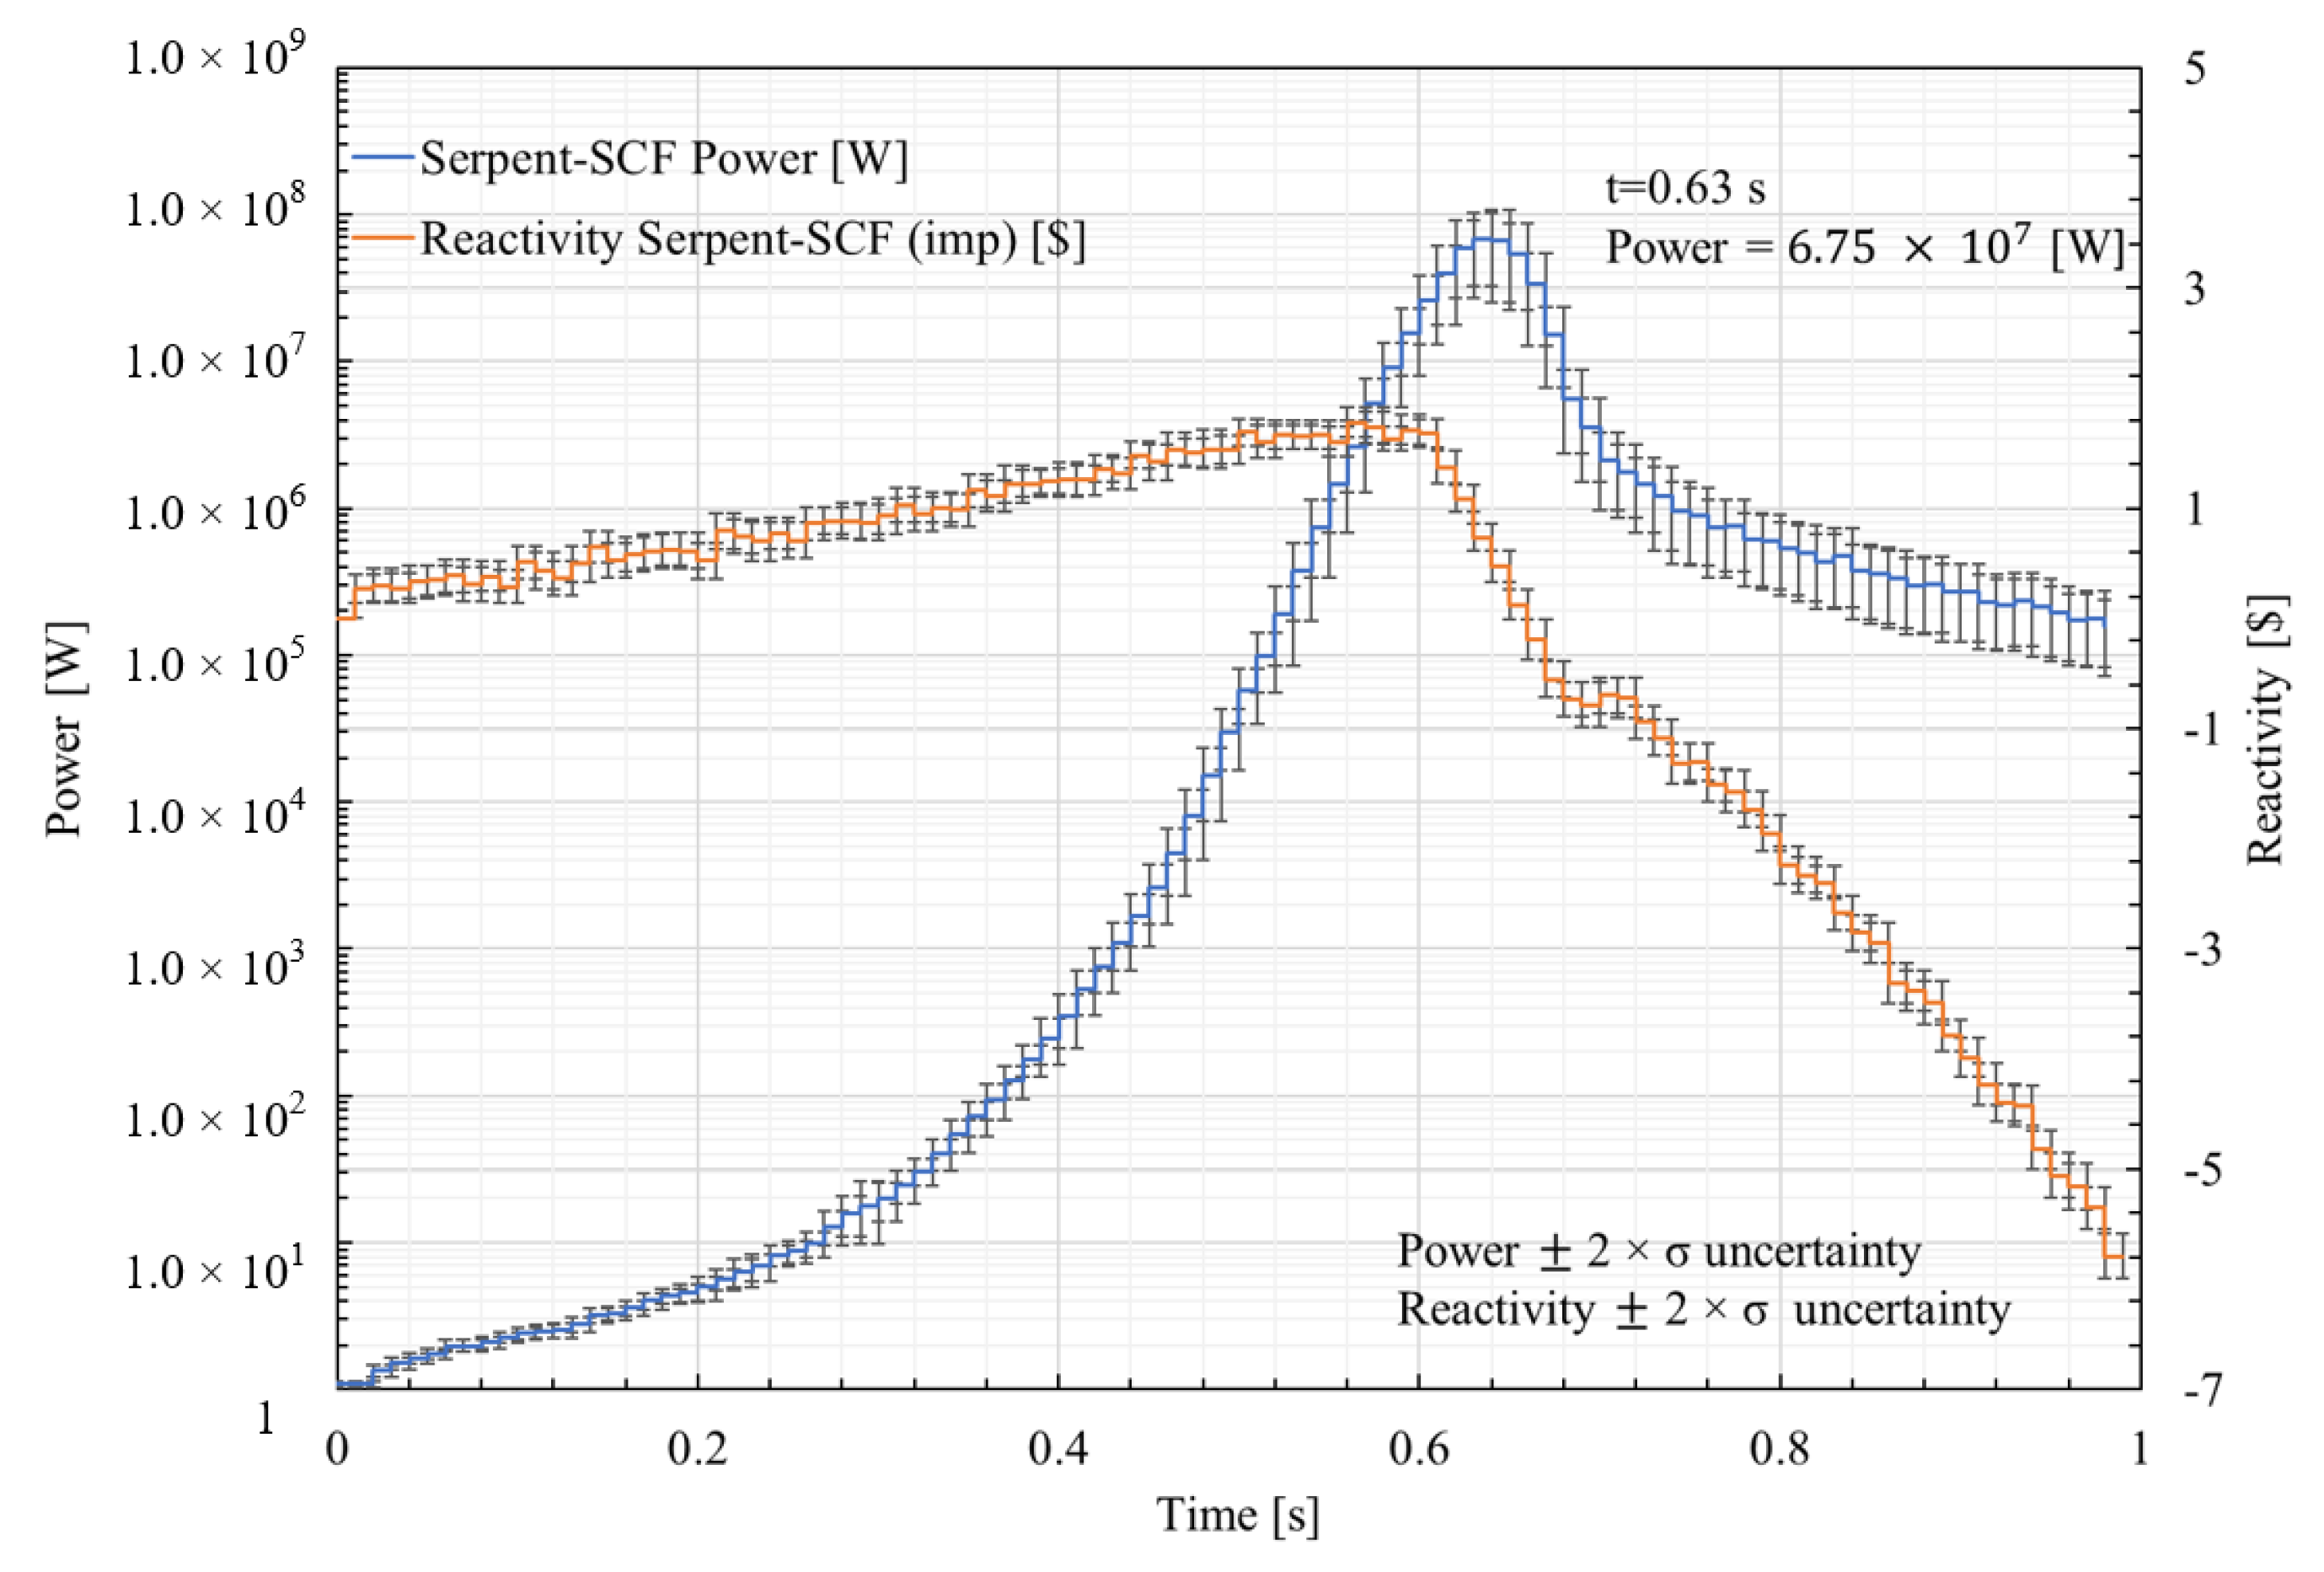
Global results:Figure 16 shows the evolution of the power of the core in a time interval of 1 s.
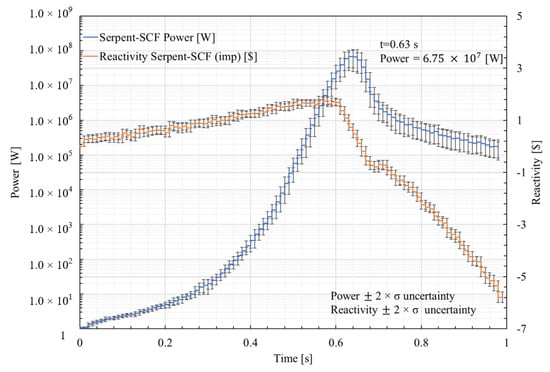
Figure 16.
Predicted power and reactivity evolution during the FRIA scenario (1.5$/0.5 s) as predicted by Serpent2/Subchanflow.
It is observed that the power increases from 1 W to a maximum value of 6.75E07 W in 0.63 s due to the positive reactivity insertion. After 0.63 s, the power starts to decrease, reaching W at 1 s. The evolution of the reactivity shows that as long as it is positive, the power increases, and when the reactivity becomes negative, the power decreases. It can be observed that the power increase is stopped partly by the Doppler and moderator reactivity coefficients and partly by the re-insertion of the control plates that starts at 0.5 s.
It is worth noting that the statistical error of the power evolution increases until the power peaks, and it remains larger than that of the initial time, while the statistical error of the reactivity is similar during the whole transient time.
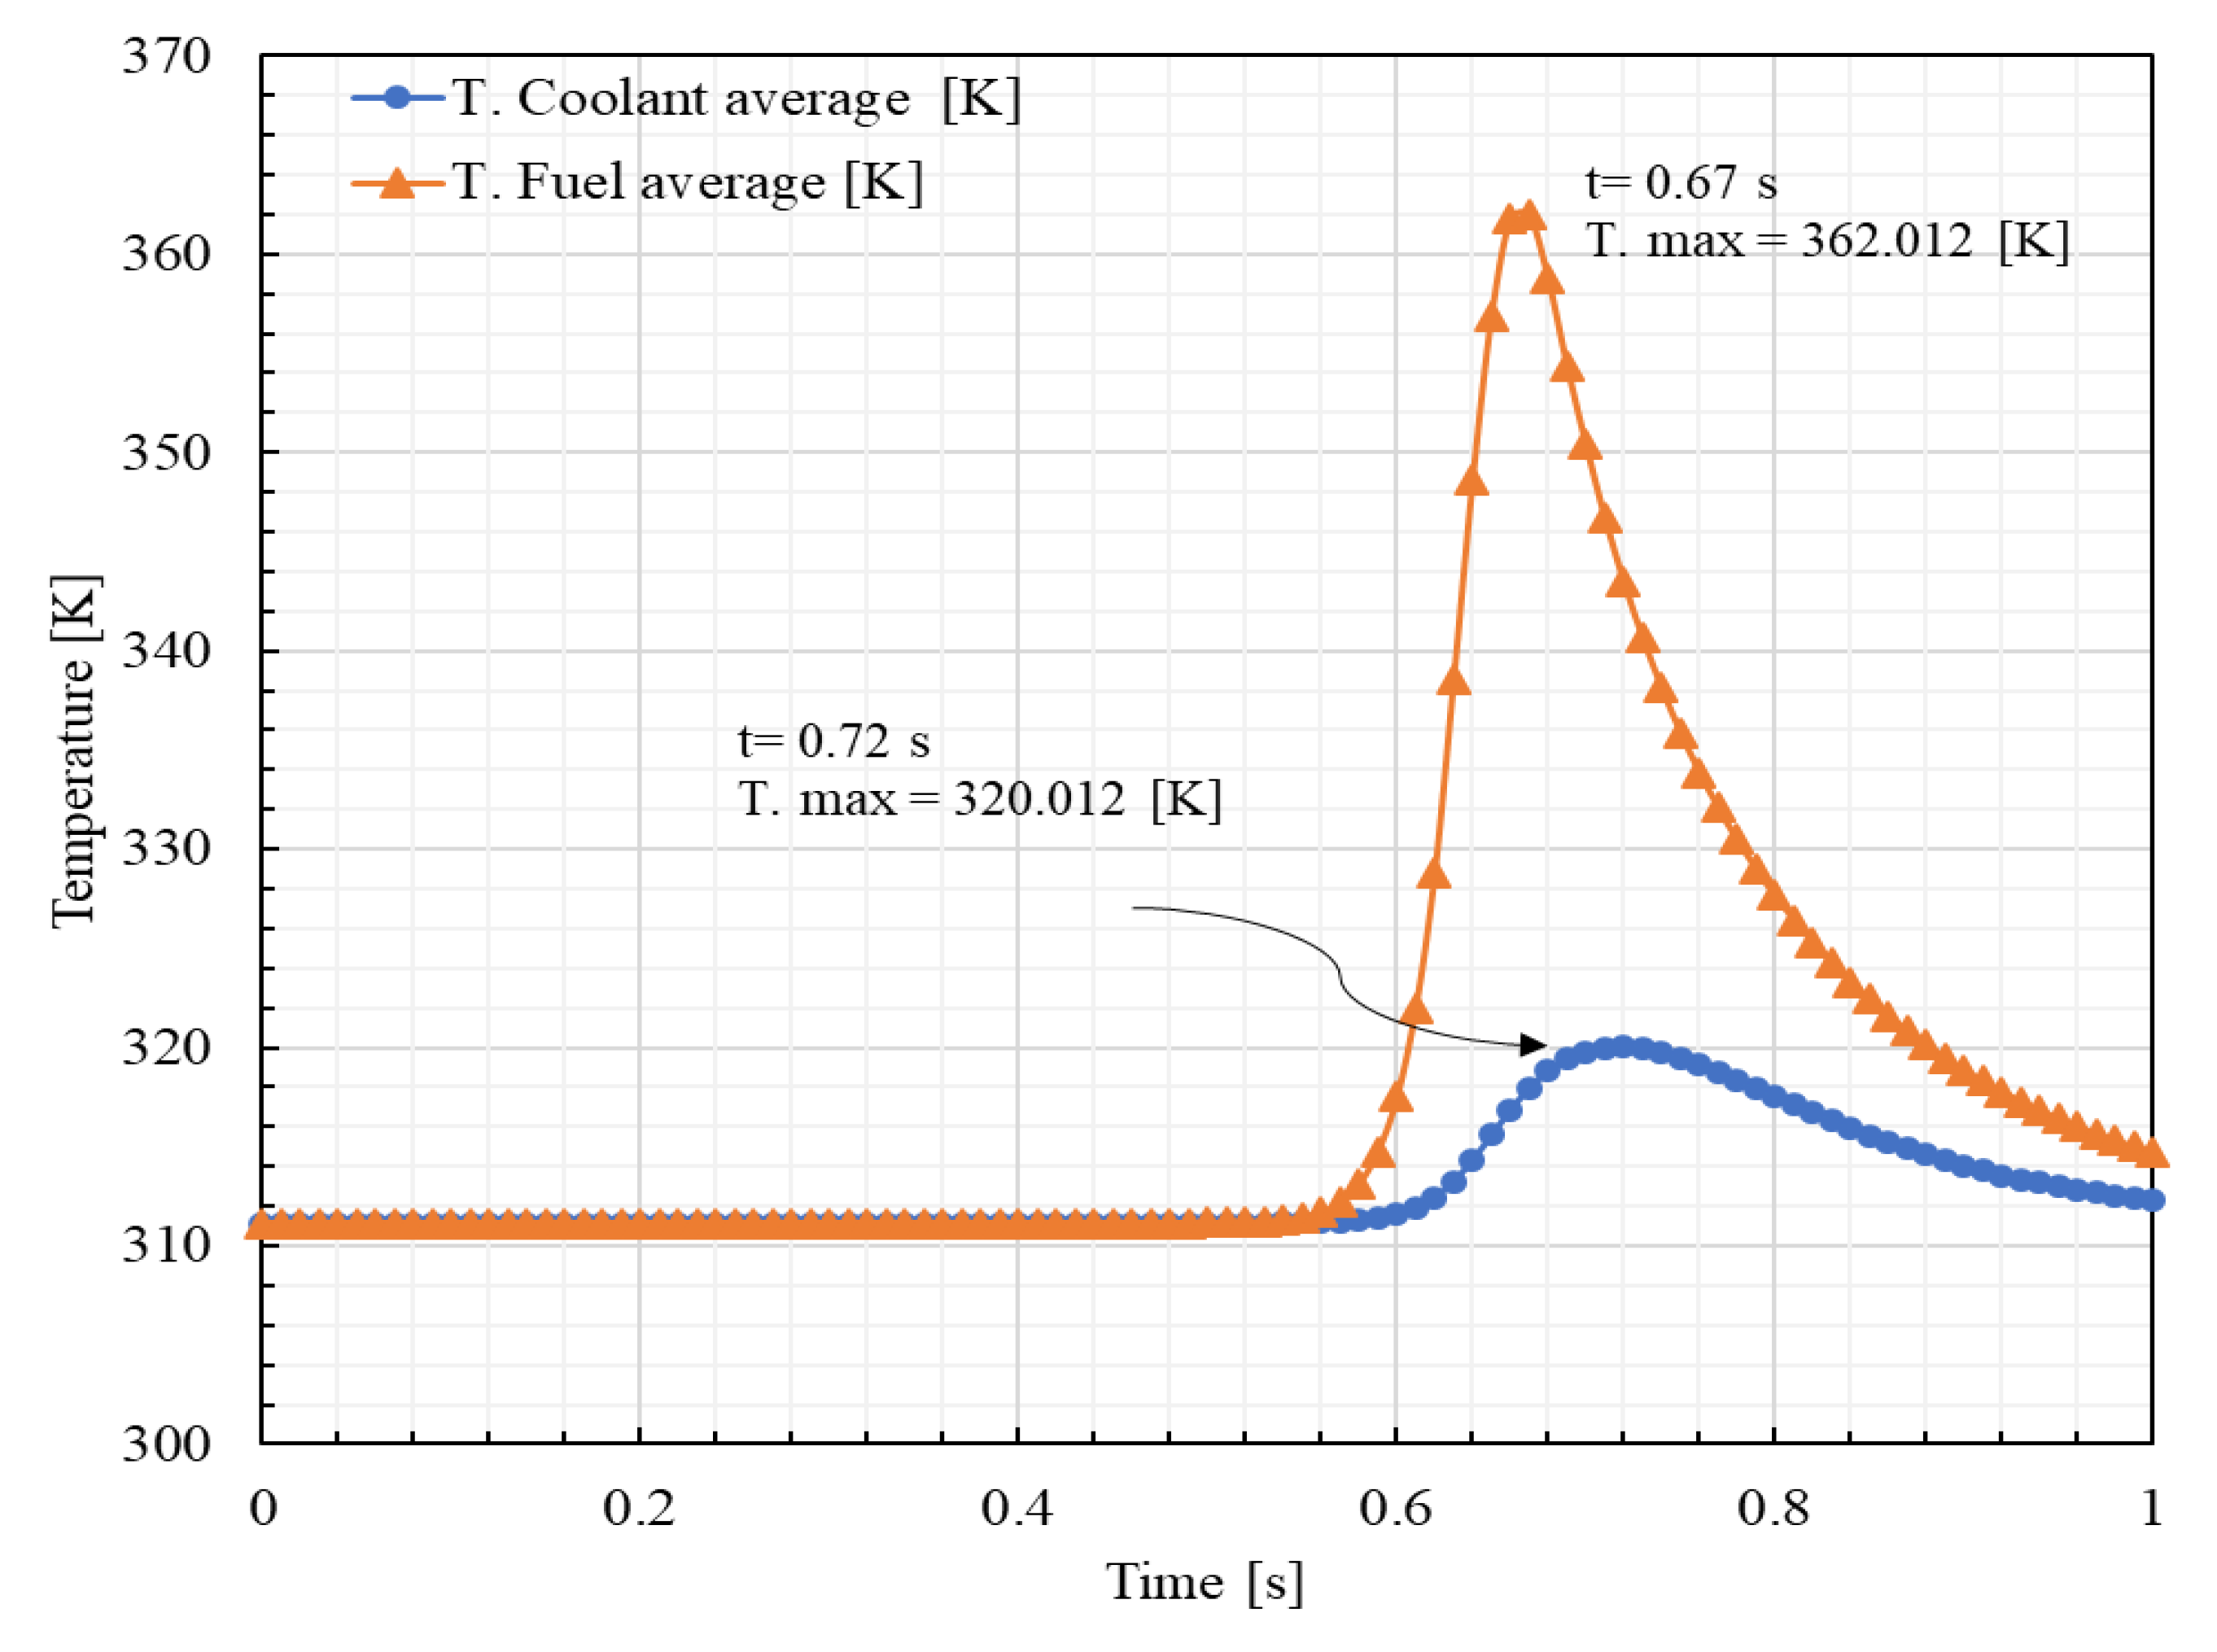
In Figure 17, the evolution of the core averaged temperature of the fuel and coolant during the transient time of 1 s is presented. It is observed that the temperature peaks are at different times. The peak of the fuel temperature occurs at 0.67 s with a maximum value of 362.012 K. The coolant temperature peak is at 0.72 s with a maximum value of 320.012 K. The time difference of 0.05 s is expected, since the heat deposited in the fuel needs some time to achieve in the coolant.
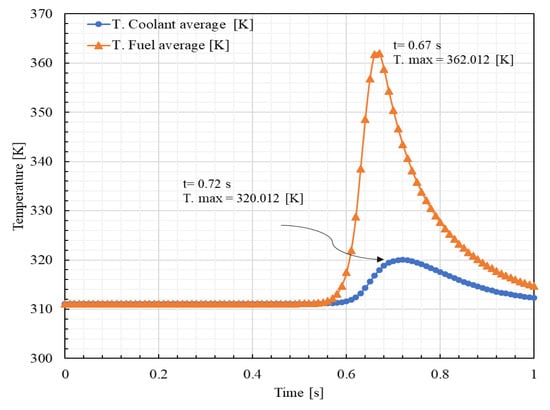
Figure 17.
Core-averaged fuel and coolant temperature for the FRIA scenario (1.5$/0.5 s) as predicted by Serpent2/Subchanflow.
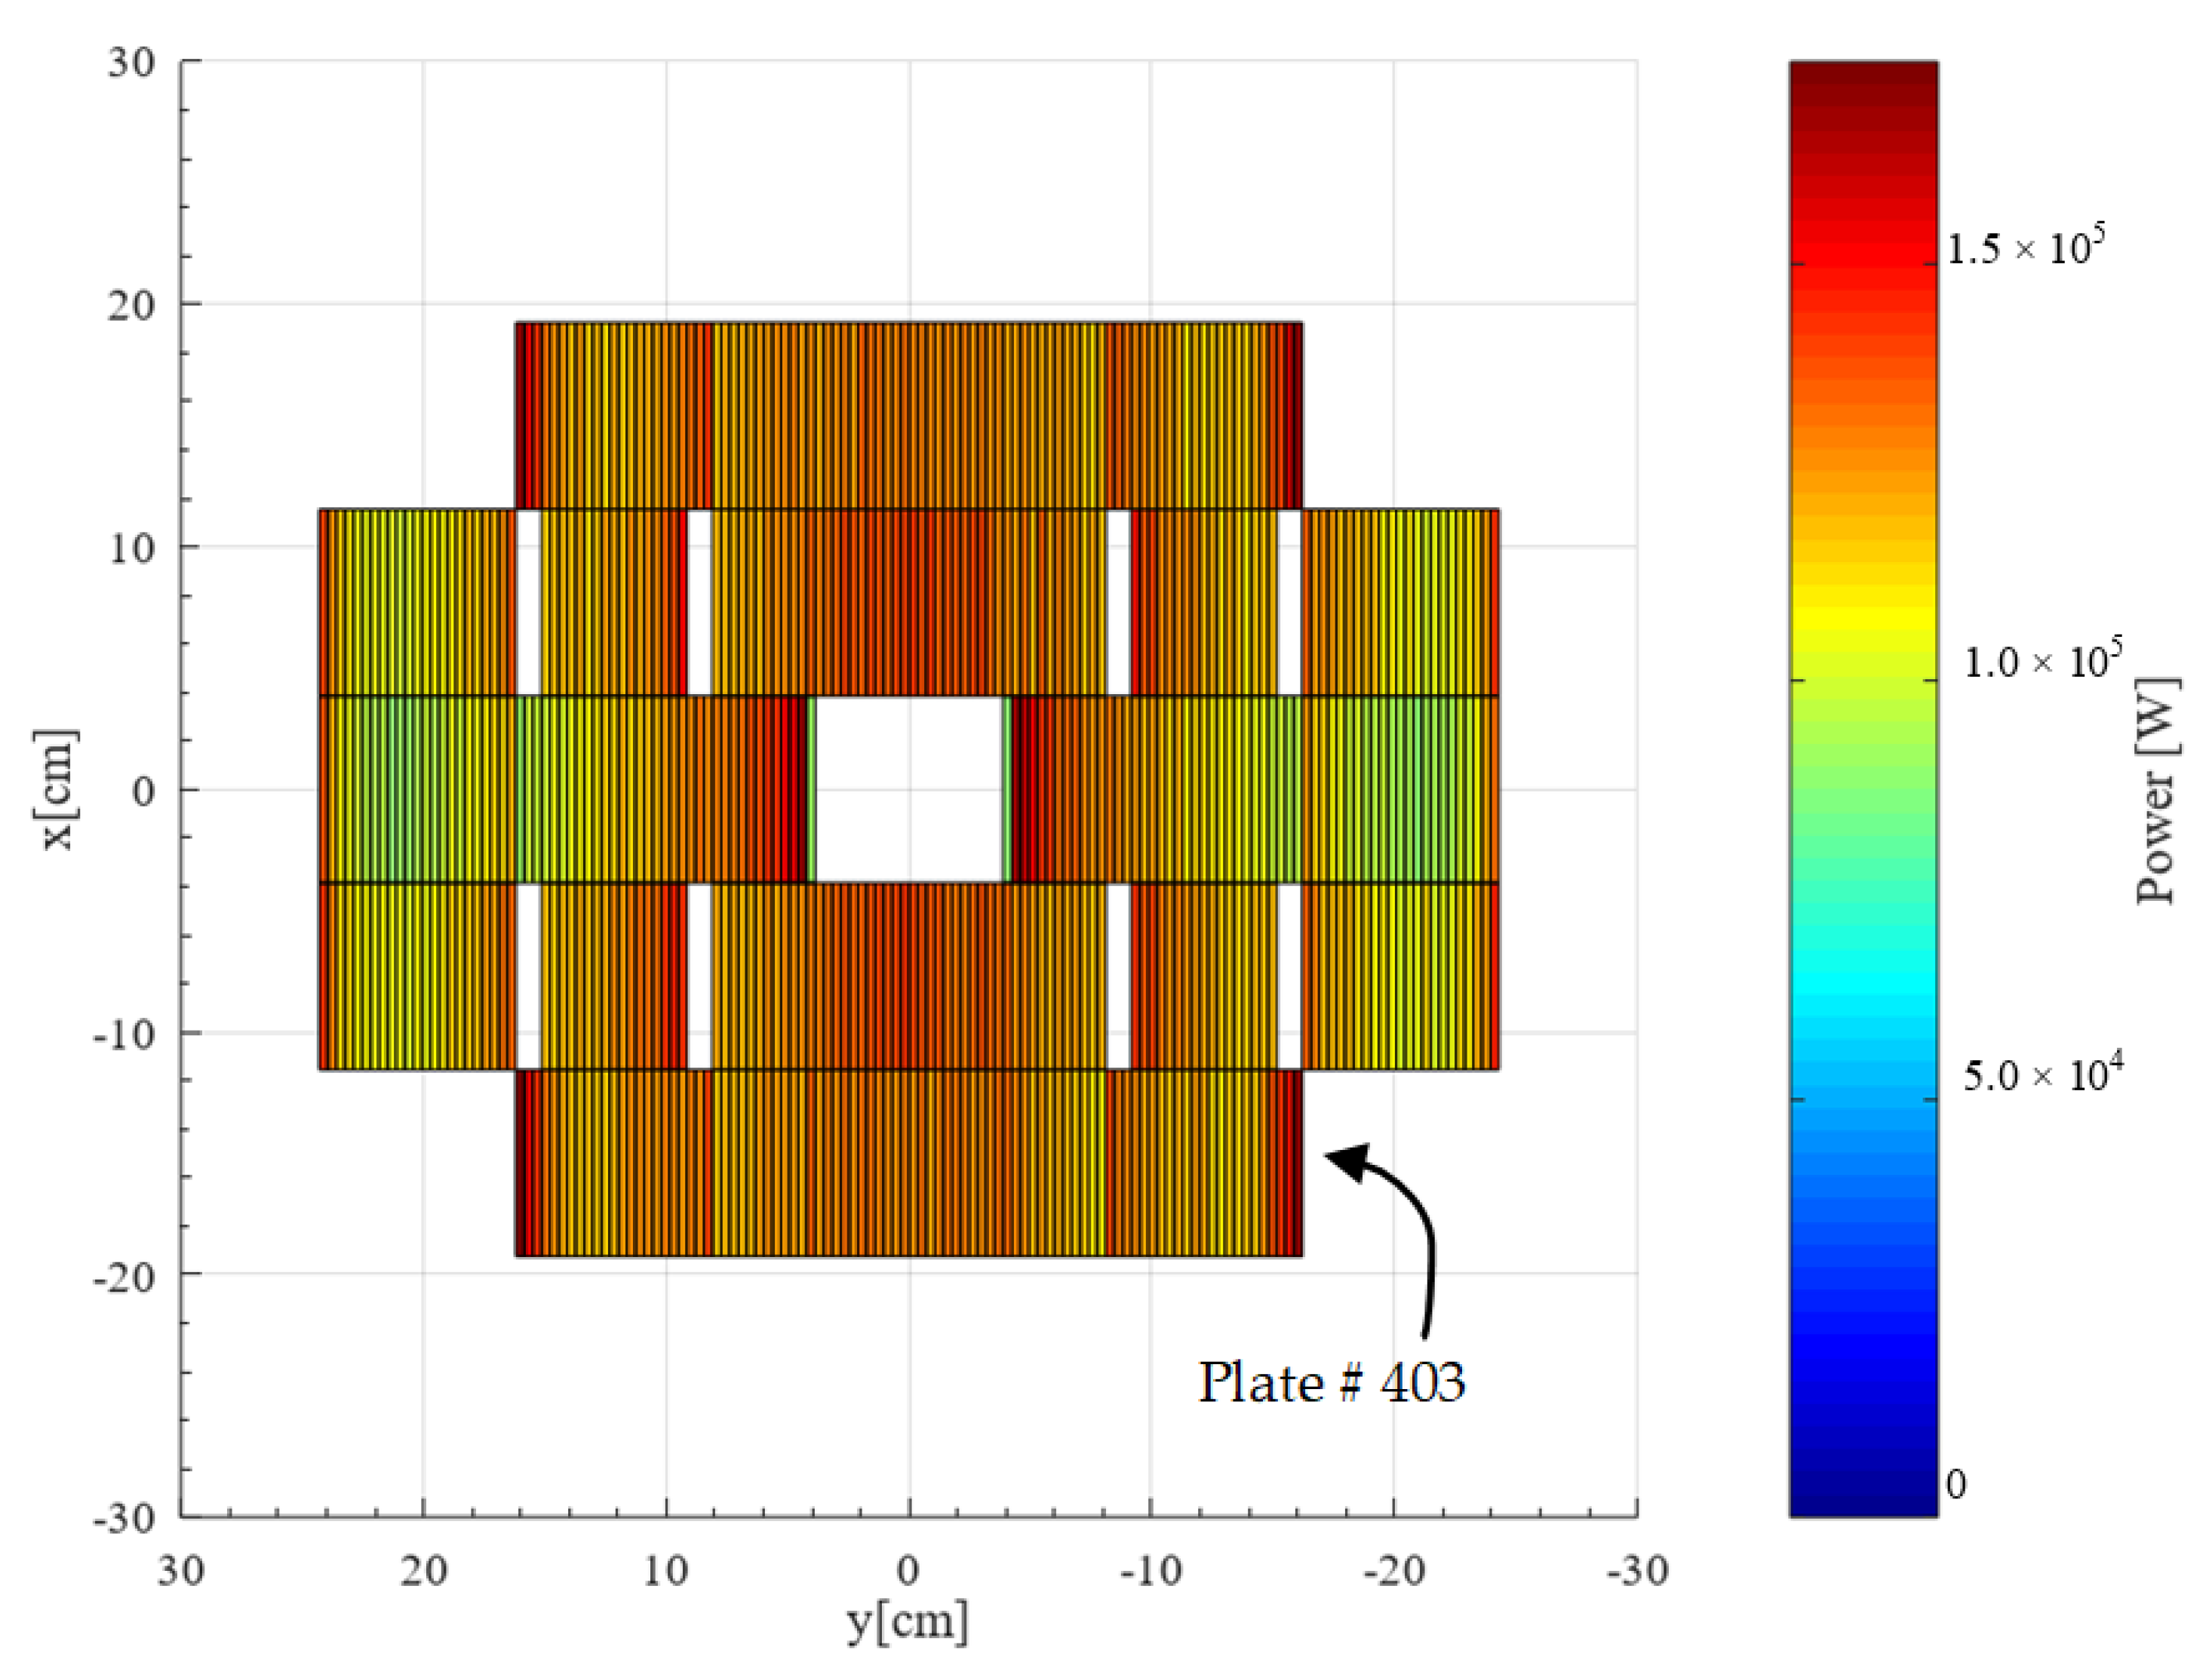
Local results: The benefit of using the new Serpent2/Subchanflow version is the ability to predict local parameters such as plate and channel power and temperature. Figure 18 gives the plate power predicted by the coupled code at 0.63 s transient time. There, the value and location of the plates with maximum and minimum power can easily be identified. The plate with the maximum power is # 403, located in the lower right corner of the core (see Figure 7).
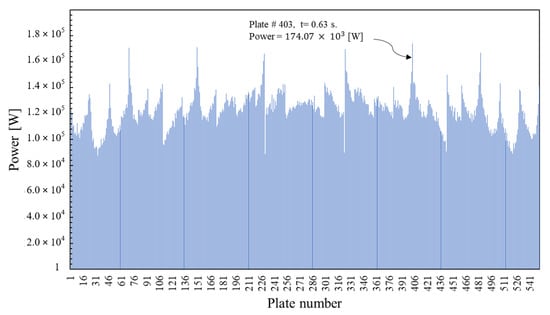
Figure 18.
Identification of the power of each plate (1.5$/0.5 s).
Figure 19 presents the plate-by-plate 2D radial power distribution at 0.63 s. The power peaks are at the center and at the edges of the core, close to the wider water channels, since the moderation is higher than in the normal subchannels. The maximum power value is found in plate # 403. These results show for the first time a plate-by-plate power distribution using Serpent2/Subchanflow, unlike previous analyses using point kinetics or nodal diffusion codes, which usually assumed a uniform power distribution.

Figure 19.
Radial power distribution, plate by plate, predicted for the FRIA scenario.
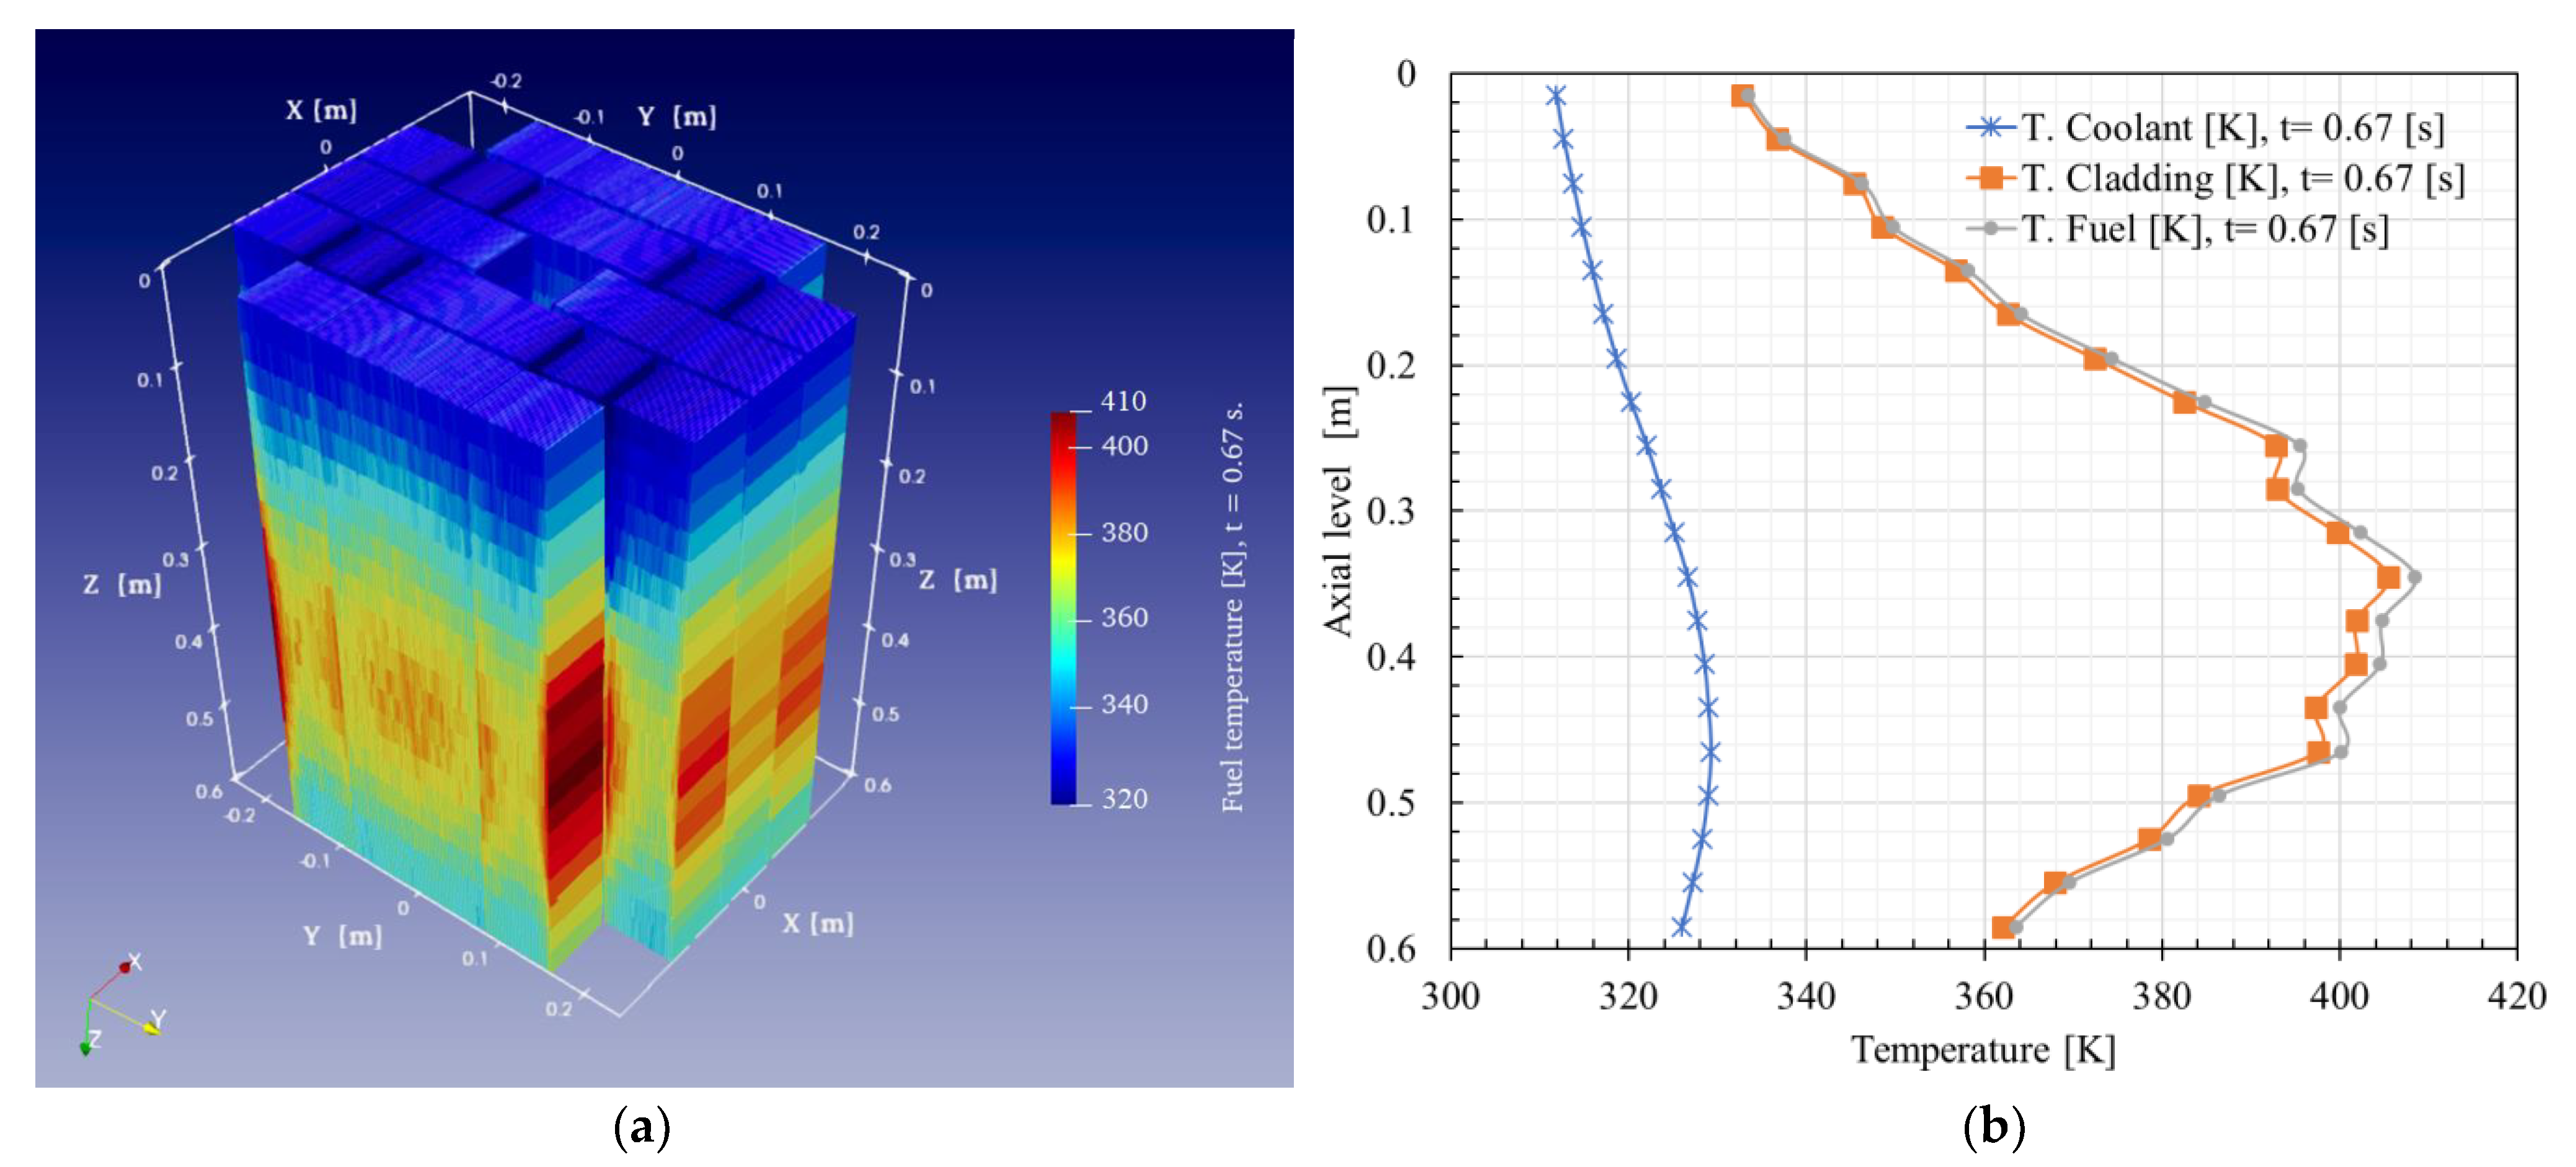
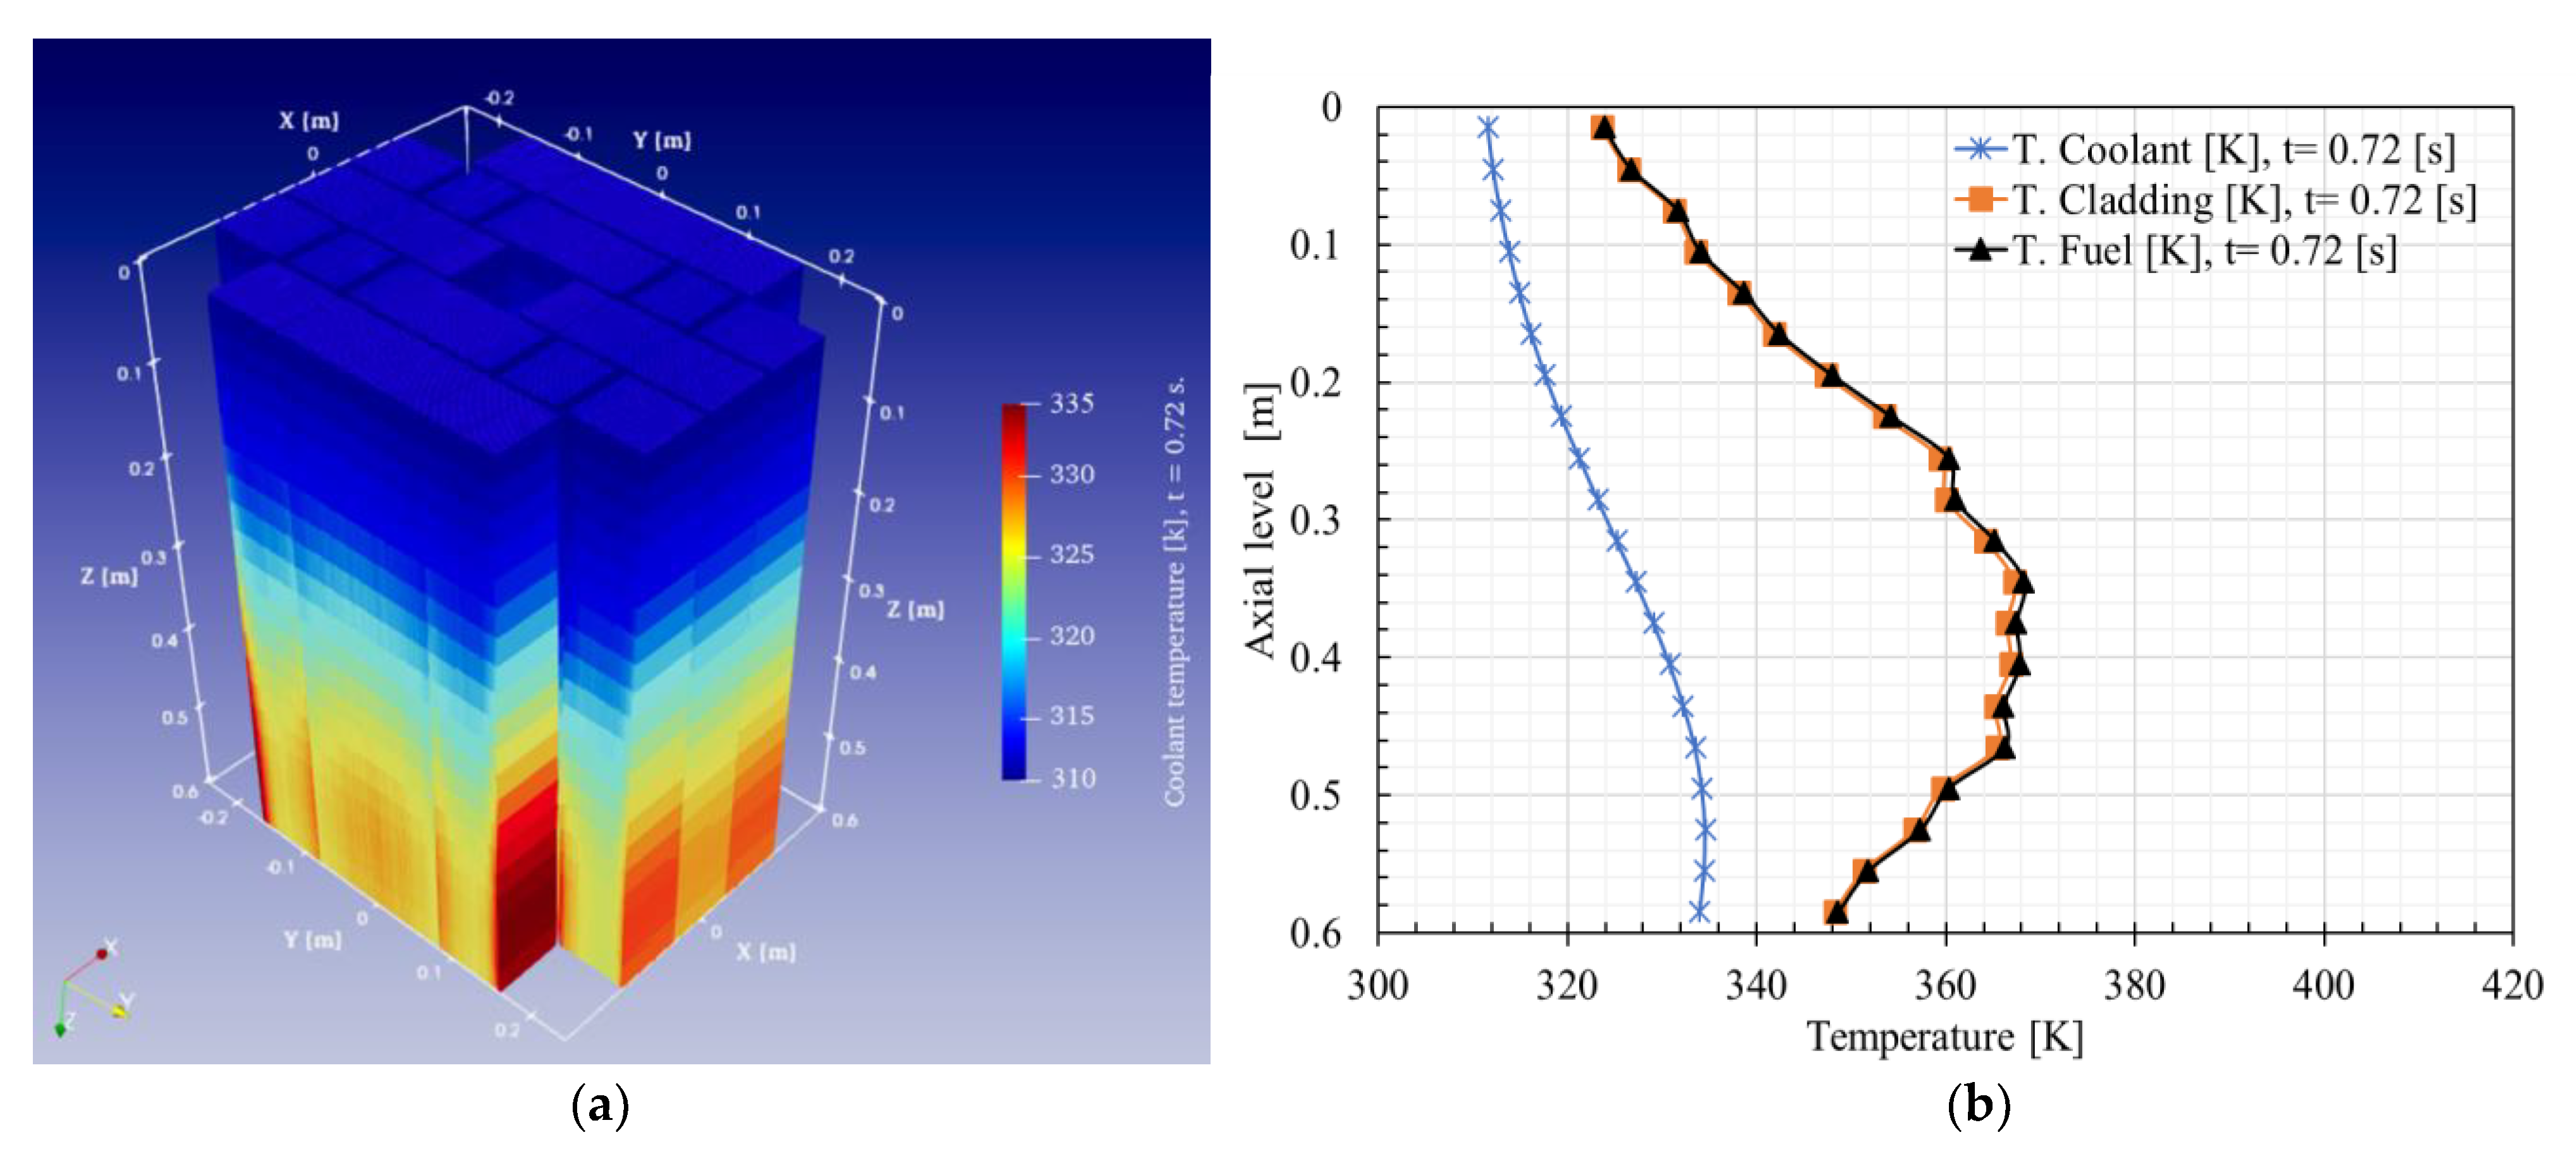
Figure 20a and Figure 21a present the radial and axial temperature distribution of the fuel and coolant at 0.67 s and 0.72 s transient time of the core. Figure 20b shows the coolant, cladding and fuel temperature profiles for the plate/channel # 403. The maximum values are at 0.35 cm measured from the top with a value of 408.44 K and 405.44 K for the fuel and cladding, respectively. Figure 21b shows the temperature profiles at 0.73 s. There it is observed that in comparison to Figure 20b, the maximum temperature values of the cladding and fuel decrease from 408.44 K and 405.44 K to 367.24 K and 368.23 K, respectively and that the temperature profile of the coolant increases from 326.01 K to 334.0 K at the core outlet.

Figure 20.
Serpent2/Subchanflow prediction at 0.67 s of: (a) full core 3D fuel temperature; (b) axial temperature distribution of plate/channel # 403.

Figure 21.
Serpent2/Subchanflow prediction at 0.72 s of: (a) full core 3D fuel temperature; (b) axial temperature distribution of plate/channel # 403.
The computational time was approximately 18 h using a LINUX cluster with 48 cores. The parallel simulation was carried out using OpenMP in a machine with the following characteristics: Intel(R) Xeon(R) Gold 5118 CPU @ 2.30 GHz.
4.2.3. Power and Reactivity Evolution of the Slow Reactivity Insertion (SRIA 1$/10 s) Scenario
The initial conditions for the SRIA scenario are the following:
- Steady-state conditions at cold zero power conditions with 1 W power.
- From the stationary reactor condition, a positive reactivity ramp with the insertion of 1$ during 10 s.
- The reactor is shutdown when the set point of 12E6 W is achieved by inserting all control elements (10$, insertion time 0.5 s) with a delay of 25 ms.
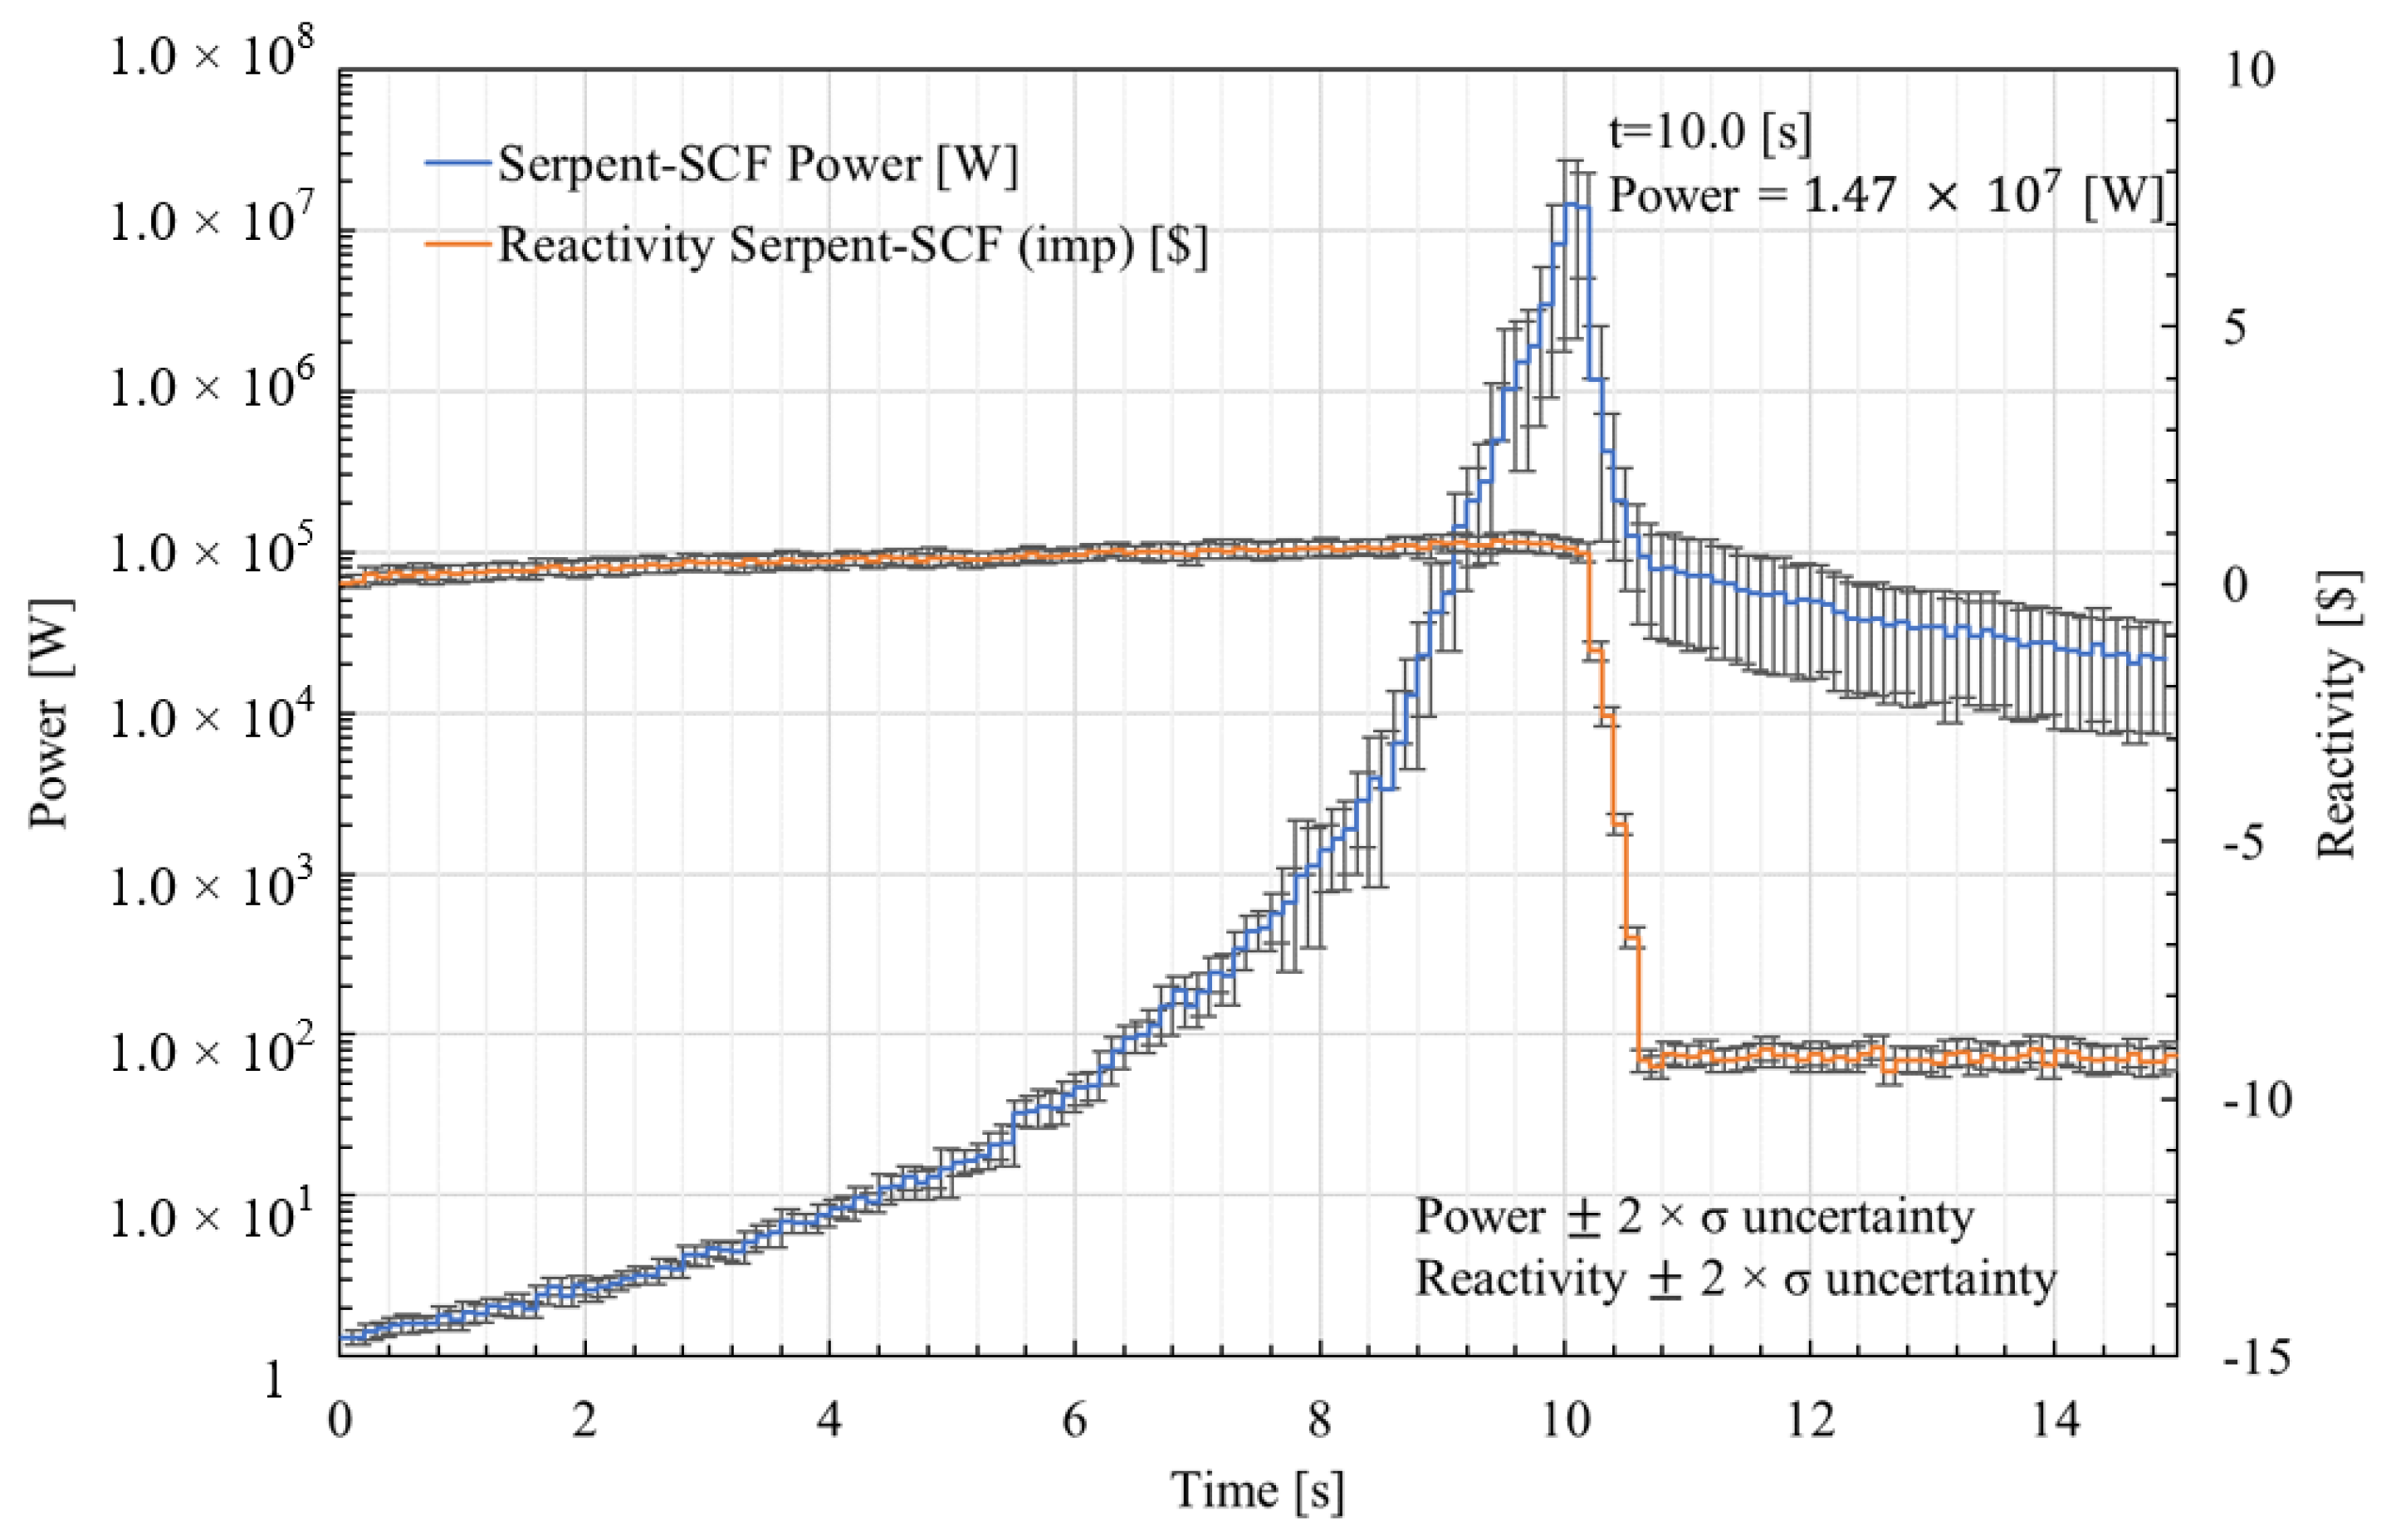
Global results:Figure 22 shows the evolution of the reactor core power during the first 10 s of the transient, together with the reactivity insertion. It can be observed that the power increases slowly due to the extraction of the control plates until 10.2 s. At 10 s, a maximum power of 1.47E7 W is reached. Afterwards, the control plates are inserted into the core, providing a negative reactivity of around −9.0027$/0.5 s. As consequence, the power decreases, reaching a value of W at 15 s.
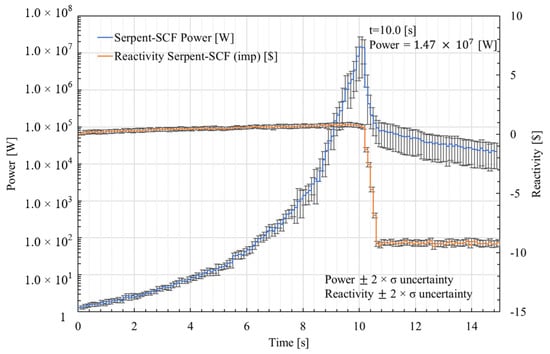
Figure 22.
Power and reactivity evolution predicted by Serpent2/Subchanflow for the slow RIA scenario (SRIA, 1$/10 s).
Here, again, it can be observed that the statistical error of the power increases with increasing power and is larger after the core is shutdown, since the number of neutrons reduces dramatically.
In this case, the power increase is stopped partly by the Doppler and moderator reactivity coefficient, and partly by the start of the control plate’s insertion into the core, as shown in Figure 23.
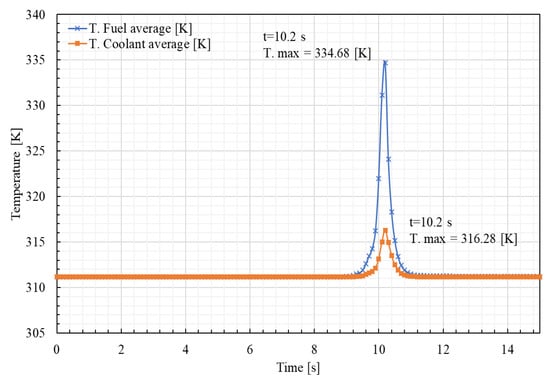
Figure 23.
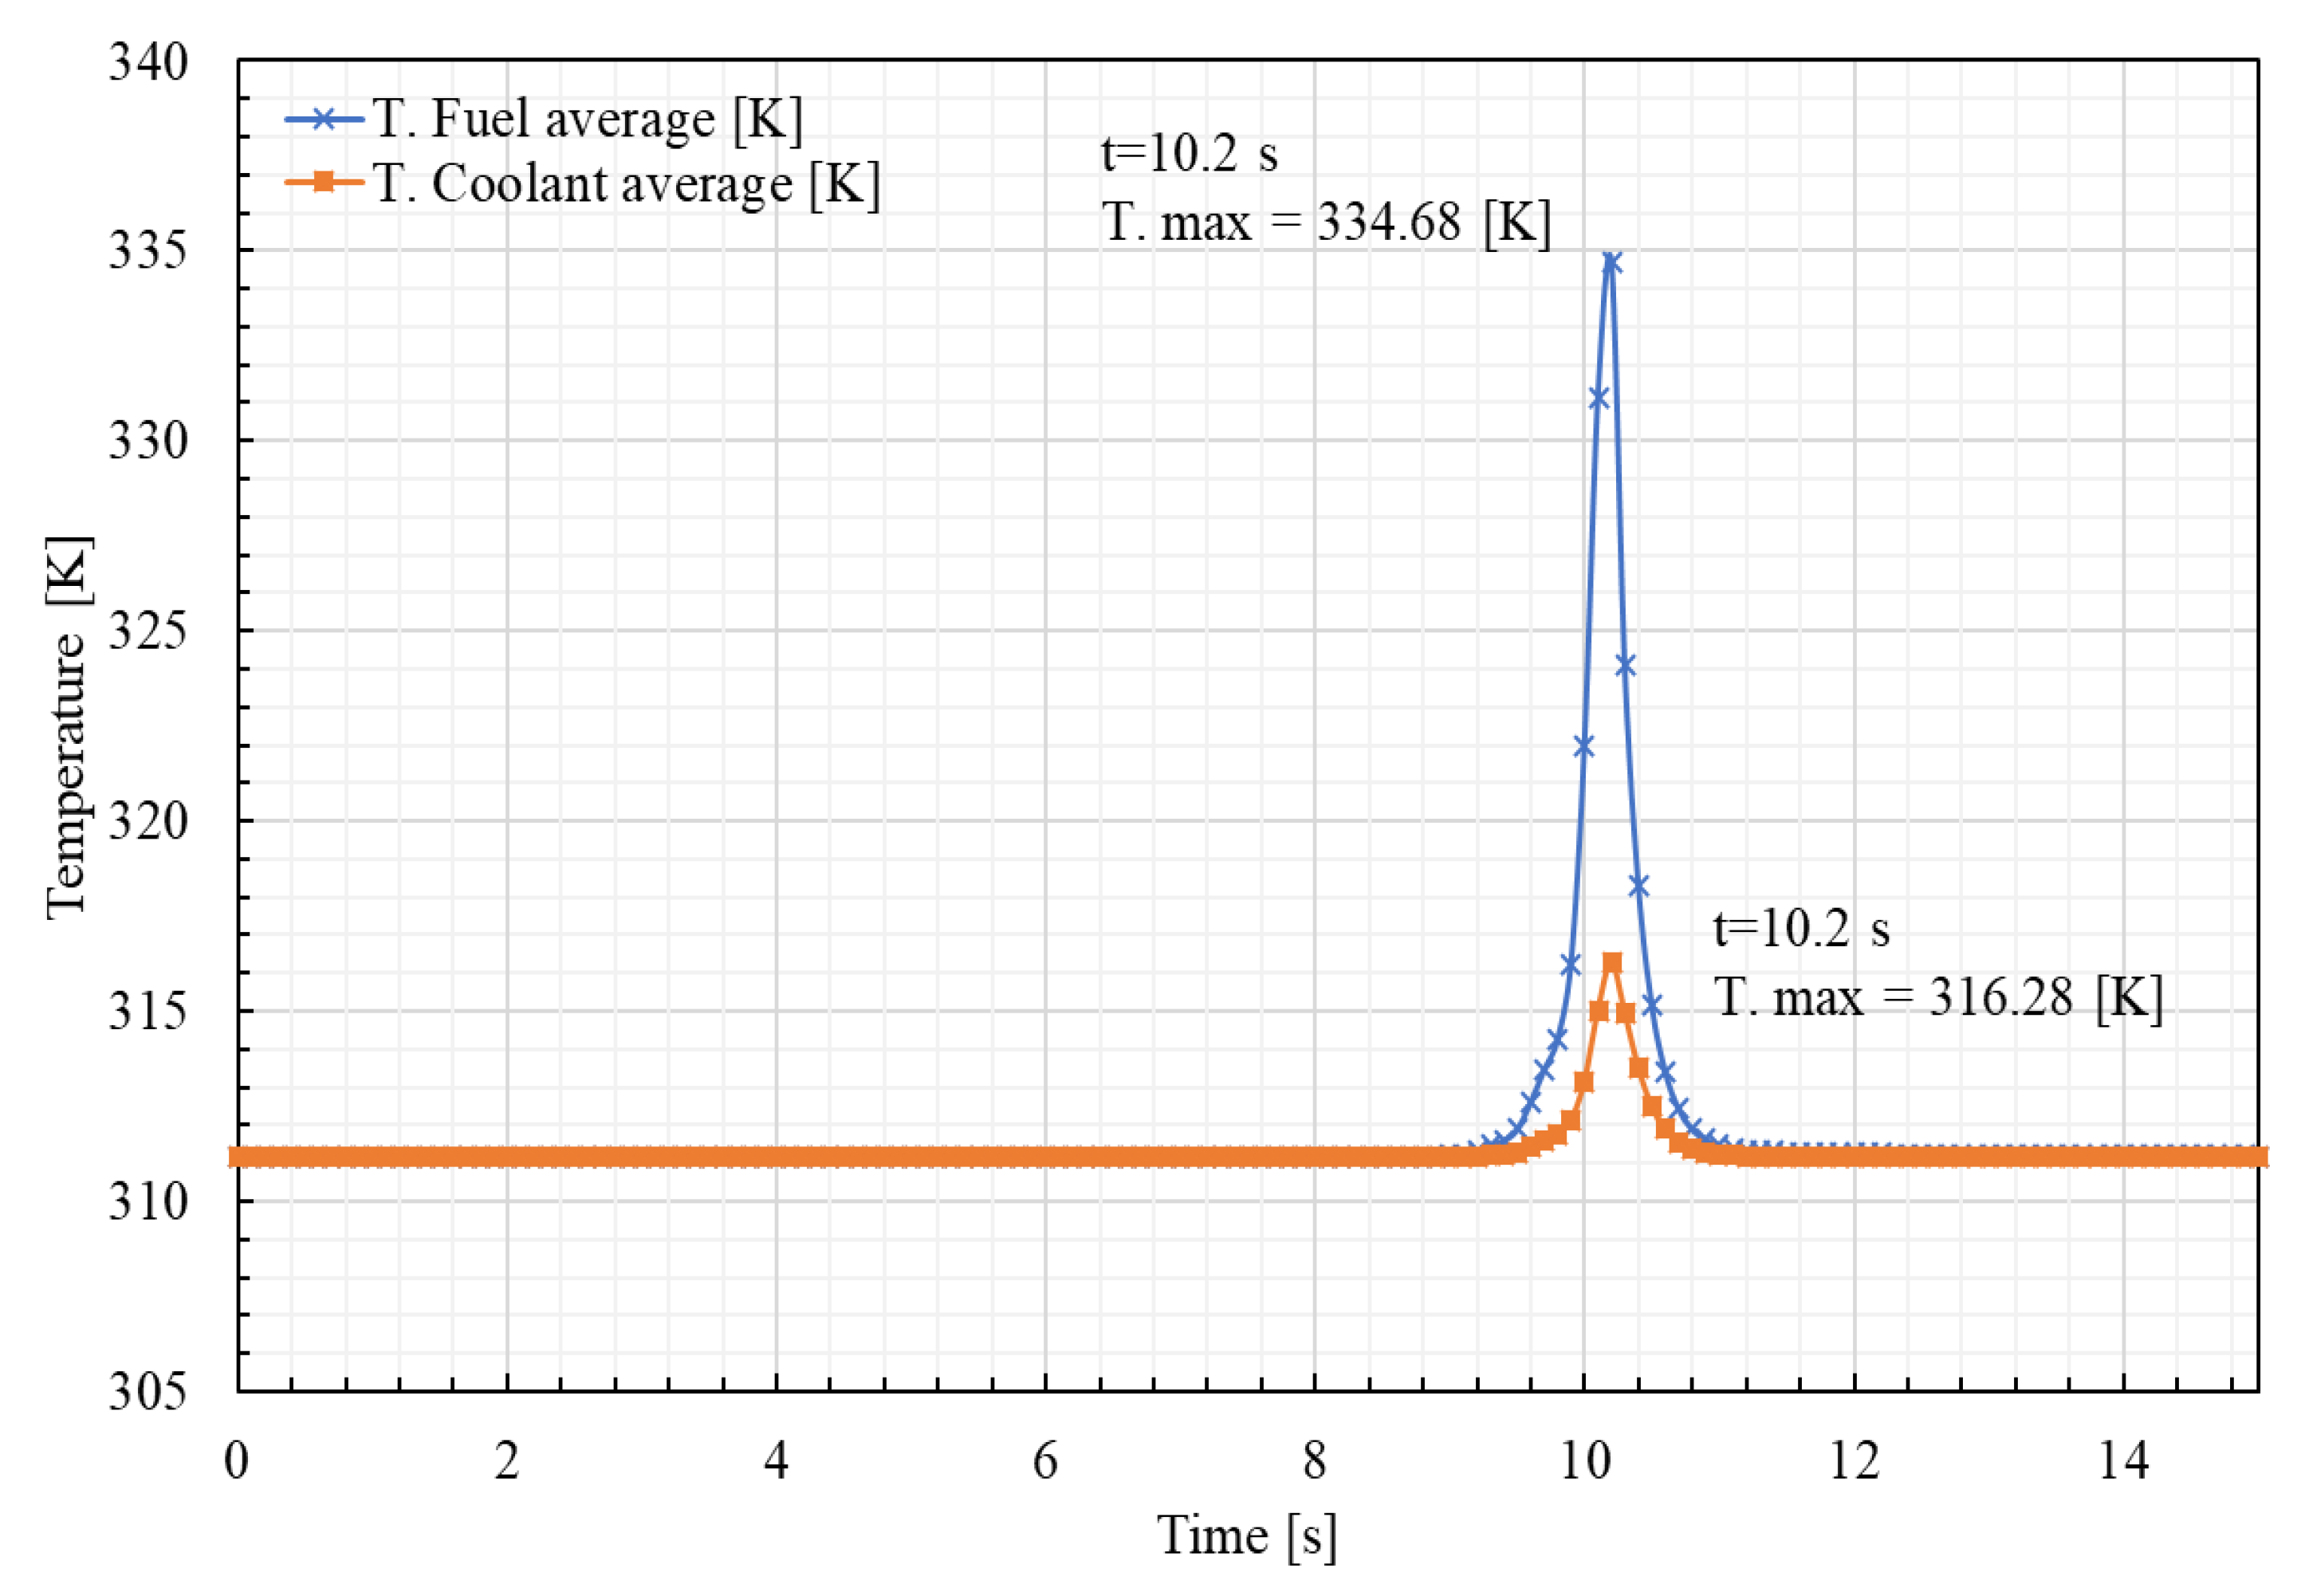
Evolution of the fuel and core-averaged coolant temperature during the first 17 s. (1$/10 s).
As shown in Figure 23, the core-averaged peak temperatures of the fuel and coolant are 334.68 K and 316.28 K, respectively. Both are found at the same time, 10.2 s. After 11 s there is no significant difference between the initial and final temperatures.
Local results: As discussed before, Figure 24 and Figure 25 are unique in the sense that they allow the identification of local hot spots in the core. In the case of Figure 24, it is observed that the plates with maximum power are in the center of the core and in its surroundings, close to the wider coolant channels. If Figure 18 and Figure 25 are compared, it is observed that the ways in which the power evolves for each plate are quite similar. Hence, the plate with the maximum power is the one with the number # 403.

Figure 24.
Predicted radial power distribution plate by plate for the SRIA scenario.

Figure 25.
Predicted plate power for the SRIA scenario.
Finally, Figure 26a shows the radial and axial representation of the temperature of each of the plates at 10.2 s. In addition, Figure 26b presents the axial temperature distribution of the coolant cladding and fuel of plate # 403 at 10.2 s.

Figure 26.
Serpent2/Subchanflow prediction at 10.2 s of: (a) full core 3D fuel temperature; (b) axial temperature distribution of plate/channel #403.
The maximum temperature values correspond to the cladding with 336.33 K and fuel with 336.73 K at 42 cm measured from the top. The maximum coolant temperature is at the exit of the core and it amounts to 323.68 K.
The computational time was approximately 86 h using a LINUX cluster with 48 cores. The parallel simulation was carried out using OpenMP in a machine with the following characteristics: Intel(R) Xeon(R) Gold 5118 CPU @ 2.30 GHz.
5. Summary and Outlook
This paper presents the state of the art in the development of a three-dimensional code for the N-TH analysis of research reactors based on Serpent2/Subchanflow. The peculiarity of these investigations is the degree of detail: each fuel plate and rectangular subchannel is individually described by the coupled system considering the local thermohydraulic feedbacks between the Monte Carlo and the thermohydraulic solver of the subchannel. These high-fidelity multi-physics tools pave the way for the direct prediction of safety parameters without the need to use hot channel factors when assessing research reactor cores.
The one-of-a-kind results obtained from the simulation of the MTR core at full power in steady state and two transient scenarios (FRIA, SRIA) defined by the IAEA-10 MW reactor reference are presented. The maximum and minimum values of steady-state and transient plate/channel temperature and power; the extraction and injection velocities of the control plates for transients (slow and fast); and the reactivity provided in this work can be used as a reference for lower order solutions in the framework of safety analysis.
The version of the code developed for the LWR power reactors has already been validated using the SPERT-III E REA test series. For the validation of the new capabilities of the Serpent2/Subchanflow tool, for licensing applications to the new MTR cores, SPERT-IV tests are being analyzed and will be published soon. The results will provide a comprehensive validation database for this novel simulation tool.
Author Contributions
Conceptualization, J.C.A. and V.H.S.-E.; methodology, J.C.A.; software, J.C.A. and U.I.; validation, J.C.A., V.H.S.-E. and U.I.; formal analysis, J.C.A., V.H.S.-E. and U.I.; writing—original draft preparation, J.C.A.; writing—review and editing, V.H.S.-E. and U.I.; visualization, J.C.A.; supervision, V.H.S.-E.; project administration, V.H.S.-E. All authors have read and agreed to the published version of the manuscript.
Funding
The financial support of the Ecuadorian National Secretary for Higher Education, Science, Technology and Innovation (SENESCYT) is highly appreciated, ACUERDO No. SENESCYT-2018-037.
Institutional Review Board Statement
Not applicable.
Informed Consent Statement
Not applicable.
Data Availability Statement
Not applicable.
Acknowledgments
The authors are grateful for the advice of the Serpent team, especially V. Valtavirta) and colleagues D. Ferraro and M. Garcia regarding their research developing Monte Carlo-based multi-physics codes. The authors acknowledge Marat Margulis for the fruitful discussions and his support regarding the Monte Carlo modeling of research reactors.
Conflicts of Interest
The authors declare no conflict of interest.
References
- Chao, J.; Cheung, Y.K.; Olson, A.P. COBRA-3C/RERTR, a Subchannel Code for Research and Test Reactors. Trans. Am. Nucl. Soc. 1980, 34, 892–893. [Google Scholar]
- Ahmed, K. Thermal-Hydraulic Fortran Program for Steady-State Calculations of Plate-Type Fuel Research Reactors. Nucl. Technol. Radiat. Prot. 2008, 23, 19–30. [Google Scholar] [CrossRef]
- Koppers, V.; Koch, M.K. Heuristic Methods in Modelling Research Reactors for Deterministic Safety Analysis. Atw Int. Z. Fuer Kernenerg. 2018, 63, 464–468. [Google Scholar]
- Margulis, M.; Gilad, E. Development and Verification of the Dynamic System Code THERMO-T for Research Reactor Accident Analysis. Nucl. Technol. 2016, 196, 377–395. [Google Scholar] [CrossRef]
- Hermansyah, H.; Kumaraningrum, A.R.; Purba, J.H.; Edison; Yohda, M. Safety Analysis Technique for System with Limited Data: Case Study of the Multipurpose Research Reactor in Indonesia. Energies 2020, 13, 1975. [Google Scholar] [CrossRef] [Green Version]
- Hamidouche, T.; Bousbia-Salah, A.; Si-Ahmed, E.K.; Mokeddem, M.Y.; D’Auria, F. Application of Coupled Code Technique to a Safety Analysis of a Standard MTR Research Reactor. Nucl. Eng. Des. 2009, 239, 2104–2118. [Google Scholar] [CrossRef]
- Labit, J.-M.; Seiler, N.; Clamens, O.; Merle, E. Thermal-Hydraulic Two-Phase Modeling of Reactivity-Initiated Transients with CATHARE2—Application to SPERT-IV Simulation. Nucl. Eng. Des. 2021, 381, 111310. [Google Scholar] [CrossRef]
- Ferraro, D.; Valtavirta, V.; García, M.; Imke, U.; Tuominen, R.; Leppänen, J.; Sanchez-Espinoza, V. OECD/NRC PWR MOX/UO2 Core Transient Benchmark Pin-by-Pin Solutions Using Serpent/SUBCHANFLOW. Ann. Nucl. Energy 2020, 147, 107745. [Google Scholar] [CrossRef]
- Almachi, J.C.; Imke, U.; Sanchez-Espinoza, V.H. Extension of Subchanflow for Thermal Hydraulic Analysis of MTR-Core. In Proceedings of the European Research Reactor Conference, Online, 12–15 October 2020; pp. 1–10. [Google Scholar] [CrossRef]
- Almachi, J.C.; Sánchez-Espinoza, V.; Imke, U. Extension and Validation of the SubChanFlow Code for the Thermo-Hydraulic Analysis of MTR Cores with Plate-Type Fuel Assemblies. Nucl. Eng. Des. 2021, 379, 111221. [Google Scholar] [CrossRef]
- Zhang, H.; Guo, J.; Lu, J.; Li, F.; Xu, Y.; Downar, T.J. An Assessment of Coupling Algorithms in HTR Simulator TINTE. Nucl. Sci. Eng. 2018, 190, 287–309. [Google Scholar] [CrossRef]
- Ferraro, D.; García, M.; Valtavirta, V.; Imke, U.; Tuominen, R.; Leppänen, J.; Sanchez-Espinoza, V. Serpent/SUBCHANFLOW Pin-by-Pin Coupled Transient Calculations for the SPERT-IIIE Hot Full Power Tests. Ann. Nucl. Energy 2020, 142, 107387. [Google Scholar] [CrossRef]
- Ernesto Ferraro, D. Monte Carlo-Based Multi-Physics Analysis for Transients in Light Water Reactors. Ph.D. Thesis, Karlsruher Institut für Technologie (KIT), Karlsruhe, Germany, 2021. [Google Scholar] [CrossRef]
- International Atomic Energy Agency. Research Reactor Core Conversion from the Use of Highly Enriched Uranium Fuels: Guidebook; IAEA: Vienna, Austria, 1980; Volume IAEA-TECDOC-233. [Google Scholar]
- International Atomic Energy Agency. Research Reactor Core Conversion Guidebook; Volume 3: Analytical Verification (Appendices G and H); IAEA: Vienna, Austria, 1992; Volume IAEA-TECDOC-643. [Google Scholar]
- Arkani, M.; Hassanzadeh, M.; Khakshournia, S. Calculation of Six-Group Importance Weighted Delayed Neutron Fractions and Prompt Neutron Lifetime of MTR Research Reactors Based on Monte Carlo Method. Prog. Nucl. Energy 2016, 88, 352–363. [Google Scholar] [CrossRef]
- Margulis, M.; Gilad, E. Monte Carlo and Nodal Neutron Physics Calculations of the IAEA MTR Benchmark Using Serpent/DYN3D Code System. Prog. Nucl. Energy 2016, 88, 118–133. [Google Scholar] [CrossRef]
- Leppänen, J.; Pusa, M.; Viitanen, T.; Valtavirta, V.; Kaltiaisenaho, T. The Serpent Monte Carlo Code: Status, Development and Applications in 2013. Ann. Nucl. Energy 2015, 82, 142–150. [Google Scholar] [CrossRef]
- Leppänen, J.; Viitanen, T.; Valtavirta, V. Multi-Physics Coupling Scheme in the Serpent 2 Monte Carlo Code. In Proceedings of the ANS Annual Winter Meeting 2012, San Diego, CA, USA, 11–15 November 2012; American Nuclear Society (ANS): La Grange Park, IL, USA, 2012; pp. 1165–1168. [Google Scholar]
- Valtavirta, V. Development and Applications of Multi-Physics Capabilities in a Continuous Energy Monte Carlo Neutron Transport Code. Ph.D. Thesis, Aalto University, Espoo, Finland, 2017. [Google Scholar]
- Valtavirta, V. Multi-Physics Interface. Available online: http://serpent.vtt.fi/mediawiki/index.php/Multi-physics_interface (accessed on 19 January 2022).
- Viitanen, T.; Leppänen, J. Explicit Treatment of Thermal Motion in Continuous-Energy Monte Carlo Tracking Routines. Nucl. Sci. Eng. 2012, 171, 165–173. [Google Scholar] [CrossRef]
- Leppänen, J.; Hovi, V.; Ikonen, T.; Kurki, J.; Pusa, M.; Valtavirta, V.; Viitanen, T. The Numerical Multi-Physics Project (NUMPS) at VTT Technical Research Centre of Finland. Ann. Nucl. Energy 2015, 84, 55–62. [Google Scholar] [CrossRef]
- Imke, U.; Sanchez, V.H. Validation of the Subchannel Code SUBCHANFLOW Using the NUPEC PWR Tests (PSBT). Sci. Technol. Nucl. Install. 2012, 2012, 465059. [Google Scholar] [CrossRef]
- Tuominen, R.; Valtavirta, V.; García, M.; Ferraro, D.; Leppänen, J. Effect of Energy Deposition Modelling in Coupled Steady State Monte Carlo Neutronics/Thermal Hydraulics Calculations. International Conference on Physics of Reactors: Transition to a Scalable Nuclear Future, PHYSOR 2020, Proceedings of the EDP Sciences—Web of Conferences. 2020. Available online: https://www.epj-conferences.org/articles/epjconf/abs/2021/01/epjconf_physor2020_06001/epjconf_physor2020_06001.html (accessed on 24 January 2022).
- Valtavirta, V.; Hessan, M.; Leppänen, J. Delayed Neutron Emission Model for Time Dependent Simulations with the Serpent 2 Monte Carlo Code. In PHYSOR 2016: Unifying Theory and Experiments in the 21st Century; American Nuclear Society (ANS): Washington, DC, USA, 2016. [Google Scholar]
- García, M.; Ferraro, D.; Valtavirta, V.; Imke, U.; Tuominen, R.; Sanchez-Espinoza, V.; Mercatali, L. Development of an Object-Oriented Serpent2-SUBCHANFLOW Coupling and Verification with Problem 6 of the VERA Core Physics Benchmark. In International Conference on Mathematics and Computational Methods Applied to Nuclear Science and Engineering, M and C 2019; American Nuclear Society (ANS): Portland, OR, USA, 2019; pp. 1424–1433. [Google Scholar] [CrossRef]
- Ferraro, D.; Garcia, M.; Imke, U.; Valtavirta, V.; Leppänen, J.; Sanchez-Espinoza, V. Serpent/SCF Pin-Level Multiphysics Solutions for the VERA Fuel Assembly Benchmark. Ann. Nucl. Energy 2019, 128, 102–114. [Google Scholar] [CrossRef]
- Hainoun, A.; Ghazi, N.; Mansour Abdul-Moaiz, B. Safety Analysis of the Reference Research Reactor MTR during Reactivity Insertion Accident Using the Code MERSAT. Ann. Nucl. Energy 2010, 37, 853–860. [Google Scholar] [CrossRef]


Publisher’s Note: MDPI stays neutral with regard to jurisdictional claims in published maps and institutional affiliations. |
© 2022 by the authors. Licensee MDPI, Basel, Switzerland. This article is an open access article distributed under the terms and conditions of the Creative Commons Attribution (CC BY) license (https://creativecommons.org/licenses/by/4.0/).