Abstract
As a major technical route to utilize biomass energy, biomass combustion power generation (BCPG) has been shown to be of environmental and economic significance. According to the operating experience, the installed capacity has a decisive impact on the operation and economic return of BCPG projects. In China, an installed capacity of either 30 MW or 12 MW is often chosen for constructing a BCPG project. To explore which one is more suitable for China, this paper uses actual operating data to compare the operation performance and techno-economics of two representative BCPG projects with an installed capacity of 30 MW and 12 MW. The results show that the operation situation and electricity production of the 30 MW project are better than those of the 12 MW project. The 30 MW project has a lower biomass consumption than the 12 MW project to produce per unit of electricity. The Internal Rate of Return (IRR) of the 30 MW project is greater than the industry benchmark in China and is almost three times the IRR of the 12 MW project. Therefore, it is recommended to construct BCPG projects with installed capacity of 30 MW in China.
1. Introduction
Countries have been developing renewable energy to substitute traditional fossil fuel energy, which releases heavy carbon emissions and pollution to the environment. Among various renewable energy resources, biomass is a promising one that can be converted into electricity, heat, liquid fuel, gas, hydrogen and chemicals through physical, chemical and biological technologies [1]. In many regions, such as Europe and China, there is growing interest in the use of biomass for energy generation, and the profitability of biomass projects is increasing [2,3,4,5]. In the context of achieving carbon neutrality, biomass will play an increasing and irreplaceable role in the energy transition [6]. Taking carbon prices into account, biomass is expected to gradually become more cost competitive than fossil fuels in the future [6,7,8]. According to the International Renewable Energy Agency, to achieve global net-zero carbon emissions by 2050, global bioenergy consumption in 2050 would have to nearly triple the level of 2018 [9]. In China, the share of biomass in primary energy mix might even reach as high as 10% in 2050 in order to limit climate warming to below 1.5 °C [10].
At present, biomass combustion power generation (BCPG) technology, which originated in Denmark in the 1970s, is a major technical way of utilizing biomass in an industrial scale [11,12]. BCPG technology is a process that burns biomass resources in a combustion boiler, and turns biomass energy into electricity (and heat) [1]. Since the first BCPG plant in Denmark, this technology has been widely utilized in developed countries, such as Holland, Sweden, Finland, the United Kingdom, and the United States of America [13,14]. China is abundant in agricultural and forestry biomass resources. It was reported that China’s biomass resources were approximately 460 million tonnes of coal equivalent per year [15]. China has announced to promote the proportion of non-fossil energy in energy consumption to about 25% by 2030 and strives to realize carbon neutrality before 2060. Subject to the pressure from climate change, energy security, and environmental pollution, China is endeavoring to develop various technologies to utilize biomass. BCPG can not only help to solve the problems of straw stacking and burning in the field, but also reduce the emissions of environmental pollutants, such as CO2, SO2, NOx and PM compared with coal-fired power generation [13,16]. When equipped with carbon capture and storage, BCPG could even generate net-negative carbon emissions, which is indispensable for achieving carbon neutrality [6]. Thus, this technology has been promoted by the Chinese government. Nowadays, the BCPG technology has realized industrial development in China, with over 400 projects being put into commercial operation and total installed capacity of over 13,300 MW by the end of 2020 [17].
Figure 1 illustrates a typical process flow of an agricultural and forestry BCPG project. A BCPG project mainly includes a feedstock logistics system, a consistent and stable feeding system, a boiler combustion and auxiliary system, a turbine generating system, and a transformer and distribution system. In such a project, biomass is sent to the boiler chamber through a special feeding system, then generates heat that is turned into high-temperature and high-pressure steam to drive the turbine and generator to generate power. The flue gas of biomass combustion is treated through ash handling and gas conditioning, and is emitted through the stack after reaching a certain standard (e.g., the emissions limits of boiler air pollutants in the Shandong Province, China, are 10 mg/m3 for PM, 50 mg/m3 for SO2 and 100 mg/m3 for NOx). In BCPG projects, the factors that may impact the operation and cost of power generation mainly include the quantity of electricity generated, biomass feedstock collection and processing, feedstock storage and transportation, and operation and maintenance, all of which are closely related to the installed capacity [18]. Therefore, an important question is what kind of installed capacity is suitable for the development of BCPG projects.
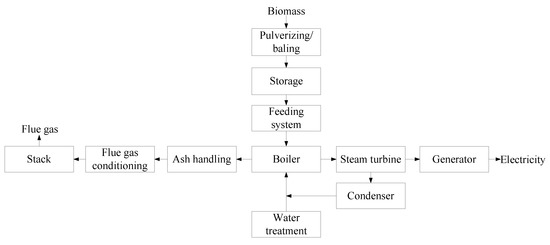
Figure 1.
Typical flow for biomass combustion power generation project.
In China, it is debated whether a small installed capacity (typically 12 MW) or a big installed capacity (typically 30 MW) is more suitable for BCPG. Installed capacity directly impacts the production and operation of power plants. An appropriate installed capacity can bring smooth operation and good benefits to a project; in contrary, an unreasonable capacity will lead to a decline in economic benefits or even failure of the project. In the literature, the choice of the installed capacity for China’s BCPG has not been analyzed. A techno-economic analysis is necessary for choosing an appropriate installed capacity [18]. Studies on techno-economics of biomass energy utilization have been conducted in developed countries [19,20,21,22]. Studies related to the BCPG in China have mainly focused on feasibility analysis [11,23], overall industry assessment [24,25], and policy evaluation [26,27,28,29], but few have considered techno-economic analysis. To fill the literature gap, using actual operating data from 1 January to 31 December 2017, this paper conducts a comparative study of two representative BCPG projects in China with different installed capacities—30 MW and 12 MW—to explore which one generates better operation and techno-economic performance.
2. Introduction to the 30 MW and 12 MW BCPG Projects
The two BCPG projects used for this study are both located in the Shandong Province, China, and belong to the National Bio Energy Co., Ltd. The 30 MW project has been in operation since April 2007, and the 12 MW project started running in April 2008. Both have been running safely for over ten years. The two projects share two important similarities: using high-temperature and high-pressure water-cooled vibrating grate boiler as main equipment, and using agricultural and forestry biomass as feedstock. The operating status of the two projects largely reflects the general operating status of all 30 MW and 12 MW projects of the National Bio Energy Co., Ltd. in China, respectively.
The specifications of the high-temperature and high-pressure water-cooled vibrating grate boilers and other key equipment used in the two projects are given in Table 1.

Table 1.
Specifications of the equipment used in the selected projects.
3. Operation Performance Analysis
In this section, a comparison of the actual operating status of the two projects is first given based on the data in 2017. For BCPG projects, biomass fuels fed into the boiler affect boiler combustion efficiency and equipment stable operation. The fuels used in both the two projects are mainly agricultural and forestry biomass collected within a radius of 10–15 km around the plants, but they will also be purchased from further places as needed. The designed moisture content of fuel is 15–20% and heating value is 14,630 kJ/kg. However, due to the agriculture plantation features and logistics, the fuel quality usually cannot reach this standard in real operation. As shown in Figure 2, the water content is higher than the standard, but the heating value is lower. In 2017, the average moisture content of the feedstock was 28.3% in the 30 MW project and 27.1% in the 12 MW project; the average heating value of the feedstock was 10,616 kJ/kg in the 30 MW project and 10,202 kJ/kg in the 12 MW project. At the beginning of the development of the industry, it was inferred that a big installed capacity required a large amount of biomass resources, so its fuel quality might be difficult to guarantee. However, actual data show that a small installed capacity does not ensure better fuel quality than a big one.
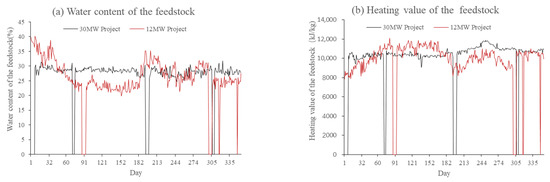
Figure 2.
Water content (a) and heating value (b) of the feedstock.
The original biomass consumption for power generation refers to the quantity of biomass resources consumed to generate per kWh of electricity. In other words, it is the ratio of fuel consumption to electricity production. Under the same combustion conditions, the higher the heating value, the less original biomass resources will be consumed. Figure 3 features that the 30 MW project has a lower biomass consumption than the 12 MW project to produce 1 kWh of electricity. The average original biomass consumption in the 30 MW project was 1184 g/kWh and was 1392 g/kWh in the 12 MW project in 2017.
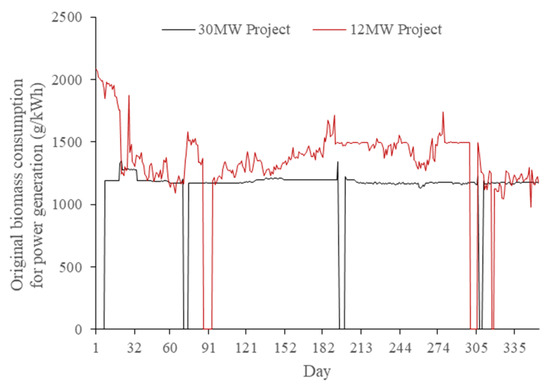
Figure 3.
Original biomass consumption for power generation.
The moisture content and heating value of fuel also impact the boiler operation availability and overall thermal efficiency, which further influence the comprehensive profits of plants. As shown in Figure 4a, because the heating value of biomass feedstock is lower than the designed value and the moisture content is higher, the boiler efficiency for both projects in operation is also lower than the designed level of 92%. The boiler efficiency of the 30 MW project is slightly higher than that of the 12 MW project. Influenced by the feedstock, the overall thermal efficiency of two plants is quite different. In 2017, the average thermal efficiency of the 30 MW project was 31.4%, and that of the 12 MW project was 26.5%, as shown in Figure 4b. In addition, we conducted t-tests [30,31]. The p-values indicate that the differences between the time-series of the two projects are statistically significant at the 1% level.
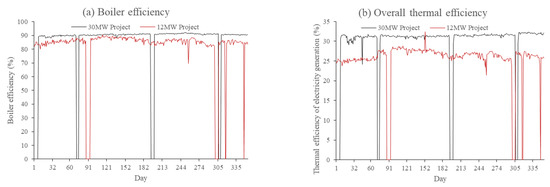
Figure 4.
Boiler efficiency (a) and overall thermal efficiency (b).
Table 2 summarizes key operation parameters of the two projects in 2017. In addition to higher electricity production, it is clear that the operating situation of the 30 MW project appears overall better than that of the 12 MW project.
Table 2.
Overall operation parameters in 2017.
4. Techno-Economic Analysis
On the basis of actual operation data, in this section, a techno-economic analysis for the two projects is conducted. Table 3 provides the annual revenue and cost of the two projects. We find that the pre-tax net income of 30 MW project was 0.793 million CNY/MW (0.103 CNY/kWh) in 2017, while that of the 12 MW project was 0.716 million CNY/MW (0.092 CNY/kWh). Therefore, the 30 MW project appears more profitable than the 12 MW project.
Table 3.
Annual revenue and cost in 2017 *.
The Internal Rate of Return (IRR) [13,32,33] (also see Appendix A) is further calculated for the techno-economic analysis. Financing of 80%, interest of 6.55% (for debt over 5 years), repayment period of 15 years, investment residue of 5%, and income tax of 25% were used for this analysis. The operation period and depreciation period were both 20 years. All these data were adopted from the internal Feasibility Study Report of the National Bio Energy Co., Ltd. in China. Table 4 presents the calculated IRR of the 30 MW and 12 MW BCPG projects. The IRR of the 30 MW project is higher than the benchmark (8%) of this industry in China. However, the IRR of the 12 MW project is lower than the benchmark, only about one third of that of the 30 MW project. Even assuming the same technical performance as the 30 MW project, the IRR of the 12 MW project is estimated at 7.5%, which is still lower than that of the 30 MW project. In addition, we find that the IRR of the 30 MW project is comparable to the IRR of some BCPG projects in other countries. For example, Cardoso et al. [20] mentioned that the IRR of an 11 MW biomass combustion power plant in Portugal was 9.95%; Moon et al. [19] showed that, with renewable portfolio standards, the IRR of biomass direct combustion projects could reach nearly 15% in Korea; Malek et al. [34] showed that the IRR of biomass-based power plants with circulating fluidized bed boiler and steam turbine was average at 12.5% in Malaysia.
Table 4.
IRR of the BCPG projects with different installed capacities in China.
5. Conclusions
In China, BCPG projects grow very fast, and 30 MW or 12 MW are often chosen as the installed capacity for a new BCPG project. According to the analysis of the actual operating data, we justified that the operation performance of the 30 MW project is overall better than the 12 MW project. In particular, the profitability of the 30 MW project also appears better than the 12 MW project, based on a techno-economic evaluation.
As BCPG projects have the functions of promoting rural area development and substituting fossil energy to reduce carbon emissions and air pollutants, we should make further efforts to push forward the development of the BCPG industry in China. If feedstock can be supplied, it would be a better option for stakeholders to choose 30 MW as the installed capacity to develop BCPG projects in China. Subject to the feedstock supply, the location of projects should not be very close to each other. To further improve the profitability of BCPG projects, stakeholders could also consider providing heat or other energy services to residents and industrial consumers. Finally, similar studies might also be conducted in other countries to consider which installed capacity is suitable for them.
Author Contributions
Conceptualization, X.Z., Y.Z. and X.P.; methodology, X.Z., Y.Z. and X.P.; validation, Z.W. and X.P.; formal analysis, X.Z., Y.Z. and X.P.; investigation, X.Z., Y.Z. and Z.W.; data curation, X.Z. and Y.Z.; writing—original draft preparation, X.Z., Y.Z. and X.P.; writing—review and editing, Z.W.; visualization, X.Z.; supervision, X.P.; funding acquisition, X.Z., Y.Z. and X.P. All authors have read and agreed to the published version of the manuscript.
Funding
This work was supported by the National Key R & D Program of China (2021YFE0107300) and the Science Foundation of China University of Petroleum, Beijing (2462020YXZZ038).
Institutional Review Board Statement
Not applicable.
Informed Consent Statement
Not applicable.
Data Availability Statement
The data presented in this study are available on reasonable request from the corresponding author. The data are not publicly available due to the policy of the National Bio Energy Co., Ltd., Beijing, China.
Acknowledgments
We thank our colleagues from the National Bio Energy Co., Ltd. and our partners for data collection and discussion.
Conflicts of Interest
The authors declare no conflict of interest.
Appendix A. Calculation of the Internal Rate of Return
In this analysis, the IRR was determined by Equation (A1), where Pt indicates income (or cash inflow) in year t, Ct indicates cost in year t, Tt indicates tax in year t (Ct + Tt is cash outflow), INV indicates initial investment, and N indicates total period. In other words, the IRR is the discount rate corresponding to a net present value of zero. Pt was calculated as Equation (A2), where pet indicates feed-in tariff and elect indicates power sent into the grid. Ct was calculated as Equation (A3), where pft indicates biomass feedstock price, fuelt indicates biomass feedstock consumption, oct indicates operation cost, and fct indicates financial cost (mainly related to debt). Tt was calculated as Equation (A4), where ηt indicates tax rate and Dt indicates asset depreciation. The units for these variables are: Pt, Ct, Tt, Dt, INV, oct, fct–CNY; pet–CNY/kWh; elect–kWh; pft–CNY/tonne; fuelt–tonne.
References
- Abuelmuor, A.A.A.; Wahid, M.A.; Hosseini, S.E.; Saat, A.; Saqr, K.M.; Sait, H.H.; Osman, M. Characteristics of biomass in flameless combustion: A review. Renew. Sustain. Energy Rev. 2014, 33, 363–370. [Google Scholar] [CrossRef]
- Karpenstein-Machan, M. Sustainable Cultivation Concepts for Domestic Energy Production from Biomass. Crit. Rev. Plant Sci. 2001, 20, 1–14. [Google Scholar] [CrossRef]
- Balat, M.; Ayar, G. Biomass Energy in the World, Use of Biomass and Potential Trends. Energy Source 2005, 27, 931–940. [Google Scholar] [CrossRef]
- Mckendry, P. Energy production from biomass (part 1): Overview of biomass. Bioresour. Technol. 2002, 83, 37–46. [Google Scholar] [CrossRef]
- He, J.; Zhu, R.; Lin, B. Prospects, obstacles and solutions of biomass power industry in China. J. Clean. Prod. 2019, 237, 117783. [Google Scholar] [CrossRef]
- IPCC (Intergovernmental Panel on Climate Change). Special Report on Global Warming of 1.5 °C; IPCC: Geneva, Switzerland, 2018. [Google Scholar]
- Huang, X.; Chang, S.; Zheng, D.; Zhang, X. The role of BECCS in deep decarbonization of China's economy: A computable general equilibrium analysis. Energy Econ. 2020, 92, 104968. [Google Scholar] [CrossRef]
- Galazka, A.; Szadkowski, J. Enzymatic hydroplysis of fast-growing poplar wood after pretreatment by steam explosion. Cell. Chem. Technol. 2021, 55, 637–647. [Google Scholar] [CrossRef]
- IRENA (International Renewable Energy Administration). World Energy Transitions Outlook; IRENA: Abu Dhabi, United Arab Emirates, 2021. [Google Scholar]
- Pan, X.; Chen, W.; Wang, L.; Lin, L.; Li, N. The role of biomass in China’s long-term mitigation toward the Paris climate goals. Environ. Res. Lett. 2018, 13, 124028. [Google Scholar] [CrossRef]
- Wang, T.; Huang, H.; Yu, C.; Fang, K.; Zheng, M.; Luo, Z. Understanding cost reduction of China's biomass direct combustion power generation—A study based on learning curve model. J. Clean. Prod. 2018, 188, 546–555. [Google Scholar] [CrossRef]
- Zhao, X.; Tan, Z.; Liu, P. Development goal of 30 GW for China’s biomass power generation: Will it be achieved? Renew. Sustain. Energy Rev. 2013, 25, 310–317. [Google Scholar]
- Chen, S.; Feng, H.; Zheng, J.; Ye, J.; Song, Y.; Yang, H.; Zhou, M. Life Cycle Assessment and Economic Analysis of Biomass Energy Technology in China: A Brief Review. Processes 2020, 8, 1112. [Google Scholar] [CrossRef]
- Patzek, T.W.; Pimentel, D. Thermodynamics of Energy Production from Biomass. Crit. Rev. Plant Sci. 2005, 24, 327–364. [Google Scholar] [CrossRef]
- NEA (National Energy Administration). Biomass Energy Development Plan in “The Thirteenth Five-Year”; NEA: Washington, DC, USA, 2016. [Google Scholar]
- Wang, Z.; Wang, Z.; Xu, G.; Ren, J.; Wang, H.; Li, J. Sustainability assessment of straw direct combustion power generation in China: From the environmental and economic perspectives of straw substitute to coal. J. Clean. Prod. 2020, 273, 122890. [Google Scholar] [CrossRef]
- CREEI (China Renewable Energy Engineering Institute). Biomass Power Achievement Statistical Report of China 2020; CREEI: Beijing, China, 2021. [Google Scholar]
- McIlveen-Wright, D.R.; Huang, Y.; Rezvani, S.; Redpath, D.; Anderson, M.; Dave, A.; Hewitt, N.J. A technical and economic analysis of three large scale biomass combustion plants in the UK. Appl. Energy 2013, 112, 396–404. [Google Scholar] [CrossRef]
- Bakos, G.C.; Tsioliaridoua, E.; Potolias, C. Technoeconomic assessment and strategic analysis of heat and power co-generation (CHP) from biomass in Greece. Biomass BioEnergy 2008, 32, 558–567. [Google Scholar] [CrossRef]
- Cardoso, J.; Silva, V.; Eusébio, D. Techno-economic analysis of a biomass gasification power plant dealing with forestry residues blends for electricity production in Portugal. J. Clean. Prod. 2019, 212, 741–753. [Google Scholar] [CrossRef]
- Moon, J.H.; Lee, J.W.; Lee, U.D. Economic analysis of biomass power generation schemes under renewable energy initiative with Renewable Portfolio Standards (RPS) in Korea. Bioresour. Technol. 2011, 102, 9550–9557. [Google Scholar] [CrossRef]
- Wright, D.G.; Dey, P.K.; Brammer, J. A barrier and techno-economic analysis of small-scale bCHP (biomass combined heat and power) schemes in the UK. Energy 2014, 71, 332–345. [Google Scholar] [CrossRef]
- Cui, H.; Wu, R. Feasibility analysis of biomass power generation in China. Energy Procedia 2012, 16, 45–52. [Google Scholar] [CrossRef][Green Version]
- Zhao, Z.; Yan, H. Assessment of the biomass power generation industry in China. Renew. Energy 2012, 37, 53–60. [Google Scholar] [CrossRef]
- Zhao, X.; Feng, T.; Ma, Y.; Yang, Y.; Pan, X. Analysis on investment strategies in China: The case of biomass direct combustion power generation sector. Renew. Sust. Energy Rev. 2015, 42, 760–772. [Google Scholar]
- He, J.; Liu, Y.; Lin, B. Should China support the development of biomass power generation? Energy 2018, 163, 416–425. [Google Scholar] [CrossRef]
- Liu, D.; Liu, M.; Xiao, B.; Guo, X.; Niu, D.; Qin, G.; Jia, H. Exploring biomass power generation’s development under encouraged policies in China. J. Clean. Prod. 2020, 258, 120786. [Google Scholar] [CrossRef]
- Zhang, Q.; Zhou, D.; Fang, X. Analysis on the policies of biomass power generation in China. Renew. Sust. Energy Rev. 2014, 32, 926–935. [Google Scholar] [CrossRef]
- Zhao, X.; Wang, J.; Liu, X.; Feng, T.; Liu, P. Focus on situation and policies for biomass power generation in China. Renew. Sust. Energy Rev. 2012, 16, 3722–3729. [Google Scholar]
- Student. The probable error of a mean. Biometrika 1908, 6, 1–25. [Google Scholar] [CrossRef]
- Box, J.F. Guinness, Gosset, Fisher, and Small Samples. Stat. Sci. 1987, 2, 45–52. [Google Scholar] [CrossRef]
- Prol, J.L.; Steininger, K.W. Photovoltaic self-consumption is now profitable in Spain: Effects of the new regulation on prosumers’ internal rate of return. Energy Policy 2020, 146, 111793. [Google Scholar] [CrossRef]
- Talavera, D.L.; Aguilera, J.A. The internal rate of return of photovoltaic grid-connected systems: A comprehensive sensitivity analysis. Renew. Energy 2010, 35, 101–111. [Google Scholar] [CrossRef]
- Malek, A.B.M.A.; Hasanuzzaman, M.; Rahim, N.A.; Turki, Y.A.A. Techno-economic analysis and environmental impact assessment of a 10 MW biomass-based power plant in Malaysia. J. Clean. Prod. 2017, 141, 502–513. [Google Scholar] [CrossRef]
- NDRC (National Development and Reform Commission), MOC (Ministry of Construction). Construction Project Economic Evaluation Methods and Parameters, 3rd ed.; China Planning Press: Beijing, China, 2006.


Publisher’s Note: MDPI stays neutral with regard to jurisdictional claims in published maps and institutional affiliations. |
© 2022 by the authors. Licensee MDPI, Basel, Switzerland. This article is an open access article distributed under the terms and conditions of the Creative Commons Attribution (CC BY) license (https://creativecommons.org/licenses/by/4.0/).