Article

Comparative Fuel Yield from Anaerobic Digestion of Emerging Waste in Food and Brewery Systems

Voinovich School of Leadership and Public Service, Ohio University, Athens, OH 45701, USA
*
Authors to whom correspondence should be addressed.
Energies 2022, 15(4), 1538; https://doi.org/10.3390/en15041538
Submission received: 25 January 2022 / Revised: 16 February 2022 / Accepted: 17 February 2022 / Published: 19 February 2022

Abstract

:
Food waste (FW), a major part of the US waste stream, causes greenhouse gases within landfills, but there is an opportunity to divert FW to anaerobic digestion (AD) facilities that produce biogas and digestate fertilizer. The composition of FW inputs to AD determines the value of these products. This study provides insight into the effect of waste composition on the quality of AD products by first characterizing the biogas and digestate quality of anaerobically digested FW from four diets (paleolithic, ketogenic, vegetarian, and omnivorous), and then estimating the difference in biogas produced from codigested FW and brewery waste (BW). Waste feedstock mixtures were incubated in lab-scale bioreactors for 21 days with live inoculum. Biogas quality was monitored for 21–30 days in four trials. Samples were analyzed using a gas chromatograph for detection of methane (CH4) and carbon dioxide (CO2). The composition of the waste inputs had a significant impact on the quality of biogas but not on the quality of the digestate, which has implications for the value of post-AD fertilizer products. Wastes with higher proportions of proteins and fats enhanced biogas quality, unlike wastes that were rich in soluble carbohydrates. Codigestion of omnivorous food waste with carbon-rich agricultural wastes (AW) improved biogas quality, but biogas produced from BW does not necessarily improve with increasing amounts of AW in codigestion.

1. Introduction

Anaerobic digestion (AD) technology used to manage organic wastes can provide benefits to the waste, energy, and agriculture sectors. Wastes are digested by microbes and converted into two marketable products: renewable natural gas (RNG) and digestate fertilizers. Of the 292 million US tons of waste entering landfills, 24% is comprised of food waste (FW) that can be diverted for use in AD systems [1]. The composition of feedstock waste greatly influences AD system performance and the quality of output products [2]. Large industrial AD systems consistently monitor and adjust both waste inputs and system conditions to ensure the productivity and health of the microbial community during digestion. Small-scale systems are more vulnerable to instability caused by variable feedstocks [3]. It is essential to understand how FW from different sources will affect AD products, regardless of the scale of application.
Emerging food diets result in changes to organic waste streams. Determining how these changes will impact the quality of AD system outputs is essential information that can assist AD operators in system management. This study analyzes how wastes from a typical omnivorous diet digested within an AD system compares with wastes digested from the alternative vegetarian, paleolithic, and ketogenic diets. These alternative diets have increased in popularity and may influence household, community, or even regional organic waste composition [4,5]. The ketogenic diet requires a composition of foods with high fat (55–65% of energy), very-low soluble carbohydrate (<100 g/day), and high protein [5]. The typical lacto–ovo–vegetarian diet eliminates animal meat, which creates a low fat, low protein, and high soluble carbohydrate composition of foods [6]. The paleolithic diet has equal parts of all organic groups but does not have processed grains, processed foods, or dairy [7].
Another waste emerging as a management challenge in the US is from microbreweries. The number of microbreweries has grown eight-fold in the US between 2009 and 2019 [8], generating new waste management issues for many municipalities. Globally, the brewing industry produces a significant amount of waste that has a high content of organic matter, minerals, vitamins, and phenolic compounds [9]. Brewery waste (BW) is a wet mixture of spent grain, water, trub, yeast, and other products such as fruits or diatomaceous earth (which is used in filtration) [9]. The world consumed about 180 billion liters of beer in 2007 [10], and 20 kg of spent brewer’s grain is left over from every 100 L of beer produced [11]. Some breweries already utilize AD technology to convert this waste into renewable energy at their production facilities and to drastically reduce the costs for sewer and municipal wastewater treatment systems [12]. Spent grain can be used for animal feed, whereas the BW trub is conventionally sent to wastewater treatment plants for processing [4]. It is important to note which portion of BW is being used in AD studies, as each possesses different biomethane potential [13]. Although the benefits of AD with BW are established [14], there is demand for additional methodologies that allow small-scale microbreweries to effectively offset their energy and waste management costs.
Codigestion, which involves combining organic wastes from different sources in AD, provides a way to stabilize feedstock composition. This study evaluates the effect of codigesting agricultural residues with FW and BW using agricultural waste (AW) from Miscanthus × giganteus, an emerging advanced bioenergy crop. Miscanthus × giganteus is a promising bioenergy crop with many environmental benefits such as low input requirements, high biomass yield, and less environmental impacts relative to other bioenergy crops such a corn [15,16]. By codigesting FW products with AW, this study explores possible synergies between bioenergy production pathways (for both biogas and biomass crops that serve liquid or solid fuel markets). Lignocellulosic crops are comprised primarily of three structural polymers: cellulose, hemicellulose, and lignin [17]. Hemicellulose and cellulose can be deconstructed to sugar-like compounds [18], while lignin are structural fibers that are more challenging to breakdown [19] and thus can end up concentrated in the post-AD digestate product.
The purpose of this study is to measure the quality of AD outputs from different FW, BW, and codigestions with AW. We tested eight different waste mixtures to determine how emerging organic waste streams may impact the quality of AD outputs (biogas and digestate) and hypothesized that wastes with greater structural carbohydrate content would yield greater potential RNG. This work contributes to the body of knowledge available for management and design of AD systems for communities with different organic wastes.

2. Materials and Methods

The research was conducted as a two-part study. Part One tested how FW from an omnivorous diet (FW-O) compared to FW from the paleolithic (FW-P), ketogenic (FW-K), and vegetarian diets (FW-V). The first step of Part One was a food waste audit. Actual food waste discarded by diners at an Ohio University dining hall over the course of two dinners was sorted and measured in order to create a standard of what types and proportions of macronutrients are found within food waste streams. Food macronutrient groups were adapted from Prescott et al. [20]. For the experimental treatments, the proportional composition for each diet was adjusted with reference to the average dietary composition, and foods were purchased from a local grocery store to mimic the proportional wastes (by wet weight) for each diet. These mixture proportions can be found in Table 1 below.
For example, since vegetarians do not eat animal meat, the 20% of animal-based FW was replaced in part by egg whites (10%), and the remaining 10% animal FW was replaced with an evenly distributed mixture of FW from other categories. It was assumed that each diet resulted in food waste with similar proportions as the dietary composition. Nonfood waste, such as napkins and straw wrappers, was not measured in this study.
The mean fat, protein, soluble carbohydrate, and fiber contents were estimated for each diet using the nutrition platform CalorieKing [21] and summarized in Table 2 below.
Batch laboratory-scale AD reactors were constructed using 1 L mason jars. Three replicate jars were created for each of the four food waste treatments, and the experiment was repeated for a total of 6 replicates per FW mixture (N = 24). Synthetic FW from each diet was ground immediately after collection into a homogenized mixture using a custom kitchen sink disposal unit and standardized to a 10% solids content with deionized tap water. The ground FW slurry was then combined in a 1:2 ratio with inoculum from healthy digester effluent collected from a nearby commercial AD facility (Quasar Energy Group; Zanesville, OH, USA). This was a volumetric ratio that was proportional to dry volatile solids content. The experimental digestion vessels were filled to 50% volumetric capacity, leaving half of the volume as headspace for biogas collection. The headspace was flushed with pure N2 for two minutes each so there was no oxygen remaining in the headspace. A series of tubes and stopcocks were installed in the sealed lids of the jars to allow for gas sampling and the diversion of any excess biogas produced to an external bag to avoid hazardous pressure buildup. The jars were incubated in a Thermo-Scientific IMH100-S Incubator (Thermo Fisher Scientific, Waltham, MA, USA) at 37 °C. Biogas samples of 5 mL were collected and analyzed daily for each jar for 21 days using a Bruker gas chromatograph with FID and TCD detectors for the simultaneous determination of CH4 and CO2, respectively (Bruker Daltonics, Billerica, MA, USA).
To evaluate digestate quality, wet samples of each slurry were collected before and after digestion for phosphorus analysis and to measure moisture content. The dried samples were ground using a bead-beater to reduce their particle size and were analyzed in a Costech ECS 4010 CHNSO elemental analyzer equipped with a 3m AYESEP Q 80/100 MESH column and a TCD (Costech Analytical Technologies, Inc., Valencia, CA, USA) to measure total carbon (C) and nitrogen (N) content. These data were used to determine the C:N ratio of the feedstock and effluent. Phosphorus was measured in Ohio University’s Institute for Sustainable Energy and the Environment (ISEE) lab using vial tests. It was necessary to dilute each wet sample with deionized water and filter them before phosphorus analysis. Food waste samples had higher solids content and therefore needed to be diluted in a 1:5 ratio, while the slurries before and after digestion were diluted in a 2:5 ratio. The batch AD digesters were monitored daily for pressure leaks. Three experimental jars, one with FW-P and two with FW-V, were excluded from the results due to irreparable pressure leaks found during the incubation period.
In Part Two of this study, FW-O and BW were codigested with AW in lab-scale batch AD reactors using methods similar to Part One. BW trub was collected fresh from a local microbrewery. Residues from biomass crops of Miscanthus × giganteus were collected from the Ohio University Land Laboratory and used as AW. The FW and BW mixtures were created with ratios of 1:1 or 2:1 codigested AW mixed with either FW or BW. These ratios raised the C:N of the treatment mixtures closer to the optimum C:N ratios for AD [22,23]. AW was not added beyond a 1:1 ratio so AW did not become the dominant component of any treatment mixture.
Each mixture ratio was based on the dry mass of volatile solids of each feedstock mixture [3,24]. The AW was ground to individual particle sizes no larger than 1 cm3 using hand shears and a 2008-Era Fellowes® C-120 20-Sheet Strip-Cut Shredder (Fellowes, Itasca, Illinois). Four replicate digestion vessel jars were assembled with identical mixtures for each of the four treatments. There were 16 total jars (four of each treatment) for the first round of testing and 12 total jars (three of each treatment) for the second round of testing. In total, there were 7 replicate jars per treatment mixture.
Liquid digestate was added to each jar until the jars were filled to 670 mL to ensure that the jars had the exact same head space for the gases produced. The feedstock mixtures were all comprised of 10% solids. Gas samples were collected from the jars every 2–3 days for 21 days. Gas chromatography was used to measure concentrations of CO2 and CH4 in the samples following the same procedures described for Part One of the study. The reference food waste against which all others were compared was FW-O, and the composition was based on the average dietary composition of food waste in a university dining hall, as described in Part One.
Overall, the experimental design includes the following treatments: FW-O (n = 6), FW-P (n = 5), FW-K (n = 6), FW-V (n = 4), AW:FW 1:1 (n = 7), AW:FW 2:1 (n = 7), AW:BW 1:1 (n = 7), and AW:BW 2:1 (n = 7).

2.1. Statistical Analysis

A Shapiro–Wilk test for normality was applied to the dataset for the average CH4 produced by the treatments, and the data were not normally distributed. A Kruskal–Wallace test first found that there was a significant difference between the treatments in this study. A Whitney–Mann U test was then applied to determine which treatments differed from one another significantly in average CH4 output.
A Shapiro–Wilk test for normality was applied next to the dataset for the peak CH4 concentrations produced by the treatments, and all of the treatments other than AW:BW 2:1 had a normally distributed data range. For the treatment comparisons, an Independent t-Test was then applied to assess which treatments differed significantly from one another in peak CH4 output. For comparisons regarding the AW:BW 2:1 treatment data set, a Whitney–Mann U test was applied instead.
Digestate quality was assessed based on the C, N, and phosphorus concentrations of the effluents, although no formal standards have been set to define a digestate fertilizer quality based on nutrient contents [25]. One-way ANOVA was used to determine significant differences in elemental concentrations and C:N ratios between treatments and overall differences in average elemental concentrations and C:N ratios over the entire measurement period between treatments.

3. Results

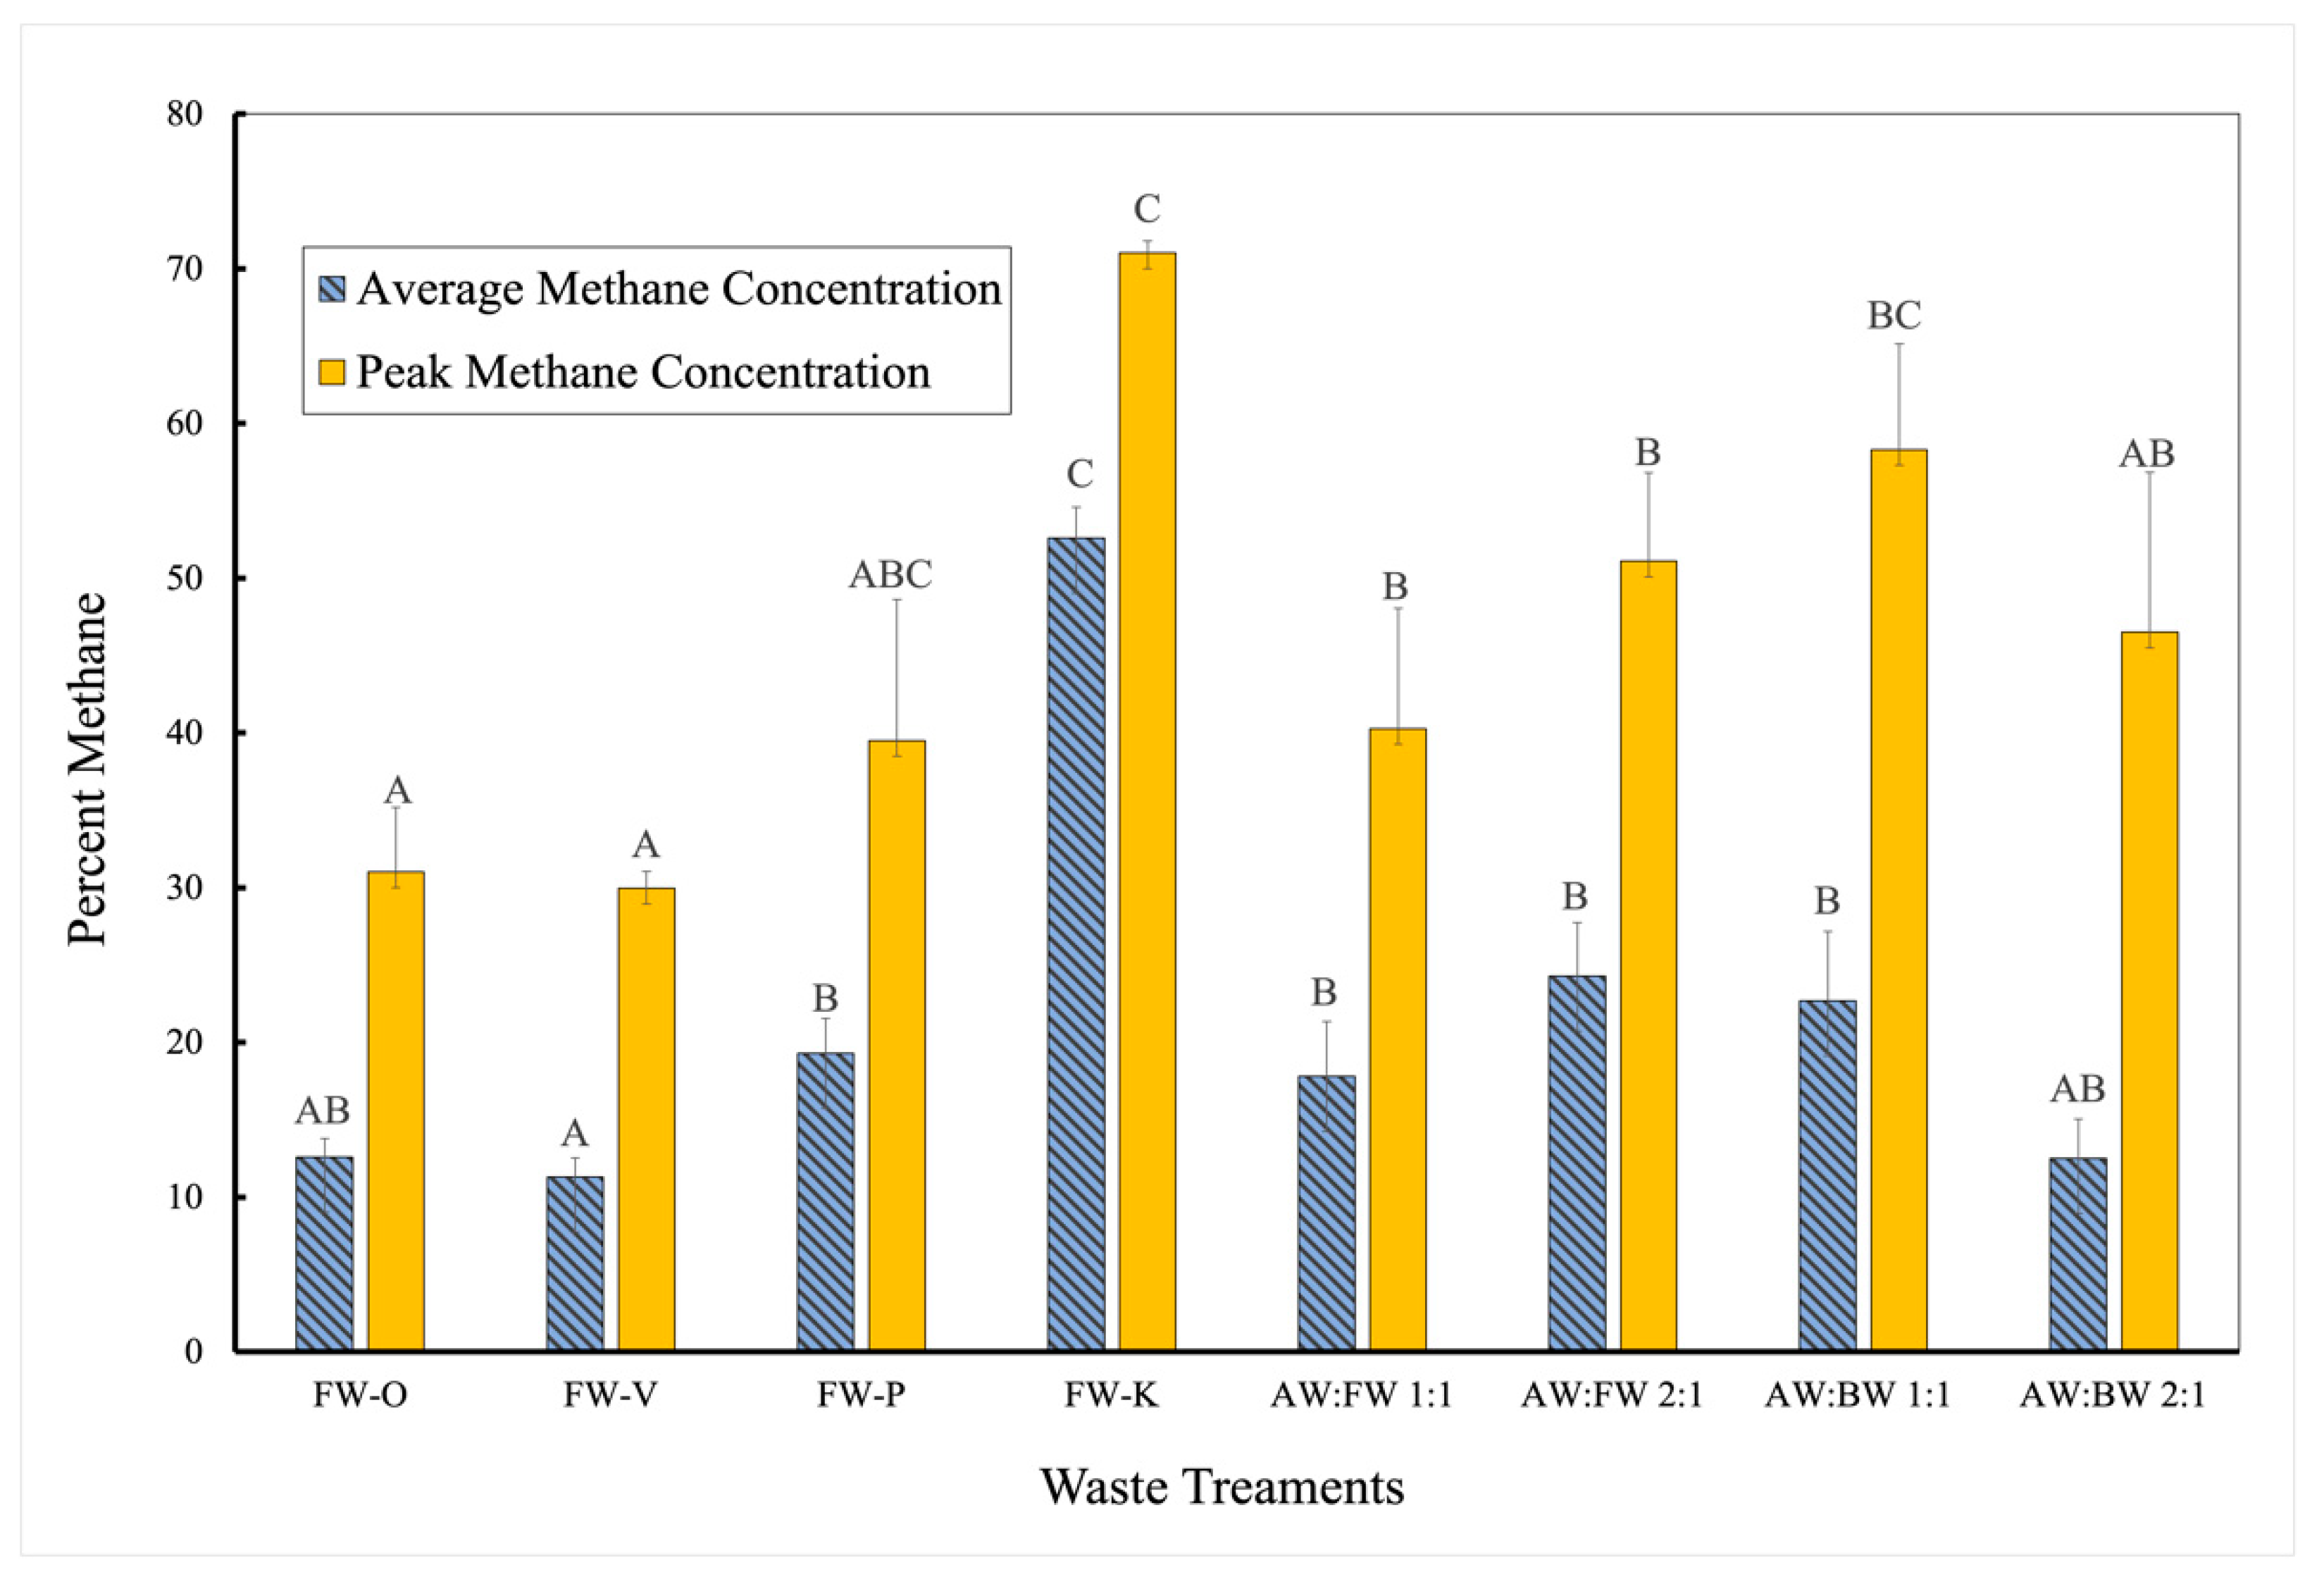
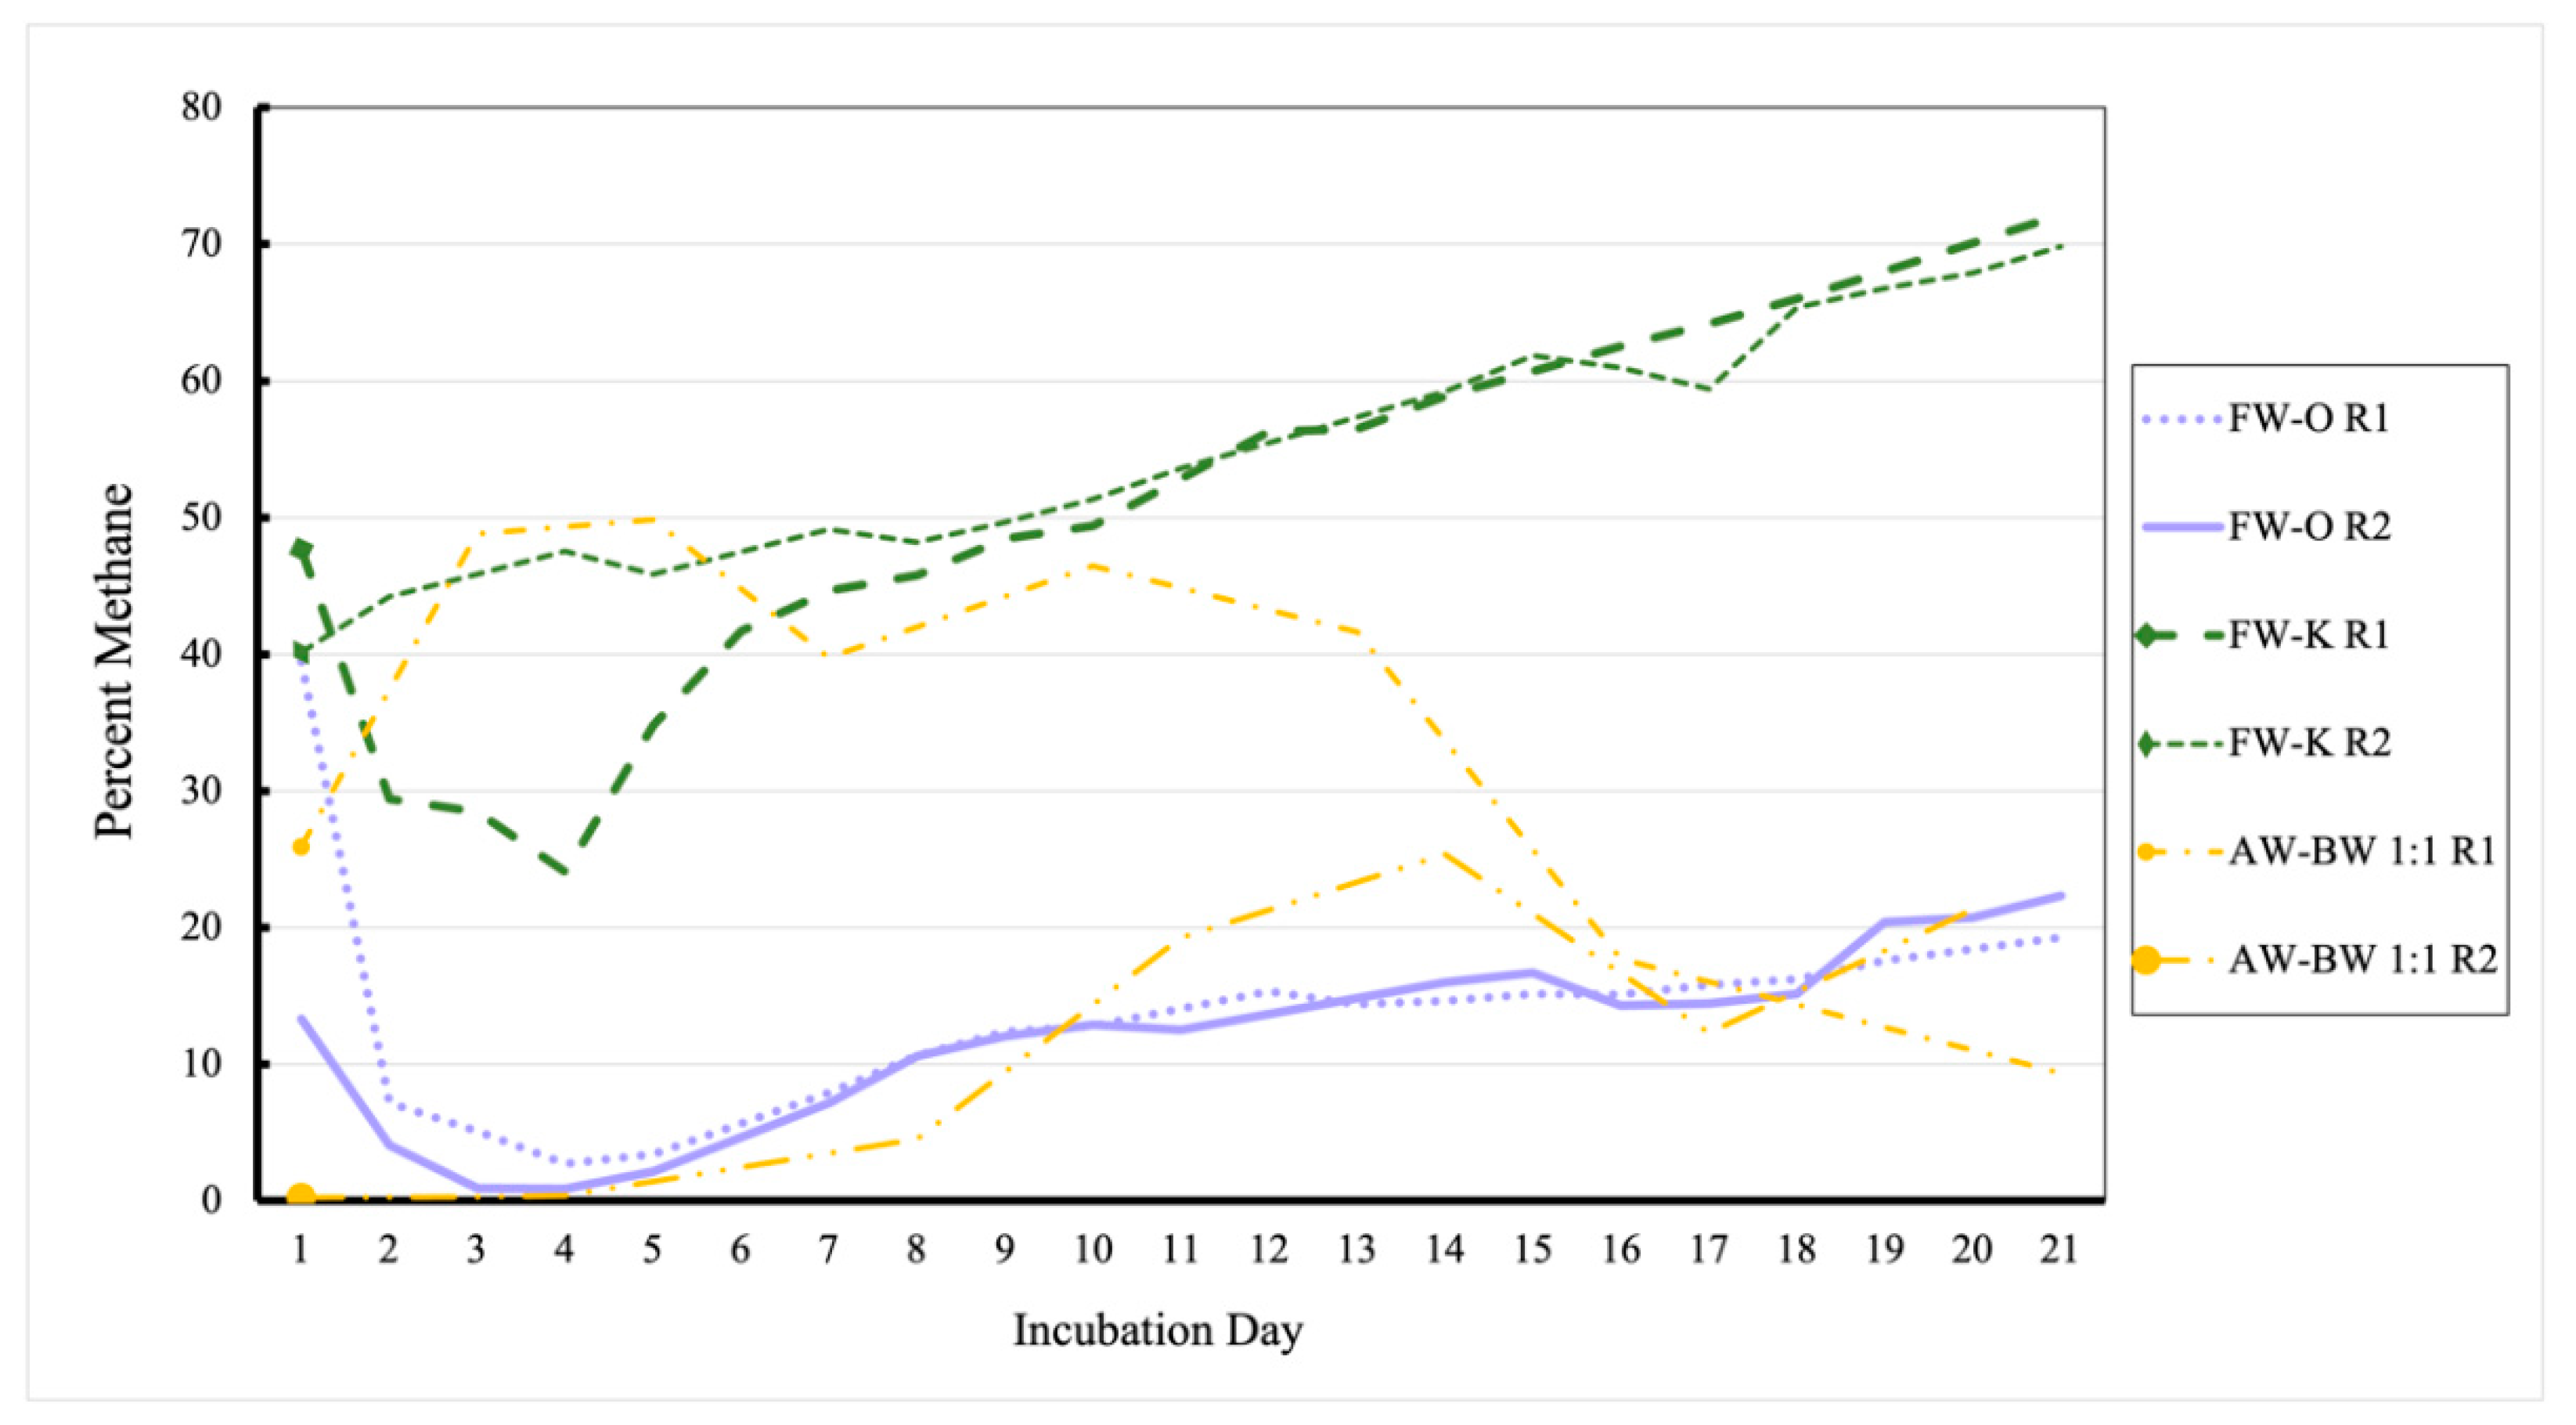
3.1. Methane Outputs of Various Waste Treatments

The waste treatments yielded significantly different biogas quality, as measured by average daily CH4 output and average peak CH4 output (see Table 3; Figure 1).
The FW-K treatment produced the highest quality biogas with a daily average of 52.6% CH4 over the 21-day incubation period. By this measure, FW-K performed 53.8% better than the next highest performing treatment of AW:FW 2:1. FW-K also produced the highest average peak quality biogas of 71.0% CH4. This was 17.8% higher than the second-best average peak performing treatment of AW:BW 1:1. Overall, FW-K produced a significantly higher quality biogas than all other treatments and also produced significantly higher peak methane than all treatments except AW:BW 1:1. The treatment AW:FW 2:1 produced the second highest biogas quality and the third highest average peak CH4 of 51.1%. Average biogas quality and peak CH4 for the second- and third-best performing treatments AW:BW 1:1 and MW 2:1, respectively, were not significantly different (p > 0.05).
FW-V had the lowest performance of all treatments by measure of average biogas quality and average peak biogas quality. FW-V produced biogas with an average of 11.3% CH4. FW-V also produced the lowest quality biogas peak with an average of 30.0% CH4. FW-V also performed significantly worse than AW:FW 2:1, FW-P, and AW:BW 1:1. The treatments AW:BW 2:1 and FW-O performed only marginally better than FW-V, producing a biogas with an average CH4 of 12.5% and 12.6%, respectively. AW:BW 2:1 outperformed FW-O for peak CH4 production, with an average biogas peak of 46.5% CH4, in contrast to the average peak of 31.0% CH4 for FW-O. AW:FW 2:1 performed significantly better than FW-O (p < 0.05). AW:FW 2:1 performed significantly better that AW:BW 2:1. The treatment FW-K produced CH4 peaks that were significantly higher than all treatments, except AW:BW 1:1. Both AW:FW 2:1 and AW:BW 1:1 produced significantly greater peak biogas than both FW-V and FW-O (p < 0.05).
There is higher variation in average and peak CH4 produced among FW-treatments without AW residues than there was between treatments with AW residues. The average of daily CH4 in the FW treatments without AW is 24.0%, with the difference between the highest (FW-K) and lowest (FW-V) treatment being 41.3%. The average biogas quality for the FW treatments with AW was 19.3% CH4, with a difference between the highest and lowest performing treatments of 11.8%. The FW treatments without AW had a maximum of 71.0% CH4 and a minimum of 11.3% CH4. The treatments with AW had a maximum of 58.3% CH4 and a minimum of 40.26% CH4.
With the treatment FW-O as a reference, Figure 2 depicts the temporal dynamics of biogas quality (percent CH4) in the FW-K treatment and the AW:BW 1:1 treatment, the two treatments with the highest quality biogas. Although the AW:BW 1:1 treatment did not have significantly different average CH4 concentration peaks than FW-K, the performance of this feedstock was much more variable. The AW:BW 1:1 feedstock performance was also much more variable than the FW-O feedstock. The BW treatments generally declined in performance after 14 days, while the FW treatments continued to produce CH4 until the end of the study at day 21. The BW treatments did not maintain consistent biogas production, unlike the FW treatments.

3.2. Macronutrient Trends

Food waste mixtures comprised of greater proportions of fat, proteins, and structural polysaccharides (cellulose and hemicellulose) generally yielded biogas with a greater proportion of CH4, while mixtures with soluble carbohydrates did not perform as well (Figure 3). Fats, proteins, and structural polymers appear to have a balancing effect on biochemical reactions in AD, while high soluble carbohydrate content does not yield sustained biogas quality.
The best performing treatment, FW-K, had the highest amount of both fats and proteins, as well as below average amount of soluble carbohydrates. The next best performing treatments were AW:FW 2:1 and AW:BW 1:1, which produced biogas with an average of 24.3% and 22.7% CH4, respectively. Both of these treatments had above average structural carbohydrate content, as well as below average soluble carbohydrate content (Figure 3). In addition, these treatments had below average amounts of protein and fats and some of the highest amounts of structural carbohydrates of the treatment groups, which likely contributed to their enhanced biogas quality. The next two best performing treatments were FW-P and AW:FW 1:1, which produced biogas with an average of 19.3% and 17.8% CH4, respectively. FW-P had above average protein and fat content but also above average soluble carbohydrate content. AW:FW 1:1 had below average protein and fat content but above average structural carbohydrate, as well as soluble carbohydrate content. The next best performing treatment was FW-O, producing biogas with an average of 12.6% CH4. FW-O contained slightly above average protein and fat contents and no structural carbohydrates.
When comparing FW-O to the codigested treatments, another trend emerges. The codigestions of AW:FW 2:1 and AW:FW 1:1 compared with the reference FW-O indicate that structural carbohydrates play an incrementally larger role in improving biogas quality than fats and proteins. Conversely, increasing proportions of soluble carbohydrates may reduce biogas quality, but some fat and protein is required to maintain biogas. The AW:BW 2:1 treatment is second to last in performance with an average of only 12.5 % CH4. Although AW:BW 2:1 has low protein and fat content, it has high structural carbohydrate content and low soluble carbohydrate content.
Unlike the codigested FW, the BW did not perform better with a higher proportion of codigested AW. BW with less AW had a higher protein and fat content and a lower soluble carbohydrate content. AW:BW 2:1 did have 5.3% more structural carbohydrates than AW:BW 1:1, but this did not outweigh the effect of the macronutrients. The lowest performing treatment was FW-V, producing biogas with an average of 11.3% CH4. In alignment with predominant trends, the vegetarian treatment had no structural carbohydrates, and the highest content of soluble carbohydrates (being 70.5% of vegetable composition).

3.3. Digestate Quality Results

There were no significant differences in C:N ratios or C concentrations of digestate between treatments or rounds (Table 2). Spearman’s Rank Correlation was used to determine that there was a significant positive correlation (p < 0.001; r = 0.75) between the final concentration of CH4 in the headspace and the C:N ratio of the effluent. Lastly, there were no significant differences in phosphorus concentrations (Table 2). The final phosphorus concentrations of the effluents for the FW-V, FW-O, FW-K, and FW-P diets were 0.03% (SE = 0.01), 0.05% (SE = 0.01), 0.12% (SE = 0.05), and 0.16% (SE = 0.04), respectively as seen in Table 4.

4. Discussion

The results of this study suggest that there are multiple characteristics of organic waste streams that can influence the quality of biogas produced from AD systems. The FW-K treatment outperformed all other treatments, with the highest mean biogas CH4 concentration (52.6%), due to its macronutrient composition with high fats, proteins, and low soluble carbohydrates. Codigestion of FW and BW with agriculture residues also produced some of the highest quality biogas, but the quality was not sustained over time as it was in the case of FW-K. These codigestions had lower amounts of fats and proteins, which seem to be useful for stabilizing biochemical reactions that lead to methanogenesis in AD.
FW-K was comprised of 36.1% fat, which was the highest of all the treatments. This trend was also reported in prior studies where fats yielded greater biogas potential than other biodegradable organics [26,27], as long as these fats did not generate excess long-change fatty acids that could inhibit biogas production. Although fatty acid profiles were not characterized, we speculate that oleic and palmitic acids, found in animal-based foods, were not high enough in the keto diet to cause inhibition [22]. The FW-K treatment was comprised of 49.3% protein (primarily animal), which was also the highest of all treatments. Although proteins have a high potential to inhibit biogas production [24], the results of this study suggest that amino acid concentrations were not high enough to suppress the methanogens. These findings support other studies where amino acids produced a large quantity of biogas because they are compounds high in nitrogen, which contributes to anaerobic bacterial proliferation [23]. In contrast, soluble carbohydrates combined with low levels of nitrogen are less effective in supporting bacterial proliferation [23]. This is also consistent with the findings of our study where the treatment that yielded the lowest quality of biogas, FW-V, was comprised of 70.5% carbohydrates. This FW-V treatment had the highest proportion of soluble carbohydrates of all treatments and produced biogas with an average of only 11.3% CH4.
In addition to nitrogen playing an influential role in the performance of treatments with highly divergent compositions, it also appears that C influences the performance of the feedstock treatments, although more moderately. The FW-O, AW:FW 1:1, and AW:FW 2:1 treatments varied in total C content, with greater AW proportions providing greater C concentrations. Biogas quality improved with the amount of AW codigested, and this improvement corresponds to an increase in the C:N ratio of the treatments (Table 2). This finding supports the existing literature that the use of codigestion can produce positive synergisms as the mixture reaches the optimum 20–30 C:N range [28,29]. Within this optimum C:N, the stages of the AD process (hydrolysis, acidogenesis, acetogenesis, and methanogenesis) occur in a more optimal balance. When the C:N is too low, the microbes will primarily convert nitrogen to ammonium ions, which increases the pH and negatively affects biogas production [30]. If the C:N is too high, then the acidogenic bacteria outpace the methanogenic bacteria, also lowering biogas yield [28]. Our findings indicate that optimum C:N does enhance biogas yield in batch reactions, likely due to the enhanced synchronicity of the AD process.
Although the two BW codigestion treatments had fairly similar C:N (see Table 2), they performed very differently. Codigesting FW with more AW increased the quality of biogas. In contrast, codigesting BW with more AW reduced biogas quality. Since they are both derived from fibrous plant material, both AW and BW possess quantities of cellulose, hemicellulose, and lignin. These three components have different levels of biodegradability by the bacteria in AD systems, with cellulose and hemicellulose being beneficial to methane production, while lignin impedes methane production [19]. Cellulose from AW is about 58.9% biodegradable, followed by hemicellulose at 49.5%, and lignin, having only 0.1% biodegradability [19]. AW:BW 2:1 was comprised of 23.9% hemicellulose and 19.7% lignin, similar to AW:BW 1:1, which was comprised of 23.5% and 19.4% of hemicellulose and lignin, respectively. The AW:BW 2:1 treatment was comprised of 2.3% more cellulose than the AW:BW 1:1 (27.8% and 25.5%, respectively) but the AW:BW 2:1 treatment performed worse that AW:BW 1:1. The explanation thus lies in the components of the BW, where AW:BW 1:1 has more BW in the mixture, which contained 4.1% more protein, 1.67% more fat, and 1% fewer carbs that the AW:BW 2:1 treatment. These findings suggest fat and protein would be needed to enhance digester performance, potentially outweighing the benefits that more cellulose can have for biogas production.
Adding more AW to the BW would increase the particle size of the feedstocks, which may play a significant role in their biodegradability. Past studies also found that particle size of feedstock mixtures had a significant impact on biogas production, as microorganisms are able to breakdown these feedstocks more efficiently because there is more available surface area for digestion [31]. Even though the FW and AW were both ground through a grinder and shredder, respectively, the BW clearly had much finer waste particles due to the preprocessing of grains before use at a brewery. Preprocessing grains for brewing involves milling, which can increase CH4 yields of lignocellulosic wastes by 5–25% due to increases in the hydrolysis rate in the digester [31].
There are a few trends that emerge from the digestate effluent composition analysis. The total C concentration in the effluents were not significantly different and were less than the concentrations in the feedstocks for each treatment. This is because C is converted to CH4 and CO2 during AD. All of the effluents from the different FW treatments were therefore equally valuable as soil amendments.
The FW-K treatment was the only one with decreased nitrogen concentration in the effluent, from 6.5% (SE = 0.11) to 3.6% (SE = 0.04). It started with a significantly greater concentration of nitrogen than the other treatments (p < 0.001) and ended with significantly less nitrogen than the initial feedstock (p < 0.001). The high nitrogen concentration for the feedstock is not surprising since the ketogenic diet is high in protein. However, the decrease in the nitrogen concentrations of the effluent suggests that bacterial communities used the available nitrogen [23], which may contribute to greater biogas production. In contrast, the effluents from the vegetarian (FW-V) and omnivorous (FW-O) diets increased in nitrogen concentration, from 3.3% to 4.8%, and 3.9% to 5.0%, respectively. These findings suggest that the microbial communities did not utilize the available nitrogen, which is reflected in the lower biogas production [22]. Other studies have found that if the pH was low, FW high in soluble carbohydrates (such as that of the omnivorous and vegetarian diets) would yield volatile fatty acids (VFAs) and ammonium that could accumulate and cause methanogenic inhibition [32]. Although VFA profiles were not measured, this was likely the case for the omnivorous and vegetarian diets, as their resulting nitrogen concentrations were higher. This characteristic makes these effluents useful as nitrogen fertilizers, as long as they do not have concentrations high enough to leach from soils [33].
The C:N ratio of the effluent after digestion is positively correlated with the final CH4 concentration. Effluent from the ketogenic diet had the highest average C:N ratio, at 12.4, and produced significantly more CH4, but it started with the lowest C:N ratio at 7.1. The vegetarian feedstock more closely aligned with the ideal C:N ratio [34], with a C:N of 13.3, but it yielded the lowest amount of biogas with a maximum of only 16.7% CH4. This indicates that while the C:N ratio of the feedstock is an important indicator of performance, the balance of carbohydrates, lipids, and proteins is more important.
The effluents from the ketogenic and paleolithic diets had the highest concentrations of phosphorus, at 0.12% and 0.16% respectively. As long as these concentrations are not high enough to leach from soils, these effluents would be more appropriate for use as phosphorus fertilizer than the effluents from the other diets [32]. This therefore suggests that FW from the ketogenic diet would generate both high-quality biogas and phosphorus-rich digestate via AD. Micronutrients, minerals, heavy metals, and toxins all contribute to digestate quality. While all components of digestate were not measured in this study, prior work indicates that effluents derived from FW are better quality than other waste streams (e.g., municipal waste) due to low concentrations of heavy metals and pathogens [25]. Therefore, the marketability of the effluents described here as fertilizer is high.

5. Conclusions

This study is relevant for both small- and large-scale AD systems that source organic material from postconsumer food facilities. If low-carbohydrate diets, such as the ketogenic or paleolithic diet, continue to increase, the composition of the wasted food will change and therefore affect the performance of AD systems. Since waste from the ketogenic diet has been found to produce more biomethane, it is important to keep these wastes out of landfills, where the biomethane has the opportunity to escape into the atmosphere as a potent greenhouse gas. AD systems that source postconsumer FW generated from facilities with a mostly omnivorous or vegetarian clientele can increase biogas production by codigesting with feedstocks higher in C, such as dedicated Miscanthus × giganteus residues, or higher in fat, such as grease waste. Since consumers who eat more fresh fruits and vegetables waste these foods more (due to the shorter shelf-life [35]), the resulting FW is higher in soluble carbohydrates and therefore does not perform well in terms of biogas production in AD. The ketogenic and paleolithic diets are high in animal-based foods, which are a large source of greenhouse gas emissions during production [35], but wastes from these foods perform well in AD. BW does not need as many C-rich additives in codigestion to perform well, in contrast with omnivorous FW.
If soluble carbohydrate consumption continues to increase in the human diet [36], then this could benefit farming communities that seek organic nitrogen fertilizers. However, the high soluble carbohydrate content of these waste streams contributes to inhibitory VFA and ammonium production during AD [31]. The low C:N ratios of the effluent from each treatment put them in a good position for use as soil amendments and nitrogen fertilizer. Specifically, the effluents from the ketogenic and paleolithic diets have high marketability potential due to the higher concentrations of phosphorus, as long as the concentrations are not so high that they leach from the soil. Reducing FW at the source should be a priority over the generation of by-products. Still, as long as FW continues to increase, emerging organic waste characteristics need to be considered while designing more sustainable food–energy–waste management systems.

Author Contributions

Conceptualization, S.C.D.; methodology, T.H., E.N., K.E.M. and S.C.D.; software, T.H., E.N. and S.C.D.; validation, T.H. and S.C.D.; formal analysis, T.H., E.N. and S.C.D.; investigation, T.H., E.N. and K.E.M.; resources, S.C.D.; data curation, T.H.; writing—original draft preparation, T.H.; writing—review and editing, T.H. and S.C.D.; visualization, T.H. and S.C.D.; project administration, S.C.D.; funding acquisition, S.C.D. All authors have read and agreed to the published version of the manuscript.

Funding

This research was funded by the National Science Foundation, grant number 1856058, and the APC was funded by Ohio University.

Institutional Review Board Statement

Not applicable.

Informed Consent Statement

Not applicable.

Data Availability Statement

Data for this study will be made available on a public project data page after publication; links will be available from https://www.davisresearchgroup.org/anaerobic-digestion (accessed on 13 December 2021).

Acknowledgments

The authors acknowledge the support of technical staff in the Institute for Sustainable Energy and Environment and undergraduate research assistant Nicholas Momenee.

Conflicts of Interest

The authors declare no conflict of interest.

References

  1. USEPA. National Overview: Facts and Figures on Materials, Wastes and Recycling. Available online: https://www.epa.gov/facts-and-figures-about-materials-waste-and-recycling/national-overview-facts-and-figures-materials#Landfilling (accessed on 1 December 2021).
  2. David, A.; Govil, T.; Tripathi, A.K.; McGeary, J.; Farrar, K.; Sani, R.K. Thermophilic Anaerobic Digestion: Enhanced and Sustainable Methane Production from Co-Digestion of Food and Lignocellulosic Wastes. Energies 2018, 11, 2058. [Google Scholar] [CrossRef] [Green Version]
  3. Miller, K.; Herman, T.; Philipinanto, D.; Davis, S. Anaerobic Digestion of Food Waste, Brewery Waste, and Agricultural Residues in an Off-Grid Continuous Reactor. Sustainability 2021, 13, 6509. [Google Scholar] [CrossRef]
  4. Hills, R.D., Jr.; Erpenbeck, E. Guide to Popular Diets, Food Choices, and Their Health Outcome. Health Care Curr. Rev. 2018, 6, 1–6. [Google Scholar] [CrossRef]
  5. Freedman, M.R.; King, J.; Kennedy, E. Executive Summary. Obes. Res. 2001, 9, 1S–5S. [Google Scholar] [CrossRef]
  6. White, R.; Frank, E. Health effects and prevalence of vegetarianism. West. J. Med. 1994, 160, 465–470. [Google Scholar]
  7. Bryngelsson, S.; Asp, N.-G. Popular diets, body weight and health. Scand. J. Nutr. 2005, 49, 15–20. [Google Scholar] [CrossRef]
  8. Statista. America’s Brewery Boom. Available online: https://www.statista.com/chart/10280/americas-brewery-boom/ (accessed on 13 December 2021).
  9. Mathias, T.S.; de Aguiar, P.F.; de Almeida e Silva, J.B.; de Mello, P.M.; Servulo, E.C. Brewery waste reuse for protease production by lactic acid fermentation. Food Technol. Biotechnol. 2017, 2, 4378. [Google Scholar] [CrossRef]
  10. Colen, L.; Swinnen, J. Economic Growth, Globalisation and Beer Consumption. J. Agric. Econ. 2015, 67, 186–207. [Google Scholar] [CrossRef]
  11. Mussatto, S.I. Biotechnological Potential of Brewing Industry By-Products. In Biotechnology for Agro-Industrial Residues Utilisation: Utilisation of Agro-Residues; Singh Nee Nigam, P., Pandey, A., Eds.; Springer: Dordrecht, The Netherlands, 2009; pp. 1–466. ISBN 9781402099410. [Google Scholar]
  12. Bocher, B.T.; Agler, M.; Garcia, M.L.; Beers, A.R.; Angenent, L.T. Anaerobic digestion of secondary residuals from an anaerobic bioreactor at a brewery to enhance bioenergy generation. J. Ind. Microbiol. Biotechnol. 2008, 35, 321–329. [Google Scholar] [CrossRef]
  13. Vitanza, A.; Cortesi, V.; Gallo, V.; Colussi, I. Biovalorization of brewery waste by applying anaerobic digestion. Chem. Biochem. Eng. Q. 2016, 30, 351–357. [Google Scholar] [CrossRef]
  14. Mainardis, M.; Flaibani, S.; Mazzolini, F.; Peressotti, A.; Goi, D. Techno-economic analysis of anaerobic digestion implementation in small Italian breweries and evaluation of biochar and granular activated carbon addition effect on methane yield. J. Environ. Chem. Eng. 2019, 7, 103184. [Google Scholar] [CrossRef]
  15. Davis, S.C.; Parton, W.J.; Del Grosso, S.J.; Keough, C.; Marx, E.; Adler, P.R.; DeLucia, E.H. Impact of second-generation biofuel agriculture on greenhouse-gas emissions in the corn-growing regions of the US. Front. Ecol. Environ. 2011, 10, 69–74. [Google Scholar] [CrossRef] [Green Version]
  16. Qin, Z.; Zhuang, Q.; Zhu, X. Carbon and nitrogen dynamics in bioenergy ecosystems: 2. Potential greenhouse gas emissions and global warming intensity in the conterminous United States. GCB Bioenergy 2013, 7, 25–39. [Google Scholar] [CrossRef]
  17. Fengel, D.; Wegener, G. Wood: Chemistry, Ultrastructure, Reactions; DeGruyter: Berlin, Germany, 1984; ISBN 3-11-0084813. [Google Scholar]
  18. Hendricks, A.; Zeeman, G. Pretreatments to enhance the digestibility of lignocellulosic biomass. Bioresour. Technol. 2009, 100, 10–18. [Google Scholar] [CrossRef] [PubMed]
  19. Li, W.; Khalid, H.; Zhu, Z.; Zhang, R.; Liu, G.; Chen, C.; Thorin, E. Methane production through anaerobic digestion: Participation and digestion characteristics of cellulose, hemicellulose and lignin. Appl. Energy 2018, 226, 1219–1228. [Google Scholar] [CrossRef]
  20. Prescott, M.P.; Herritt, C.; Bunning, M.; Cunningham-Sabo, L. Resources, Barriers, and Tradeoffs: A Mixed Methods Analysis of School Pre-Consumer Food Waste. J. Acad. Nutr. Diet. 2019, 119, 1270–1283.e2. [Google Scholar] [CrossRef] [PubMed]
  21. CalorieKing. Available online: https://www.calorieking.com/us/en/ (accessed on 13 December 2021).
  22. Cirne, D.; Paloumet, X.; Björnsson, L.; Alves, M.; Mattiasson, B. Anaerobic digestion of lipid-rich waste—Effects of lipid concentration. Renew. Energy 2007, 32, 965–975. [Google Scholar] [CrossRef] [Green Version]
  23. Asri, O.; Afilal, M.E. Comparison of the experimental and theoretical production of biogas by monosaccharides, disaccharides, and amino acids. Int. J. Environ. Sci. Technol. 2017, 15, 1957–1966. [Google Scholar] [CrossRef]
  24. Oliveira, J.V.; Alves, M.M.; Costa, J.C. Biochemical methane potential of brewery by-products. Clean Technol. Environ. Policy 2018, 20, 435–440. [Google Scholar] [CrossRef]
  25. Alburquerque, J.A.; de la Fuente, C.; Ferrer-Costa, A.; Carrasco, L.; Cegarra, J.; Abad, M.; Bernal, M.P. Assessment of the fertiliser potential of digestates from farm and agroindustrial residues. Biomass Bioenergy 2012, 40, 181–189. [Google Scholar] [CrossRef]
  26. Lopez, V.M.; De la Cruz, F.; Barlaz, M.A. Chemical composition and methane potential of commercial food wastes. Waste Manag. 2016, 56, 477–490. [Google Scholar] [CrossRef] [PubMed]
  27. Xue, S.; Wang, Y.; Lyu, X.; Zhao, N.; Song, J.; Wang, X.; Yang, G. Interactive effects of carbohydrate, lipid, protein composition and carbon/nitrogen ratio on biogas production of different food wastes. Bioresour. Technol. 2020, 312, 123566. [Google Scholar] [CrossRef] [PubMed]
  28. Das Neves, L.C.M.; Converti, A.; Penna, T.C.V. Biogas Production: New Trends for Alternative Energy Sources in Rural and Urban Zones. Chem. Eng. Technol. 2009, 32, 1147–1153. [Google Scholar] [CrossRef]
  29. Wang, X.; Ren, G.; Han, X.; Yang, G.; Feng, Y. Optimizing feeding composition and carbon–nitrogen ratios for improved methane yield during anaerobic co-digestion of dairy, chicken manure and wheat straw. Bioresour. Technol. 2012, 12073, 83. [Google Scholar] [CrossRef]
  30. Choi, Y.; Ryu, J.; Lee, S.R. Influence of carbon type and carbon to nitrogen ratio on the biochemical methane potential, pH, and ammonia nitrogen in anaerobic digestion. J. Anim. Sci. Technol. 2020, 62, 74–83. [Google Scholar] [CrossRef] [Green Version]
  31. Delgenés, J.P.; Penaud, V.; Moletta, R. Pretreatments for the enhancement of anaerobic digestion of solid wastes: Chapter 8. In Biomethanization of the Organic Fraction of Municipal Solid Wastes 2002; IWA Publishing: London, UK; pp. 201–228.
  32. Fisgativa, H.; Tremier, A.; Dabert, P. Characterizing the variability of food waste quality: A need for efficient valorisation through anaerobic digestion. Waste Manag. 2016, 50, 264–274. [Google Scholar] [CrossRef]
  33. Sogn, T.A.; Dragicevic, I.; Linjordet, R.; Krogstad, T.; Eijsink, V.G.H.; Eich-Greatorex, S. Recycling of biogas digestates in plant production: NPK fertilizer value and risk of leaching. Int. J. Recycl. Org. Waste Agric. 2018, 7, 49–58. [Google Scholar] [CrossRef] [Green Version]
  34. Miller, K.E.; Grossman, E.; Stuart, B.J.; Davis, S.C. Pilot-scale biogas production in a temperate climate using variable food waste. Biomass Bioenergy 2020, 138, 105568. [Google Scholar] [CrossRef]
  35. Conrad, Z. Food Waste, Healthy Diets, and Environmental Sustainability. Nutr. Today 2020, 55, 5–10. [Google Scholar] [CrossRef] [Green Version]
  36. Cohen, E.; Cragg, M.; Defonseka, J.; Hite, A.; Rosenberg, M.; Zhou, B. Statistical review of US macronutrient consumption data, 1965–2011: Americans have been following dietary guidelines, coincident with the rise in obesity. Nutrition 2015, 31, 727–732. [Google Scholar] [CrossRef]
Figure 1. Average and peak methane concentrations produced by different anaerobically digested waste feedstock mixtures. Different letters indicate a statistical difference between treatment groups within each methane variable, and error bars represent standard error (See Section 2.1 for Statistic Analysis).
Energies 15 01538 g001
Figure 2. Biogas quality from select feedstock mixtures throughout incubation period.
Energies 15 01538 g002
Figure 3. Biogas quality from anaerobically digested feedstock mixtures of variable compositions.
Energies 15 01538 g003
Table 1. Food Waste Treatment Components.
PaleolithicOmnivorousKetogenicVegetarianAW:FW 1:1AW:FW 2:1AW:BW 1:1AW:BW 2:1
Feedstock ComponentFeedstock Component According to Diet [7]Included?Mass Used in Experiment (g) **Included?Mass Used in Experiment (g) **Included?Mass Used in Experiment (g) **Included?Mass Used in Experiment (g) **Included?Mass Used in Experiment (g) **Included?Mass Used in Experiment (g) **Included?Mass Used in Experiment (g) **Included?Mass Used in Experiment (g) **
SweetsSugarNo-Yes19.76No-Yes22.90Yes-Yes-No-No-
StarchBreadWhole grain *95.22Yes33.33No-Yes38.40Yes-Yes-No-No-
PastaNo-Yes33.13No-Yes37.70Yes-Yes-No-No-
Breakfast CerealsNo-Yes33.79No-Yes36.60Yes-Yes-No-No-
RiceNo-Yes35.50No-Yes37.40Yes-Yes-No-No-
VegetablesPotatoesNo-Yes39.35No-Yes41.60Yes-Yes-No-No-
Root vegetablesYes103.04Yes38.82No-Yes43.30Yes-Yes-No-No-
VegetablesYes102.55Yes38.90Low carb106.60Yes42.80Yes-Yes-No-No-
FruitsFruits, berriesYes54.24Yes19.26Low carb56.17Yes23.20Yes-Yes-No-No-
Animal-based proteinMilk, yogurtNo-Yes8.90Full-fat26.70Yes8.90Yes-Yes-No-No-
CheeseNo-Yes7.50Full-fat26.40Yes8.00Yes-Yes-No-No-
Plant-based proteinFish, meat, seafood, chickenGrass-fed69.28Yes50.60Yes174.57No-Yes-Yes-No-No-
EggYes69.10Yes50.40Yes174.72Yes56.60Yes-Yes-No-No-
Plant-based proteinBeans, lentilsNo-Yes5.10No-Yes5.65Yes-Yes-No-No-
Nuts, seedsYes13.50Yes5.00Yes17.34Yes5.90Yes-Yes-No-No-
Cooking fatsNo-Yes-Yes-Yes-Yes-Yes-No-No-
Total Food Waste Yes79.22Yes52.9
Beer Waste-No-No-No-No-No-No-Yes310.91Yes212.8
Miscanthus-No-No-No-No-Yes30.83Yes41.11Yes30.83Yes41.11
* All limitations were followed, ** Wet mass.
Table 2. Compositions of food waste mixtures.
FW-OFW-PFW-KFW-VAW:FW 1:1AW:FW 2:1AW:BW 1:1AW:BW 2:1
Fat13.8%18.2%36.1%11.1%6.9%4.9%5%3.3%
Protein19.8%31.1%49.3%13.9%9.9%6.6%12.3%8.2%
Soluble Carbohydrate62.4%40.1%12.1%70.5%34.7%25.4%3.9%4.9%
Fiber4%10.6%2.4%4.5%2.0%1.3%--
Ash----1.4%1.8%3.1%3.0%
Cellulose----16.2%21.6%25.5%27.8%
Hemicellulose----12.3%16.4%23.5%23.9%
Lignin----9.7%13.0%19.8%19.7%
Unresolved Portion----7.0%9.4%7.0%9.4%
C:N ratio14.210.06.919.419.227.312.013.9
Table 3. Full experiment ANOVA of treatment differences for biogas quality. (There were 50 total different AD reactors jars for this study. The peak CH4 measurement for each individual jar reactor is reflected in this table. The daily average CH4 concentration for a treatment in a particular incubation round was assessed within 212 sampling sessions, which is also reflected here in Table 3).
NDF 1DF 2F-ValueSig.Null
Daily Average CH4212720445.703<0.001Rejected
Peak CH4507423.4870.005Rejected
Table 4. Digestate characteristics from different food waste treatments.
Diet
(Jars)
C:N Pre-
Digestion (SE)
C:N Post-
Digestion (SE)
% C Post-
Digestion (SE)
% N Post-
Digestion (SE)
% P Post-
Digestion (SE)
TS Pre-
Digestion (%)
TS Post-
Digestion (%)
Paleo
(N = 5)
8.94 (0.09)8.65 (0.18)42.11 (0.49)4.87 (0.11)0.16 (0.04)107
Omni
(N = 6)
11.09 (0.45)8.17 (0.14)41.23 (1.46)5.01 (0.14)0.05 (0.01)107
Keto
(N = 6)
7.12 (0.03)12.26 (0.13)43.62 (0.55)3.56 (0.04)0.12 (0.05)96
Veg
(N = 4)
13.60 (0.09)8.72 (0.08)41.97 (0.40)4.81 (0.05)0.03 (0.01)119
Publisher’s Note: MDPI stays neutral with regard to jurisdictional claims in published maps and institutional affiliations.

