Article

Using Natural Gas Resources to De-Risk Renewable Energy Investments in Lower-Income Countries

1
Energy Economics Group (EEG), Institute of Energy Systems and Electrical Drives, Vienna University of Technology, 1040 Vienna, Austria
2
Independent Researcher, Beirut 10999, Lebanon
*
Author to whom correspondence should be addressed.
Energies 2022, 15(5), 1651; https://doi.org/10.3390/en15051651
Submission received: 23 January 2022 / Revised: 9 February 2022 / Accepted: 16 February 2022 / Published: 23 February 2022

Abstract

:
Combatting climate change necessitates a substantial global increase in renewable electricity capacity. Many low-income and lower-middle-income countries suffer from unfavorable green financing conditions. Fifteen of these countries possess substantial natural gas reserves. To overcome green financing constraints in such countries, we propose an integrated energy contract that awards a renewable energy project in parallel with an upstream natural gas project to interested energy companies. The state returns from the natural gas project provide a guarantee for renewable energy investments, reducing their associated risks. We conduct Monte Carlo simulations for each of the targeted countries after populating the input parameters for the upstream natural gas and renewable energy projects, including forecasting country-specific natural gas prices. When accounting for 10% of their existing natural gas reserves in the proposed contract, Nigeria, Myanmar, and Indonesia can achieve more than 60% of their 2030 renewable energy target capacity additions while countries with low access to electricity can significantly upscale their installed capacities. The guarantee mechanism provides protection levels exceeding 96% on renewable energy investments. The proposed contract enables the considered countries to increase their renewable energy capacities while inducing economic development.

1. Introduction

Climate change is a global challenge that humanity faces and that necessitates a rapid transition to low-carbon energy systems [1]. When approaching the topic from the point of view of developing economies, especially those classified by the United Nations as lower-middle-income and low-income countries (referred to as lower-income countries in the rest of this paper), different considerations should be kept in mind. First, these countries are not the inducers of climate change [2]. Therefore, if a global response should take place in the form of energy transition, among others, it should not cause additional burdens for their strained economies [3]. Second, while environmental concerns are essential in shaping the response to climate change, lower-income countries have other pressing priorities related to economic development and social inclusion [4]. Third, at the energy systems level, increasing electricity production capacity and affordable access are on top of the energy agenda of these countries [5,6]. This particularly favors the usage of fossil fuel-based solutions when these fuels are produced locally [6,7].
While all these concerns are legitimate, lower-income countries cannot remain idle in the face of climate change. Their geography, their overdependence on sensitive sectors, and their limited infrastructure and financial resources make them more prone to the devastating effects of climate change [8,9]. Therefore, achieving energy transition and inducing economic development should be regarded as two non-conflicting objectives [4]. Solutions that achieve both objectives should be prioritized.
Lower-income countries have limited financial capabilities [5] and tend to undertake energy planning based on the theory of scarcity [10] rather than optimally. They possess large untapped renewable energy investment potential [11] that remains unattractive to private sector investors [12]. Private investors adopt a risk-return perspective to investments [13]; a project with higher perceived risk is either dismissed or is only chosen if it promises high returns that compensate for the risk taken. Developing countries in general, and lower-income countries specifically, face a series of political, regulatory, commercial, technical, and informational barriers to the dissemination of renewable energy technologies [14,15]. These barriers result in an increased perception of risks for such investments and accordingly make access to finance either impossible or very costly [16]. Lower-income countries can therefore easily get stuck in “a climate investment trap” [17]. High-risk perceptions induce a high weighted average cost of capital (WACC), which delays green investments. The delayed green investments exacerbate the negative effects of climate change on the overall socio-economic situation and therefore increase further investment risks.
Breaking this trap necessitates reducing the investment risks by ensuring the ability of investors to monetize their returns for years in the future [11,18,19]. In the context of lower-income countries, the state maintains a main role in the electricity sector. The state or a state-owned entity acts as the off-taker of the produced electricity sold based on feed-in tariffs or power purchase agreements (Section S1 of the Supplementary Materials provides more details). One of the most important risks from the investor’s point of view is that of the off-taker defaulting on their electricity payments [18,20]. Investment guarantee mechanisms provided by credible international institutions are a common approach to provide investors with the necessary assurance and coverage in case of the inability of the off-taker to pay its contractual duties. This results in lowering the country’s risk and the investment WACC [18]. Yet, the guarantee schemes available, among other sustainable finance frameworks, fall short of the needs of developing economies [17]. Matthäus and Mehling propose a new global guarantee mechanism to reduce risk premia for renewable energy investments in regions with adverse financing conditions and estimate savings reaching 1.5 trillion USD until 2030 [20]. While the proposed guarantee might indeed accelerate the dissemination of renewable energy technologies in developing countries, it is still in the ideation phase and requires global alignment for its implementation.
In this paper, we focus on the subset of the lower-income countries that possess natural gas reserves. These countries typically aim to use their reserves to induce economic development especially since natural gas is perceived as the least polluting [21] and the most resilient fossil fuel during the ongoing energy transition [22]. However, they risk getting trapped in carbon lock-in as they increase the gasification of their economies.
The question that this paper aims to address is: How can these countries develop portions of their natural gas resources in a way that supports the good cause of a greener future with less reliance on fossil fuels and more dissemination of renewable energy technologies? This question becomes timely and relevant with the current observed trend where many international oil companies, especially with headquarters in Europe, are undertaking a transition to becoming integrated energy companies interested in investing in both oil and gas and the renewable energy sectors [23,24,25].
Succeeding in their quest for a greener future supported by the development of natural gas resources, the considered lower-income countries can open wide doors for the hydrogen economy. These countries can produce hydrogen either from natural gas or through water electrolysis powered by renewable energy sources [26] and then consume it locally [27] or export it at low cost using existing natural gas export pipelines [28].
In a previous paper for two of us, we introduced an upstream oil and gas production sharing contract that includes renewable energy elements where companies interested in oil and gas and renewable energy commit to re-investing a share of their oil and gas returns in renewable energy projects in the country [25]. Yet, these re-investments come later in the future, only when the production phase starts and require several years to materialize. This constitutes a hurdle for lower-income countries in urgent need of green financing, especially in the wake of the COVID-19 pandemic.
To the best of our knowledge, this paper proposes, for the first time, a novel integrated energy contract that aims at overcoming green financing constraints by awarding a renewable energy project in parallel to an upstream natural gas project to an interested energy company. The company commits to undertaking renewable energy investments in the electricity sector in parallel to investing in the upstream gas project, such that the forecasted future state returns from the upstream gas project act as a guarantee for the renewable energy project, reducing its associated risks. We assess the implications of such a scheme on the decarbonization efforts in lower-income countries that possess natural gas reserves and the viability of this guarantee mechanism. Since most of the lower-income countries with natural gas reserves possess a great potential for solar energy, we assume that solar photovoltaics (PVs) are the renewable energy technology of choice. We conduct Monte Carlo simulations that consider the main uncertain elements of upstream natural gas field development and solar PV projects after generating forecasts for country-level future natural gas prices. We map the implications of the proposed energy contract and guarantee scheme for each of the analyzed countries when a limited portion of 10% of their proven natural gas reserves is considered.
The following section presents, at a conceptual level, the proposed integrated energy contract that includes the “cross-guarantee” between natural gas and renewable energy projects. The Section 3 describes the mathematical formulation of the proposed contract along with the details of the Monte Carlo simulations. The Section 4 describes the main findings of the analysis and highlights the implications of the proposed integrated energy contract on the efforts of lower-income countries to decarbonize their energy systems while developing a portion of their natural gas reserves. We conclude by re-iterating the novelty of our work and discussing limitations and areas of future research. The Supplementary Materials complement the paper and fully describe the input data used and the assumptions made.

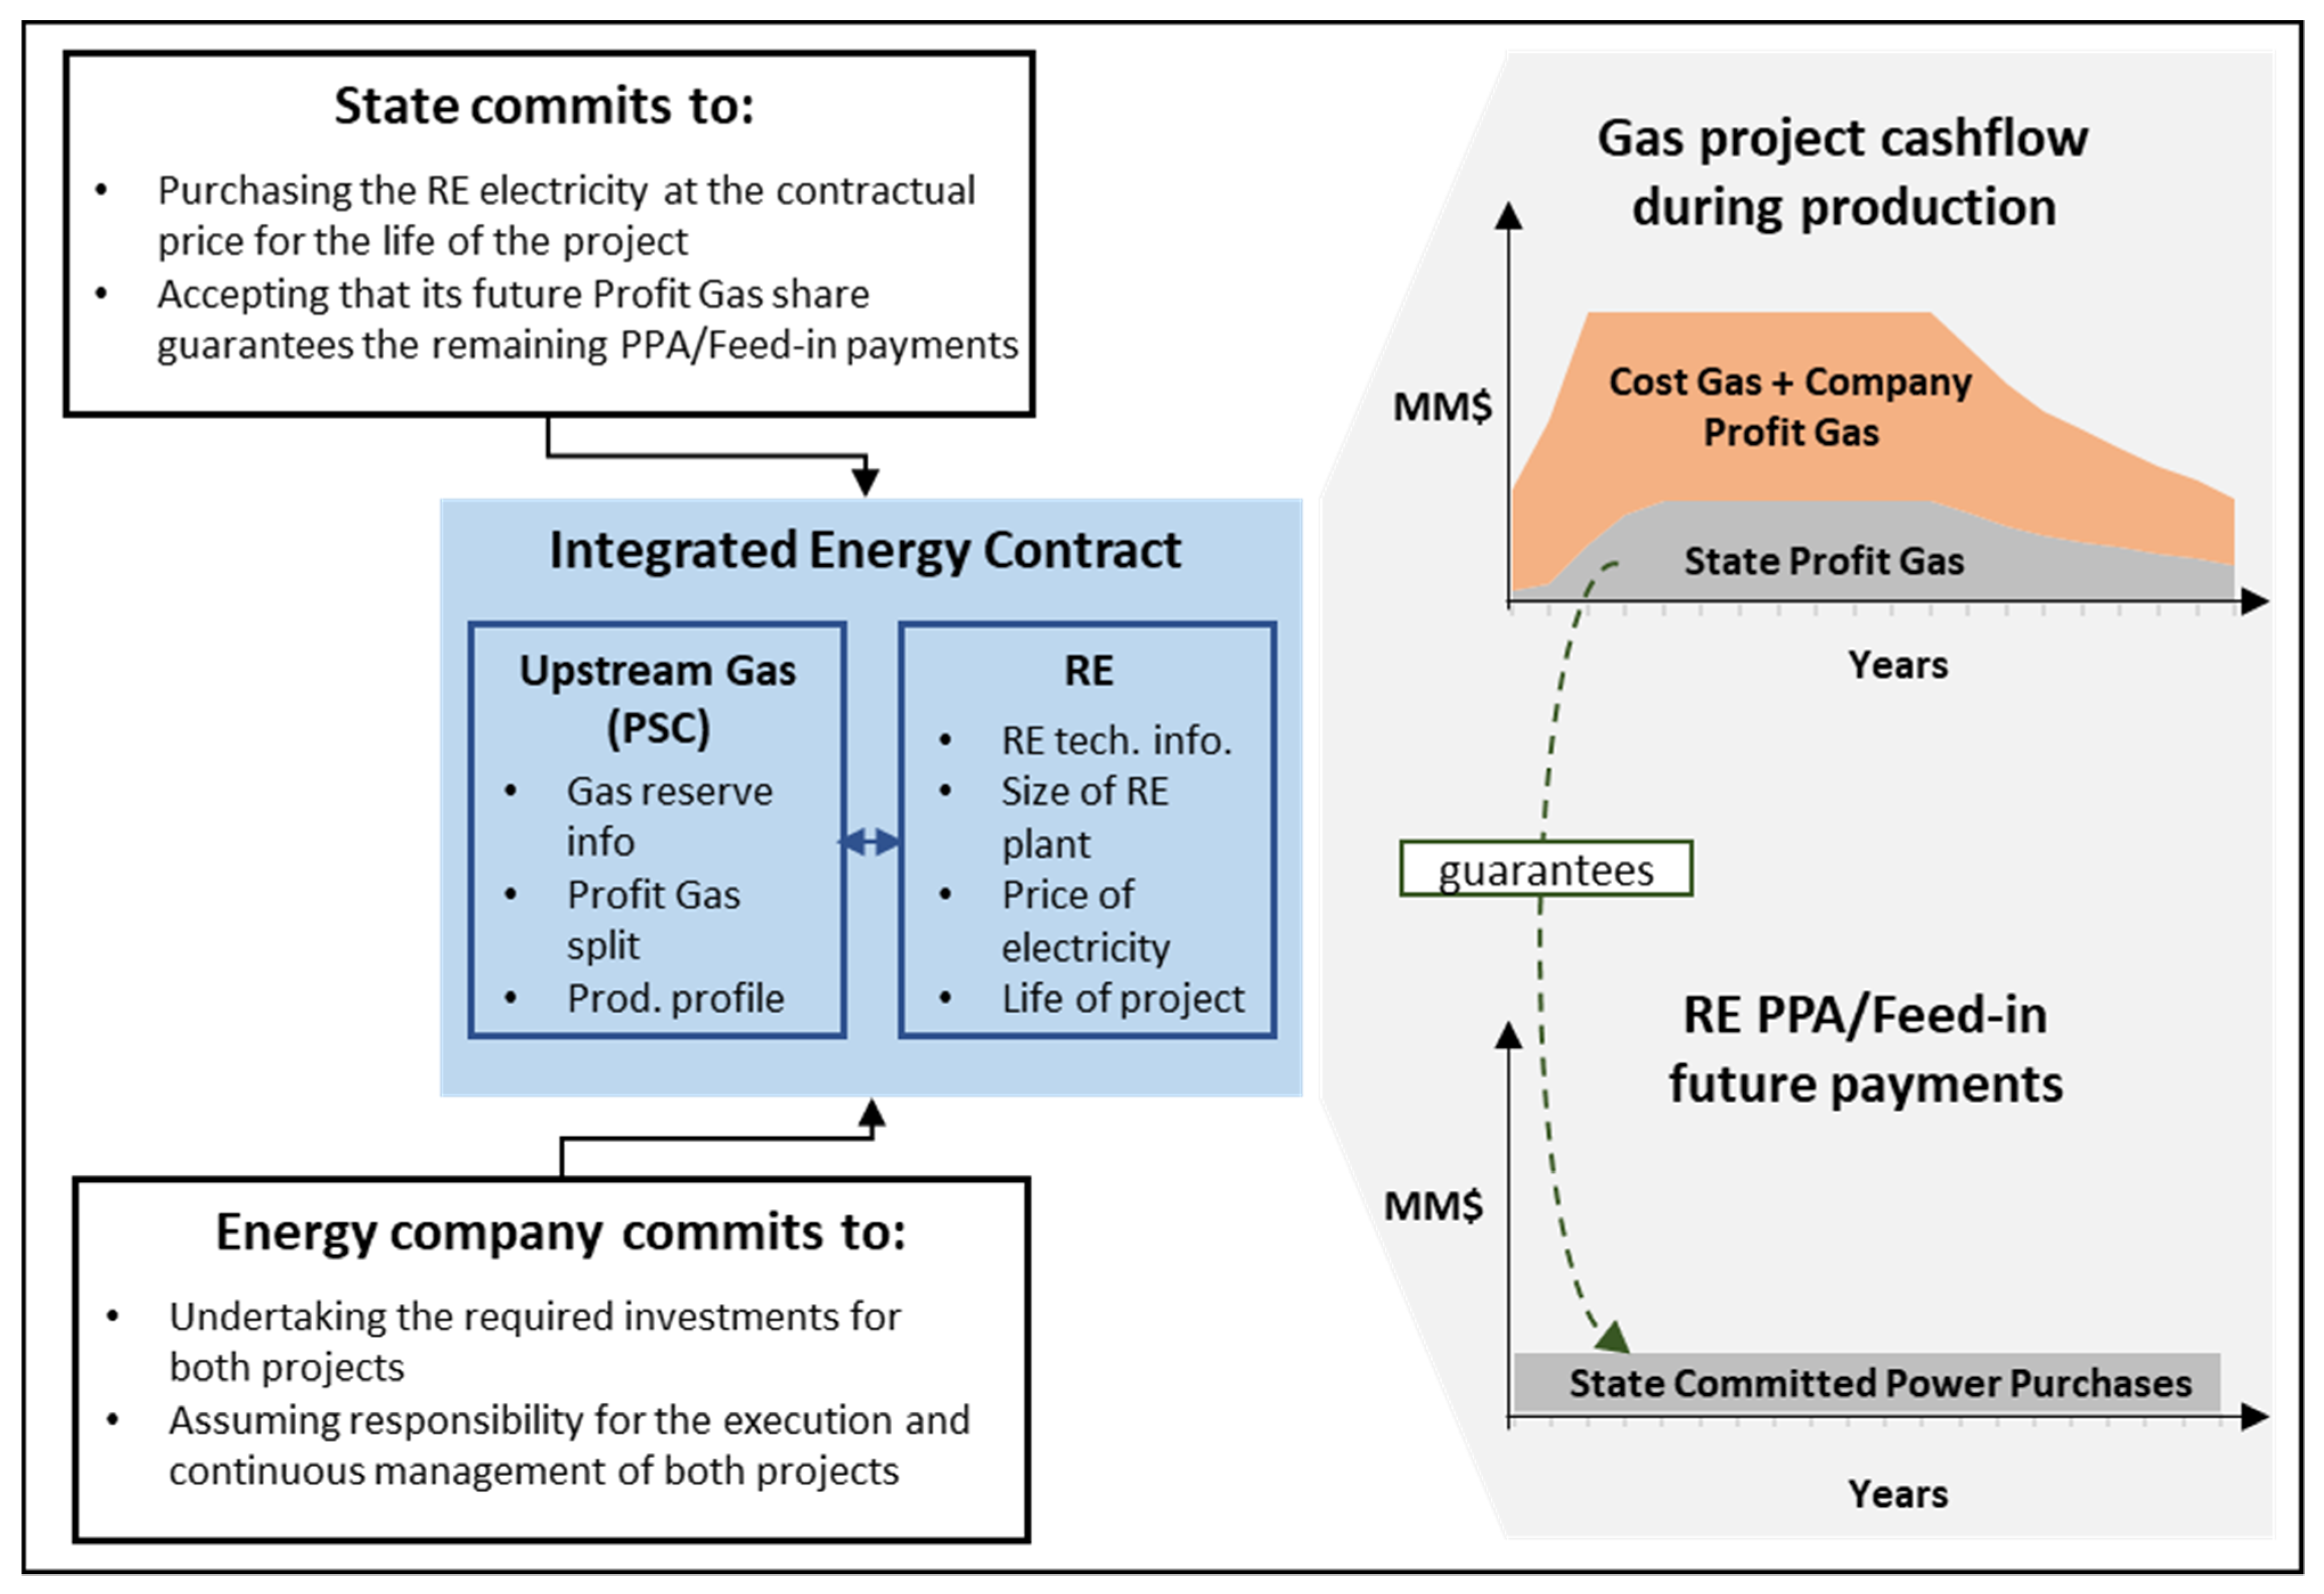
2. The Integrated Energy Contract

This section presents the reasoning behind the proposed integrated energy contract, then highlights its conceptual structure.

2.1. Rationale

In 2020, the United Nations classified 77 countries as low income or low-middle income [29]. Fifteen of these countries possess considerable unassociated natural gas reserves exceeding five trillion cubic feet (Tcf) each [30]. Table 1 provides an overview of the current electricity sector status and the 2030 renewable energy targets of these countries in addition to their existing natural gas reserves. The renewable energy targets are mainly based on the announcements that these countries made as part of their Nationally Determined Contributions (NDCs) to reduce their emissions in line with the Paris agreement. More than half of these countries have not yet achieved 90% access to electricity. While the share of renewable electricity generation is sometimes very high, as is the case for Mozambique, Angola, Myanmar, and Papua New Guinea, the low access to electricity in these countries indicates that the installed capacities are not enough to meet the available demand. Considering the currently installed capacities, the share of non-hydro renewable electricity capacity is below 10% for 11 out of the 15 countries. The large differences between the renewable electricity status in 2020 and the 2030 targets are apparent across almost all the considered countries indicating the level of effort and investments required in the ongoing decade.
The academic literature discusses different barriers that hinder the successful deployment of renewable energy technologies in developing countries [14,15,16,36,37]. The considered lower-income countries explicitly highlight many of these barriers in their NDCs [32]: (1) institutional and regulatory barriers in the form of weak public institutions, limited cross-institutional coordination, and lacking regulations; (2) informational barriers due to the absence of detailed assessments of renewable energy potential; (3) technical and technological barriers due to the limited availability of the specialized human resources and the required technologies. Yet, across the considered NDCs, the lack of sufficient green financing and the failure to attract private investments are recurring major concerns for the successful achievements of the desired climate goals, including the dissemination of renewable energy technologies. It is therefore crucial for these countries to de-risk renewable energy investments to succeed in decarbonizing their power systems.
The 15 lower-income countries possess considerable proven natural gas reserves. They all managed to attract investments from international oil and gas companies. Except for Syria, Ukraine, and Yemen (three countries that currently suffer from devastating wars that resulted in the execution of force majeure clauses in upstream gas contracts [35,38,39]), the remaining countries witness maintained upstream oil and gas operations by international companies (Section S2 of the Supplementary Materials describes the upstream investment climate in each of the considered countries.).
Therefore, it is beneficial for the countries considered to expand the interest of oil and gas companies into the renewable energy sector. This idea is not alien anymore, as many oil and gas companies are undergoing the transition to becoming energy companies [25]. European oil and gas (now energy) companies are leading the way in this transformation and are declaring aggressive renewable energy targets for 2030 in their bid for carbon neutrality by 2050 (Table 2).
Given this logic, the goal of lower-income countries would be to attract renewable energy investments from oil and gas companies at reduced WACC. This enables them to break the “climate investment trap” [17] and helps them achieve their renewable energy targets. The presence of major energy companies familiar with the lower-income countries and with previous experience in capacity building, knowledge transfer, and institutional support also contributes to overcoming the other barriers typically faced by lower-income countries.
An energy contract that spans the upstream gas and the renewable energy sectors can also be attractive for oil and gas companies in the transformation to becoming energy companies. If this energy contract provides solid guarantees for renewable energy investments, then this opens lucrative investment opportunities with limited competition from companies specialized in only renewable energy, as these will not be able to obtain similar guarantees. Such a contract is in line with the strategies of the energy companies to diversify their investments and reduce their carbon footprint. Their main concern would be related to the robustness of the guarantee mechanism.

2.2. Structure

In a typical upstream gas project, the contractual arrangements between the state and the company define the rights and obligations of both parties including, their shares from the produced gas. In the context of developing countries, the most adopted contractual arrangement is the production sharing contract (PSC) [45] which consists, in its basic form, of placing all the investment requirements on the shoulders of the private company while the state and the company share the produced gas according to well-defined terms [45,46]. Typically, once production starts, and after deducting an optional royalty that goes to the state, a portion of the produced gas is allocated to cover the incurred capital costs and the ongoing operational costs. This portion is labeled Cost Gas and is allocated to the company. The remaining portion is labeled Profit Gas and is split between the state and the company according to fixed or variable shares. The state and company shares of the Profit Gas should be crafted in a way that incentivizes the company to undertake the investment, promising it enough returns while providing the state with a perceived fair split. It is therefore common for these terms to be renegotiated just before the final investment decision, to align them with the realities of the time, as by then many uncertainties, such as the size of the available reserves and the detailed engineering plans for building the infrastructure, would have been resolved.
To overcome green financing constraints, the proposed integrated energy contract builds on the typical upstream gas PSC and adds a second dimension to tackle the renewable energy electricity project (Figure 1). The energy company provides the necessary investments for both projects, is responsible for their successful execution, and assumes full liability for managing their operations. The company can outsource some of the managerial or operational roles, but will always be the accountable party to the state. In parallel, the state commits to purchasing all the renewable electricity that will be produced throughout the life of the renewable project at the contractually agreed price. To de-risk the renewable energy project, the state offers its future Profit Gas share from the gas project as a guarantee that ensures that the company is paid for the renewable electricity it will be producing. At any point in time during the lives of both projects, the state is entitled to receive its Profit Gas share fully as long as the renewable electricity it is buying is paid for. If the state defaults on its payments at any point in time, then all the future state Profit Gas will be available to the company to collect its due payments. The mathematical definitions are provided in Section 3.
For the upstream gas project, the gas reserves that will be developed along with the projected production profile and the details of the PSC are important elements of the contract. The commercial factors that are part of the PSC, including the Profit Gas split between the state and the company, are determined based on the economics of the upstream gas project and the return expectations of the company. These elements can be subject to direct negotiations or to bidding.
For the renewable energy project, within reasonable boundaries set by the state, the flexibility is left to the company to decide on the size of investments that it is willing to make and, accordingly, the capacity of the renewable energy plant. In parallel, the company should agree with the state on the price of electricity for the duration of the agreement. This is also determined based on the economics of the renewable energy project and the return expectations of the company. Given that the renewable energy returns are now guaranteed against the risk of the default of the off-taker, the WACC that the company uses to run the economics of the renewable energy project should be reduced to reflect the reduction in risk.
In principle, when determining the size of the renewable energy investment, the company contemplates two conflicting objectives. Maximizing its investments maximizes the associated profit especially since the nature of the integrated energy contract offers it easy access to largely untapped renewable energy resources, as is the case with lower-income countries. Yet, the uncertainties that the future brings, mainly in terms of natural gas prices, have a great effect on the size of the state Profit Gas and, accordingly, the guarantee available to compensate the company in case of the off-taker defaulting. Striking the right balance here can be achieved by estimating the guarantee available based on a conservative natural gas price estimate that the company feels safe with. The size of the renewable energy investment should therefore be equal to the size of the conservative guarantee estimate.
To illustrate the proposed integrated energy contract, we develop a stylized version and run Monte Carlo simulations for each of the 15 lower-income countries, accounting for their specificities. We consider that each country is willing to offer 10% of its existing proven natural gas reserves under the integrated energy contract. We develop probability distributions for the estimates of capital and operational costs of the upstream gas project based on the cost profile of each country. Based on historical natural gas prices at the three main markets that act as regional hubs (the United States, Europe, and Japan), we develop an autoregressive model to forecast future hub gas prices. We treat every forecast as a random variable where its mean is the point forecast generated from the autoregressive model. This allows the testing of different scenarios for future gas prices. We then link the sales price of natural gas in each of the considered countries to one of the three regional hubs and accordingly develop distinct natural gas prices by country. For the renewable energy project, we set PVs as the technology of choice. We develop country-specific probability distributions for capital and operational costs.
In terms of financing, we differentiate between upstream gas and renewable energy projects. For the former, we use the declared rates of returns of European energy companies for their upstream investments to estimate ranges for their upstream project discount rates. For the renewable energy project, we estimate ranges for the company WACC based on estimates of costs of debt and equity and tax rates in each country. We measure the effect of the guarantee mechanism by assuming that it reduces the renewable energy project WACC by the country default spread [20].
Section 3 describes the mathematical formulation of the integrated energy contract and the details of the Monte Carlo simulations.

3. Materials and Methods

This section starts by presenting the details of the integrated energy contract, then discusses the various elements of the Monte Carlo simulations. Sources to input data are provided whenever they are introduced. The Supplementary Materials present a complete description of the input parameters.

3.1. Details of the Integrated Energy Contracts

To simplify the presentation of the essence of the integrated energy contract, we consider a stylized PSC for the upstream gas project. The same conclusions can be reached with a more complex and realistic PSC design. We adopt the PSC design described in [45] and we restrict the state share to a single component: the state Profit Gas. We set the Cost Gas Ceiling ( C G C ) to 70%. The C G C defines the maximum share of the periodic revenues that can be allocated to cover ongoing or carried costs.
Using years as units of time, for every period t , let P t be the price of natural gas per unit volume and V t the volume of natural gas produced. The revenues generated account for P t V t . The Cost Gas, C G t , is the minimum between the balance of unsettled costs to date and the maximum cost recovery possible:
C G t = m i n ( n = 1 t C n n = 1 t 1 C G n , C G C P t V t )
where C n refers to the total upstream costs at period n .
The Profit Gas is the remaining revenue after deducting the Cost Gas. Given a state Profit Gas share, P G S s , the state and company Profit Gas at period t , P G s t and P G c t , are computed, respectively, as per the below equations:
P G s t = ( P t V t C G t ) P G S s
P G c t = ( P t V t C G t ) ( 1 P G S s )
The company upstream revenues at period t are composed of the Cost Gas and the company Profit Gas:
R u t = C G t + P G c t
In this stylized PSC, the only item that is subject to negotiation or bidding is P G S s . The company sets this item such that it manages to achieve a desired internal rate of return, i u , on the upstream project, assuming a certain base case natural gas price, P b [25]. Therefore, P G S s is chosen such that the net present value (NPV) of costs (that are all paid by the company) equals the NPV of the company revenues when the periodic natural gas prices are set to P b :
t = 1 T u C t ( 1 + i u ) t = t = 1 T u R u t ( 1 + i u ) t
where T u is the upstream project life.
When the above equation cannot be satisfied even if P G S s is reduced to values as low as 0%, then the upstream project does not generate the necessary rate of return for the company and is accordingly deemed infeasible and abandoned.
For feasible upstream projects, to determine the size of the renewable energy investments that will be guaranteed, the company is interested in quantifying the NPV of the state Profit Gas profile. The company should choose a gas price to compute it. A conservative approach that considers the possibility of future gas prices consistently dropping below the base case estimate, P b , used to assess the upstream project, can be adopted to compute the desired NPV. A reduced gas price of P r where P r = ( 1 r ) P b and r refers to the reduction rate applied on the base case gas price can be used. Accordingly, given a renewable energy project discount rate ( i r ), the NPV of the state Profit Gas from the company perspective, using P r as the gas price, corresponds to the size of the total guarantee ( T G ) as perceived by the company.
T G = t = 1 T u P G s t ( 1 + i r ) t
The company is therefore willing to invest an amount of T G at time zero to build the renewable energy plant. Using estimates of unit capital costs per renewable energy capacity C c , the size of the renewable energy plant can be computed:
S r = T G C c
The electricity price that the company will charge on the renewable energy project is set to the Levelized Cost of Energy ( L C O E ) of the renewable energy technology using estimates of unit capital, operational costs, and capacity factors. Based on Heck et al. [47], the L C O E can be computed as:
L C O E = A 8760 C f + O & M
where A is the annualized equivalent of the unit capital costs, C f is the capacity factor, O & M is the unit variable operational costs, and 8760 refers to the number of hours in a year. A can be computed as:
A = C c ( i r + i r ( 1 + i r ) T r 1   )
where T r is the productive life of the renewable energy plant.
The World Bank Global Solar Atlas [48] uses a measure called the specific photovoltaic power output ( P V o u t ) that represents the average daily electric energy produced per installed PV capacity. Equation (8) can therefore be written as:
L C O E = A 365 P V o u t + O & M
The yearly revenues that the company receives from the electricity payments are:
R r t = L C O E S r P V o u t 365
In normal circumstances, the state is fulfilling its electricity payments as stipulated in the integrated energy contract and is entitled to fully receive its state Profit Gas P G s t . If at any time, n , the state defaults on its electricity payments, the company can use all the future P G s t to recover its due amounts.
Let O R n be the NPV of the outstanding returns from the electricity project that the company is entitled to receive after the state defaults at time n :
O R n = t = n T r R r t ( 1 + i r ) t
Let R G n be the NPV of the remaining guarantee available which corresponds to the NPV of the future state Profit Gas:
R G n = t = n T u P G s t ( 1 + i r ) t
The company is able to recover its total due amounts if R G n O R n . Otherwise, the company is only able to recover a share of its due amounts. We define the protection level, P L n , as the share of the NPV of the total electricity payments that the company is able to recover if the state defaults at time n :
P L n = { 1                               i f                 R G n O R n 1 ( O R n R G n O R 1 )   o t h e r w i s e
where O R 1 refers to the NPV of all the electricity payments.
We define P L as the minimum protection level achieved if the state defaults at any point in time:
P L = m i n n ( P L n )
P L is the lowest protection level among all years over the project time horizon. Therefore, reporting a high value for P L provides confidence that the guarantee mechanism is functioning well, whereas a low P L raises red flags.

3.2. Elements of the Monte Carlo Simulations

In this subsection, we describe the following details associated with the Monte Carlo simulations:
  • The approach adopted to compute the country-specific gas price forecasts;
  • The reasoning behind the assumed discount rates for the upstream and renewable energy projects;
  • The parametrization of the various estimates used in the simulations.

3.2.1. Country-Specific Natural Gas Prices

To assess the implications of the proposed integrated energy contract, we should determine the prices at which the produced natural gas is sold. Forecasting natural gas prices directly for each of the considered countries based on market-specific historical data is very difficult, if not impossible, since the historical data is lacking for most, if not all, of the target countries. Instead, we develop a two-step approach to come up with reasonable forecasts. Natural gas prices are regionally set based on three major hubs: the United States (represented by the Henry Hub), Europe (represented by the Title Trading Facility virtual hub), and Japan (where natural gas prices are based on the Japanese Crude Cocktail price index) [49,50,51]. These three regions have well-documented historical data. Therefore, we forecast future natural gas prices for the three main hubs, then derive country-specific natural gas prices for each considered country based on its natural gas import and export activities.

Forecasting Hub Prices

Univariate regression models are generally used to forecast future natural gas prices based on historical prices [51,52]. We use the statistical software R and adopt the classical ARMA (auto-regressive moving average) method, which is simple, powerful, and widely used for forecasting and prediction [53]. We use nominal monthly natural gas prices from January 1992 to December 2020, as reported by the World Bank for the United States, Europe, and Japan [54]. The historical time series for all the three markets exhibit a non-stationarity behavior when tested using the Augmented Dickey–Fuller test. Knowing the importance of the stationarity concept in time series regression analysis, a set of mathematical techniques can be used to stabilize non-stationary data. We use first-order differencing for each of the three markets, such that:
y m = y m y m 1
y m being the gas price at month m . The Augmented Dickey-Fuller test indicates that the series of the first-order differences for the three markets are stationary at a 1% significance level.
We then apply the ARMA model on the first difference time series, with p lag-order for the autoregressive process and q lag-order for the moving average process. The linear equation of such a model is as follows:
y m = α 0 + j = 1 p Φ j y m j + j = 1 q θ j ε m j + ε m
where α 0 is a constant, ε m is the residual Gaussian white noise, and Φ j and θ j are the coefficients of the auto-regressive moving average lags, respectively.
It is common practice to enumerate the set of all possible candidate models (ARMA ( p , q )) by considering significant lags based on the auto-correlation and partial auto-correlation functions (ACF and PACF). A grid search technique is then applied to come up with p and q values that minimize the Akaike Information Criterion (AIC) [55]. The values of p and q , the coefficients Φ j and θ j for the three markets, and a plot of the point-forecasted gas prices are provided in Section S4 of the Supplementary Materials. Instead of relying solely on these point forecasts, we treat each monthly forecast as a normally distributed random variable with the mean as the point forecast and the standard deviation as the standard error. This approach allows the generation of different gas price profiles across the Monte Carlo simulations.

Linking Country-Specific Prices to Hub Prices

We categorize the considered countries into net importers and net exporters of natural gas. These countries import or export natural gas either through pipelines or liquified natural gas (LNG) shipments. We address below how we treat each of the four possible categories.
For net exporters via LNG, the destination market is mainly one of the three main gas markets (US, Europe, Japan). To compute the price of natural gas that the producing country ends up collecting at the end of the upstream infrastructure, we deduct all the costs associated with bringing the gas from the producing country to the destination market. In simple terms, the price of the gas produced in the subject country is based on its value in the market it is destined for, minus the cost associated with moving it there. These costs are regasification in the destination market, LNG transport fees, and liquefaction costs in the country where it is produced. Almost all these countries sell their LNG primarily to East Asia, except for Egypt which sells mostly to Europe. The regasification costs are assumed to be the same for all countries, regardless of the location where the molecule is being regasified [56]. The liquefaction and transportation cost assumptions are computed by country [57]. The countries that belong to this category are Angola, Indonesia, Mozambique, Egypt, Nigeria, Papua New Guinea, and Yemen.
For net exporters via pipelines, the same netback approach is also adopted. In this case, cost estimates for pipeline transmission are deducted. These costs are a function of the pipeline length and diameter [58]. The countries that belong to this category are Bolivia, Myanmar, and Uzbekistan.
For net imports via LNG or via pipelines, it is assumed that the prices of the produced natural gas are set equal to the prices of the imported gas that will be substituted. A similar analysis to exporters is performed to compute the price of the imported gas based on one of the three regional hubs. The net importers are India, Pakistan, Syria, Ukraine, and Vietnam.
Across the Monte Carlo simulations, the unit of time used is a year. Therefore, yearly averages of the monthly forecasts are generated.
Section S5 of the Supplementary Materials discusses the country-level reasoning and provides the numerical data.

3.2.2. Discount Rates

We adopt a bottom-up approach to compute the weighted average cost of capital ( W A C C ) that is used as the discount rate, i r , for the PV project. The W A C C is generally defined as:
W A C C = W D ( 1 T R ) C o D + W E C o E
where W D and W E are the weights of debt and equity, respectively; T R is the tax rate; and C o D and C o E are the costs of debt and equity, respectively.
The cost of debt is computed as:
C o D = r f + D S
where r f is the risk-free rate and D S is the default spread [59].
In the context of renewable energy projects, project finance has recently been gaining increased popularity [60], where a special purpose vehicle (SPV) is established and the project is ring-fenced from its sponsors [61]. Such SPVs are generally unlisted entities and their default spreads cannot be computed based on traded securities [62]. To compute the SPV default spread, various elements of the project’s risk should be assessed and incorporated [63]. One of the most important risks for renewable energy projects is the risk of the default of the off-taker [20]. In a lower-income country, the off-taker is the state or a state-owned entity. We assume that the risk of sovereign default is equivalent to the risk of default of the off-taker on its power purchase commitments [20]. Additionally, based on Angelopoulos et al. [64], we adopt a simplified representation of the SPV default spread that assumes it is equal to the sovereign default spread of the state where the project is executed, D S s , and a generic renewable energy project spread, D S r :
D S = D S s + D S r
Damodaran from New York University maintains a consistent database for country default spreads [65]. We set D S s based on this, and we assume D S r = 2 % [20].
Additionally, we assume that debt is raised in US Dollars (USD) and all cash flows are calculated in USD. Therefore, the risk-free rate, r f , corresponds to that of the USD. We set it equal to the average of a 10 year US treasury bond in 2019.
In the context of the European energy companies, promised equity IRRs for renewable energy investments ( I R R e ) are published. They range from 7% to 16% [41,42,43,44,66,67]. To compute the C o E , we consider these equity IRRs and adjust them by a country risk premium, C R P [59]. Damodaran provides a comprehensive list of country risk premia that we use to compute the C o E accordingly:
C o E = I R R e + C R P
Using country-specific tax rates [68] and a W D = 80 % [69], the WACC of the PV project, i r , can be computed.
The proposed guarantee mechanism, if successful, isolates the renewable energy project from the country’s risk of default. Therefore, the C o D and C o E are assumed to be reduced by the state default risk spread, D S s [20].
In contrast to the renewable energy project, the upstream project is not directly affected by the risk of default. In a typical PSC, the investor is responsible for all the investments and shares the revenues with the state [25]. Therefore, the investor is not expecting any payments from the state that will be foregone if the state defaults. Therefore, we use the declared internal rates of returns for upstream investments for the European energy companies as proxies for the upstream project investor discount rate i u . These IRRs range from 14% to 20% [42,67].

3.2.3. Upstream Gas and Renewable Energy Estimates

We perform the Monte Carlo simulations using Python and making the following assumptions:
The lives of both the PV project and the upstream gas project are set to 25 years based on typical situations [70]. Both projects run in parallel, and we assume that at year 1, the final investment decision is made for both. By then, the main uncertainty that remains unresolved is the future natural gas prices. We assume that the first period in the simulation corresponds to the year 2023.
Country-specific yearly natural gas prices are randomly generated based on point forecasts and standard errors computed from the ARMA model. The base price used to determine the economics of the upstream project, P b , is randomly chosen per simulation from the set of generated yearly prices.
The below table (Table 3) summarizes the parameters that are kept constant throughout the simulations and are assumed the same for all the countries considered.
For all countries, the I R R e and i u parameters are assumed to follow uniform distributions with the following ranges:
I R R e ~ U ( 7 % , 16 % )
i u ~ U ( 14 % , 20 % )
The remaining simulation parameters are specified at the country level and are fully described in Sections S3–S6 of the Supplementary Materials.

4. Results and Discussion

For each of the considered countries, we perform a Monte Carlo simulation with 10,000 runs and report the average values. We present below two categories of results:
  • The effectiveness of the guarantee mechanism in protecting against the risk of off-taker default;
  • The benefits that the considered countries achieve from the proposed integrated energy contract.

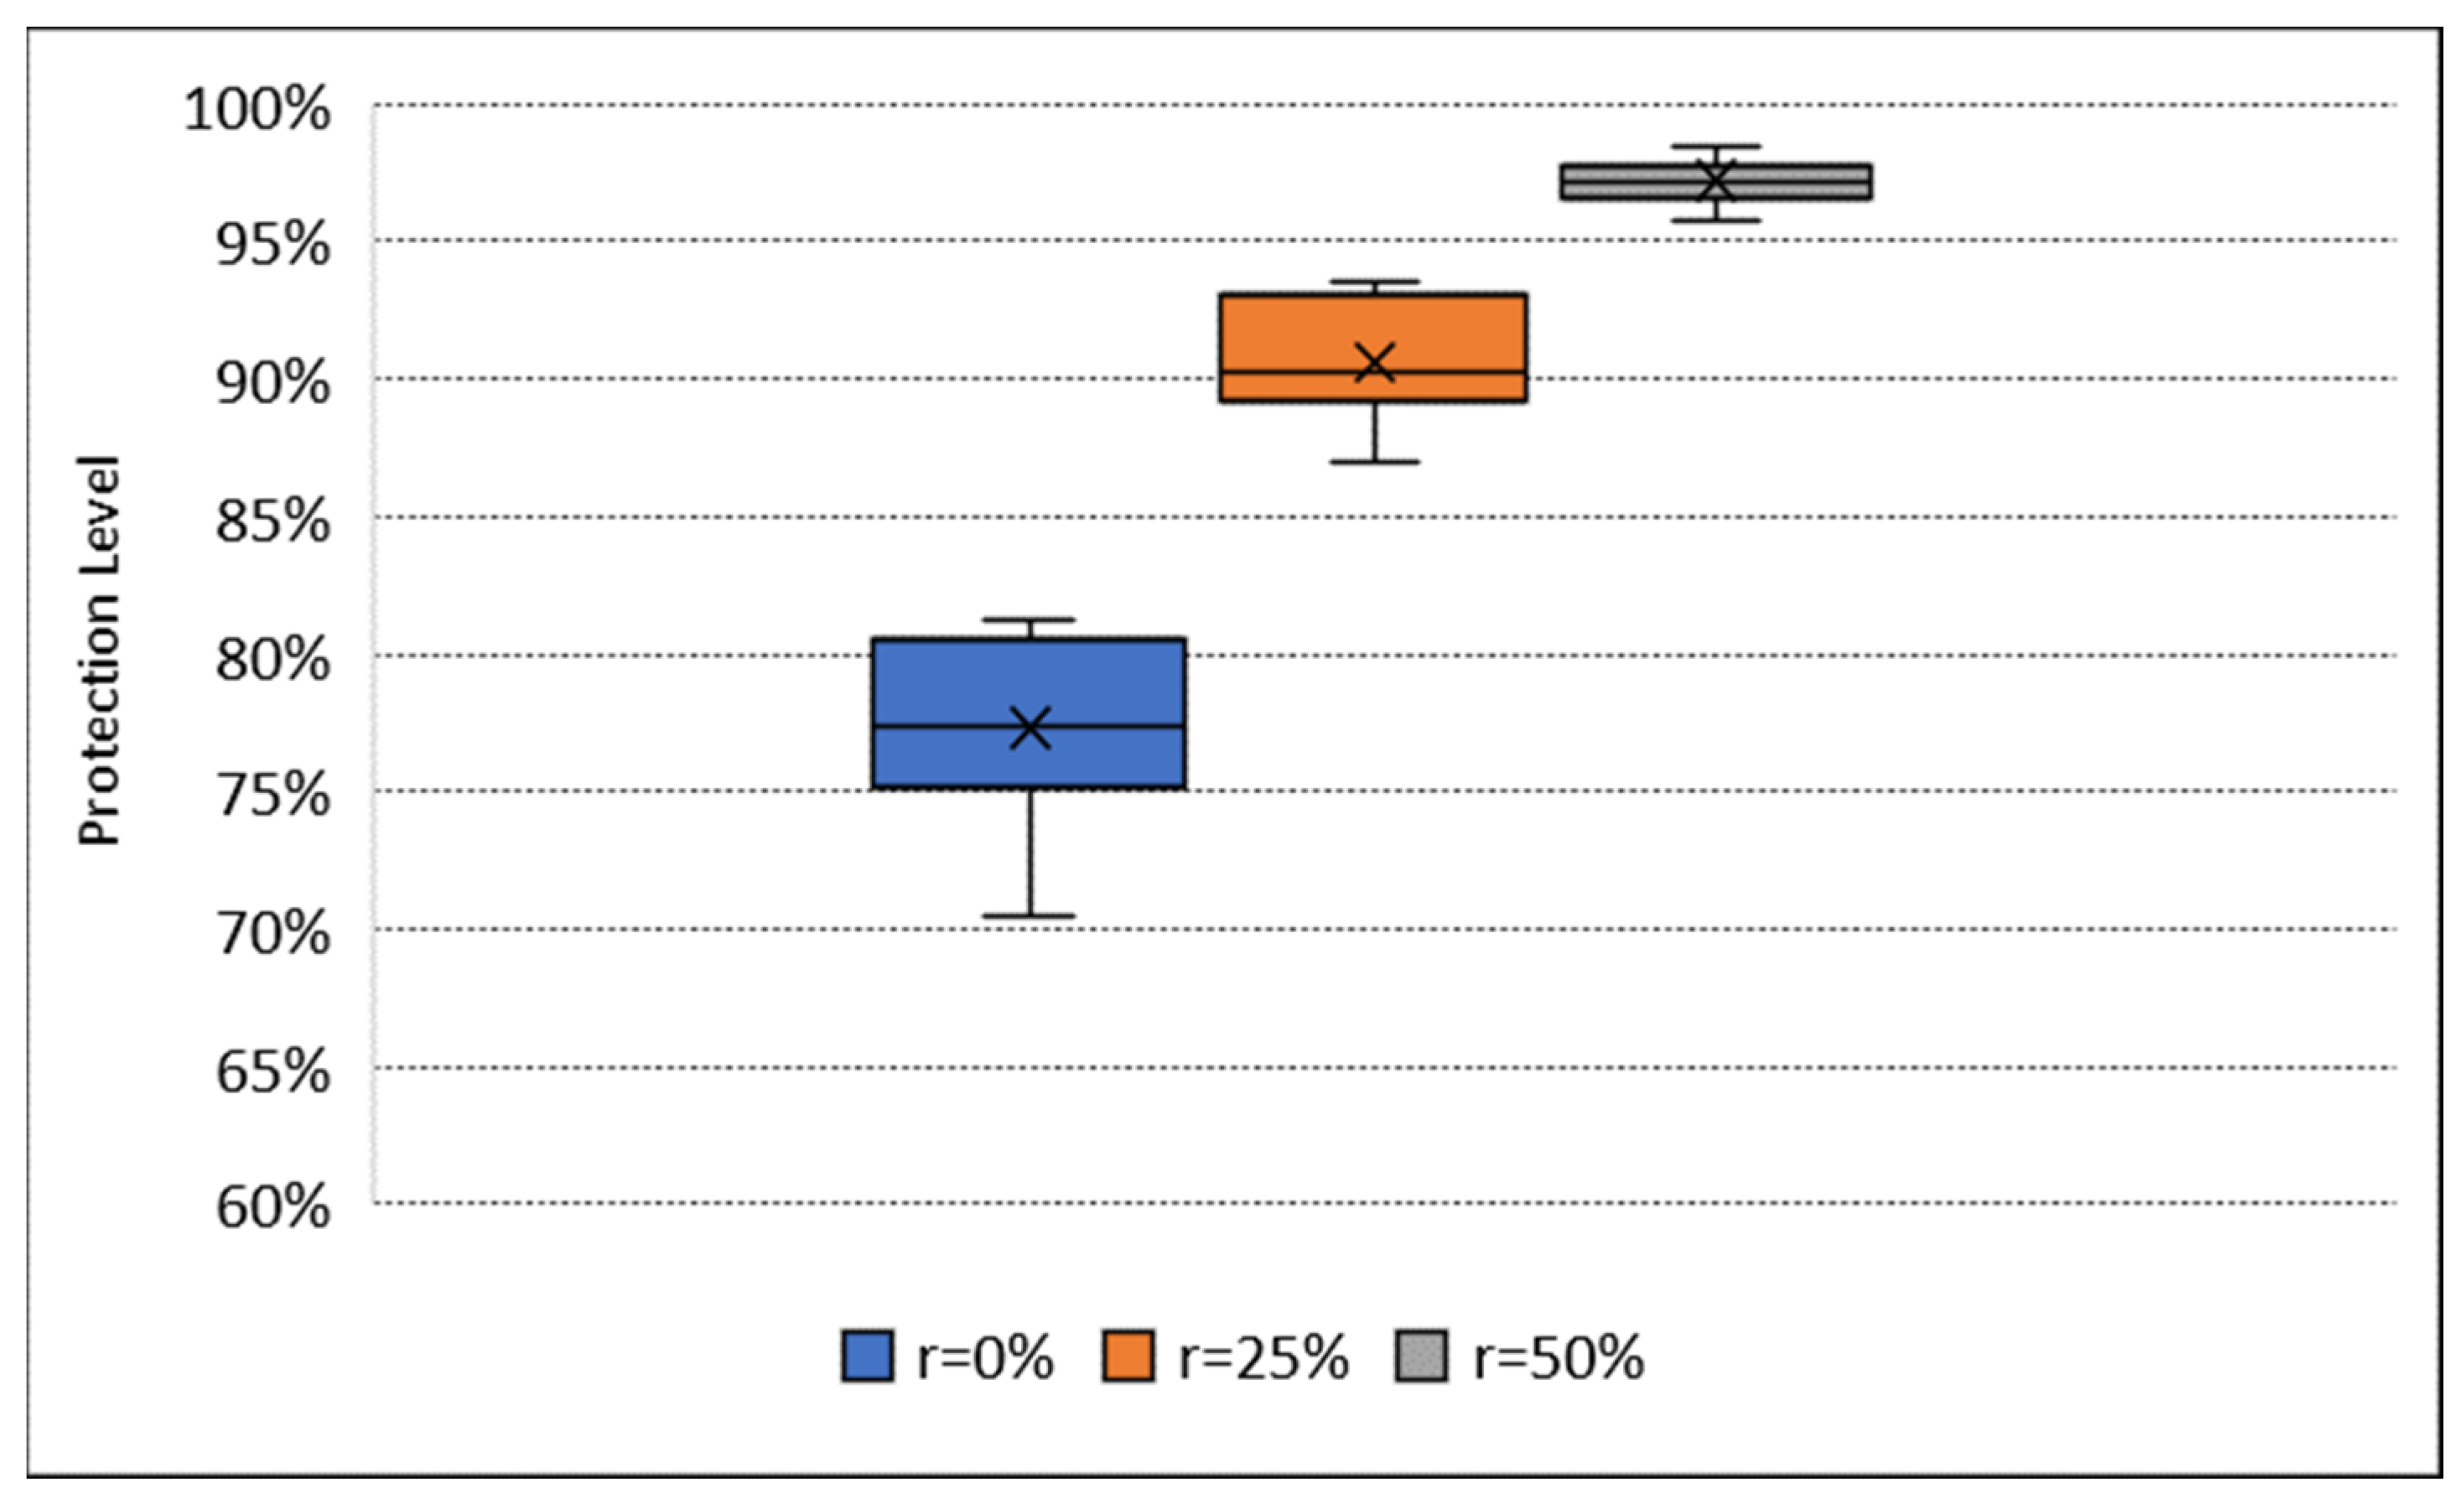
4.1. Guarantee Protection

When determining the size of the guarantee available, the company assumes a certain future natural gas price, P r . As described in Section 3, this price can be set by applying a reduction rate r on the gas price used in assessing the upstream gas project, P b such that P r = ( 1 r ) P b . With increasing r , the company reduces the probability that future gas prices drop below P r and increases the probability that the future state Profit Gas is enough to compensate for the lost electricity payments in case of the default of the off-taker. To illustrate the effect of r on the protection that the guarantee mechanism provides, we run the Monte Carlo simulations across the 15 countries for r = 0 % (assuming that the future natural gas markets will behave in line with the company view), r = 25 % (accounting for limited disturbance to the future gas markets), and r = 50 % (considering larger negative shocks to future natural gas prices that might be caused by accelerated reductions in renewable energy costs or stringent policy decisions on the usage of fossil fuels). Figure 2 displays the spread of the average protection level P L per country across the 15 countries considered for different values of r . As earlier described, P L refers to the share of the net present value of all the electricity payments stipulated in the agreement that the company ends up recovering through the guarantee mechanism if the off-taker defaults at the worst timing of default. In this case, the company gets, on average, a very high protection level exceeding 96% for all 15 countries when r is set to 50%. The protection levels drop considerably, to as low as 70%, when r is set to 0%.
Given the importance of ensuring a high protection level to attract company investments, we report country-level results in the next sub-section based on r = 50 % .

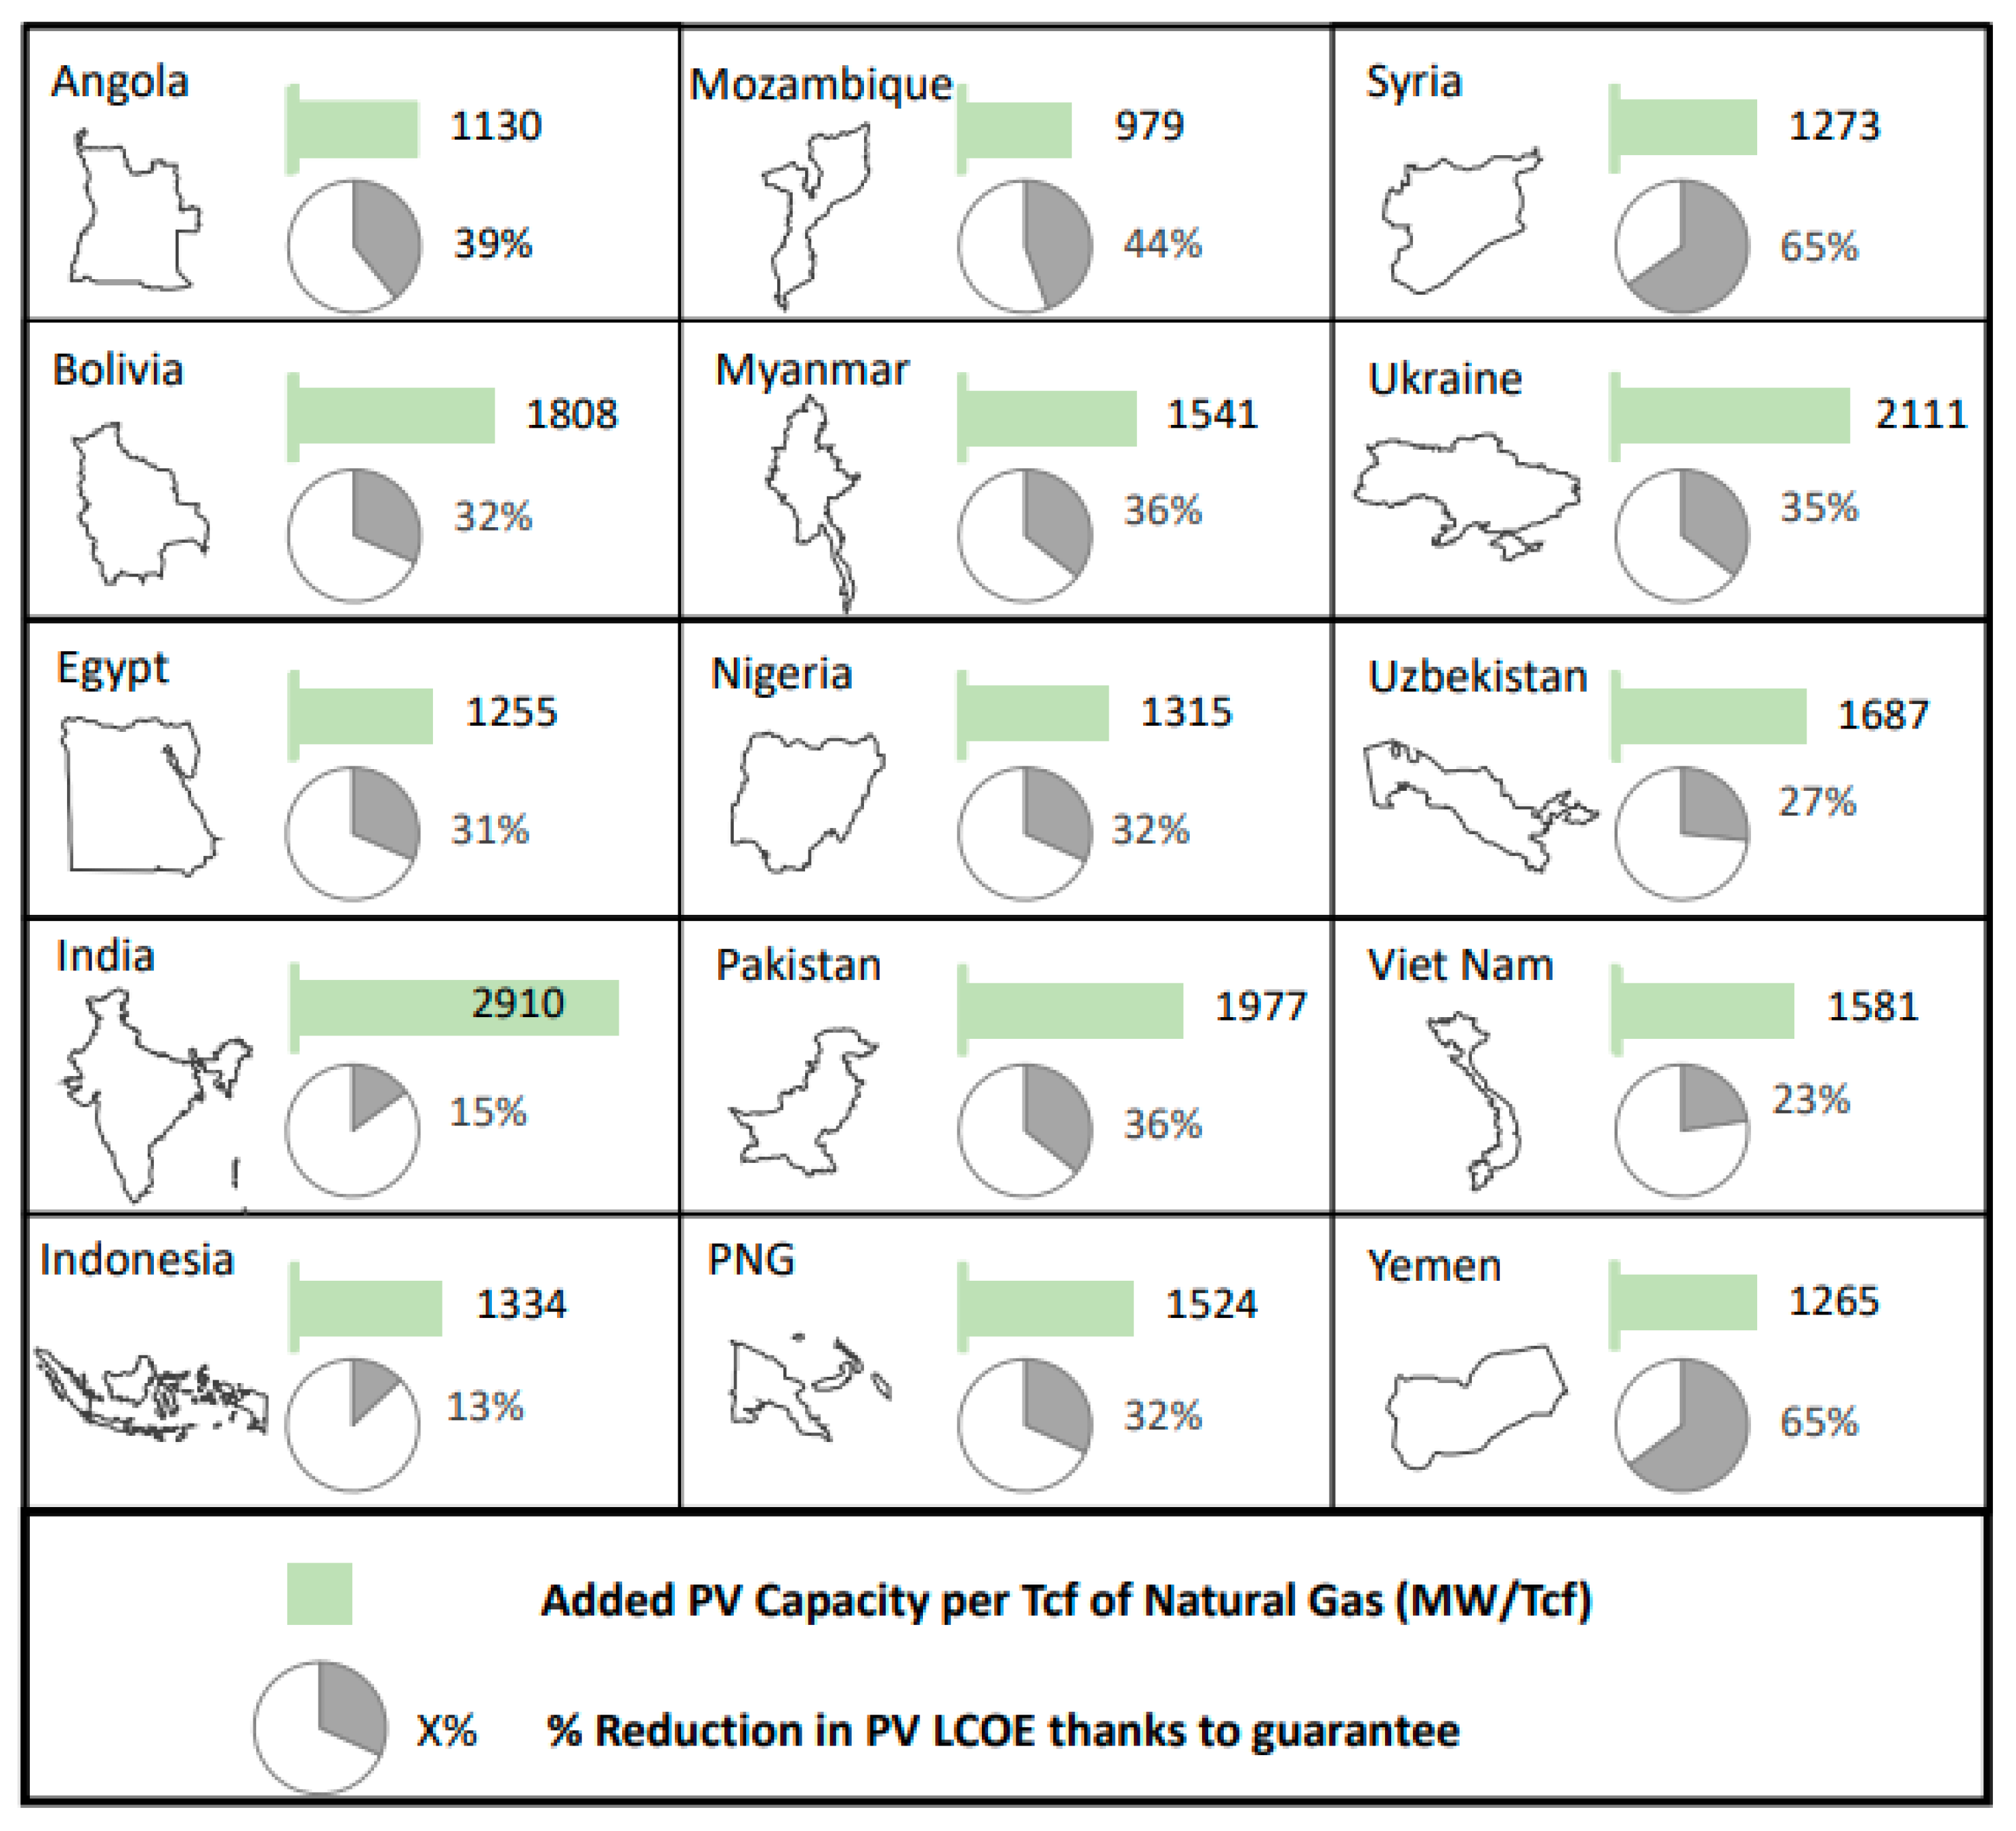
4.2. Country Results of the Integrated Energy Contract

The proposed integrated energy contract can result in substantive additional renewable energy capacities at reduced levelized costs of energy (LCOE) (Figure 3).
India leads the list in terms of added PV capacity per Tcf of natural gas developed through the integrated energy contract. The drivers of increased capacities are improved upstream conditions and reduced PV costs in the respective markets. Upstream conditions are dependent on the costs of laying down the gas infrastructure and the country-specific prices of natural gas at the end of the upstream infrastructure. The proposed guarantee mechanism is assumed to reduce the renewable energy WACC by the country default spread. The largest reductions in PV LCOE are observed in countries with high risks (and high default spreads), as is the case with Yemen and Syria. Indonesia and India sit on the other side of the spectrum with relatively limited cost reduction benefits of 13% and 15%, respectively (the absolute LCOEs with and without the guarantee mechanism are provided in Section S7 of the Supplementary Materials). The reductions in LCOE after de-risking the PV investments are generally consistent with previous findings [20]. The results also reinforce the established conclusion in the literature that the discount rate has a major impact on the economics of the PV investments [16,17,19].
When 10% of the proven natural gas reserves of each country are assumed to be awarded through the integrated energy contract, the effect on the national energy context is different by country (Table 4). Among countries that published renewable energy capacity targets for 2030, Nigeria, Myanmar, and Indonesia can achieve at least 60% of their target added capacities thanks to the integrated energy contract and to their considerable natural gas reserves. In contrast, despite being at the top of the list in terms of added PV capacity per Tcf of natural gas, India can barely achieve 4% of the target added capacity because of its relatively limited natural gas reserves compared to its renewable electricity capacity needs.
Focusing on countries with low access to electricity, major increases in total electricity capacity can be achieved for Mozambique (336%), Nigeria (203%), Yemen (110%), Papua New Guinea (95%), and Myanmar (47%). These additional capacities can majorly contribute to bridging the existing gap in electricity generation in these countries.
To undertake the renewable energy investments, the company must be convinced that the upstream project is economic. The last column in Table 4 shows the percentage of total simulation runs where a positive final investment decision (FID) is reached on the upstream investment. This rate ranges from 31% in Mozambique to 85% in Pakistan.

4.3. Discussion

The simulations show that the integrated energy contract can provide specific benefits to specific countries and is not equally suitable or useful across the board. Countries such as Syria and Yemen have more serious problems related to the war situation that hinders investments. The integrated energy contract can become handy to these countries just after the security situation stabilizes and can play a role in heavily de-risking post-war development efforts in renewable energy. Large countries with relatively limited natural gas reserves (such as India and, to a lesser extent, Pakistan) can only marginally benefit from the integrated energy contract despite having the highest additions of PV capacities per Tcf of natural gas. This is the case because the total added PV capacities when 10% of their natural gas reserves are developed contribute little to their total electricity capacities or 2030 target renewable energy additions. In contrast, countries with large natural gas reserves relative to their population size (such as Indonesia and Nigeria) can offer a strong boost to their renewable energy sector using the integrated energy contract which can potentially be the main success enabler in reaching their green energy targets.
For countries with low access to electricity (such as Mozambique, Myanmar, and Papua New Guinea), the integrated energy contract can be the main enabler for bridging the electricity production gaps. Noting that overcoming the problem of low access to electricity also requires investments in transmission and distribution networks, and the scope of the integrated energy contract can be expanded to cover them whenever suitable.
The integrated energy contract can only succeed if the upstream investment environment is favorable. Upstream development costs and gas prices are key factors that determine whether the economics of the upstream projects match the company’s expectations. In the simulations we conducted, positive FID rates are generally higher for countries in the East and South Asia regions since natural gas prices in these regions are relatively closer to the prices in Japan, which are, globally, the highest.

5. Conclusions

Despite not being the main inducers of climate change, lower-middle-income and low-income countries are among the most affected by its negative consequences. They possess limited mitigation capabilities as they generally suffer from unfavorable green investment conditions due to high perceived country risks. Fifteen of these countries possess considerable natural gas reserves that they aim to use to induce economic development. They, however, risk getting stuck in carbon lock-ins as they further gasify their economies, which conflicts with their declared commitments to carbon emission reductions and renewable energy additions.
To the best of our knowledge, this paper proposes, for the first time, an integrated energy contract that allows these countries to de-risk renewable energy investments by bundling them with upstream natural gas investments, such that the state future returns from the natural gas project guarantee the electricity payments of the renewable energy project. Integrated energy companies expanding their interest from oil and gas to the wider energy sector are the target audience for the proposed contract. To illustrate the use cases of the integrated energy contract, we design and conduct a series of Monte Carlo simulations for the considered countries, assuming that a limited portion of 10% of their natural gas reserves are developed and that the renewable energy technology of choice is PV.
The integrated energy contract provides companies with protection levels exceeding 96% on their future electricity payments if the electricity off-taker defaults. This high protection level reduces the risks of the renewable energy project and therefore the associated WACC. This, in turn, drives the LCOE of the PV electricity down to differing levels depending on the level of risk that each country is subject to. Setting the size of the PV investment based on the future cash flows of the upstream natural gas project results in different additions of PV capacity by country, depending on the sizes of the natural gas reserves and the competitiveness of the produced natural gas. The integrated energy contract can constitute a strong de-risking tool for post-war investments in the renewable energy sector for countries such as Syria or Yemen, can boost the renewable energy sector and majorly contribute to achieving the 2030 renewable energy targets for countries such as Nigeria and Pakistan, and can be a main contributor to bridging the electricity access gap for countries such as Mozambique, Myanmar, and Papua New Guinea.
We believe that the introduced integrated energy contract contributes positively to the two objectives of the lower-income countries: inducing economic development and supporting the green energy transition. It also tackles the concerns of the energy companies and provides them with lucrative investment opportunities aligned with their low-carbon energy strategies.
The study has the following limitations. The feasibility of the proposed contract is based on the commerciality of the upstream natural gas investment. While for the considered countries, the continued presence and interest of international energy companies indicate positive prospects for their natural gas sectors, the future dynamics in light of the structural changes in the global energy sector remain unclear. This constitutes a limitation to our work that can only be addressed by considering the detailed upstream natural gas national context of each individual country. In our simulations, we use the same stylized PSC design across the 15 countries without accounting for the specific details of the fiscal regimes by country. Finally, we restrict the choice of renewable energy technology to PVs and we do not deal with other capital investments required in the transmission and distribution networks.
Our future work could resolve one or more of the limitations of this study. Particularly, incorporating country-specific upstream fiscal regimes and understanding their effects on the feasibility of the proposed integrated contract is worthy of consideration. Additionally, expanding the renewable energy technologies to wind and biomass could be important to align the integrated energy contract with the technology-specific plans set by the countries for their renewable energy targets. Addressing the important interlinkages between natural gas, renewable energy, and the hydrogen economy in the context of developing countries is also left for future considerations.

Supplementary Materials

The following supporting information can be downloaded at: https://www.mdpi.com/article/10.3390/en15051651/s1, The Supplementary Materials are organized as follows: Document S1. (Supplementary Materials) describes how all the simulation data was populated and provides additional references. It is composed of eight sections as follows: Section S1, Electricity Status; Section S2, Upstream Activities; Section S3, PV Parameters; Section S4, Natural Gas Hub Prices; Section S5, Natural Gas Country Prices and Upstream Costs; Section S6, Default Spreads, Country Risk Premia and Taxes; Section S7, Country LCOEs; Section S8, Upstream Country Descriptions; Section S9, References. References [72,73,74,75,76,77,78,79,80,81,82,83,84,85,86,87,88,89,90,91,92,93,94,95,96,97,98,99,100,101,102,103,104,105,106,107,108,109,110,111,112,113,114,115,116,117,118,119,120,121,122,123,124,125,126,127,128,129,130,131,132,133] are cited in the supplementary materials.

Author Contributions

Conceptualization: M.O. and H.A.; methodology: M.O. and H.H.; software: M.O. and H.H.; validation: M.O., H.H. and H.A.; formal analysis: M.O. and H.H.; investigation: M.O. and H.H.; data curation: M.O. and H.H.; writing—original draft: M.O. and H.H.; writing—review and editing: M.O., H.H. and H.A.; visualization: M.O. and H.H.; supervision: M.O. and H.A.; project administration: M.O. and H.A. All authors have read and agreed to the published version of the manuscript.

Funding

Open Access Funding by TU Wien Bibliothek.

Data Availability Statement

The Python and R codes along with their input data files are provided in the submitted zipped folder.

Acknowledgments

The authors acknowledge TU Wien Bibliothek for financial support through its Open Access Funding Program. The authors thank Anis Hoayek for his guidance and support.

Conflicts of Interest

The authors declare no conflict of interest.

References

  1. IPCC. IPCC, Summary for Policymakers. In Global Warming of 1.5 C. An IPCC Special Report on the Impacts of Global Warming of 1.5 C above Pre-Industrial Levels and Related Global Greenhouse Gas Emission Pathways, in the Context of Strengthening the Global Response to the Threat of Climate Change, Sustainable Development, and Efforts to Eradicate Poverty; Intergovernmental Panel on Climate Change: Geneva, Switzerland, 2018; pp. 3–24. [Google Scholar]
  2. Padilla, E.; Serrano, A. Inequality in CO2 emissions across countries and its relationship with income inequality: A distributive approach. Energy Policy 2006, 34, 1762–1772. [Google Scholar] [CrossRef] [Green Version]
  3. Jakob, M.; Steckel, J.C. How climate change mitigation could harm development in poor countries. Wiley Interdiscip. Rev. Clim. Change 2014, 5, 161–168. [Google Scholar] [CrossRef]
  4. Cantarero, M.; Vanegas, M. Of renewable energy, energy democracy, and sustainable development: A roadmap to accelerate the energy transition in developing countries. Energy Res. Soc. Sci. 2020, 70, 101716. [Google Scholar] [CrossRef]
  5. Afful-Dadzie, A. Global 100% energy transition by 2050: A fiction in developing economies? Joule 2021, 5, 1641–1643. [Google Scholar] [CrossRef]
  6. Merzic, A.; Music, M.; Haznadar, Z. Conceptualizing sustainable development of conventional power systems in developing countries–A contribution towards low carbon future. Energy 2017, 126, 112–123. [Google Scholar] [CrossRef]
  7. Relva, S.G.; da Silva, V.O.; Gimenes, A.L.V.; Udaeta, M.E.M.; Ashworth, P.; Peyerl, D. Enhancing developing countries’ transition to a low-carbon electricity sector. Energy 2021, 220, 119659. [Google Scholar] [CrossRef]
  8. Millner, A.; Dietz, S. Adaptation to climate change and economic growth in developing countries. Environ. Dev. Econ. 2015, 20, 380–406. [Google Scholar] [CrossRef] [Green Version]
  9. Olsson, L.; Opondo, M.; Tschakert, P.; Agrawal, A.; Eriksen, S.; Ma, S.; Perch, L.; Zakeldeen, S. Livelihoods and poverty: Climate change 2014: Impacts, adaptation, and vulnerability. Part A: Global and sectoral aspects. Contribution of working group II to the fifth assessment report of the intergovernmental panel on climate change. In Climate Change 2014: Impacts, Adaptation, and Vulnerability. Part A: Global and Sectoral Aspects; Cambridge University Press: Cambridge, UK, 2014; pp. 793–832. [Google Scholar]
  10. De Bruijn, E.-J.; Antonides, G. Poverty and economic decision making: A review of scarcity theory. Theory Decis. 2021, 92, 5–37. [Google Scholar] [CrossRef]
  11. IRENA. Renewable Energy Finance: Sovereign Guarantees; International Renewable Energy Agency: Masdar City, United Arab Emirates, 2020. [Google Scholar]
  12. Jakob, M.; Steckel, J.C.; Flachsland, C.; Baumstark, L. Climate finance for developing country mitigation: Blessing or curse? Clim. Dev. 2015, 7, 1–15. [Google Scholar] [CrossRef]
  13. Markowitz, H. Portfolio Selection. J. Financ. 1952, 7, 77–91. [Google Scholar] [CrossRef]
  14. Painuly, J.P. Barriers to renewable energy penetration; a framework for analysis. Renew. Energy 2001, 24, 73–89. [Google Scholar] [CrossRef]
  15. Sen, S.; Ganguly, S. Opportunities, barriers and issues with renewable energy development–A discussion. Renew. Sustain. Energy Rev. 2017, 69, 1170–1181. [Google Scholar] [CrossRef]
  16. Steckel, J.C.; Jakob, M. The role of financing cost and de-risking strategies for clean energy investment. Int. Econ. 2018, 155, 19–28. [Google Scholar] [CrossRef]
  17. Ameli, N.; Dessens, O.; Winning, M.; Cronin, J.; Chenet, H.; Drummond, P.; Calzadilla, A.; Anandarajah, G.; Grubb, M. Higher cost of finance exacerbates a climate investment trap in developing economies. Nat. Commun. 2021, 12, 4046. [Google Scholar] [CrossRef] [PubMed]
  18. Polzin, F.; Egli, F.; Steffen, B.; Schmidt, T.S. How do policies mobilize private finance for renewable energy—A systematic review with an investor perspective. Appl. Energy 2019, 236, 1249–1268. [Google Scholar] [CrossRef]
  19. Sweerts, B.; Dalla Longa, F.; van der Zwaan, B. Financial de-risking to unlock Africa’s renewable energy potential. Renew. Sustain. Energy Rev. 2019, 102, 75–82. [Google Scholar] [CrossRef]
  20. Matthäus, D.; Mehling, M. De-risking Renewable Energy Investments in Developing Countries: A Multilateral Guarantee Mechanism. Joule 2020, 4, 2627–2645. [Google Scholar] [CrossRef]
  21. McElroy, M.B. Natural Gas: The Least Polluting of the Fossil Fuels. In Energy and Climate: Vision for the Future; Oxford University Press: Oxford, UK, 2016. [Google Scholar]
  22. Gurbanov, S. Role of Natural Gas Consumption in the Reduction of CO2 Emissions: Case of Azerbaijan. Energies 2021, 14, 7695. [Google Scholar] [CrossRef]
  23. Pickl, M.J. The renewable energy strategies of oil majors–From oil to energy? Energy Strategy Rev. 2019, 26, 100370. [Google Scholar] [CrossRef]
  24. Pickl, M.J. The trilemma of oil companies. Extr. Ind. Soc. 2021, 8, 100868. [Google Scholar] [CrossRef]
  25. Olleik, M.; Auer, H.; Nasr, R. A petroleum upstream production sharing contract with investments in renewable energy: The case of Lebanon. Energy Policy 2021, 154, 112325. [Google Scholar] [CrossRef]
  26. Dincer, I.; Joshi, A.S. Solar Based Hydrogen Production Systems; Springer: Berlin/Heidelberg, Germany, 2013. [Google Scholar]
  27. Nepal, R.; Phoumin, H.; Khatri, A. Green Technological Development and Deployment in the Association of Southeast Asian Economies (ASEAN)—At Crossroads or Roundabout? Sustainability 2021, 13, 758. [Google Scholar] [CrossRef]
  28. Timmerberg, S.; Kaltschmitt, M. Hydrogen from renewables: Supply from North Africa to Central Europe as blend in existing pipelines–Potentials and costs. Appl. Energy 2019, 237, 795–809. [Google Scholar] [CrossRef]
  29. United Nations. World Economic Situation and Prospects 2020; United Nations: New York, NY, USA, 2020.
  30. EIA Natural Gas. Available online: https://www.eia.gov/international/data/world/natural-gas/dry-natural-gas-reserves (accessed on 1 November 2021).
  31. IRENA Statistical Profiles. Available online: https://www.irena.org/Statistics/Statistical-Profiles (accessed on 1 November 2021).
  32. UNFCCC NDC Registry. Available online: https://www4.unfccc.int/sites/NDCStaging/Pages/All.aspx (accessed on 1 November 2021).
  33. Reuters Egypt Aims to Generate 42% of Power from Renewables by 2030. Available online: https://www.reuters.com/business/sustainable-business/egypt-aims-generate-42-power-renewables-by-2030-2021-11-04/ (accessed on 5 November 2021).
  34. Ministry of External Affairs (India). National Statement by Prime Minister Shri Narendra Modi at COP26 Summit in Glasgow; Ministry of External Affairs: New Delhi, India, 2021.
  35. Association of Gas Producers of Ukraine. Ukraine Oil & Gas Industry Guide 2021; Association of Gas Producers of Ukraine: Kyiv, Ukraine, 2021. [Google Scholar]
  36. Shadrina, E. Non-Hydropower Renewable Energy in Central Asia: Assessment of Deployment Status and Analysis of Underlying Factors. Energies 2020, 13, 2963. [Google Scholar] [CrossRef]
  37. Kang, X.; Khan, F.U.; Ullah, R.; Arif, M.; Rehman, S.U.; Ullah, F. Does Foreign Direct Investment Influence Renewable Energy Consumption? Empirical Evidence from South Asian Countries. Energies 2021, 14, 3470. [Google Scholar] [CrossRef]
  38. Watkins, E. Total Exits Syria Following Tightened EU Sanctions. Available online: https://www.ogj.com/general-interest/government/article/17265863/total-exits-syria-following-tightened-eu-sanctions (accessed on 1 November 2021).
  39. Reuters Yemen Urges Oil Companies to Restart Production: Document. Available online: https://www.reuters.com/article/us-yemen-oil-idUSKCN1UO1FC (accessed on 1 November 2021).
  40. TotalEnergies Solar and Wind: Our Ambition in Renewable Energies. Available online: https://totalenergies.com/energy-expertise/exploration-production/renewable-energies/solar-energy-and-wind-energy (accessed on 27 December 2021).
  41. BP. From IOC to IEC, Second Quarter 2020 Financial Results and Strategy Presentation. Available online: https://www.bp.com/content/dam/bp/business-sites/en/global/corporate/pdfs/investors/bp-second-quarter-2020-results-presentation-slides-and-script.pdf (accessed on 1 November 2021).
  42. Eni. Boosting Our Transformation, Strategy Presentation 2021–2024. Available online: https://www.eni.com/assets/documents/eng/investor/presentations/2021/strategy-4q-2020/strategy-2021-2024.pdf (accessed on 1 November 2021).
  43. Repsol. Investor Update 2021 Stepping up the Transition Driving Growth and Value February 2021. Available online: https://www.repsol.com/content/dam/repsol-corporate/es/accionistas-e-inversores/pdf/0221-investor-update.pdf (accessed on 1 November 2021).
  44. Equinor. Accelerating our Transition. Available online: https://www.equinor.com/content/dam/statoil/documents/quarterly-reports/2021/cmd-2021/cmd-2021-ceo-anders-opedal-equinor.pdf (accessed on 1 November 2021).
  45. Allen&Overy. Guide to Extractive Industries Documents—Oil & Gas; World Bank Institute Governance for Extractive Industries Programme: 2013. Available online: https://www.allenovery.com/global/-/media/sharepoint/publications/sitecollectiondocuments/geiprogram.pdf?la=en-gb&hash=2F1773051C1304034AFA76F3E6618DE7 (accessed on 1 November 2021).
  46. Bindemann, K. Production-Sharing Agreements: An Economic Analysis; Oxford Institute for Energy Studies: Oxford, UK, 1999. [Google Scholar]
  47. Heck, N.; Smith, C.; Hittinger, E. A Monte Carlo approach to integrating uncertainty into the levelized cost of electricity. Electr. J. 2016, 29, 21–30. [Google Scholar] [CrossRef]
  48. The World Bank Global Solar Atlas. Available online: https://globalsolaratlas.info/map (accessed on 1 November 2021).
  49. Zhang, D.; Wang, T.; Shi, X.; Liu, J. Is hub-based pricing a better choice than oil indexation for natural gas? Evidence from a multiple bubble test. Energy Econ. 2018, 76, 495–503. [Google Scholar] [CrossRef]
  50. Li, Y.; Chevallier, J.; Wei, Y.; Li, J. Identifying price bubbles in the US, European and Asian natural gas market: Evidence from a GSADF test approach. Energy Econ. 2020, 87, 104740. [Google Scholar] [CrossRef]
  51. Hamie, H.; Hoayek, A.; Auer, H. Modeling the price dynamics of three different gas markets-records theory. Energy Strategy Rev. 2018, 21, 121–129. [Google Scholar] [CrossRef]
  52. Efimova, O.; Serletis, A. Energy markets volatility modelling using GARCH. Energy Econ. 2014, 43, 264–273. [Google Scholar] [CrossRef]
  53. Zhang, Z.; Moore, J. Chapter 8—Autoregressive moving average models. In Mathematical and Physical Fundamentals of Climate Change; Elsevier: Boston, MA, USA, 2015; pp. 239–290. [Google Scholar]
  54. The World Bank. World Bank Commodity Price Data (The Pink Sheet); World Bank: Washington, DC, USA, 2021. [Google Scholar]
  55. Dufour, J.-M.; Neves, J. Finite-sample inference and nonstandard asymptotics with Monte Carlo tests and R. In Handbook of Statistics; Elsevier: Amsterdam, The Netherlands, 2019; Volume 41, pp. 3–31. [Google Scholar]
  56. Rogers, H. The LNG Shipping Forecast: Costs Rebounding, Outlook Uncertain; The Oxford Institute for Energy Studies: Oxford, UK, 2018. [Google Scholar]
  57. Steuer, C. Outlook for Competitive LNG Supply; The Oxford Institute for Energy Studies: Oxford, UK, 2019; p. 21. [Google Scholar]
  58. Jensen, J.T. The Development of a Global LNG Market: Is It Likely? If So, When? Oxford Institute for Energy Studies: Oxford, UK, 2004. [Google Scholar]
  59. Damodaran, A. Country Risk: Determinants, Measures and Implications—The 2020 Edition; SSRN: Rochester, NY, USA, 2020. [Google Scholar]
  60. IRENA. Global Landscape of Renewable Energy Finance 2020; International Renewable Energy Agency: Masdar City, United Arab Emirates, 2020. [Google Scholar]
  61. Gatti, S. Project Finance in Theory and Practice: Designing, Structuring, and Financing Private and Public Projects; Academic Press: Cambridge, MA, USA, 2013. [Google Scholar]
  62. Steffen, B. Estimating the cost of capital for renewable energy projects. Energy Econ. 2020, 88, 104783. [Google Scholar] [CrossRef]
  63. Schmidt, T.S. Low-carbon investment risks and de-risking. Nat. Clim. Change 2014, 4, 237–239. [Google Scholar] [CrossRef]
  64. Angelopoulos, D.; Doukas, H.; Psarras, J.; Stamtsis, G. Risk-based analysis and policy implications for renewable energy investments in Greece. Energy Policy 2017, 105, 512–523. [Google Scholar] [CrossRef]
  65. Damodaran, A. Country Default Spreads and Risk Premiums. Available online: https://pages.stern.nyu.edu/~adamodar/New_Home_Page/datafile/ctryprem.html (accessed on 1 November 2021).
  66. Total. Results and Outlook February 2021. Available online: https://totalenergies.com/system/files/documents/2021-02/2020_results_outlook.pdf (accessed on 1 November 2021).
  67. Royal Dutch Shell plc. Shell Strategy Day 2021—Slides. Available online: https://www.shell.com/investors/investor-presentations/2021-investor-presentations/strategy-day-2021/_jcr_content/par/textimage_1038086377.stream/1613410966913/8cd4fe1b174147fa20b33d1c189349dd36a9017d/strategy-day-2021-slides.pdf (accessed on 1 November 2021).
  68. KPMG Corporate Tax Rates Table. Available online: https://home.kpmg/xx/en/home/services/tax/tax-tools-and-resources/tax-rates-online/corporate-tax-rates-table.html (accessed on 1 November 2021).
  69. Egli, F.; Steffen, B.; Schmidt, T.S. A dynamic analysis of financing conditions for renewable energy technologies. Nat. Energy 2018, 3, 1084–1092. [Google Scholar] [CrossRef]
  70. IEA. Projected Costs of Generating Electricity 2020; International Energy Agency: Paris, France, 2020.
  71. Warusawitharana, M. The Social Discount Rate in Developing Countries; Board of Governors of the Federal Reserve System (US): Washington, DC, USA, 2014.
  72. Syrian Ministry of Electricity Syria Feed-in Tariff Syria AR, Ministry of Electricity. 2011. Available online: https://taqaway.net/documents/syria-feed-tariff-syria-ar-ministry-electricity-2011 (accessed on 1 November 2021).
  73. Almohamadi, A. Priorities for the Recovery of the Electricity Sector in Yemen; Deep Root Consulting: London, UK, 2021. [Google Scholar]
  74. African Development Bank. Power Sector Reform Support Program—Angola; African Development Bank: Abidjan, Cote D’Ivoire, 2014. [Google Scholar]
  75. IRENA. Renewable Energy in Latin America 2015: An Overview of Policies; IRENA: Masdar City, United Arab Emirates, 2015. [Google Scholar]
  76. El-Mazghouny, D. The Renewable Energy Law Review: Egypt. Available online: https://thelawreviews.co.uk/title/the-renewable-energy-law-review/egypt (accessed on 1 November 2021).
  77. Prateek, S. Feed-In Tariffs to Make a Comeback in India for Small Solar and Wind Projects. Available online: https://mercomindia.com/feed-in-tariff-solar-wind/ (accessed on 1 November 2021).
  78. IEA. Solar Feed-In Tariff of Indonesia (2016); IEA: Paris, France, 2021.
  79. Parliament—Mozambique, Regulations Establishing the New and Renewable Energy Feed-In Tariff. Available online: https://rise.esmap.org/data/files/library/mozambique/Documents/Renewable%20Energy/Mozambique_REFIT_Regulation%20feed-in%20tariff_2014.pdf (accessed on 1 November 2021).
  80. Ross, R.P. Myanmar’s Path to Electrification—The role of Distributed Energy Systems; Center for Strategic & International Studies: Washington, DC, USA, 2015. [Google Scholar]
  81. Adeniyi, F. Overcoming the Market Constraints to On-Grid Renewable Energy Investments in Nigeria; The Oxford Institute for Energy Studies: Oxford, UK, 2019. [Google Scholar]
  82. Khan, A.J. Structure and Regulation of the Electricity Networks in Pakistan. Pak. Dev. Rev. 2014, 53, 505–528. [Google Scholar] [CrossRef] [Green Version]
  83. Department of Petroleum Energy in Papua New Guinea PAPUA NEW GUINEA: National Energy Policy 2016–2020. Available online: https://policy.asiapacificenergy.org/node/2676 (accessed on 1 November 2021).
  84. Radchenko, V. Electricity Law and Regulation in Ukraine. Available online: https://cms.law/en/int/expert-guides/cms-expert-guide-to-electricity/ukraine#:~:text=1.2.,1.2. (accessed on 1 November 2021).
  85. Kabilov, J.-S.; Abdurazakov, F. The Renewable Energy Law Review: Uzbekistan. Available online: https://thelawreviews.co.uk/title/the-renewable-energy-law-review/uzbekistan (accessed on 1 November 2021).
  86. Tien, T.F.; Thanh, B. Overview of Investment in Renewable Energy in Vietnam; Freshfields Bruckhaus Deringer: London, UK, 2020. [Google Scholar]
  87. Flanders Investment and Trade. Oil & Gas Report Angola; Flanders Investment and Trade: Flanders, Belgium, 2021. [Google Scholar]
  88. Honore, A. South American Gas Markets and the Role of LNG; The Oxford Institute for Energy Studies: Oxford, UK, 2016. [Google Scholar]
  89. Raus, L. Overview of Egypt’s Upstream Sector. Available online: https://egyptoil-gas.com/features/overview-of-egypts-upstream-sector/ (accessed on 1 November 2021).
  90. Mordor Intelligence India Oil and Gas Usptream Market—Growth, Trends, COVID-19 Impact and Forecasts (2021–2026). Available online: https://www.mordorintelligence.com/industry-reports/india-oil-and-gas-upstream-market (accessed on 1 November 2021).
  91. Oxford Business Group How Indonesia Supports Upstream Activity in Energy Sector. Available online: https://oxfordbusinessgroup.com/overview/capacity-change-oil-fields-mature-and-domestic-consumption-rises-sector-refocuses-boosting-upstream (accessed on 1 November 2021).
  92. Energy Capital & Power Upstream to Downstream: Mozambique’s Major Developments. Available online: https://energycapitalpower.com/upstream-to-downstream-mozambiques-major-developments/ (accessed on 1 November 2021).
  93. Agha, S.; Penglis, E.; Roland-Holst, D.W.; Rabbi, F. An Initial Assessment of the Economic Costs of Natural Gas for Myanmar’s Domestic Market; The World Bank: Washington, DC, USA, 2016. [Google Scholar]
  94. Anderson, S. Why Investors May Have Nigerian Upstream Assets in Their Sights. Available online: https://www.woodmac.com/news/opinion/why-investors-may-have-nigerian-upstream-assets-in-their-sights/ (accessed on 1 November 2021).
  95. Gomes, I. Natural Gas in Pakistan and Bangladesh: Current Issues and Trends; The Oxford Institute for Energy Studies: Oxford, UK, 2013. [Google Scholar]
  96. Turkes, H. Total and Partners Sign Agreement for Papua LNG Project. Available online: https://www.aa.com.tr/en/energy/general/total-and-partners-sign-agreement-for-papua-lng-project/25097 (accessed on 1 November 2021).
  97. Pirani, S. Central Asian Gas: Prospects for the 2020s; The Oxford Institute for Energy Studies: Oxford, UK, 2019. [Google Scholar]
  98. IES & EMCa. Viet Nam: Roadmap for Natural Gas Market Development; Intelligent Energy Systems (IES) & Energy Market Consulting Associates (EMCa). Available online: https://ppiaf.org/documents/5572/download (accessed on 1 November 2021).
  99. S&P Global. Devastated by War, Yemen’s still Surviving Oil and Gas Sector needs Peace to Recover. Available online: https://www.spglobal.com/platts/en/market-insights/latest-news/oil/081221-devastated-by-war-yemens-still-surviving-oil-and-gas-sector-needs-peace-to-recover (accessed on 1 November 2021).
  100. Tran, T.T.; Smith, A.D. Incorporating performance-based global sensitivity and uncertainty analysis into LCOE calculations for emerging renewable energy technologies. Appl. Energy 2018, 216, 157–171. [Google Scholar] [CrossRef]
  101. IRENA. Renewable Power Generation Costs in 2020; IRENA: Masdar City, United Arab Emirates, 2021. [Google Scholar]
  102. Lazard. Lazard’s Levelized Cost of Energy Analysis; Lazard: Tokyo, Japan, 2020. [Google Scholar]
  103. Goldberg, M.J. Gas Sector Development Project—Bolivia-Brazil Gas Pipeline. Available online: https://projects.worldbank.org/en/projects-operations/project-detail/P006549 (accessed on 1 November 2021).
  104. CNPC. Overview of the Myanmar-China Oil & Gas Pipelines. Available online: https://www.cnpc.com.cn/en/myanmarcsr/201407/f115a1cc6cdb4700b55def91a0d11d03/files/dec09c5452ec4d2ba36ee33a8efd4314.pdf (accessed on 1 November 2021).
  105. CNPC. Flow of Natural Gas from Central Asia. Available online: https://www.cnpc.com.cn/en/FlowofnaturalgasfromCentralAsia/FlowofnaturalgasfromCentralAsia2.shtml (accessed on 1 November 2021).
  106. Sayigh, Y. The War Over Syria’s Gas Fields. Available online: https://carnegie-mec.org/diwan/60316 (accessed on 1 November 2021).
  107. EIA. Country Analysis: Bolivia. Available online: https://www.eia.gov/international/analysis/country/BOL (accessed on 1 November 2021).
  108. EIA. Country Analysis: Angola. Available online: https://www.eia.gov/international/analysis/country/AGO (accessed on 1 November 2021).
  109. AngolaLNG Angola Gas Supply. Available online: https://www.angolalng.com/en/operations/gas-supply/ (accessed on 1 November 2021).
  110. Widdershoven, C. Egypt is Shaping up to Become a Real Energy Hub. Available online: https://berrycommodities.com/egypt-is-shaping-up-to-become-a-real-energy-hub/ (accessed on 1 November 2021).
  111. Fouad, A. Egypt’s Future in the LNG Market. Available online: https://www.mei.edu/publications/egypts-future-lng-market (accessed on 1 November 2021).
  112. EIA. Country Analysis: Egypt. Available online: https://www.eia.gov/international/analysis/country/EGY (accessed on 1 November 2021).
  113. EIA. Country Analysis: Indonesia. Available online: https://www.eia.gov/international/analysis/country/IDN (accessed on 1 November 2021).
  114. Jamieson, A. Momentum Grows in Mozambique Mega Gas Projects, but Multiple Challenges Lie Ahead. Available online: https://www.turnerandtownsend.com/en/perspectives/momentum-grows-in-mozambique-mega-gas-projects-but-multiple-challenges-lie-ahead/ (accessed on 1 November 2021).
  115. EIA. Country Analysis: Mozambique. Available online: https://www.eia.gov/international/analysis/country/MOZ (accessed on 1 November 2021).
  116. Bidaurratzaga, A.E.; Colom, J.A. Mozambique’s Megaproject-Based Economic Model: Still Struggling with Uneven Development? Adv. Afr. Econ. Soc. Political Dev. 2019, 2019, 95–113. [Google Scholar] [CrossRef]
  117. Napims Crude Oil Reserves/Production—Nigeria. Available online: https://napims.nnpcgroup.com/Pages/Crude-Oil-Reserves-Production.aspx (accessed on 1 November 2021).
  118. EIA. Country Analysis: Nigeria. Available online: https://www.eia.gov/international/analysis/country/NGA (accessed on 1 November 2021).
  119. Humphreys, S. Papua New Guinea: A Review and Forecast of Exploration and Production. Available online: https://ihsmarkit.com/research-analysis/papua-new-guinea-exploration-and-production.html (accessed on 1 November 2021).
  120. PNG LNG. Available online: https://www.pnglng.com/About (accessed on 1 November 2021).
  121. EIA. Country Analysis: Yemen. Available online: https://www.eia.gov/international/analysis/country/YEM (accessed on 1 November 2021).
  122. Petroleum & Natural Gas Regulatory Board—India. “Vision 2030” Natural Gas Infrastructure in India. Available online: https://www.pngrb.gov.in/Hindi-Website/pdf/vision-NGPV-2030-06092013.pdf (accessed on 1 November 2021).
  123. EIA. Country Analysis: India. Available online: https://www.eia.gov/international/analysis/country/IND (accessed on 1 November 2021).
  124. Gong, J.-M.; Liao, J.; Liang, J.; Lei, B.-H.; Chen, J.-W.; Khalid, M.; Haider, S.W.; Meng, M. Exploration prospects of oil and gas in the Northwestern part of the Offshore Indus Basin, Pakistan. China Geol. 2020, 3, 633–642. [Google Scholar] [CrossRef]
  125. EIA. Country Analysis: Pakistan. Available online: https://www.eia.gov/international/analysis/country/PAK (accessed on 1 November 2021).
  126. EIA. Country Analysis: Viet Nam. Available online: https://www.eia.gov/international/analysis/country/VNM (accessed on 1 November 2021).
  127. Chávez-Rodríguez, M.F.; Garaffa, R.; Andrade, G.; Cárdenas, G.; Szklo, A.; Lucena, A.F.P. Can Bolivia keep its role as a major natural gas exporter in South America? J. Nat. Gas Sci. Eng. 2016, 33, 717–730. [Google Scholar] [CrossRef]
  128. EIA. Country Analysis: Uzbekistan. Available online: https://www.eia.gov/international/analysis/country/UZB (accessed on 1 November 2021).
  129. EIA. Country Analysis: Syria. Available online: https://www.eia.gov/international/analysis/country/SYR (accessed on 1 November 2021).
  130. Piran, S.; Sharples, J. Ukraine-EU Gas Market Integration; The Oxford Institute for Energy Studies: Oxford, UK, 2021. [Google Scholar]
  131. Rystad Energy UCube Barrel Breakdown. Available online: http://graphics.wsj.com/oil-barrel-breakdown/ (accessed on 1 November 2021).
  132. Jaganathan, J. Analysis: Qatar Tightens Global Gas Market Grip with Bold Expansion Moves. Available online: https://www.reuters.com/article/us-qatar-lng-exports-analysis-idUSKBN2B80EZ (accessed on 1 November 2021).
  133. Mikulska, A.; Kosinski, E. What’s Next for Natural Gas in Ukraine? Baker Institute for Public Policy: Houston, TX, USA, 2020. Available online: https://www.bakerinstitute.org/media/files/files/6754d0f0/ces-wp-ukraine-050720.pdf (accessed on 1 November 2021).
Figure 1. Structure of the proposed integrated energy contract.
Energies 15 01651 g001
Figure 2. Protection levels for different values of r across the considered countries.
Energies 15 01651 g002
Figure 3. Added PV capacity per Tcf of natural gas and % reduction in PV LCOE across the 15 considered countries.
Energies 15 01651 g003
Table 1. Overview of the current status and future renewable energy targets in the electricity sector of lower-income countries possessing natural gas reserves.
CountryNatural Gas Reserves (Tcf) aAccess to Electricity bTotal Electricity Capacity (MW) bRenewable Electricity
Capacity (MW) b
Share of
Renewable
Electricity
Generation b
Renewable Energy
Targets in 2030
(MW or Share of
Total Generation) c
HydroNon-Hydro
Angola12.145%593137296472%Hydro: 6310
Non-Hydro: 1740
Bolivia10.793%353773632136%81%
Egypt63100%59,420283231399%42%
India48.895%452,30845,95588,30217%500,000
Indonesia49.799%70,3876210434416%21,650
Mozambique10031%2915220410995%NA
Myanmar22.566%7336330414452%Hydro: 5676
Non-Hydro: 3070
Nigeria203.457%13,15421534125%Hydro: 17,653
Non-Hydro: 22,741
Pakistan20.973%39,42810,002240431%60%
PNG d6.559%10372587563%78%
Syria8.586%86251490103%10%
Ukraine39100%57,643481989458%13.2%
Uzbekistan65100%16,0412005411%25%
Viet Nam24.7100%69,35518,16517,48443%NA
Yemen16.962%1947025314%NA
a Based on the U.S. Energy Information Administration [30]; b Based-on IRENA country energy profiles [31]; c Based on their latest Nationally Determined Contributions (NDCs) as published on the UNFCCC website [32], except for Egypt [33], India [34], and Ukraine [35]; d Papua New Guinea.
Table 2. Renewable energy targets for European energy companies.
Energy CompanyRenewable Energy Capacity Target in 2030 (GW)
TotalEnergies [40]100
BP [41]50
Eni [42]15
Repsol [43]15
Equinor [44]12 to 16
Table 3. Parameters kept constant for all countries.
ParameterValue
PV
Years of construction1
W d (Weight of debt)80%
D S r (Default spread of RE projects)2%
r f (USD risk free rate)2.14%
Upstream
Years of construction5
State
State discount rate a11%
a Based on the typical discount rates in developing countries [71].
Table 4. Simulation results for added PV capacity and upstream investment success rate by country.
CountryAdded PV Capacity (MW)% of 2030 RE Target Capacity Additions Achieved% Increase in Total Electricity CapacityPositive FID Rate
Angola136932%23%49%
Bolivia1934NA55%55%
Egypt7904NA13%48%
India14,1874%3%76%
Indonesia663560%9%64%
Mozambique9792NA336%31%
Myanmar346765%47%76%
Nigeria26,76270%203%61%
Pakistan4135NA10%85%
PNG985NA95%72%
Syria1082NA13%53%
Ukraine8235NA14%81%
Uzbekistan10,965NA68%66%
Viet Nam3906NA6%79%
Yemen2138NA110%55%
Publisher’s Note: MDPI stays neutral with regard to jurisdictional claims in published maps and institutional affiliations.

