Article

The Influence of Different Operating Conditions on the Support Bracket Stress in Pumped Storage Units

1
Fujian Xianyou Pumped Storage Co., Ltd., Putian 351267, China
2
State Key Laboratory of Hydroscience and Engineering, Department of Energy and Power Engineering, Tsinghua University, Beijing 100084, China
*
Author to whom correspondence should be addressed.
Energies 2022, 15(6), 2195; https://doi.org/10.3390/en15062195
Submission received: 25 February 2022 / Revised: 13 March 2022 / Accepted: 15 March 2022 / Published: 17 March 2022
(This article belongs to the Special Issue Multiphysics Coupling Investigation of Turbomachinery)

Abstract

:
In order to balance the intermittent supply of energy to the power grid, pumped storage units have to operate more and more in extended operating conditions and switch their mode frequently. During operation, the turbine unit has to withstand various axial forces that may cause deformation and fatigue damage to the key components of the machine. The excessive load could surpass the weight of the runner body, which is dangerous for the power plant. For the safe and stable operation, the simulation of the axial force under pump condition is performed by the computational fluid dynamics method (CFD) in this paper. The CFD simulation result has revealed the variation rule of the axial force with the operating condition. Besides, the conditions with pressure-balance pipelines (PBP) blockage are also investigated and the mechanism of PBP on reducing the axial force applied on the bracket has been revealed. The maximum stresses are calculated by means of Finite Element Method (FEM) and compared with the normal conditions. The result shows that the blocked PBP will increase 62.20% of the maximum stress on the support bracket.

1. Introduction

Pumped storage is a kind of energy that can consume excessive energy when the generation is larger than the consumption and provide energy to the grid when there is supply requirements. Currently, pumped storage is the only large energy that can balance the supply and consumption in the power grid [1]. In recent decades, pumped storage units developed rapidly worldwide for their pivotal role in electric systems [2]. With the target of Sustainable Development Goal, the utilization of new renewable energies such as wind and solar energy is undergoing a rapid development. The power grid becomes more and more intermittent because of the unstable weather and alternate of day and night [3,4]. Pump-turbine is the core element in a pumped storage plant. It converts the excessive energy of the power grid into potential hydraulic energy of water and generates electricity in turbine mode by reversing its rotation direction [5]. With the new scenario, pump-turbine units have to start and stop within a short time frequently to meet the requirements of both generator mode and pump mode [6]. Compared with traditional hydraulic turbines, pump-turbines are operating at higher pressure and have fewer number of blades. Due to the special design, pump-turbine units have to withstand more hydraulic excitations than the other types of hydraulic turbines. The hydraulic thrust of runner flow is one of the most important hydraulic excitations in pump-turbines. Together with the weight of the runner body, hydraulic thrust of runner flow forms the axial loads, typically up to millions of tons [7]. Too much upward axial force may cause unit lifting, wearing on the seal ring, and subsequent mechanical failure [8]. On the other hand, excessive downward axial force would raise the temperature of the bearings and cause support bracket deformation which lead to the runner move down [9]. The unexpected axial hydraulic thrust force brings risks to the operation stability of pumped storage stations. Therefore, it is essential to analyze the influence of operation condition on the axial hydraulic thrust force and research the methodologies to control it in pump-turbine units.
Accurate estimation is the precondition for the optimization of axial force in pump-turbine units. A series of methodologies have been proposed in the previous research. Traditionally, the calculation method decomposes the hydraulic axial thrust into several parts such as the flow passage, runner gaps, inlet, outlet, etc. [10]. Fort, et al. [11] introduced a series of formulas that can calculate the hydraulic thrust force from a radial profile of the axial component in the impeller discharge stream. The formulas were validated by weighing the mixing vessel when rotating. Numerical simulation is a commonly used method in engineering because it provides detailed flow information and the detailed flow features in the inner fluid passage [12]. Especially with the development of computer technology, the calculation speed has increased significantly in recent years [13,14,15,16]. Based on axial force analysis theory and gap modeling, many researchers further apply computational fluid dynamics (CFD) to the research and analysis of hydraulic machinery axial force. Xiangyang Li, et al. [17] simulated the load-rejection process of a pump-turbine unit. The CFD calculation has considered the full leakage in the runner crown and shroud. The research found that the pressure difference between crown gap and internal-runner near outlet is the key factor in inducing axial force. Jinwei Li, et al. [18] quantitatively investigated the hydraulic force on the impeller of a pump-turbine through CFD and found that both the amplitude of the force and its dominant components strongly depend on the operating conditions. Weidong Shi, et al. [19] found through CFD simulation that the axial force on the inner surface of the runner accounts for a large proportion of the hydraulic mechanical axial force, which is the most important factor affecting the axial force. Cavitation is another important factor that influence the axial force of pump-turbine. Di Zhu, et al. [20] investigated the leading-edge cavitation on impeller blades by CFD. The result showed that the largest variation reached 13% of the axial force in the pump mode of the reversible pump-turbine. Jingwei Cao et al. [21] calculated the hydraulic thrust in pump turbines by numerical analysis and discovered the thrust pressure pulsation can reach 16% of the head of the unit.
Researchers have made a lot of efforts for the investigation of the effect of axial force and its optimization in hydraulic machinery. P. Kalinichenko and A. Suprun [22] installed a balance piston in a pump to decrease its axial force at the expense of a volume and mechanical energy loss on a node of axled relief of the pump rotor. Hongzhong Ma, et al. [23] proposed a type of magnetic levitation device which shares most of the hydraulic generator rotor weight to reduce the axial load on the thrust bearing. The device can effectively reduce the axial force under extreme conditions. Ling Zhou, et al. [24] found through CFD simulation that the axial force on the inner surface of the runner is restricted by hydraulic design. Balancing the pressure difference between the gap between the front and rear cover plates of the impeller is the main method and feasible way to adjust the axial force of the hydraulic machinery. Pressure-balance pipelines (PBPs) are generally installed between the upper gap of the runner and the draft tube in order to decrease the axial hydraulic thrust [25], but it also brings volume loss and pressure pulsation to the power plant [26]. It is necessary to investigate the effects of the failure of the PBPs to ensure the safety of the power plant and the operators. The axial hydraulic thrust force plays an important role in the stress of the pump-turbine unit. Tanaka [27] investigated the runner dynamic stress and vibration due to hydraulic excitation forces in both experimental and theoretical aspects. The relationship between runner vibration and the interaction of runner blades and guide vanes was revealed. By numerical simulation, Lingyan He et al. [28,29] studied the stresses and deformation of pump-turbine runner based on the one-way fluid structure interaction method. The maximum stress locations are always at the fillets of blade leading edges near the band. Zhongyu Mao et al. [30] investigated the stress on the support bracket of a pump turbine during the start-up and found out the stress concentration point. In the previous research, it can be concluded that pressure difference in the runner is the main reason that causes the axial force and the axial force can be reduced by PBPs. However, the above research didn’t consider the influence of different operating conditions on the axial force and stress of the machine. The effect of the failure of PBPs also needs to be investigated.
In this paper, the influence of the operating condition on the stress of the support bracket of pump-turbine units is investigated by both CFD and FEM. The mechanism of axial force is revealed. In addition, the conditions of pressure-balance pipelines (PBP) blockage are also investigated and the axial force are calculated. In order to evaluate the effect of the PBP blockage, the axial forces with PBP and PBP blockage are applied on the model of the support bracket. The stresses analyzed based on FEM have revealed that the PBP blockage would increase 62.20% of the maximum stress of the bracket. This study would be helpful to predict the structure characteristic of support brackets and enhance the operation stability of the pumped storage unit.
The paper is organized as follows: Section 2 introduces the calculation methodology used in this research, Section 3 presents the numerical model of CFD and FEM and the simulation setting, in Section 4 shows the result of axial force under different operating conditions, Section 5 discusses the factors that influence the axial force in pump-turbine units, and Section 6 provides the concluding remarks.

2. Simulation and Experiment Method
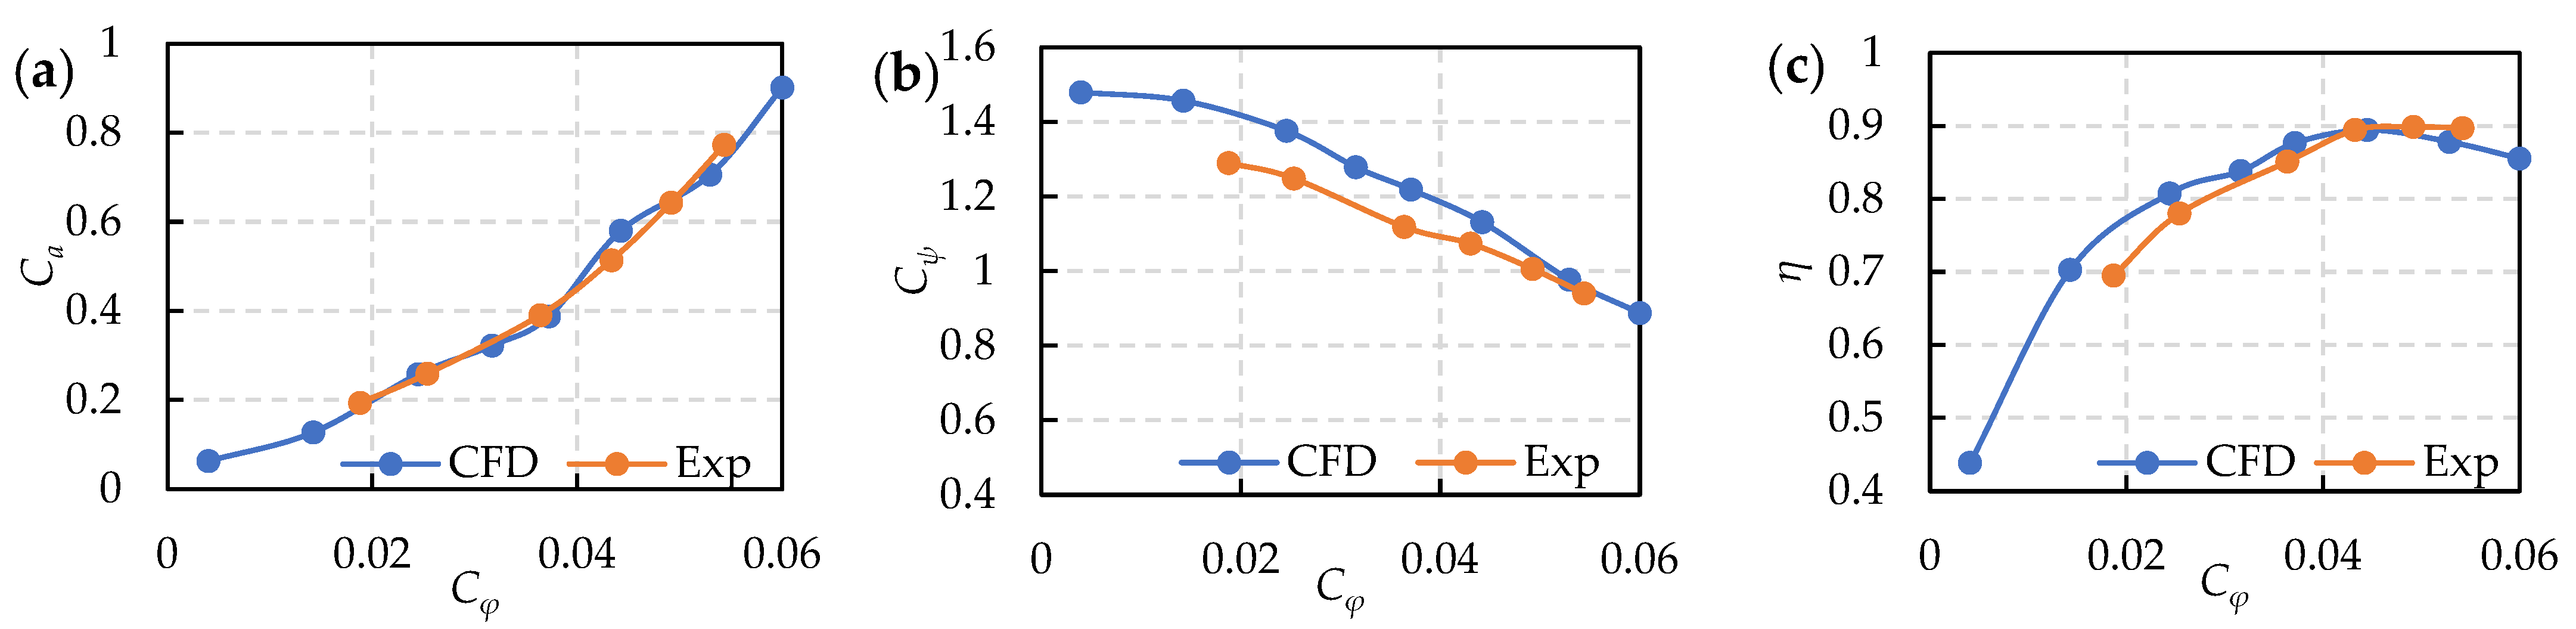
2.1. CFD Simulation

This study uses CFD numerical simulation to carry out the simulation and analysis of the internal flow of pump-turbine. Based on the Reynolds Time Average (RANS) method, the continuity equation, momentum equation, and energy equation can be written as the following equations:
u i ¯ x i = 0
ρ u i ¯ t + ρ u j ¯ u i ¯ x j = x j [ p ¯ δ i j + 2 μ S i j ¯ ρ u i u j ¯ ]
t ( ρ h t o t ) p t + x j ( ρ u j h t o t ) = x j ( λ t T x j u j h s t a ¯ ) + x j [ u j ( 2 μ S i j ¯ ρ u i u j ¯ ) ]
where, u represents the velocity, t represents the time, ρ represents density, x is the component of the coordinate system, δij is the Kroneker number, μ is the dynamic viscosity, ρ u i u j ¯ is the Reynold stress, S i j ¯ is the averaged strain rate tensor, T is temperature, hsta is the static enthalpy, htot is the total enthalpy, and λt is the thermal conductivity coefficient.
Due to the disclosure of Reynolds Time Average simulation equation, turbulence model is required to be introduced to close the equation. Based on Boussinesq assumption, vortex viscosity coefficient μt is defined. The tensor relation between Raynold stress and averaged strain rate tensor is built up as follows:
ρ u i u j = 2 μ t S i j 2 3 k δ i j
In this equation, k is the turbulence kinetic energy. In this research, the Shear Stress Transport turbulence model (SST) k-ω model is used as the turbulence model [31,32]. SST combines the advantages of both k-ω and k-ε turbulence models. It applies the k-ω model inside the boundary layer and switches to k-ε model in the free shear flow far away from the wall [31]. By combining the standard k-ε model and Wilcox k-ω model, the adaptation of k-ω model is increased and it will be able to solve the strong reverse pressure gradient flow and strong boundary layer shear flow. The turbulent kinetic energy k equation and the dissipation rate ω equation are as follows:
( ρ k ) t + ( ρ u i k ) x i = P ρ k 3 2 l k ω + x i [ ( μ + σ k μ t ) k x i ]
( ρ ω ) t + ( ρ u i ω ) x i = C ω P β ρ ω 2 + x i [ ( μ l + σ ω μ t ) ω x i ] + 2 ( 1 F 1 ) ρ σ ω 2 ω k x i ω x i
where P is turbulence generation term, F1 is the mixing equation, σk, σω, βk, and Cω are model coefficients, and lk-ω is the turbulence scale, which can be calculated by lk-ω = k1/2βkω. In this research, the force applied on different surfaces of the runner under each operating conditions will be calculated according to the above equations.

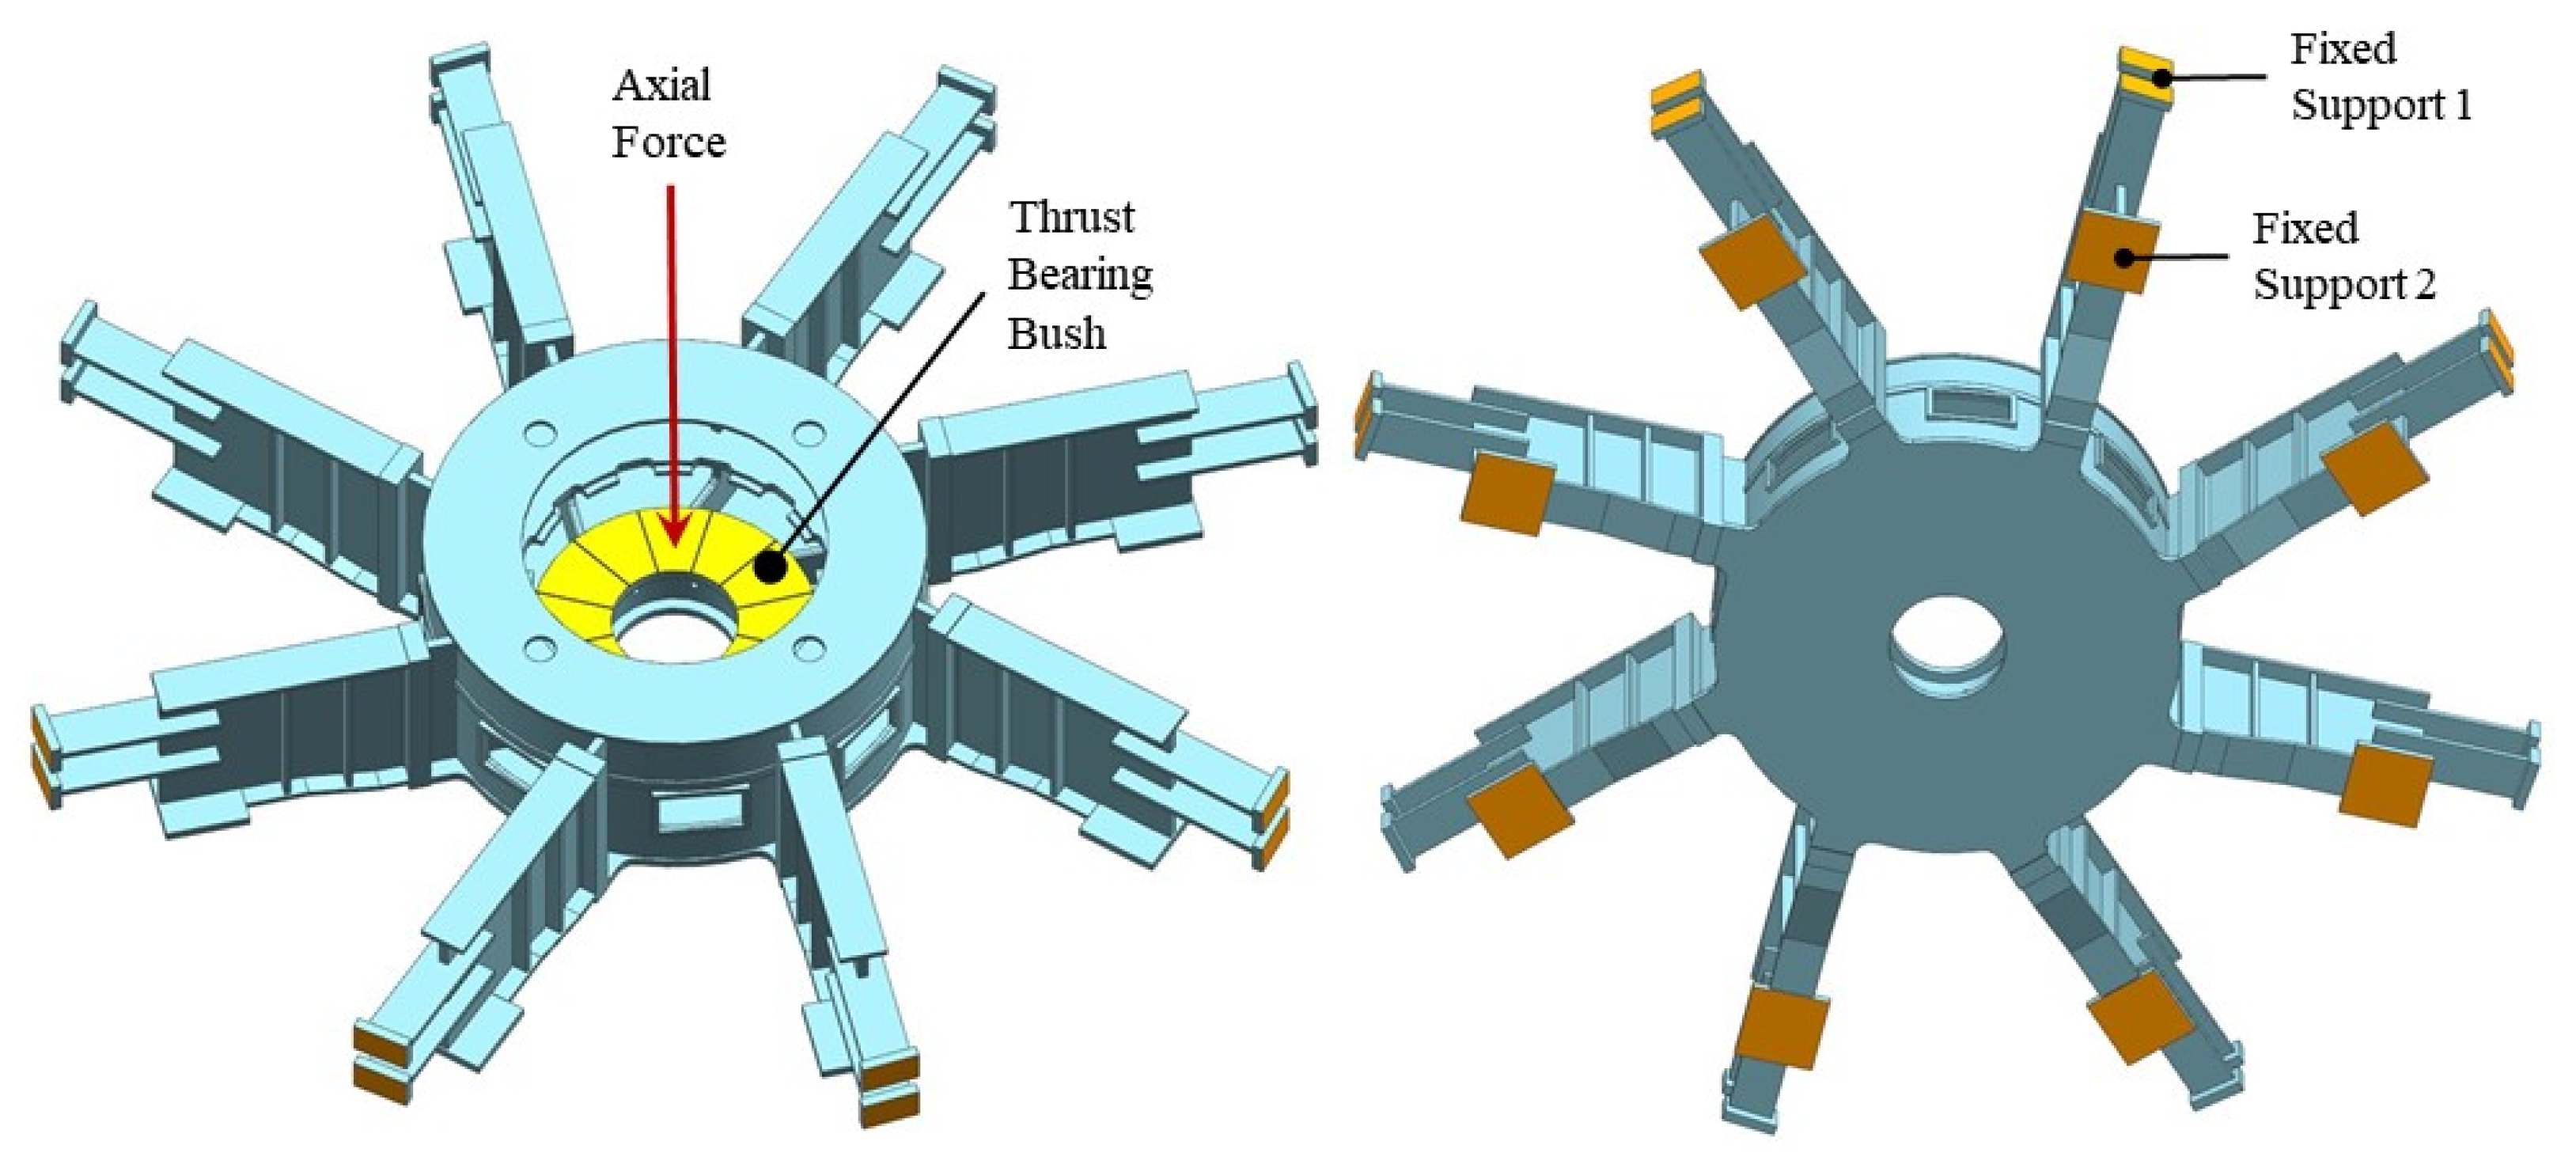
2.2. The Structure Analysis Method

The structural motion equation for a linear structural system can be written as [33]:
M s { u ¨ } + C s { u ˙ } + K s { u } = { F s }
where Ms is the mass matrix, Cs is the damping matrix, Ks is the stiffness matrix, { u } , { u ˙ } , { u ¨ } are the vectors of node deformation, velocity and acceleration, {Fs} is the vectors of force loaded on the structure.
The static stress σ can be calculated by:
σ = D s B s { u }
where Ds is the elastic matrix and Bs is the strain-displacement matrix.
The equivalent von Mises stress σc can be calculated using the fourth strength theory:
σ c = 1 2 [ ( σ 1 σ 2 ) 2 + ( σ 2 σ 3 ) 2 + ( σ 3 σ 1 ) 2 ]
where σ1, σ2 and σ3 are the first, second and third principal stress. In this research the axial force will be applied on the structural model and the effects of the axial force will be calculated according to the above equations.

3. Model and Simulation Settings
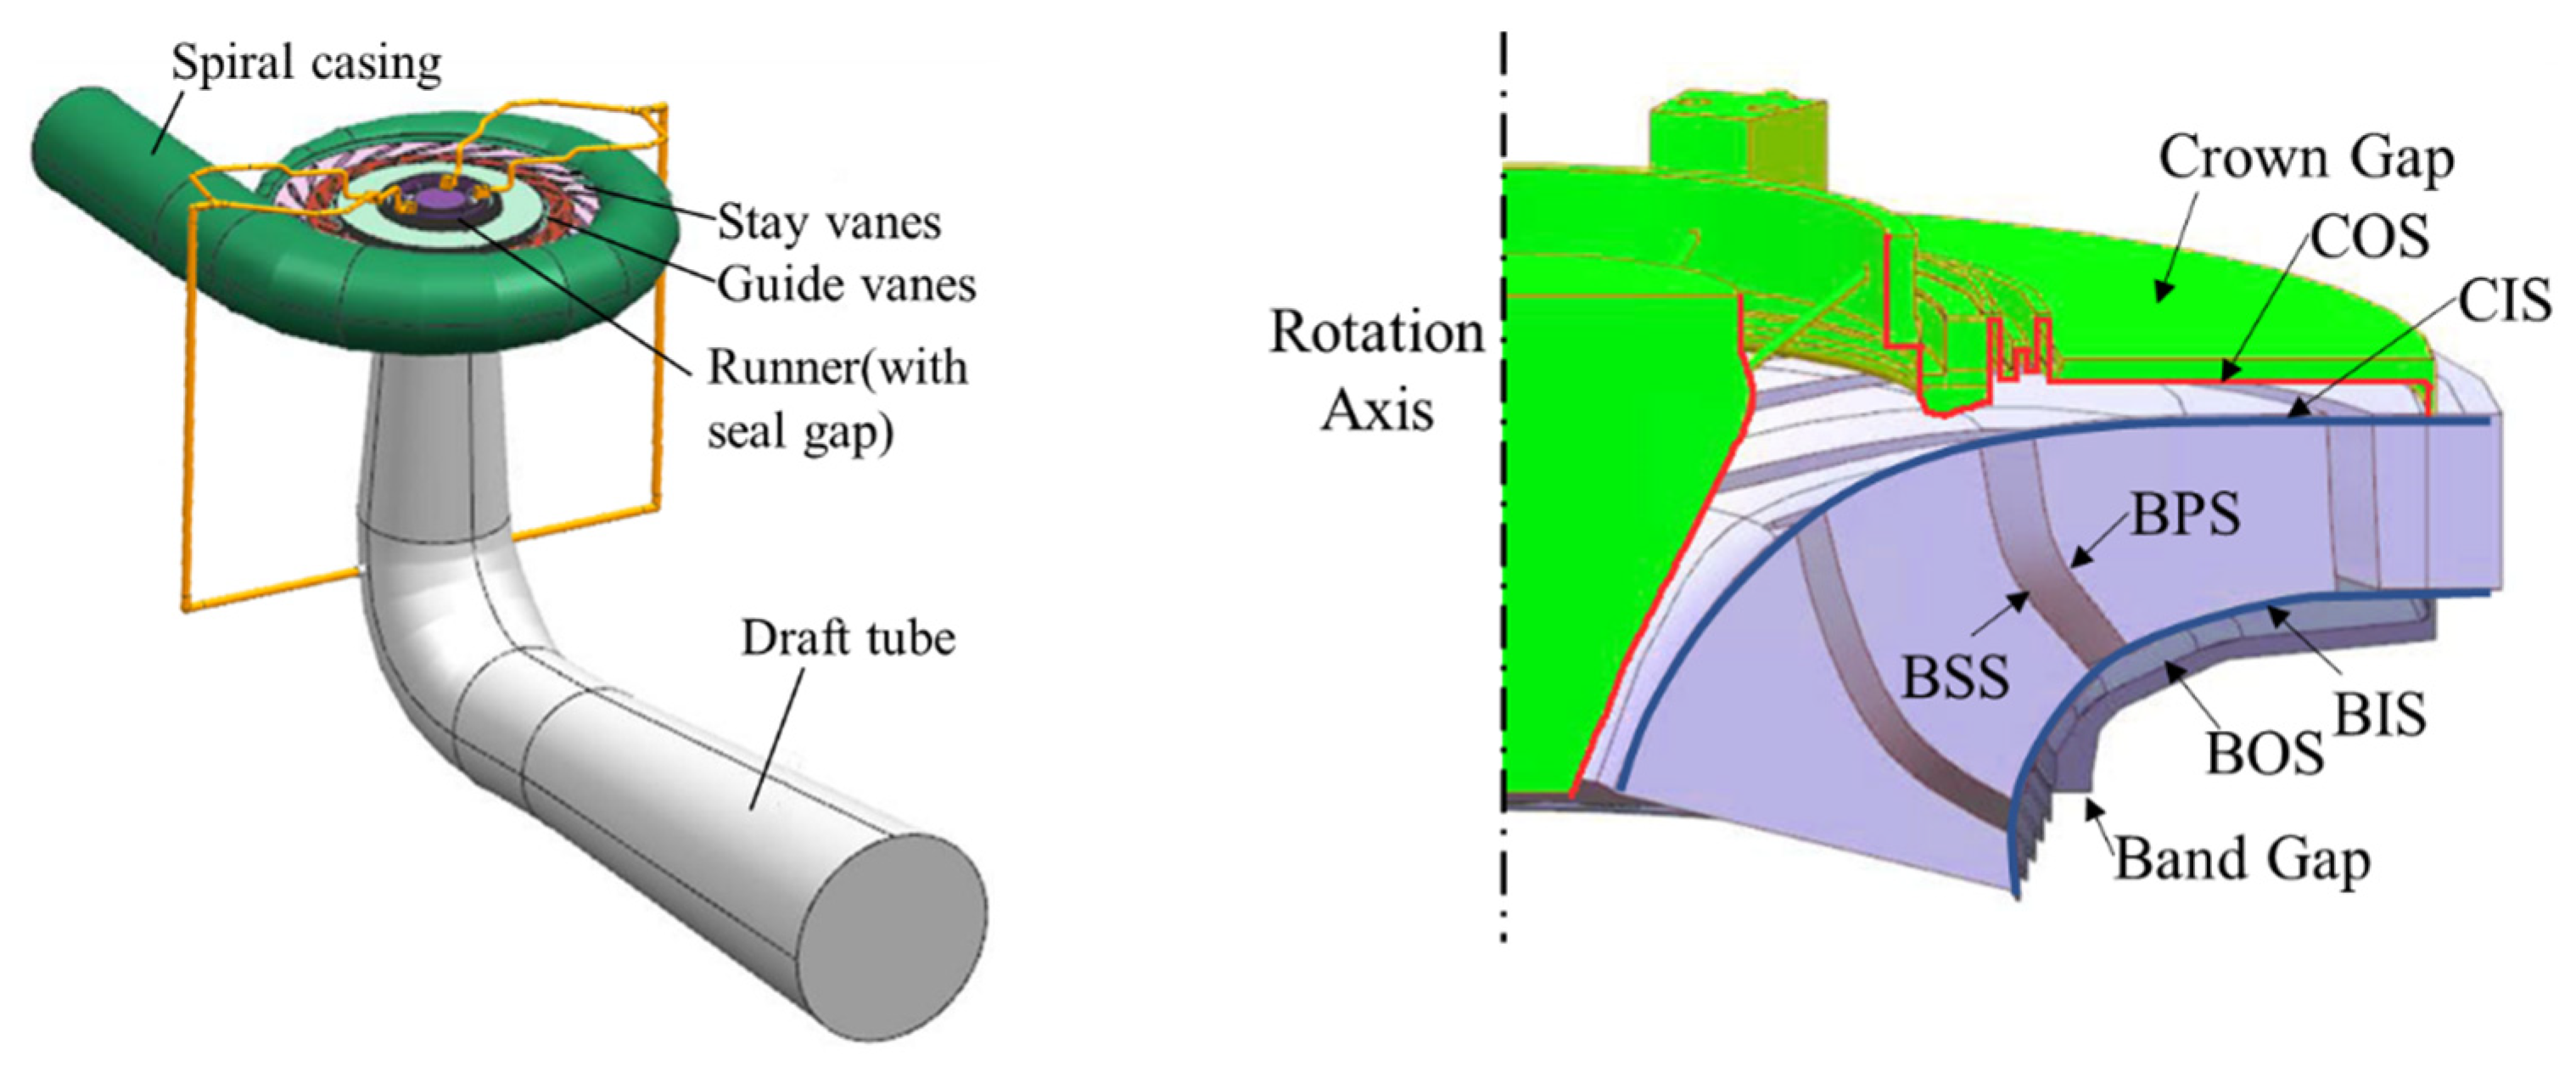
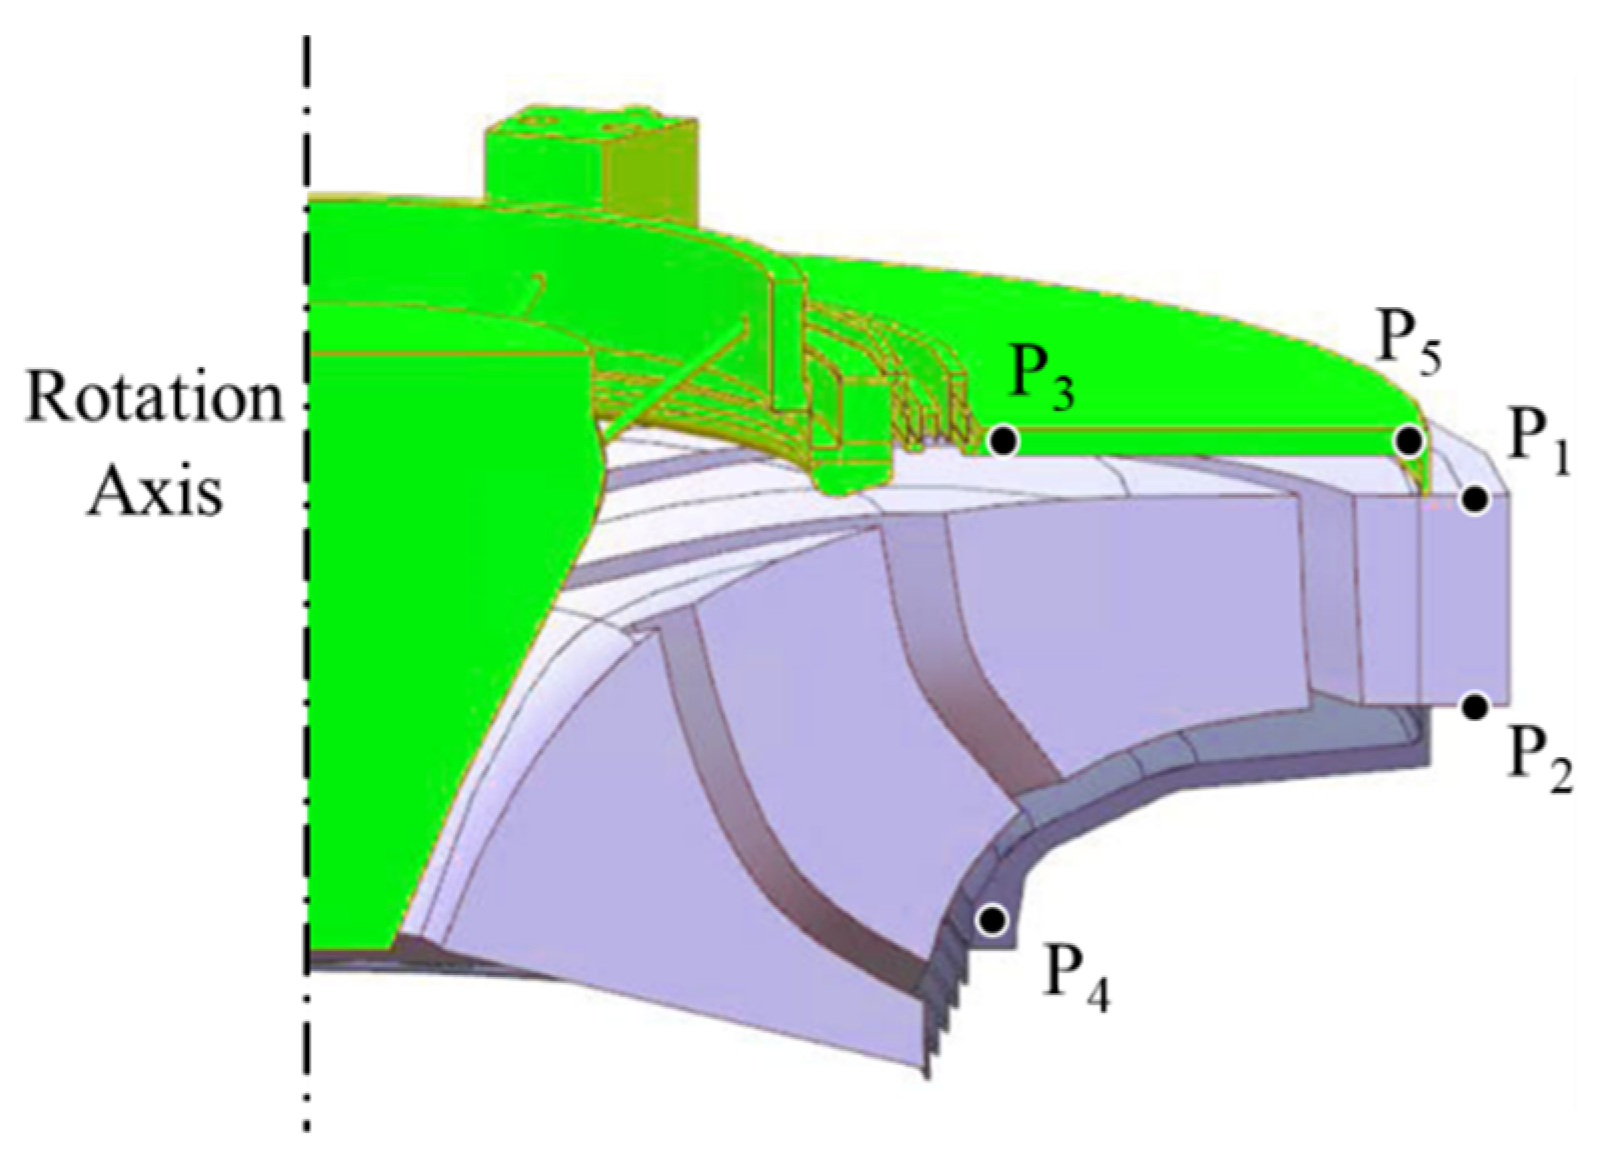
The researched model is a pump-turbine with a specific speed ns of 120. The shaft system, as well as the support bracket, is shown in Figure 1. The total mass of the rotating components is 550 t and the other detailed parameters of the prototype are listed in Table 1.
In order to validate the CFD result by the field test data. The dimensionless guide vane opening Ca, head coefficient Cψ, flow rate coefficient Cφ, and relative pressure Cp are defined according to the following equations:
C A = α α m a x
C ψ = 2 g H Ω 2 ( 0.5 D h i ) 2
C φ = Q π Ω ( 0.5 D h i ) 3
C p = p ρ g H r
where, αmax is the maximum guide vane opening of the researched unit. H and Q are the head and the discharge, respectively. g represents the gravity acceleration, which equals to 9.81 m/s2. hr is the rated head. Ω represents the angular velocity of the runner. In our case, the designed head coefficient Cψ and flow rate coefficient Cφ equal to 0.97 and 0.057, respectively.

3.1. Model of CFD

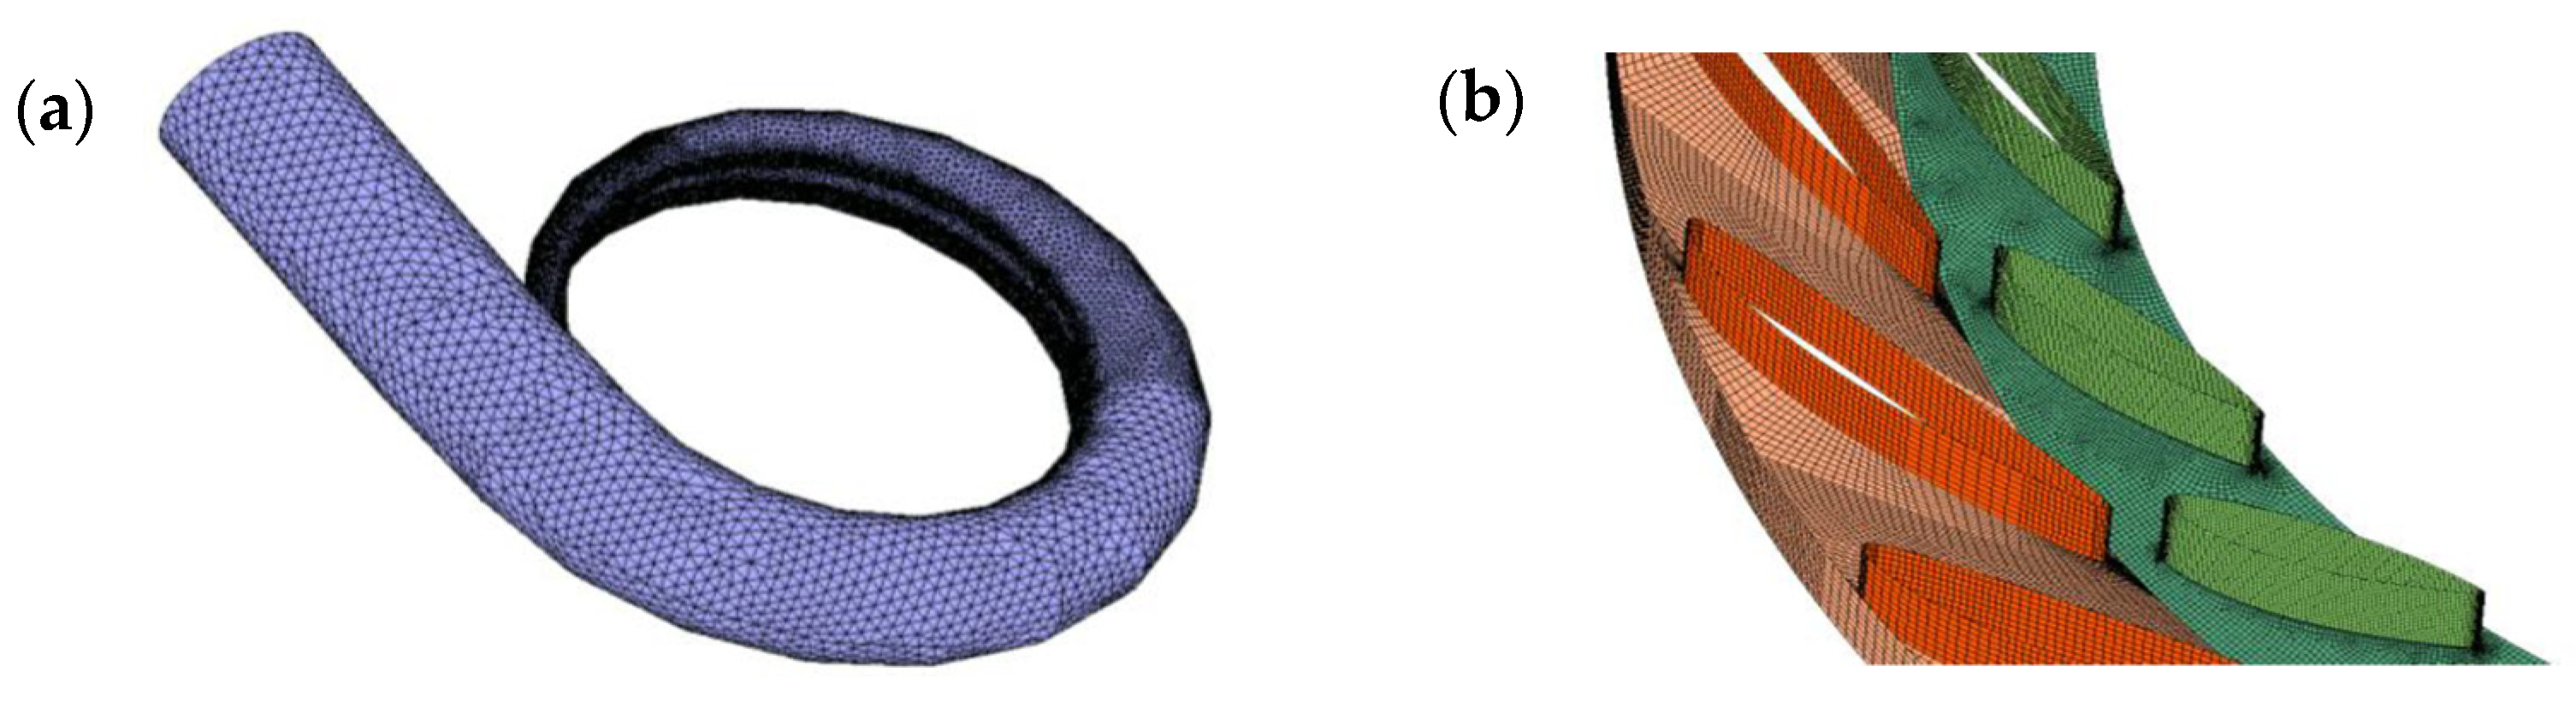
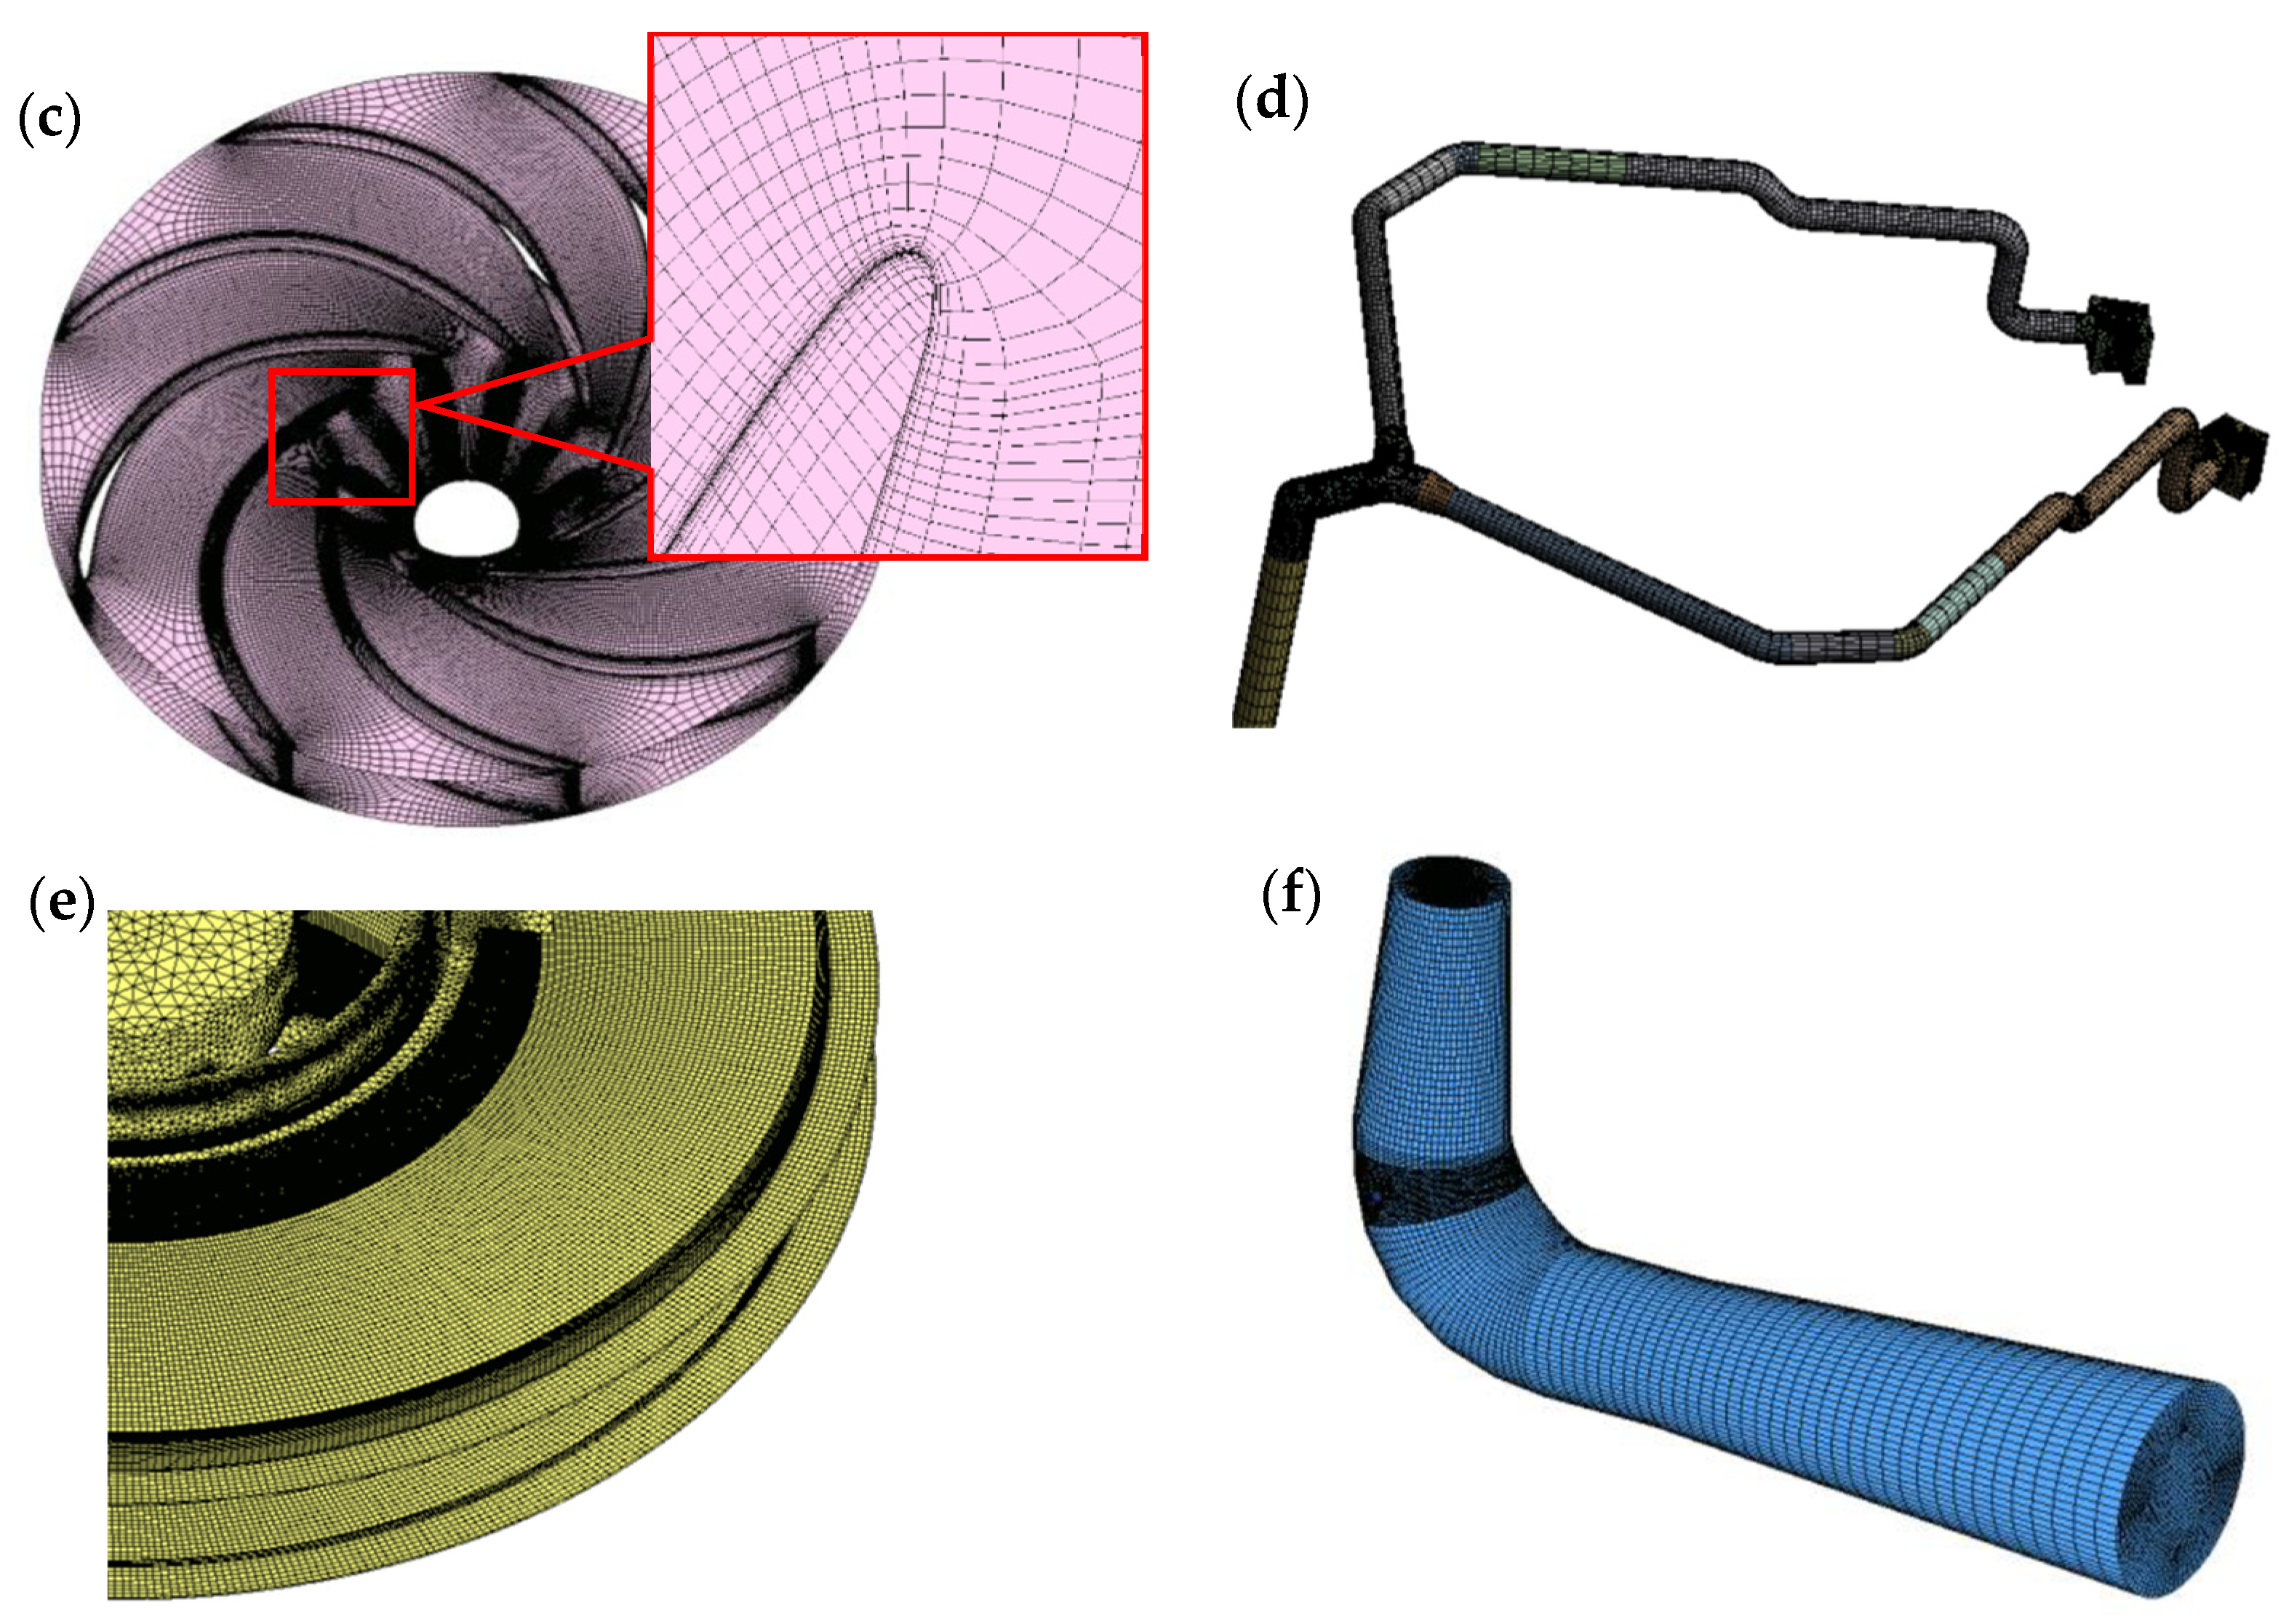
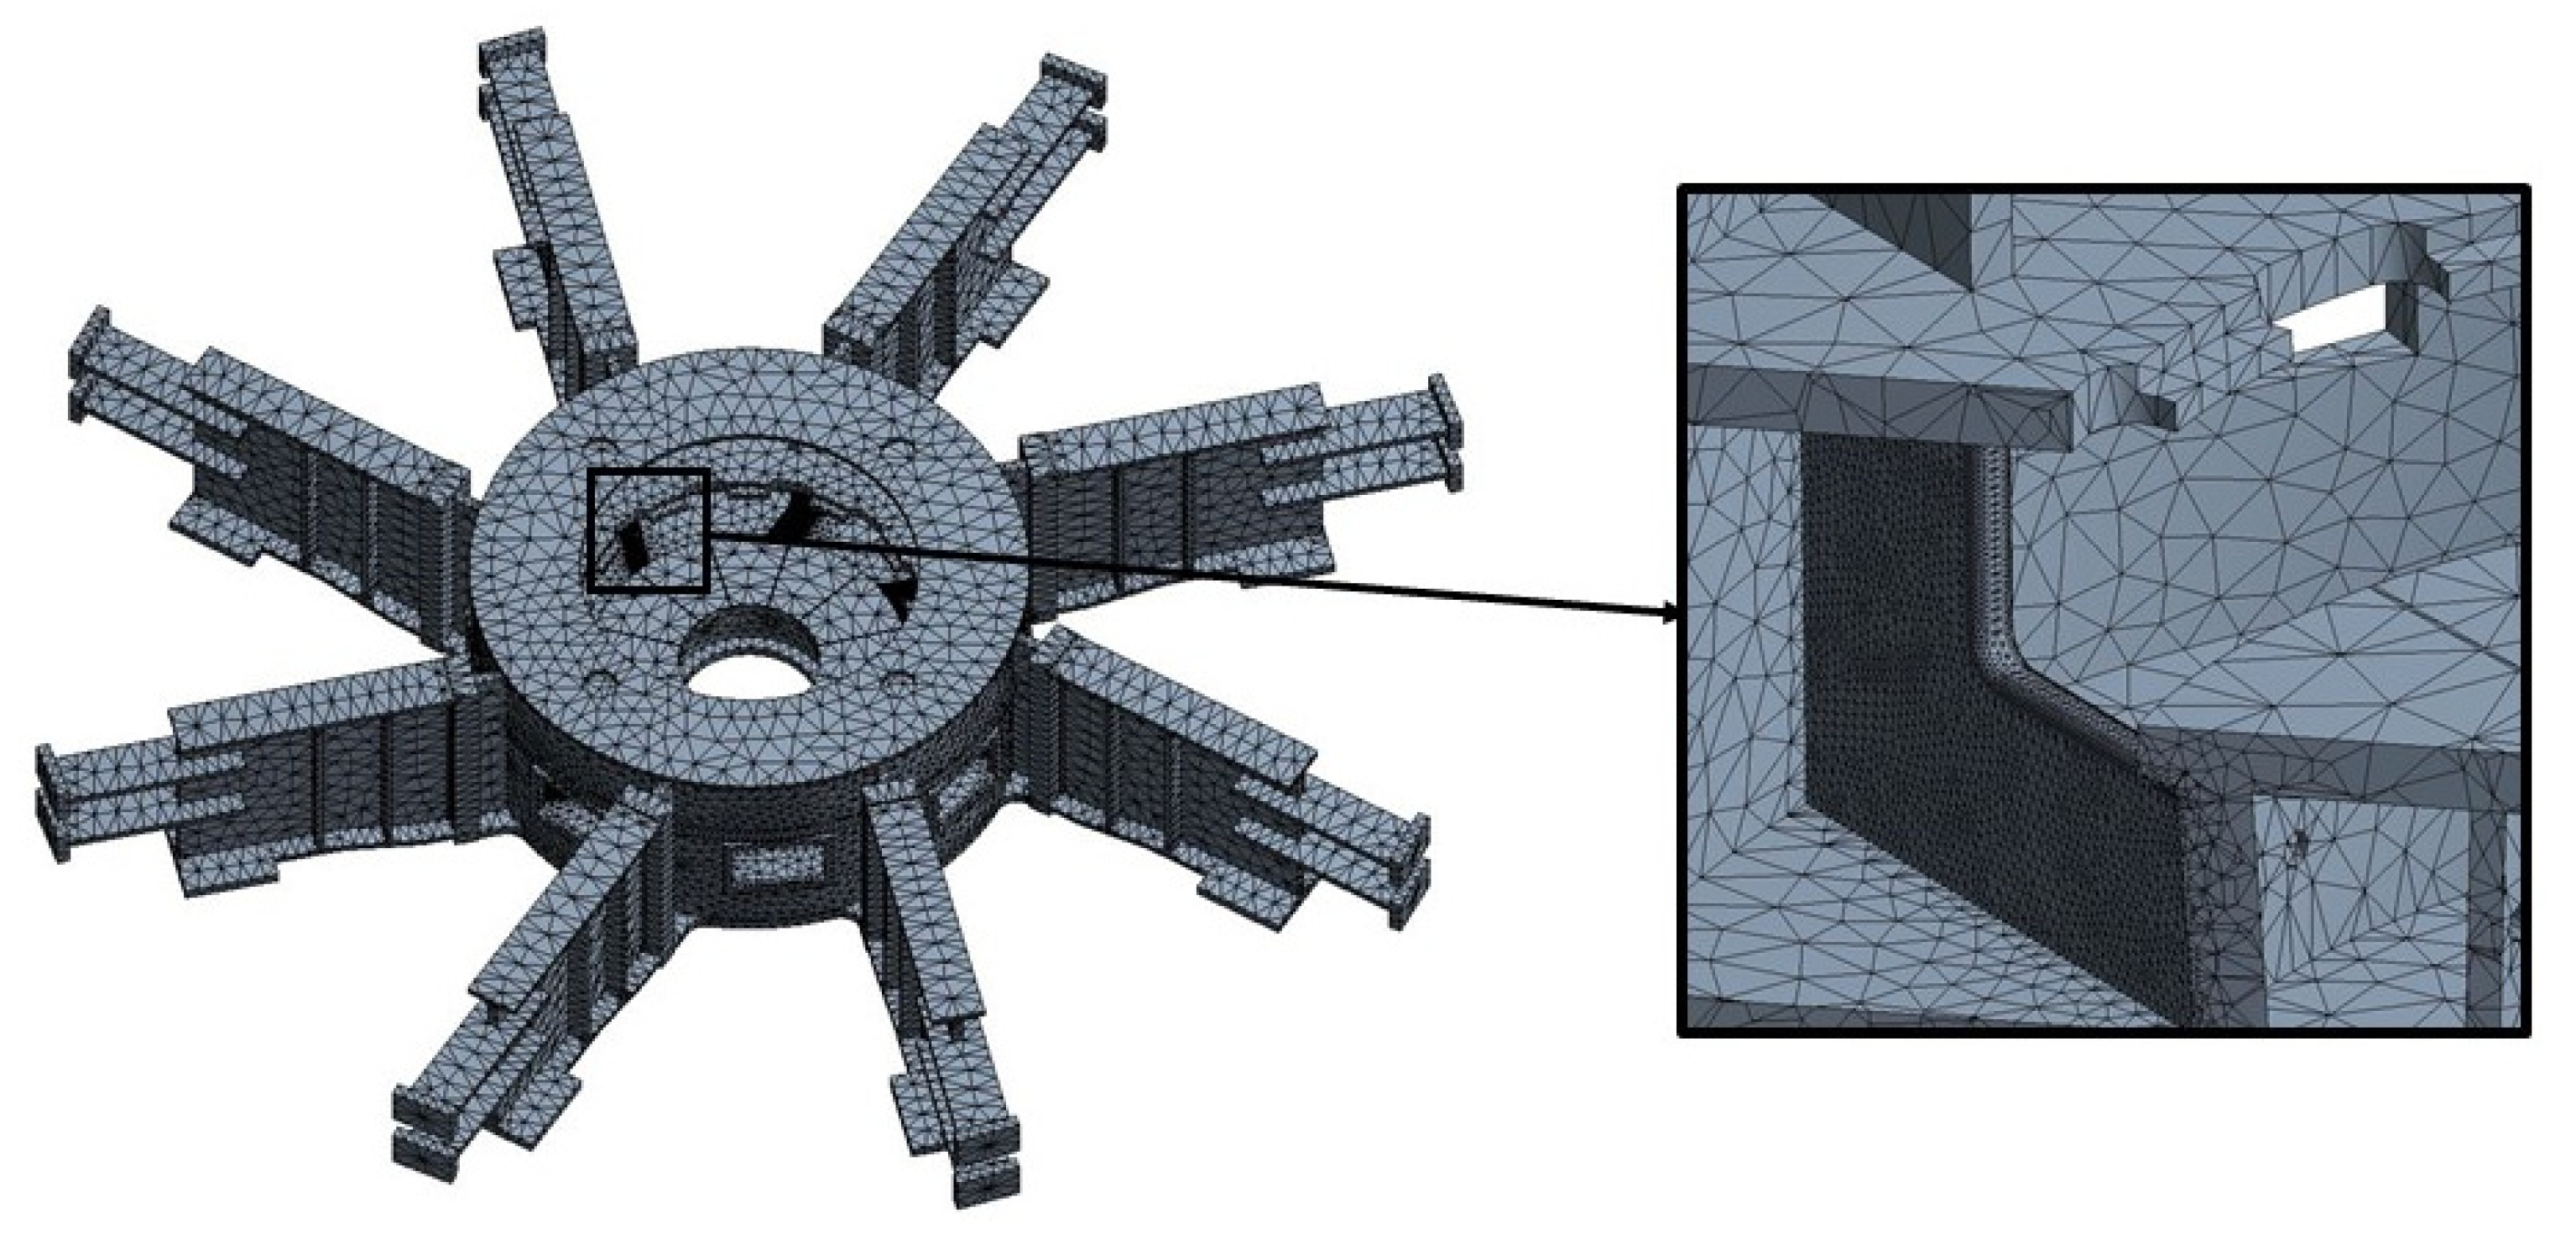
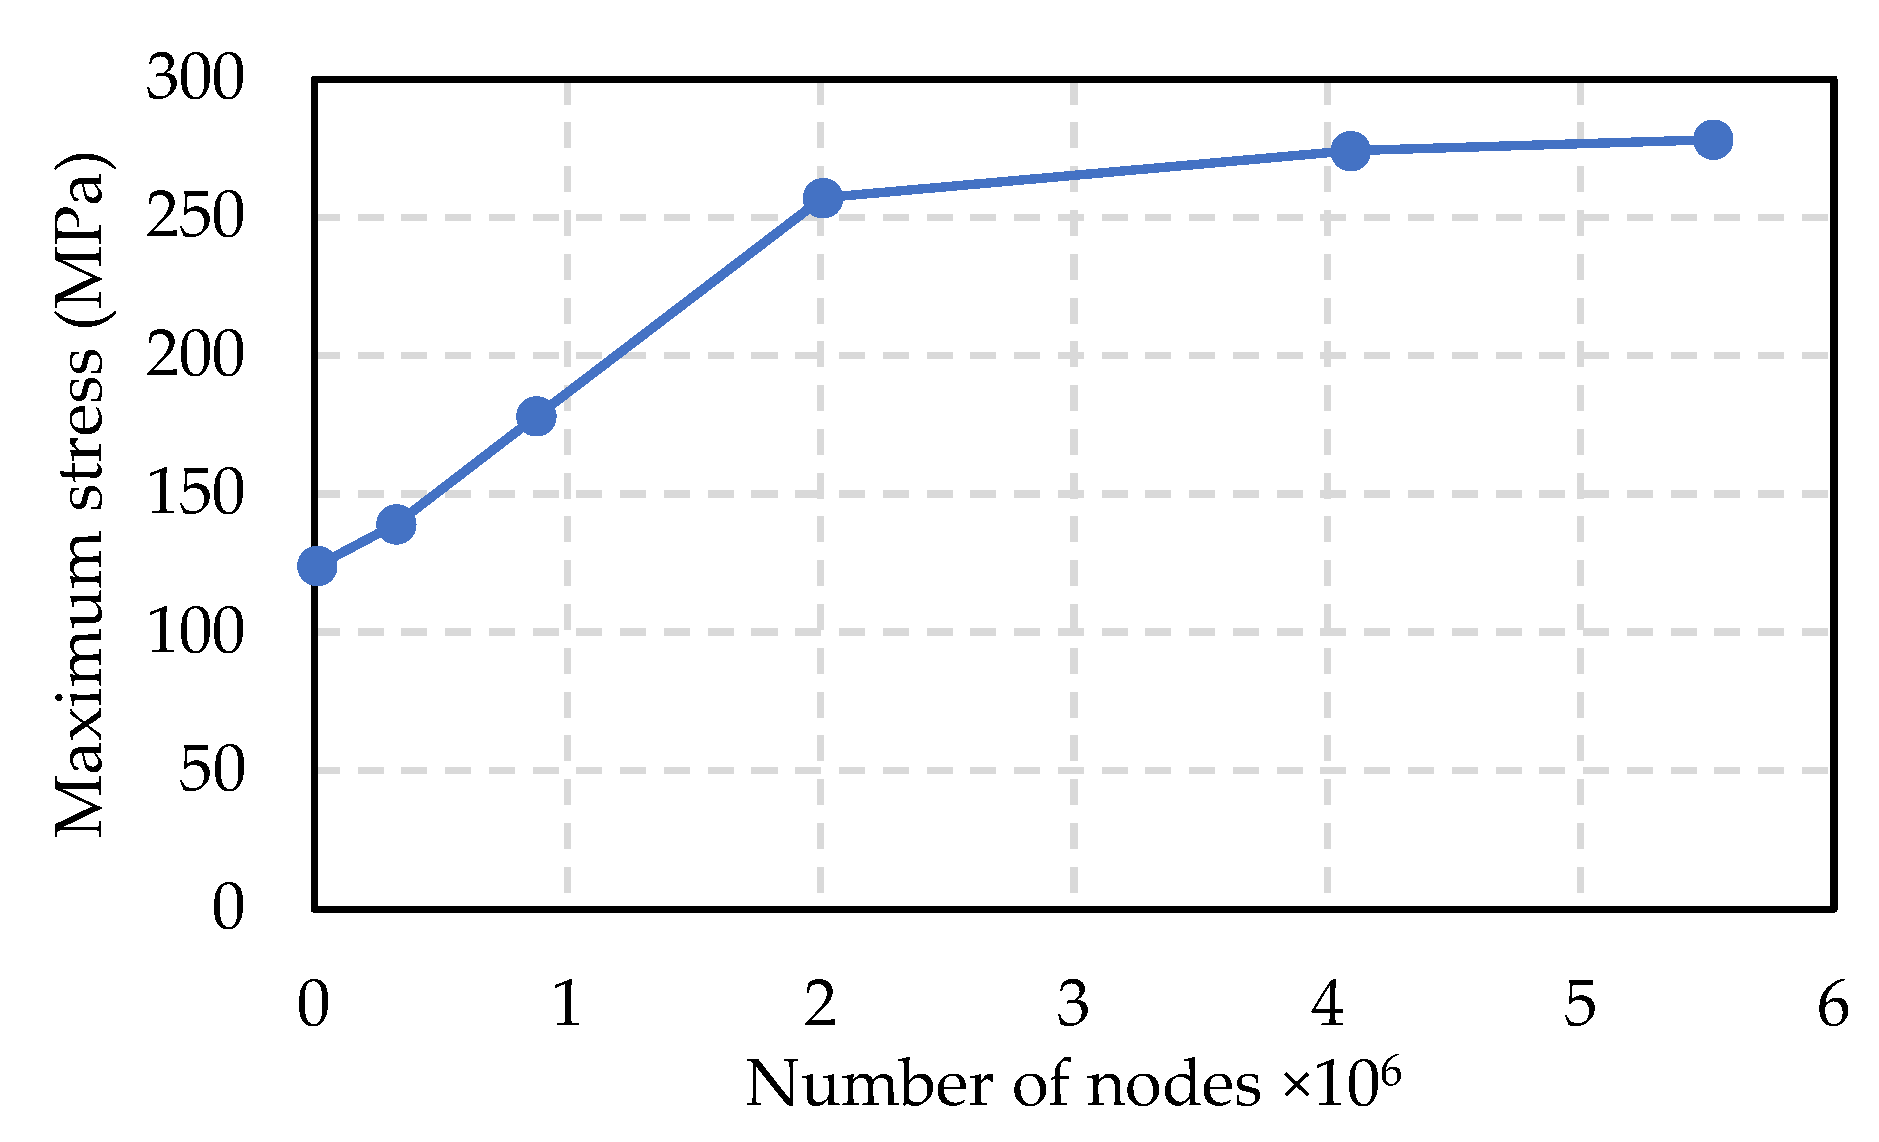
3.1.1. Mesh and Grid Checking

Before CFD simulation, the calculation domain needs to be meshed. Figure 2 left shows the calculation domain, including spiral casing, stay and guide vane, runner, and the draft tube. It is worth to be noticed that the PBPs are considered in the model giving the PBPs have a large influence on the axial force of hydraulic turbine units. The PBPs are introduced from the crown gap (after the seals) to the draft tube. With the pipe, the pressure of the crown gap can be decreased then the pressure difference between the upper and lower side of the runner could be reduced. The pipelines are arranged uniformly along the circumference. In our case, four pressure balance pipelines are set with an angle difference of 90°. In order to better analyze the hydraulic thrust force, different positions of the runner, including the blade suction side (BSS), blade pressure side (BPS), crown outside surface (COS), crown inside surface (CIS), band outside surface (BOS), and band inside surface (BIS) have been marked on the model (Figure 2 right). The axial force will be the resultant of the forces on all of these surfaces. In this study, the calculation domains of draft tube, runner and its seal and gap, guide vane, stay vane, spiral casing, and PBPs were separately meshed (Figure 3). The components are meshed by a structured/unstructured unit hybrid grid structure. Given the irregular structure in the spiral casing, both unstructured tetrahedral grid and structured boundary layer grid are used. Hexahedral structured mesh elements are used on the stay vanes and guide vanes and the boundary layer is divided around the blades. For the runner domain, the hexahedral structured grid is applied and the boundary layer grid is adjusted to make sure the y+ is between 20 to 300. Since the gap of the crown and band has a significant influence on the calculation of the axial force, the gap grid is particularly refined by hexahedral grid to save the storage space, improve computing and addressing capabilities, and enhance the storage space computational convergence.
In order to validate the numerical model, the energy characteristic curves are compared between the numerical simulation and the field test result. Figure 4 shows the variation of the guide vane opening Ca, head coefficient Cψ and efficiency η with the discharge coefficient Cφ. In the figures, the CFD simulation and the field test result are compared. From curve Ca vs. Cψ it can be seen that the variation of the simulated guide vane opening has a good agreement with the experimental result. As for the head coefficient Cψ and efficiency η, the variation trend is the same as the experiment. Since the CFD simulation has neglected the friction loss, the head coefficient, and the efficiency are slightly higher under the conditions with small discharge. The errors are within reasonable range so that the simulation result on the performance of the pump-turbine is accurate enough.
In addition, the simulated pressure under the rated pump condition was also compared with the field test. Five monitoring points have been selected as shown in Figure 5, which are the upper (P1) and lower (P2) vaneless space, crown (P3) and band (P4) gap before seal, and crown gap entrance (P5). Three conditions were used for the comparison. The inlet flow velocity is set according to the rated discharge and outlet static pressure is 1 atm. The guide vane opening coefficient Ca equals to 0.85. All of the above boundary conditions were configurated as same as the on-site measurement. The relative pressure coefficient Cp is compared for each position in Figure 6. From the figure, all of the errors between the CFD calculation and the experiment result are lower than 10% so that there is a good agreement between them. Therefore, it is reasonable to say that the mesh and the boundary configurations can accurately reflect the researched pump-turbine’s flow characteristics. The determined numbers of the nodes for each component are listed in Table 2.

3.1.2. Simulation Configuration

The commercial software CFX was used for the flow field analysis. Based on the fluid domain shown in Figure 2, the flow is calculated under pump conditions. The fluid flows from the draft tube and flows out from the spiral casing. Therefore, the boundary conditions are given as shown in Table 3:
The steady-state calculation is performed in the simulation, where SST k-ω is used. The maximum number of iterations is set as 600. The convergence criterion is that the residual error between the momentum equation and the continuity equation less than 1 × 10⁻⁵. The discrete format of the convective term of the momentum equation and the turbulent transport equation is set to high precision and first order.

3.1.3. Pressure Balance Pipeline Blockage Setting

In this research, the conditions of PBP blockage are simulated in order to investigate the changes on the stress of the support bracket. In order to simulate the blockage, the PBPs are removed from the hydraulic model. The simulation configurations are the same as Section 3.1.2.

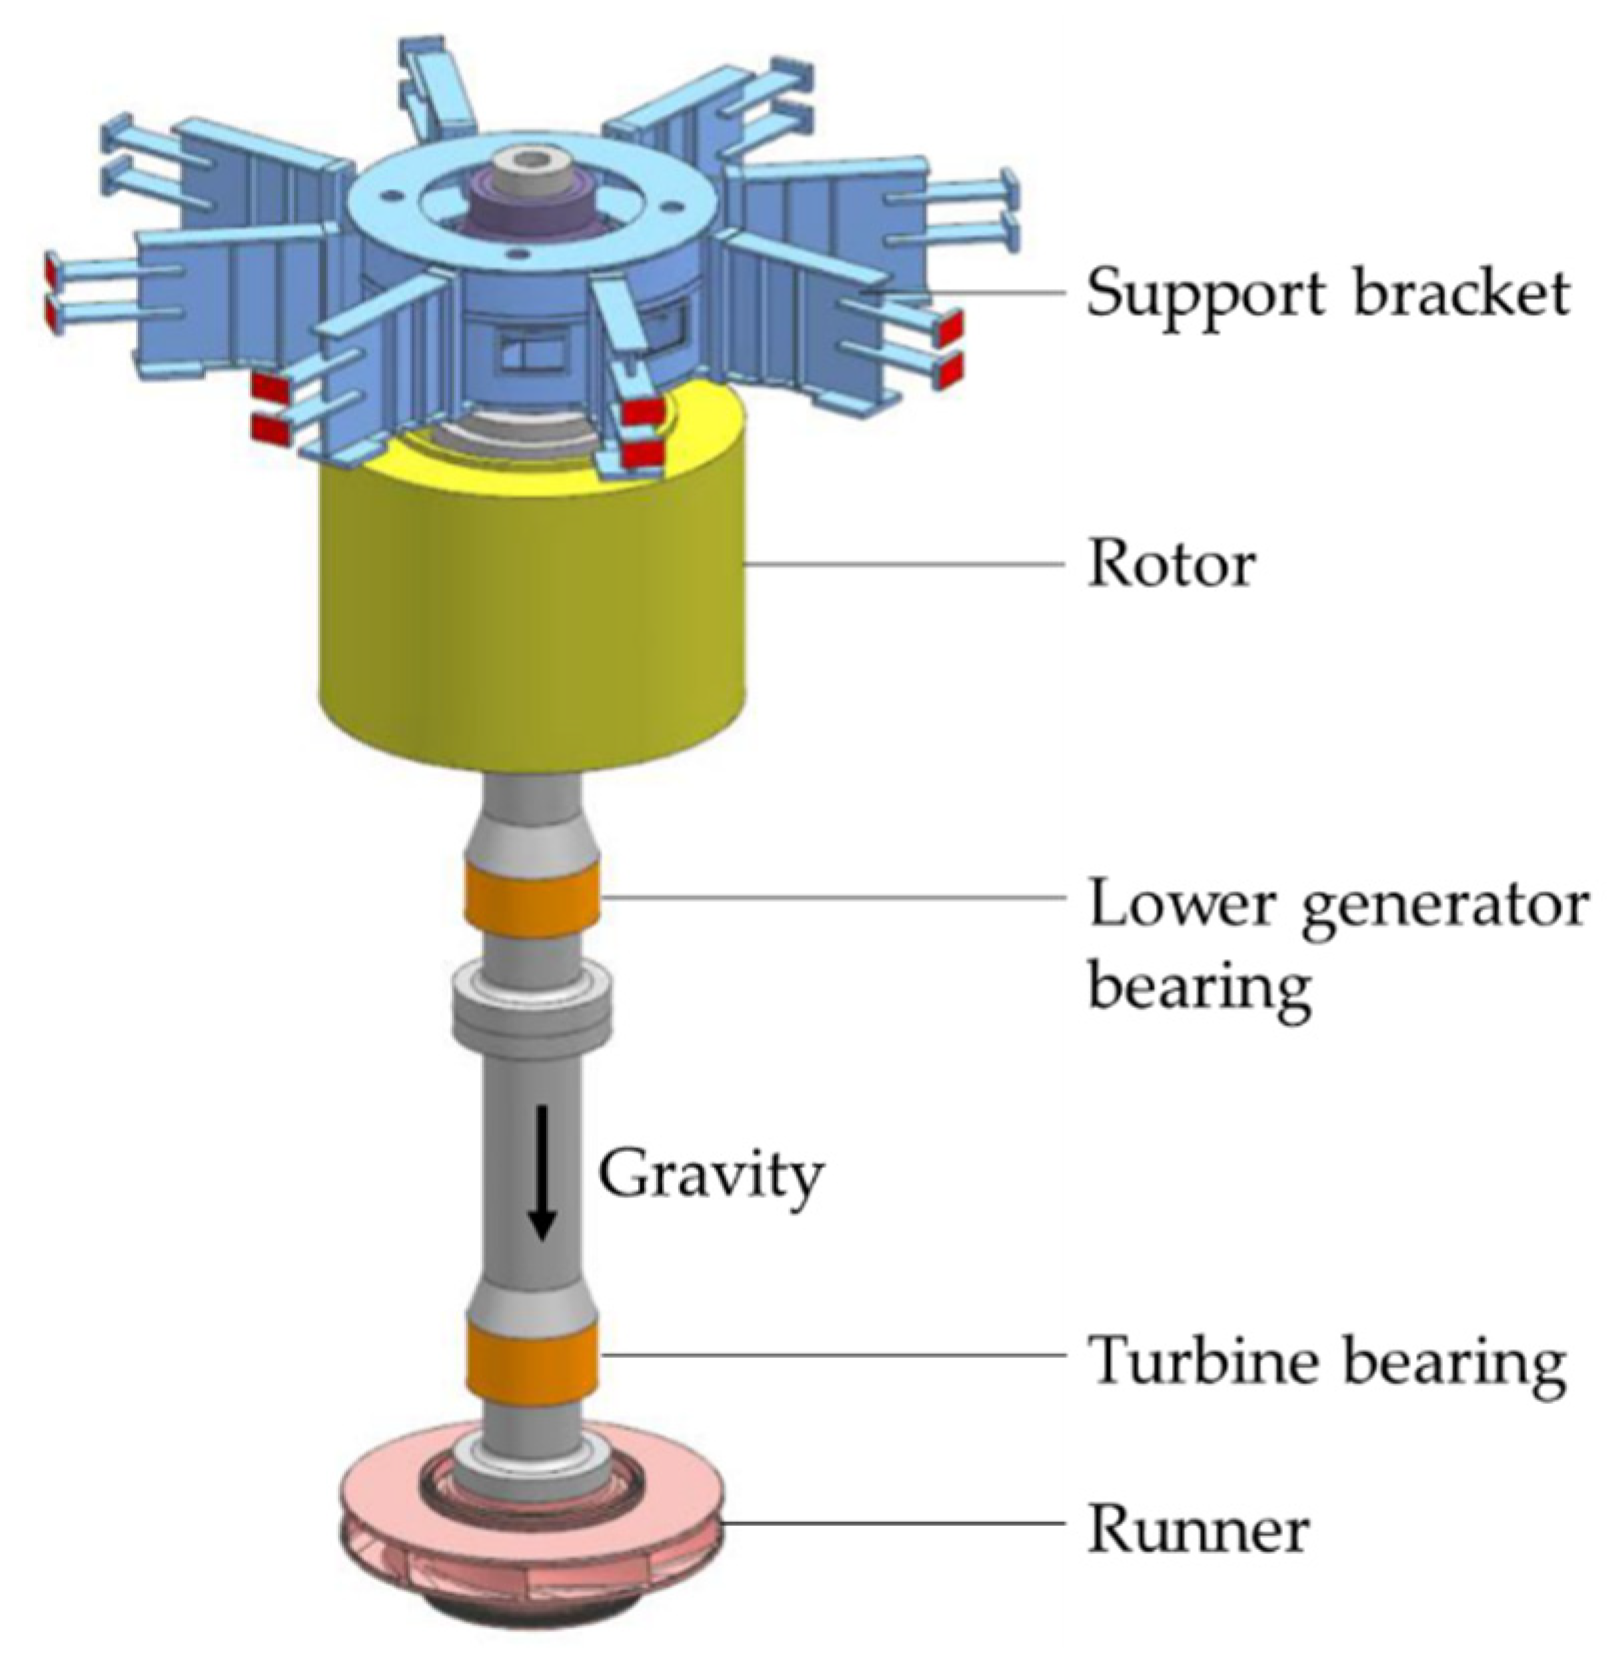
3.2. Support Bracket Stress Calculation

To evaluate the effect of different operating condition on the structure, the support bracket is modeled, and different axial forces have been applied to it. As shown in Figure 7, the diameter of the basic support part is 4 m while the diameter with eight supporting arms is 10 m. The end of eight arms were fixed by the concrete foundation and the bottom were connected with the generator stator. In the simulation, the end of supporting arms and the bottom were set as fixed support. In the pumped storage unit, the axial loads including the hydraulic thrust of runner flow and the weight of runner are loaded on the thrust bearing. In this study, the axial loads were set as a certain range value and loaded on the bushes of thrust bearing uniformly. The material of the structure is Q345 and the density is 7.75 × 10³ kg/m3. The Young’s modulus is 2.1 × 10¹¹ Pa. The Poisson’s ratio is 0.3.
Tetrahedral meshes were used for the structure model meshing shown in Figure 8. Since stress concentrations often occur at the corner of support plates, the fillets of the plates were modeled accurately. The mesh at these sensitive areas was refined to avoid stress concentrations due to the mesh. Mesh independence check has been performed on the bracket. Figure 9 shows the variation of the maximum stress on the structure changing with the number of the nodes of the mesh. It can be seen that when the number of the nodes is 0.55 million, the changing rate is lower than 2%. Finally, there are 0.55 million nodes and 0.3 million elements in the meshes used in this study.

4. Results

4.1. Axial Forces under Different Operating Conditions

The variation of the axial force coefficient Cfz of the unit with the discharge coefficient Cφ predicted by CFD is shown in Figure 10. The axial force coefficient Cfz is defined according to Equation (14):
C f z = F z G s
where, Fz is the calculated axial force, Gs is the weight of the shaft system. In Figure 10, the positive value means the upward axial force applied on the runner. Based on the figure, it can be seen that basically the value of the upward axial force on the runner decreases from 0.17 Gs to 0.06 Gs with the increase of the flow rate. This is caused by the leakage in the gap of the crown, which leads to the increase of the downward force on the runner. When the discharge is large, the pressure in the draft tube decreases dramatically. Due to the connection of the PBPs, the pressure in the crown gap decreases. Therefore, the upward force raised significantly to 0.17 Gs. The upward force would compensate with the self-weight of the shaft system so that the downward axial force applies on the bracket would be decreased, which avoids the risk of deformation of the frame. Meanwhile, the range of the upward force is lower than 0.2 Gs, which is not so large to lift the machine.

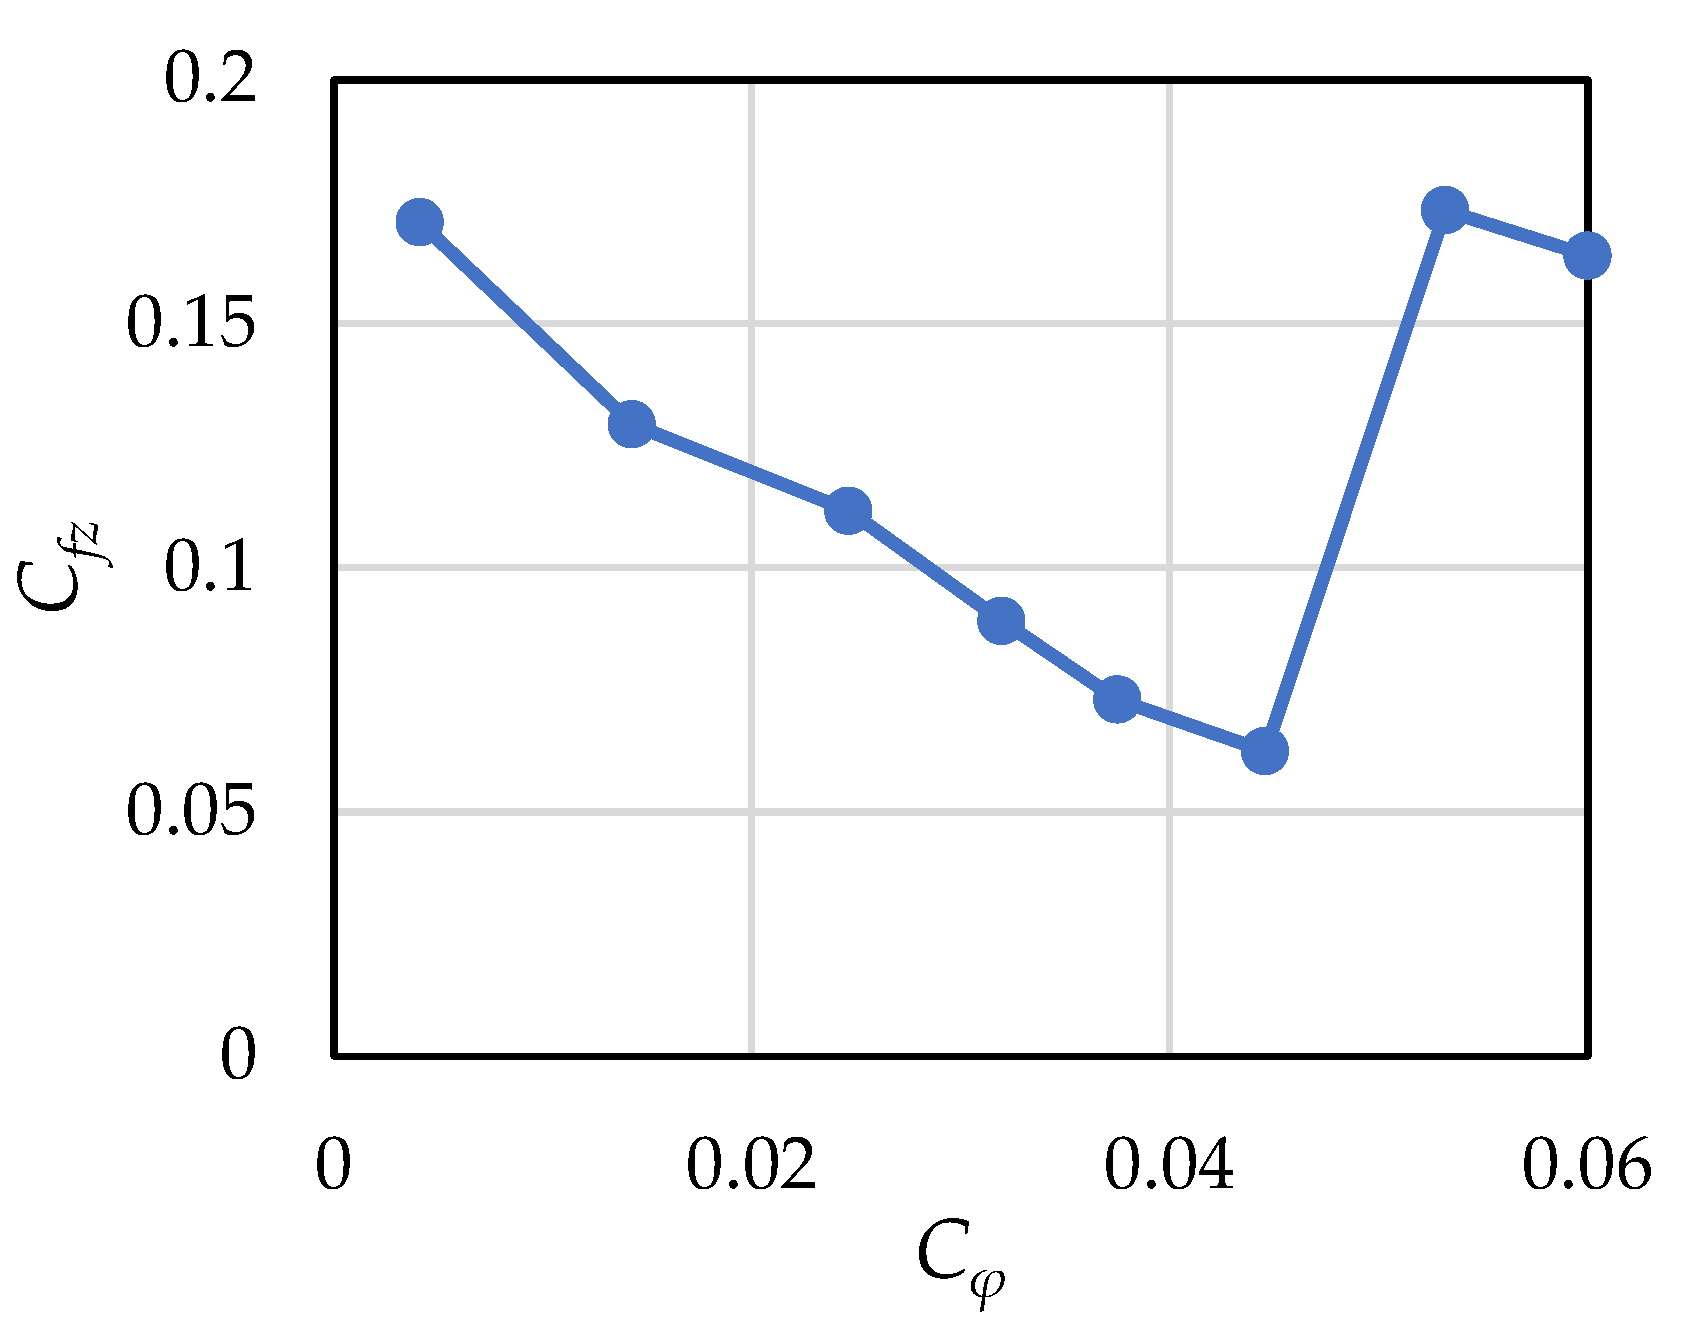
4.2. Axial Force with Pressure Balance Pipelines

The axial force characteristics of the runner with blocked PBPs are predicted and compared with the scheme with PBPs. The results are shown in Figure 11. It can be seen from the figure that after the pressure balance pipelines are blocked, the axial force becomes downward. Together the gravity of the shaft system, the downward force applies on the support bracket would be larger and the stress raised.

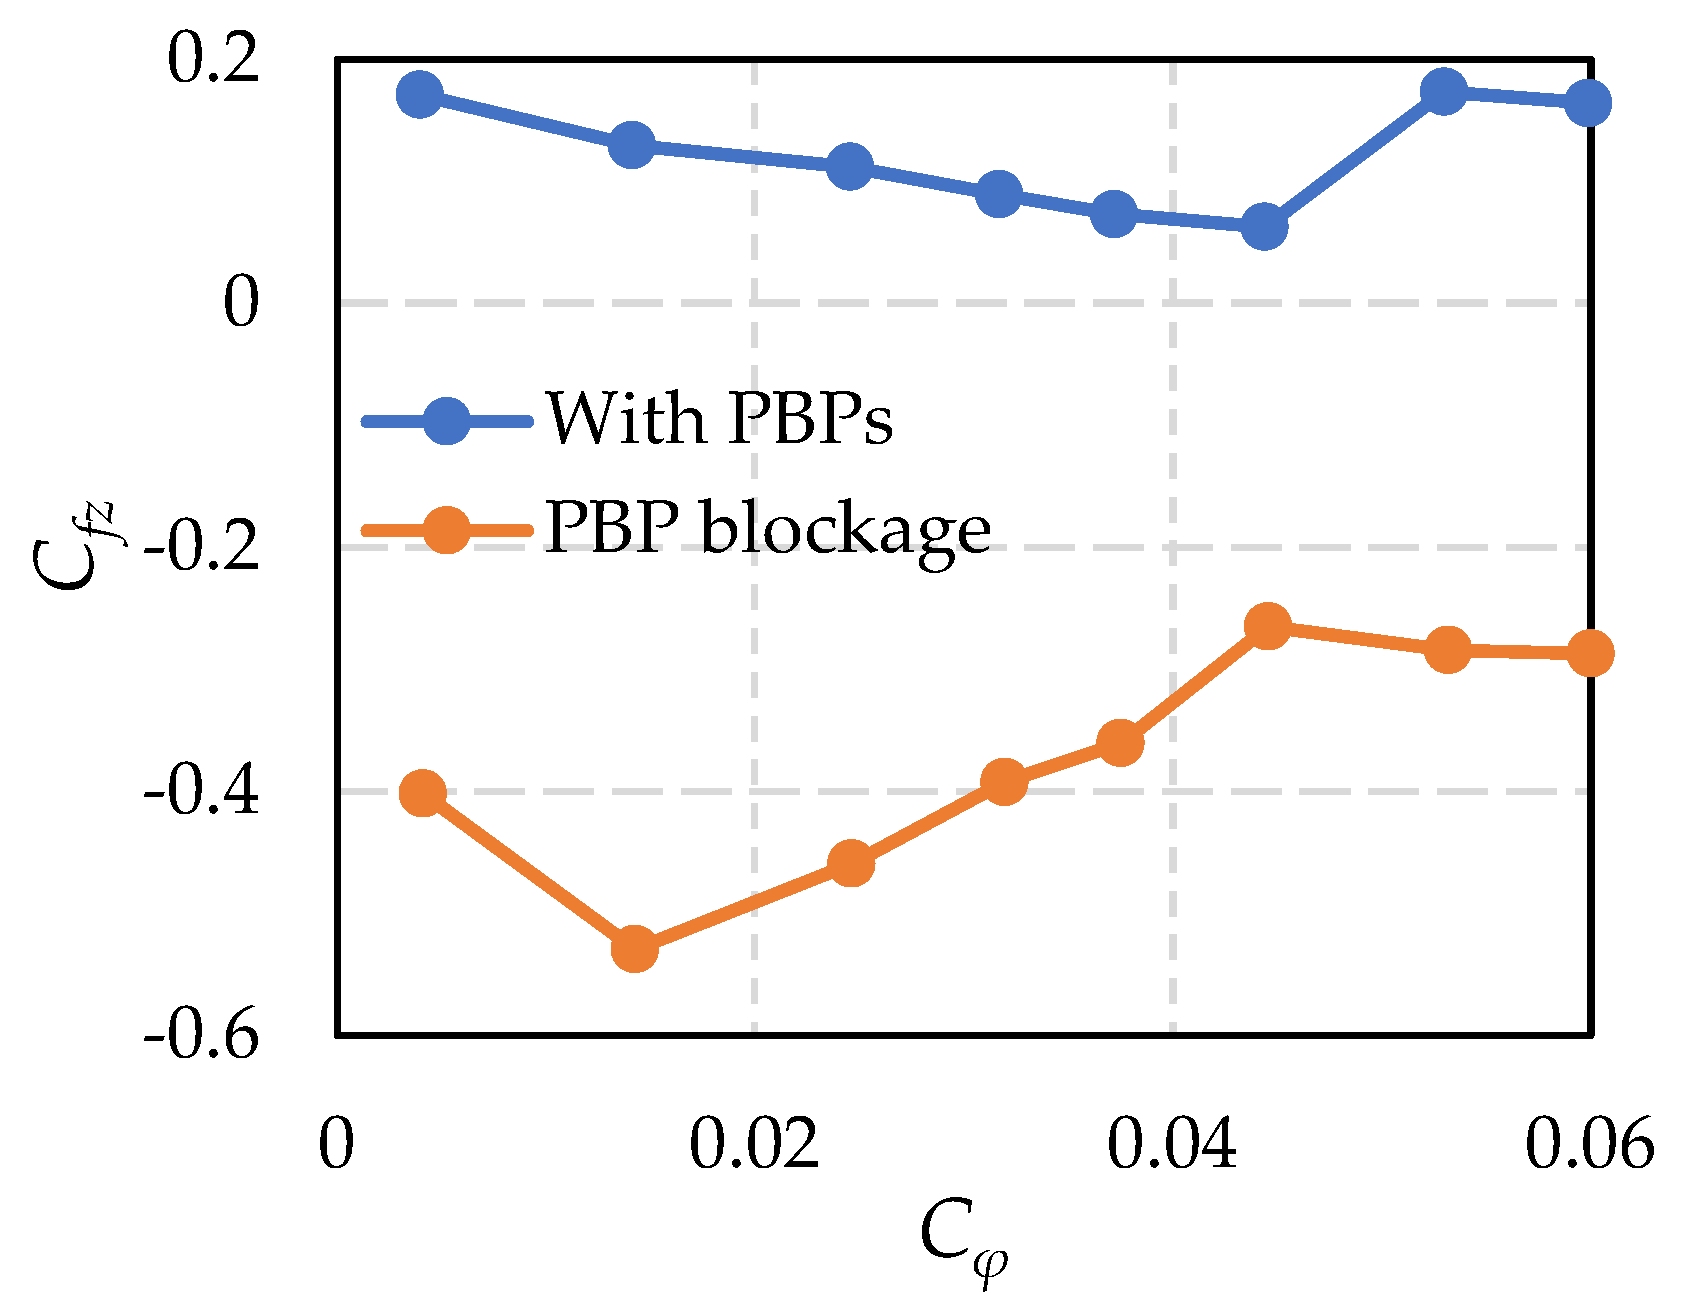
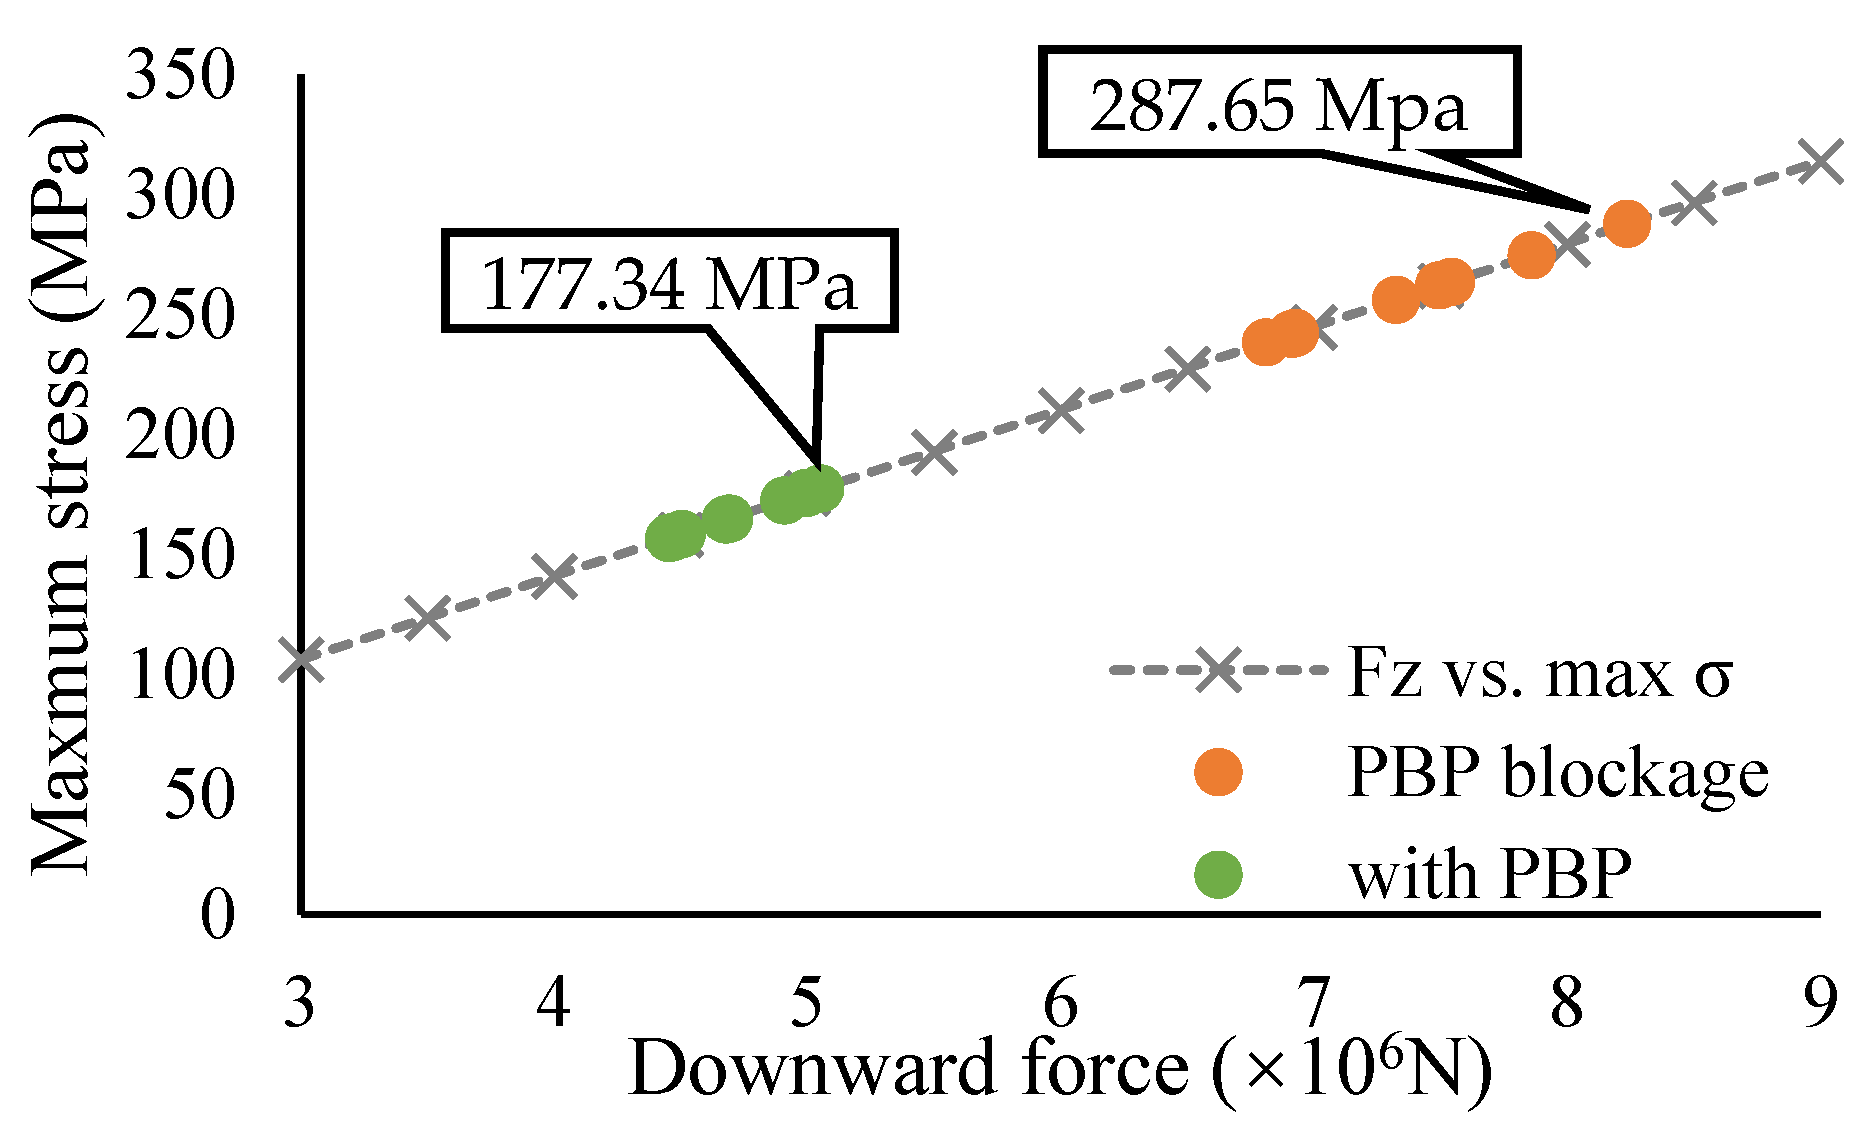
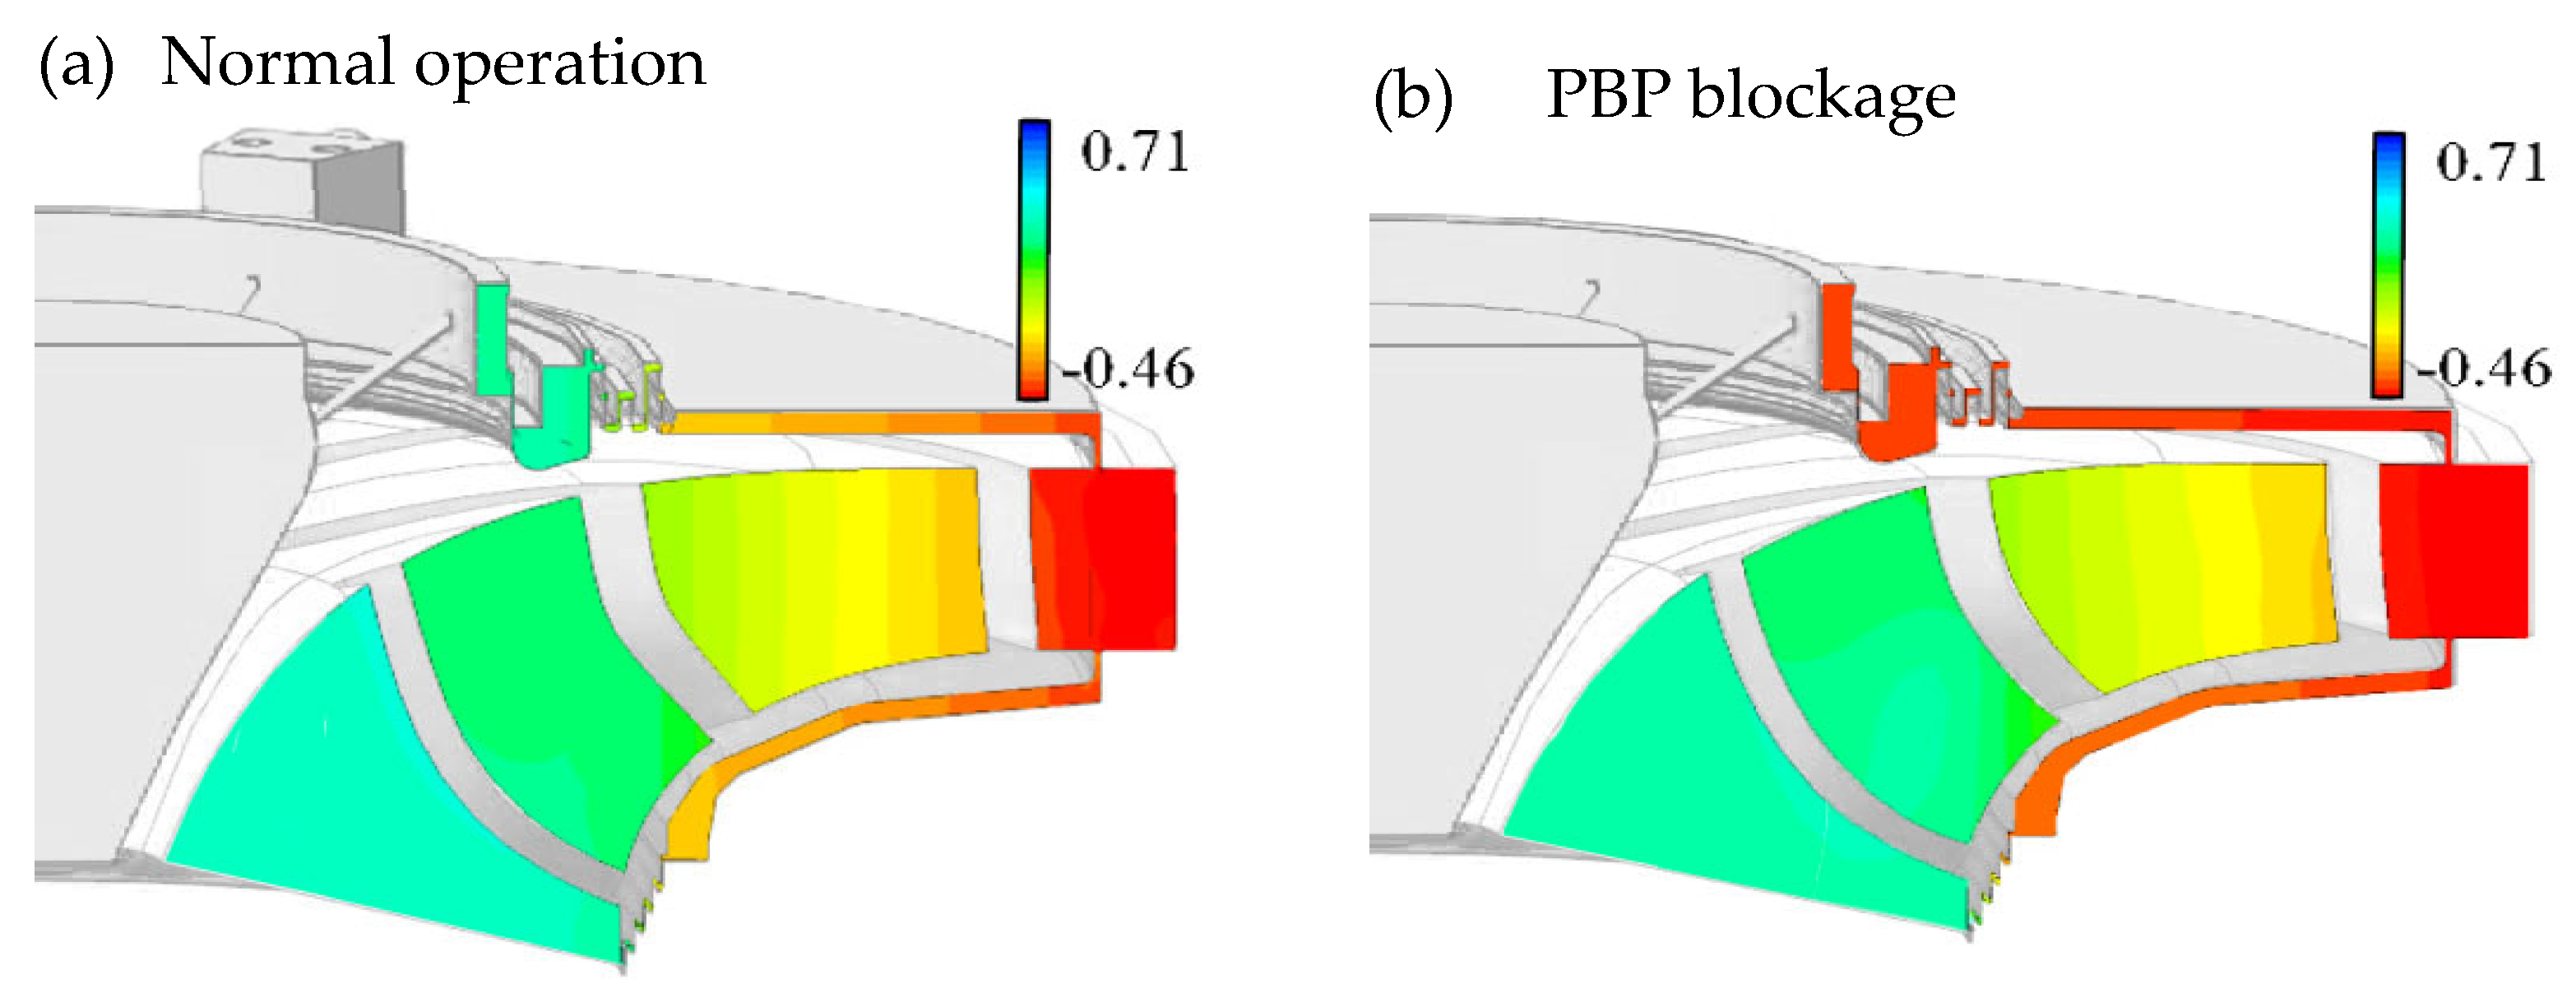
4.3. Effect of PBP Blockage on the Support Bracket

The downward axial force includes the axial force applied on the runner and the gravity of the shaft system. Different axial forces on the runner, as well as the gravity of the whole shaft are applied on the bracket. Using on the FEM in Workbench, the stresses of support bracket with axial load on thrust bearing bushes were calculated. As shown in Figure 12, the maximum stress concentrates on the corner of support plates. The variation of the maximum equivalent stress with different axial force loaded on thrust bearing is shown in Figure 13. The results indicate that the maximum equivalent stress changed linearly with the axial force. From the figure it can be seen clearly that the blockage has increased the maximum stress on the bracket significantly. The maximum stress is 177.34 MPa with PBPs and 287.65 MPa with the PBP blocked. The blockage of PBP has increased 62.20% of the maximum stress on the support bracket.

5. Discussion

The causes of the axial force on the runner will be analyzed here. The meridional map of runner, including the crown and band gap, is shown in Figure 14. The reason for the axial force on the runner is relatively complicated. The main causes come from the pressure difference between the crown gap and the runner, and the pressure difference between the band gap and the runner. From the division #1 and #2 in the figure, it can be seen that in division #1, the pressure of the crown gap is pc1, the pressure of the adjacent position of the runner is pc2, the pressure of the band gap is ps1, and the pressure of the adjacent position of the runner is ps2. Usually, pc1ps1 and pc2ps2. Therefore, pc1pc2ps1ps2, that is, the axial force of the runner in the division #1 is balanced. On the contrary, in division #2, the pressure pc3 in the crown gap and the pressure pc4 adjacent to the runner are difficult to balance, causing the runner to receive upward or downward axial force.
Under pump condition, the lower the discharge is, the larger the head is, as well as the outlet pressure of the runner. At this moment, the guide vane opening is small, which confines the high-pressure fluid in the runner side. The high pressure in the crown gap makes pc3 >> pc4, which increases the down-ward axial force. While for the large discharge condition, the guide vane opening is so large that the pressure difference between pc3 and pc4 is small. At this time, the main factor that influence the axial force is the discharge in the flow passage of the runner. With the raising of the velocity of the water, the pressure on ps2 have to increase, which forms downward force applied on the runner.
In order to analyze the mechanism of the variation of the axial force caused by the PBP blockage, the pressure distribution (Cp) in the fluid domain is compared under the operating condition Cφ = 0.032. From Figure 15 it can be seen that with the PBPs, the pressure in the upper crown gap is relatively low. Under this condition, the axial force is slightly upward. On the contrary, with the pressure balance pipeline blockage, the pressure in the crown gap, especially in the region after the seal, is increased. This high pressure forms a downward axial force on the runner. Therefore, the PBP blockage can significantly increase the downward axial force of the runner.
The computational fluid dynamics method in this research has considered the gap between the upper crown and the lower ring of the runner, which can effectively predict the axial force characteristics of the runner and provide a theoretical basis for the safe and stable operation of the pump-turbine unit. Gap modeling will increase the computational cost, but it provides a solution to the problem of axial force.
The CFD and FEM analysis on the turbine unit shows the maximum stresses are 177.34 MPa with PBPs and 287.65 MPa with blocked PBPs, respectively. When the PBPs are blocked, the sum of maximum static stress and dynamic stress could exceed the allowable stress of the material of the support bracket. Besides, according to the Linear Elastic Fracture Mechanics, the mean stress has a great influence on the accumulative damage of the material. This low amplitude stress will contribute to the High Cycle Fatigue, which lead to a rapid propagation of the crack [34]. Therefore, the blockage of PBP would be dangerous for the safety of the support bracket.

6. Conclusions

In this investigation, the influence of different operating conditions on the support bracket stress has been investigated by CFD and FEM. The mechanism of axial force in pump-turbine is revealed. Moreover, the effect of PBP blockage has been investigated. The main results are:
  • The CFD simulation revealed that the axial force in pump mode of pump-turbines is mainly caused by the pressure imbalance between the upper and lower gaps and the runner.
  • The blockage of pressure balance pipelines increased the pressure difference between the crown gap and the flow passage of the runner. The blockage caused the upward axial force downward, which increases the axial force imposed on the bracket.
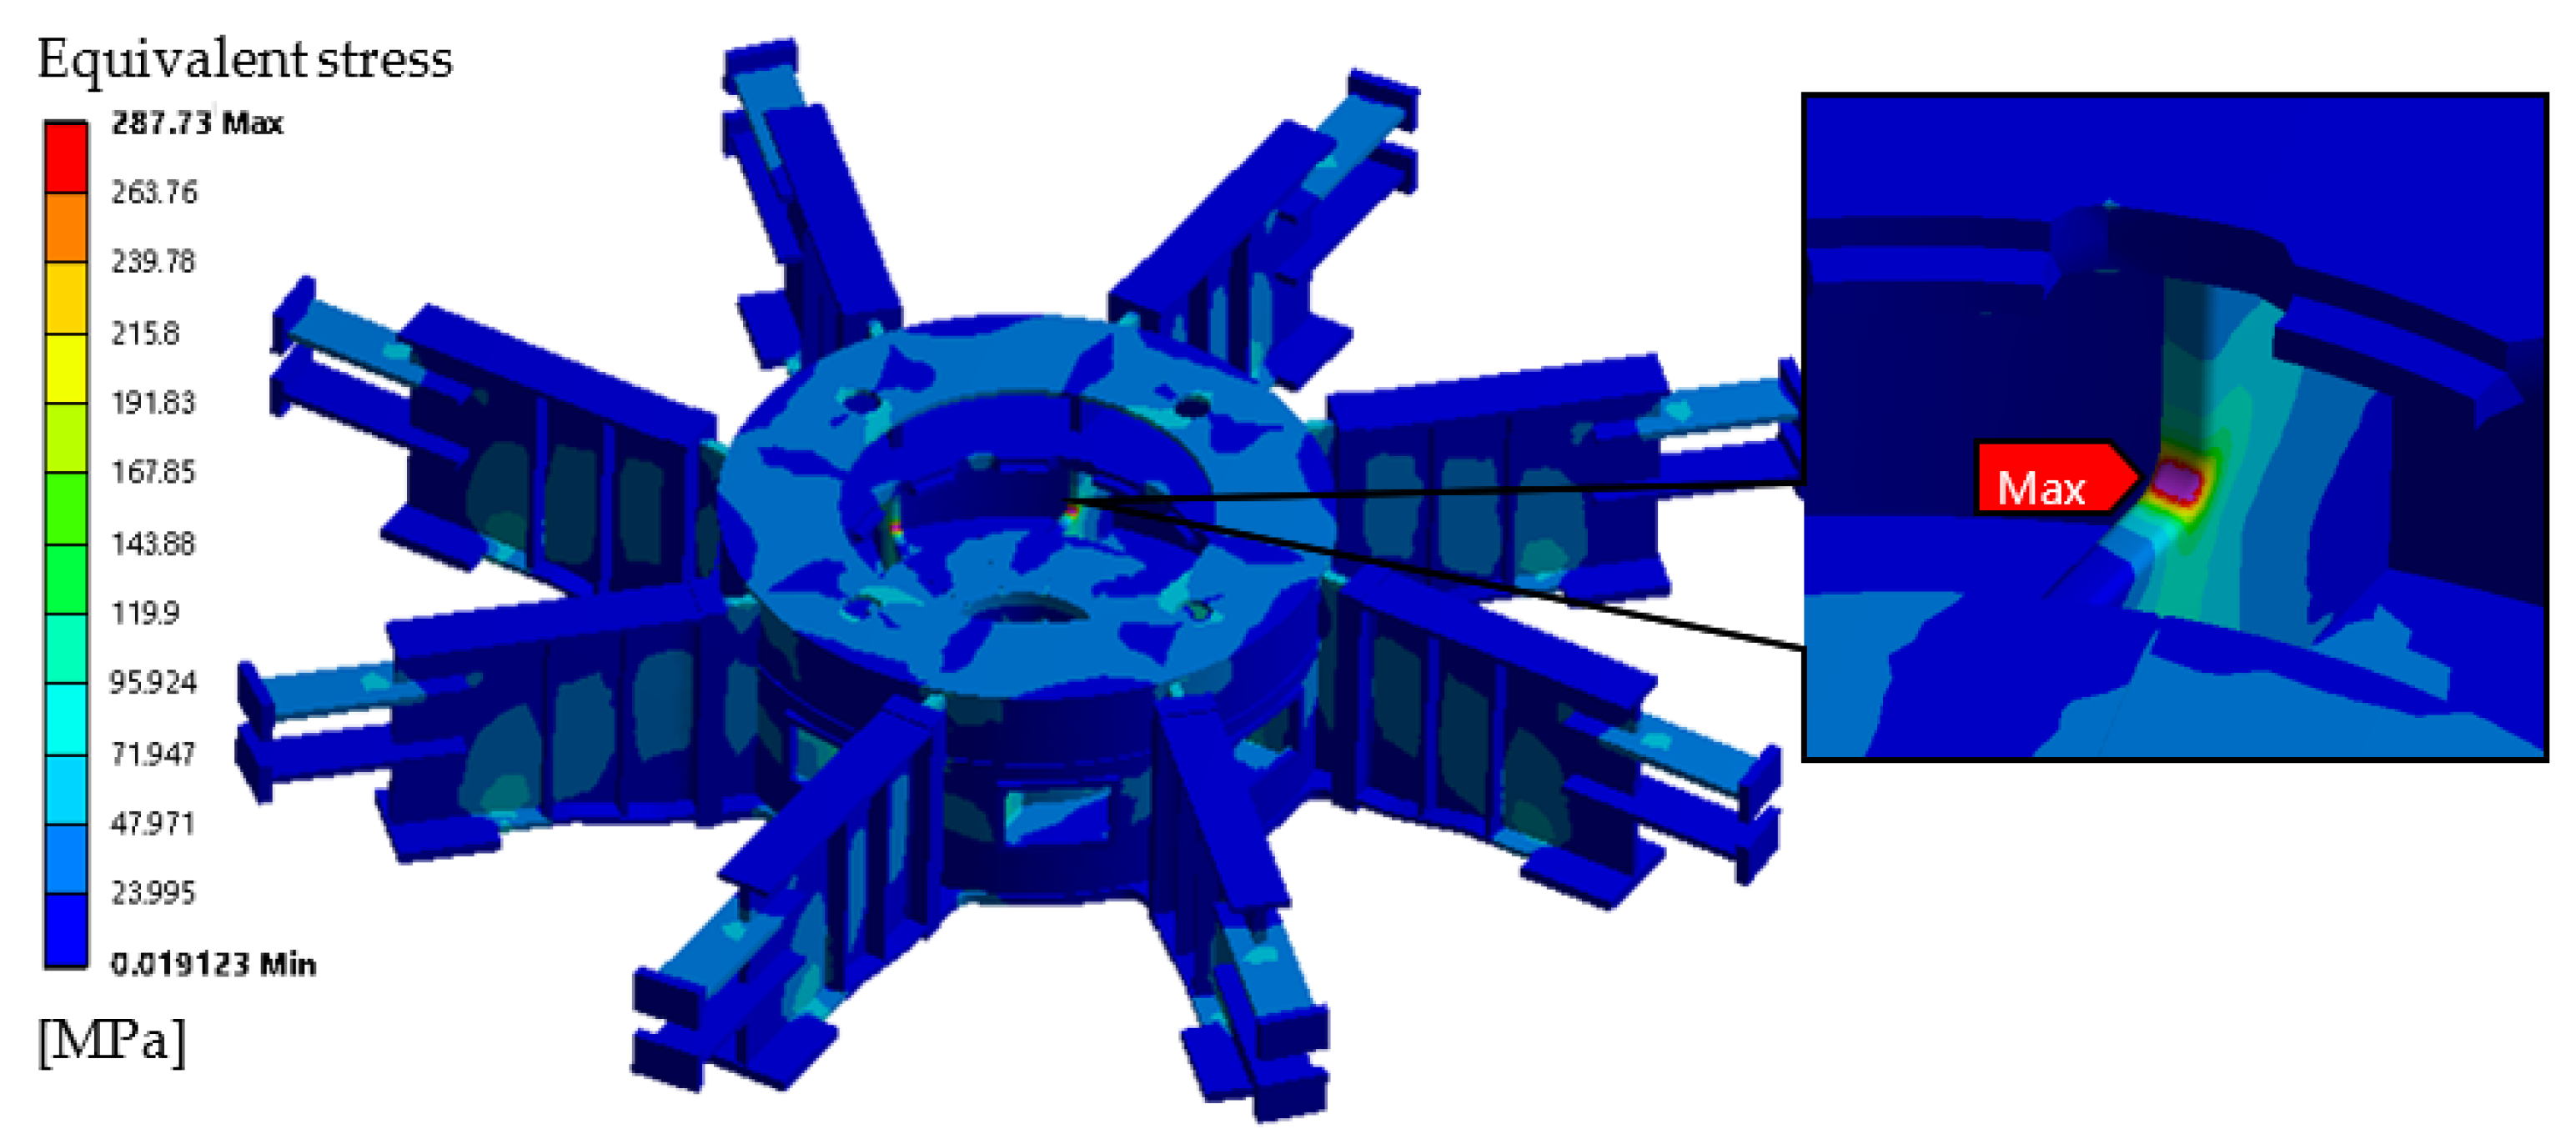
  • The maximum stresses often concentrate on the corner of support plates. Once there’s a blockage in the PBPs, the maximum stress on the support bracket would increase 62.20%, which causes risk to the operation safety of the support bracket.

Author Contributions

Conceptualization, B.X.; methodology, W.Z.; software, W.L.; validation, R.T.; investigation, W.Z.; resources, B.X.; data curation, W.L.; writing—original draft preparation, Z.M. and W.Z.; writing—review and editing, W.Z.; visualization, Z.M.; supervision, Zhengwei Wang; project administration, Z.W.; funding acquisition, B.X. All authors have read and agreed to the published version of the manuscript.

Funding

This research was funded by National Natural Science Foundation of China (No.: 51876099).

Institutional Review Board Statement

Not applicable.

Informed Consent Statement

Not applicable.

Data Availability Statement

Not applicable.

Acknowledgments

Thanks for the test data provided by relevant units and the support of National Natural Science Foundation of China (No.: 51876099).

Conflicts of Interest

The authors declare no conflict of interest.

Nomenclature

CaDimensionless guide vane opening
CψHead coefficient, flow rate coefficient
CφFlow rate coefficient
CpRelative pressure
CfzAxial force coefficient
GsWeight of the shaft system
hrRated head
Angular velocity of the runner
FzAxial force

References

  1. Zhao, W.; Egusquiza, M.; Valero, C.; Valentín, D.; Presas, A.; Egusquiza, E. On the Use of Artificial Neural Networks for Condition Monitoring of Pump-Turbines with Extended Operation. Measurement 2020, 163, 107952. [Google Scholar] [CrossRef]
  2. Rehman, S.; Al-Hadhrami, L.M.; Alam, M.M. Pumped Hydro Energy Storage System: A Technological Review. Renew. Sustain. Energy Rev. 2015, 44, 586–598. [Google Scholar] [CrossRef]
  3. International Energy Agency. World Energy Outlook 2020; International Energy Agency: Paris, France, 2020. [Google Scholar]
  4. International Energy Agency. Global Energy Review 2020; International Energy Agency: Paris, France, 2020. [Google Scholar]
  5. Valero, C.; Egusquiza, M.; Egusquiza, E.; Presas, A.; Valentin, D.; Bossio, M. Extension of Operating Range in Pump-Turbines. Influence of Head and Load. Energies 2017, 10, 2178. [Google Scholar] [CrossRef] [Green Version]
  6. Zhang, Y.; Zhang, Y.; Wu, Y. A Review of Rotating Stall in Reversible Pump Turbine. Proc. Inst. Mech. Eng. Part C J. Mech. Eng. Sci. 2017, 231, 1181–1204. [Google Scholar] [CrossRef] [Green Version]
  7. Wan, L.; Wang, W.; Gao, H.; Gong, R.; Qian, Z. Numerical Research of Axial Hydraulic Thrust of Runner in Baihetan Hydropower Station. China Rural. Water Hydropower 2014, 12, 161–164. [Google Scholar]
  8. Wang, Q.; Ma, H.; Cao, S.; Chen, B. Structure Optimal Design of Electromagnetic Levitation Load Reduction Device for Hydroturbine Generator Set. Math. Probl. Eng. 2015, 2015, 814084. [Google Scholar] [CrossRef]
  9. Iliev, H. Failure Analysis of Hydro-Generator Thrust Bearing. Wear 1999, 225, 913–917. [Google Scholar] [CrossRef]
  10. Liu, D.Y.; You, G.H.; Wang, F.; Zhang, J. Calculation and Analysis of Axial Thrust Acting on Turning Wheel of Flow-Mixing Reversible Hydraulic Turbines. J. Hohai Univ. (Nat. Sci.) 2004, 557–561. [Google Scholar]
  11. Fořt, I.; Seichter, P.; Pešl, L. Axial Thrust of Axial Flow Impellers. Chem. Eng. Res. Des. 2013, 91, 789–794. [Google Scholar] [CrossRef]
  12. Norton, T.; Sun, D.-W. Computational Fluid Dynamics (CFD)–an Effective and Efficient Design and Analysis Tool for the Food Industry: A Review. Trends Food Sci. Technol. 2006, 17, 600–620. [Google Scholar] [CrossRef]
  13. Tao, R.; Xiao, R.; Liu, W. Investigation of the Flow Characteristics in a Main Nuclear Power Plant Pump with Eccentric Impeller. Nucl. Eng. Des. 2018, 327, 70–81. [Google Scholar] [CrossRef]
  14. Anderson, D.; Tannehill, J.C.; Pletcher, R.H. Computational Fluid Mechanics and Heat Transfer; Taylor & Francis: Oxford, UK, 2016; ISBN 1466578300. [Google Scholar]
  15. Catapano, F.; Costa, M.; Marseglia, G.; Sementa, P.; Sorge, U.; Vaglieco, B.M. An Experimental and Numerical Investigation of GDI Spray Impact over Walls at Different Temperatures. In Proceedings of the SAE 2016 World Congress and Exhibition, Detroit, MI, USA, 12–14 April 2016. [Google Scholar]
  16. Costa, M.; Sementa, P.; Sorge, U.; Catapano, F.; Marseglia, G.; Vaglieco, B.M. Split Injection in a GDI Engine under Knock Conditions: An Experimental and Numerical Investigation. In Proceedings of the 12th International Conference on Engines & Vehicles, Capri Napoli, Italy, 13–17 September 2015. [Google Scholar]
  17. Li, X.; Mao, Z.; Lin, W.; Bi, H.; Tao, R.; Wang, Z. Prediction and Analysis of the Axial Force of Pump-Turbine during Load-Rejection Process. In Proceedings of the IOP Conference Series: Earth and Environmental Science, Changchun, China, 21–23 August 2020; Volume 440, p. 052081. [Google Scholar]
  18. Li, J.; Zhang, Y.; Liu, K.; Xian, H.; Yu, J. Numerical Simulation of Hydraulic Force on the Impeller of Reversible Pump Turbines in Generating Mode. J. Hydrodyn. Ser. B 2017, 29, 603–609. [Google Scholar] [CrossRef]
  19. Shi, W.; Li, Q.; Lu, W.; Zhang, D. Estimation and Experiment of Axial Thrust in Centrifugal Pump Based on CFD. Trans. Chin. Soc. Agric. Mach. 2009, 40, 60–63. [Google Scholar]
  20. Zhu, D.; Xiao, R.; Liu, W. Influence of Leading-Edge Cavitation on Impeller Blade Axial Force in the Pump Mode of Reversible Pump-Turbine. Renew. Energy 2021, 163, 939–949. [Google Scholar] [CrossRef]
  21. Kong, L.; Cao, J.; Li, X.; Zhou, X.; Hu, H.; Wang, T.; Gui, S.; Lai, W.; Zhu, Z.; Wang, Z. Numerical Analysis on the Hydraulic Thrust and Dynamic Response Characteristics of a Turbine Pump. Energies 2022, 15, 1580. [Google Scholar] [CrossRef]
  22. Kalinichenko, P.; Suprun, A. Effective Modes of Axial Balancing of Centrifugal Pump Rotor. Procedia Eng. 2012, 39, 111–118. [Google Scholar] [CrossRef] [Green Version]
  23. Ma, H.; Wang, Q.; Ju, P. Study of the Load Reduction for Hydro-Generator Bearing by Hybrid Magnetic Levitation. Int. J. Appl. Electromagn. Mech. 2013, 43, 215–226. [Google Scholar] [CrossRef]
  24. Zhou, L.; Shi, W.; Li, W.; Agarwal, R. Numerical and Experimental Study of Axial Force and Hydraulic Performance in a Deep-Well Centrifugal Pump with Different Impeller Rear Shroud Radius. J. Fluids Eng. 2013, 135, 104501. [Google Scholar] [CrossRef]
  25. Xi, C. Mechanical Design of 300 MW Pump-Turbine for Heimifeng Pumped Storage Power Station. Dongfang Electr. Rev. 2011, 25, 27–33. [Google Scholar]
  26. Zhang, F.; Lv, Y.; Gui, Z.; Wang, Z. Effect of the Diameter of Pressure-Balance Pipe on Axial Hydraulic Thrust. J. Mar. Sci. Eng. 2021, 9, 724. [Google Scholar] [CrossRef]
  27. Tanaka, H. Vibration Behavior and Dynamic Stress of Runners of Very High Head Reversible Pump-Turbines. Int. J. Fluid Mach. Syst. 2011, 4, 289–306. [Google Scholar] [CrossRef]
  28. He, L.Y.; Wang, Z.W.; Kurosawa, S.; Nakahara, Y. Resonance Investigation of Pump-Turbine during Startup Process. In Proceedings of the IOP Conference Series: Earth and Environmental Science, Jakarta, Indonesia, 23–24 January 2014; Volume 22, p. 32024. [Google Scholar]
  29. He, L.; Zhou, L.; Ahn, S.-H.; Wang, Z.; Nakahara, Y.; Kurosawa, S. Evaluation of Gap Influence on the Dynamic Response Behavior of Pump-Turbine Runner. Eng. Comput. 2019, 36, 491–508. [Google Scholar] [CrossRef]
  30. Mao, Z.; Tao, R.; Chen, F.; Bi, H.; Cao, J.; Luo, Y.; Fan, H.; Wang, Z. Investigation of the Starting-Up Axial Hydraulic Force and Structure Characteristics of Pump Turbine in Pump Mode. J. Mar. Sci. Eng. 2021, 9, 158. [Google Scholar] [CrossRef]
  31. Menter, F.R.; Kuntz, M.; Langtry, R. Ten Years of Industrial Experience with the SST Turbulence Model. In Turbulence, Heat, and Mass Transfer 1; Begell House: Danbury, CT, USA, 2003; Volume 4, pp. 625–632. [Google Scholar]
  32. Menter, F. Zonal Two Equation Kw Turbulence Models for Aerodynamic Flows. In Proceedings of the 23rd fluid dynamics, plasmadynamics, and lasers conference, Orlando, FL, USA, 6–9 July 1993; p. 2906. [Google Scholar]
  33. Xiao, R.; Wang, Z.; Luo, Y. Dynamic Stresses in a Francis Turbine Runner Based on Fluid-Structure Interaction Analysis. Tsinghua Sci. Technol. 2008, 13, 587–592. [Google Scholar] [CrossRef]
  34. Presas, A.; Luo, Y.; Wang, Z.; Guo, B. Fatigue Life Estimation of Francis Turbines Based on Experimental Strain Measurements: Review of the Actual Data and Future Trends. Renew. Sustain. Energy Rev. 2019, 102, 96–110. [Google Scholar] [CrossRef]
Figure 1. Structural model of the researched pump-turbine.
Energies 15 02195 g001
Figure 2. Flow passage model of the researched pump-turbine.
Energies 15 02195 g002
Figure 3. Mesh of the flow field of the pump-turbine: (a) spiral casing; (b) stay vane and guide vanes; (c) runner; (d) PBPs; (e) seal and gap of the runner; (f) draft tube.
Energies 15 02195 g003aEnergies 15 02195 g003b
Figure 4. Guide vane opening Ca (a) head coefficient Cψ (b) and efficiency η (c) vs. discharge coefficient Cφ.
Energies 15 02195 g004
Figure 5. Pressure monitoring point selection.
Energies 15 02195 g005
Figure 6. Pressure comparison of the critical positions between CFD and experiment.
Energies 15 02195 g006
Figure 7. The three-dimensional model of the support bracket.
Energies 15 02195 g007
Figure 8. The calculation model of the support bracket.
Energies 15 02195 g008
Figure 9. Grid independence test of the bracket.
Energies 15 02195 g009
Figure 10. Variation of axial force with flow rate.
Energies 15 02195 g010
Figure 11. Comparison of runner axial force with and without the PBPs.
Energies 15 02195 g011
Figure 12. The equivalent stress distribution of support bracket at maximum axial force (Cφ = 0.0142) with PBP blockage.
Energies 15 02195 g012
Figure 13. The variation of the maximum equivalent stress on the support bracket with different axial forces and different condition of the PBP.
Energies 15 02195 g013
Figure 14. Meridional map of runner with indication of hub and crown leakages.
Energies 15 02195 g014
Figure 15. Comparison of pressure distribution between (a) normal condition and (b) PBP blockage condition at Cφ = 0.032.
Energies 15 02195 g015
Table 1. Main parameters of the researched turbine unit.
ParameterValueUnit
Rated head Hr430m
Rated speed nr428.6rpm
Rated output Pr300MW
Runner diameter D4.16m
Number of the blades zb9
Number of the guide vanes zg20
Number of the stay vanes zs20
Table 2. Mesh node number of all the components.
ComponentNumber of the Nodes
Draft tube348,822
Runner3,663,918
Runner seal and gap5,894,860
Guide vane1,957,000
Stay vane834,840
Spiral casing301,592
Total13,001,032
Table 3. Boundary conditions of the numerical simulation.
PlaneBoundary ConditionValue
Draft tube inletSpeed inletSpeed value depends on the discharge Cφ
Pressure outletPressure outletAverage pressure is set as 1 atm
Wall boundariesNon-slip wall surfaces
Connection of the partsJunction surface model
Publisher’s Note: MDPI stays neutral with regard to jurisdictional claims in published maps and institutional affiliations.

