Article

Performance Evaluation of Centrifugal Refrigeration Compressor Using R1234yf and R1234ze(E) as Drop-In Replacements for R134a Refrigerant

1
Department of Process Control and Equipment Engineering, College of Electromechanical Engineering, Qingdao University of Science and Technology, Qingdao 260061, China
2
Qingdao Haier Smart Technology R&D Co., Ltd., Qingdao 266103, China
*
Author to whom correspondence should be addressed.
Energies 2022, 15(7), 2552; https://doi.org/10.3390/en15072552
Submission received: 19 February 2022 / Revised: 16 March 2022 / Accepted: 29 March 2022 / Published: 31 March 2022

Abstract

:
With the increasing global requirements for environmental protection, refrigerants with ODP of 0 and low GWP are widely concerned and applied. In this paper, the CFD numerical method simulates the R134a centrifugal compressor directly replaced by R1234yf and R1234ze(E). The results show that at the same compressor rotational speed, using R1234yf to replace R134a directly can obtain a higher cooling capacity, but it reduces COP by about 12.5%; using R1234ze(E) to replace R134a directly reduces the cooling capacity under partial working conditions, the COP is reduced by about 7.0%. When the evaporation temperature, condensation temperature, and cooling capacity are the same, compared with the R134a unit, the COP of the R1234ze(E) unit is reduced by about 5.14%, and it is reduced by about 8.93% for the R1234yf unit. For the R134a centrifugal chiller, the drop-in replacement of R134a with R1234ze(E) can obtain better system performance compared with R1234yf.

1. Introduction

R134a is an HFC (hydrofluorocarbon) refrigerant that is widely used in automotive air conditioning and water chillers with centrifugal compressors. However, its value of global warming potential (GWP) is 1300, which contributes to global warming [1,2]. With increasing global environmental requirements, the usage amount of R134a has been requested to reduce [3,4]. One kind of replacement is HFO (Hydrofluoroolefin) refrigerants. This kind of refrigerant has attracted extensive attention and is applied in some applications due to its 0 ozone depletion potential (ODP) and low GWP. Additionally, the representatives of HFOs include R1234yf, R1234ze(E), and R1233zd(E) [5,6].
R1234yf is mainly used to replace R134a in automobile air conditioners, while R1234ze(E) or R1233zd(E) is commonly used to replace R134a in centrifugal chillers [7,8]. At present, some companies are developing centrifugal chillers using R1234ze(E) and R1233zd(E) as refrigerants, such as Danfoss, Klima-Therm Company, Carrier, Mitsubishi Heavy Industries, Trane, and Gree [9,10].
Many scholars studied the replacement of R134a refrigerant. Aral et al. [11] developed an automotive air conditioning (AAC) and automotive heat pump (AHP) system employing refrigerants R134a and R1234yf. They tested them in cooling and heating operation modes under broad ranges of compressor speed and air inlet temperature conditions. Additionally, the results revealed that R1234yf performs better in heating relative to cooling mode. It can be used as a replacement for R134a in not only AAC but also AHP systems at the expense of slightly lower energy effectiveness. Qi [12] performed thermodynamic analysis for the R1234yf mobile air-condition (MAC) system associated with the R134a system under three typical vehicle operating conditions. The performance improvement potentials by superheating, subcooling, and compressor performance were mainly focused on and discussed. It was concluded that adding an internal heat exchanger and improving compressor efficiencies would be good options for future R1234yf MAC system enhancement. Mota-Babiloni et al. [13] presented an energy performance evaluation of two low-GWP refrigerants, R1234yf and R1234ze(E), as drop-in replacements for R134a in a vapor compression system using a reciprocating compressor. Additionally, the volumetric efficiency, cooling capacity, and coefficient of performance (COP) were analyzed. Results showed that the COP values were about 7% lower for R1234yf and 6% lower for R1234ze than those obtained using R134a. Additionally, the use of an internal heat exchanger reduced the COP differences for both replacements. Chen et al. [14] investigated the performance of R1234yf and R134a in an oil-free vapor compression refrigeration (VCR) system. The results showed that R1234yf is similar to R134a in terms of operating pressure and temperature, but R1234yf has an 11% and 16% deterioration in cooling capacity and COP, respectively.
Many scholars compared the boiling and condensation heat transfer coefficients of R1234yf, R1234ze(E), and R1233zd(E) with those of R134a. Most scholars showed that the boiling and condensation heat transfer coefficients of R1234yf, R1234ze(E), and R1233zd(E) are lower than those of R134a. For example, Yang et al. [15,16] provided an experimental analysis of flow boiling and condensation heat transfer of R1234yf and R134a in a small circular tube. The test results showed that the boiling and condensation heat transfer coefficients of R1234yf are lower than those of R134a. Nagata et al. [17] comparatively assessed the free convective condensation and pool boiling heat transfer coefficients (HTCs) of 1234ze(E) on a smooth horizontal tube made of copper with an outer diameter of 19.12 mm. Results showed that the condensation HTC and pool boiling HTC of R1234ze(E) are slightly lower than that of R134a. Ubara et al. [18] experimentally evaluated the falling film evaporation and pool boiling heat transfer coefficients of R1233zd(E) on a single horizontal tube. The experimental results for R1233zd(E) were compared with those for R134a. The results showed that the pool boiling and falling film evaporation heat transfer coefficients were lower for R1233zd(E) than for R134a. Therefore, in the water chiller, it is necessary to consider increasing the heat transfer area of the evaporator and condenser when R1234yf, R1234ze(E) and R1233zd(E) are used to replace R134 as the refrigerant.
In spite of a number of studies mentioned above, research on the drop-in refrigerant replacement of R134a centrifugal chiller is rare at present. HFOs are considered new generation refrigerants with the most potential to replace R134a, with broad application prospects. At present, there are still R134a centrifugal chillers in use in the market. With the gradual prohibition of R134a, it is of great significance to study the refrigerant direct replacement technology for the existing R134a centrifugal chillers. Moreover, due to the difference in working principles from the positive displacement (screw, scroll, reciprocating, etc.) refrigeration compressor, the centrifugal refrigeration compressor is more sensitive to the physical properties of the refrigerant.
Among HFO refrigerants, R1234yf, R1234ze(E), and R1233zd(E) are the suitable refrigerants that are researched and applied in centrifugal water chillers. However, R1233zd(E) cannot be used as a drop-in replacement refrigerant for R134a through the analysis in the next section. Therefore, this paper took the centrifugal refrigeration compressor as the research object and used the CFD numerical method to simulate and analyze the compressor using R134a, R1234yf, and R1234ze(E), respectively. Parameters such as the pressure ratio, power, and isentropic efficiency of the centrifugal compressor were calculated. The R134a centrifugal chiller was selected, the refrigerant was directly replaced by R1234yf and R1234ze(E), and the refrigeration performance (including cooling capacity and COP) was compared and analyzed.

2. Comparative Analysis of Refrigerant Physical Properties

In consideration of the thermophysical properties of refrigerants, R1234yf, R1234ze(E), and R1233zd(E) can be considered the drop-in replacement refrigerants of R134a [19,20]. Table 1 compare the main physical property parameters of R134a with the refrigerants R1234yf, R1234ze(E), and R1233zd(E) [21,22,23]. It can be seen that R1234yf, R1234ze(E), and R1233zd(E) have extremely low GWP compared with R134a.
The saturation lines of four refrigerants on the pressure-specific enthalpy diagram are shown as thin lines in Figure 1a. It can be seen that the saturation lines of R1234ze(E) and R1234yf are similar to that of R134a, and the saturation line of R1234ze(E) has the smallest deviation from that of R134a. The saturation line of R1233zd(E) is quite different from that of R134a. Under the same pressure, it has a relatively higher specific enthalpy value than R134a.
The working conditions are set as evaporation temperature 5.5 °C, condensation temperature 37 °C, superheating temperature 3 °C, and subcooling temperature 4 °C. The theoretical cycles of the four refrigerants are represented on the pressure-enthalpy diagram (shown as the thick lines in Figure 1a). Pressure is the operating pressure of the system and will affect the working process of the compressor. Specific enthalpy directly affects system performance. It can be seen that the pressure of R1234yf is the closest to that of R134a, but the specific enthalpy value of R1234yf in the gas phase region is smaller than that of R134a; the specific enthalpy value of R1234ze(E) is the closest to that of R134a, but its pressure is lower than that of R134a; the difference between R1233zd(E) and R134a is large, the pressure of R1233zd(E) is lower than that of R134a.
Figure 1b show the saturation pressure of four refrigerants at different temperatures. The curve of R1234yf and R134a is the closest, followed by R1234ze(E). At the same temperature, the saturation pressure of R1233zd(E) is lower than that of R134a. Additionally, with the increase in temperature, the difference between them increases gradually.
Due to the low pressure of R1233zd(E), the volume flow rate under the same cooling capacity is quite different from that of other refrigerants, leading to a significant reduction in the rotational speed of the compressor impeller and a large difference in impeller design size [24]. Because the physical properties of R1233zd(E) and R134a are quite different, it is difficult to directly replace R1233zd(E) in the original centrifugal chillers using R134a. Therefore, this paper does not consider the drop-in replacement of R1233zd(E) in the R134a centrifugal chiller. The working fluids of R1234yf and R1234ze(E) have similar physical properties to R134a, and they can potentially be used as drop-in refrigerants.
For centrifugal chillers, if we want to replace the refrigerant without changing the compressor, the cooling capacity per unit volume of the replaced refrigerant should be similar to that of the original refrigerant. Under the mentioned working conditions above, the cooling capacity per unit volume is calculated using the following Equation (1):
q v = q 0 × ρ 1
where q0 (kJ·kg−1) is the unit cooling capacity; ρ1 (kg·m−3) is the density of the compressor inlet.
The cooling capacity per unit volume of the four refrigerant units is shown in Table 2. It can be seen that the cooling capacity per unit volume of R1234yf and R1234ze(E) is not much different from that of the R134a unit, the cooling capacity per unit volume of R1234yf is 0.95 times that of R134a, and the cooling capacity per unit volume of R1234ze(E) is 0.75 times that of R134a. At the same time, the cooling capacity per unit volume of R1233zd(E) is quite different from that of R134a, which is 0.22 times that of R134a. Therefore, it may be feasible to replace R134a with R1234yf or R1234ze(E) directly.

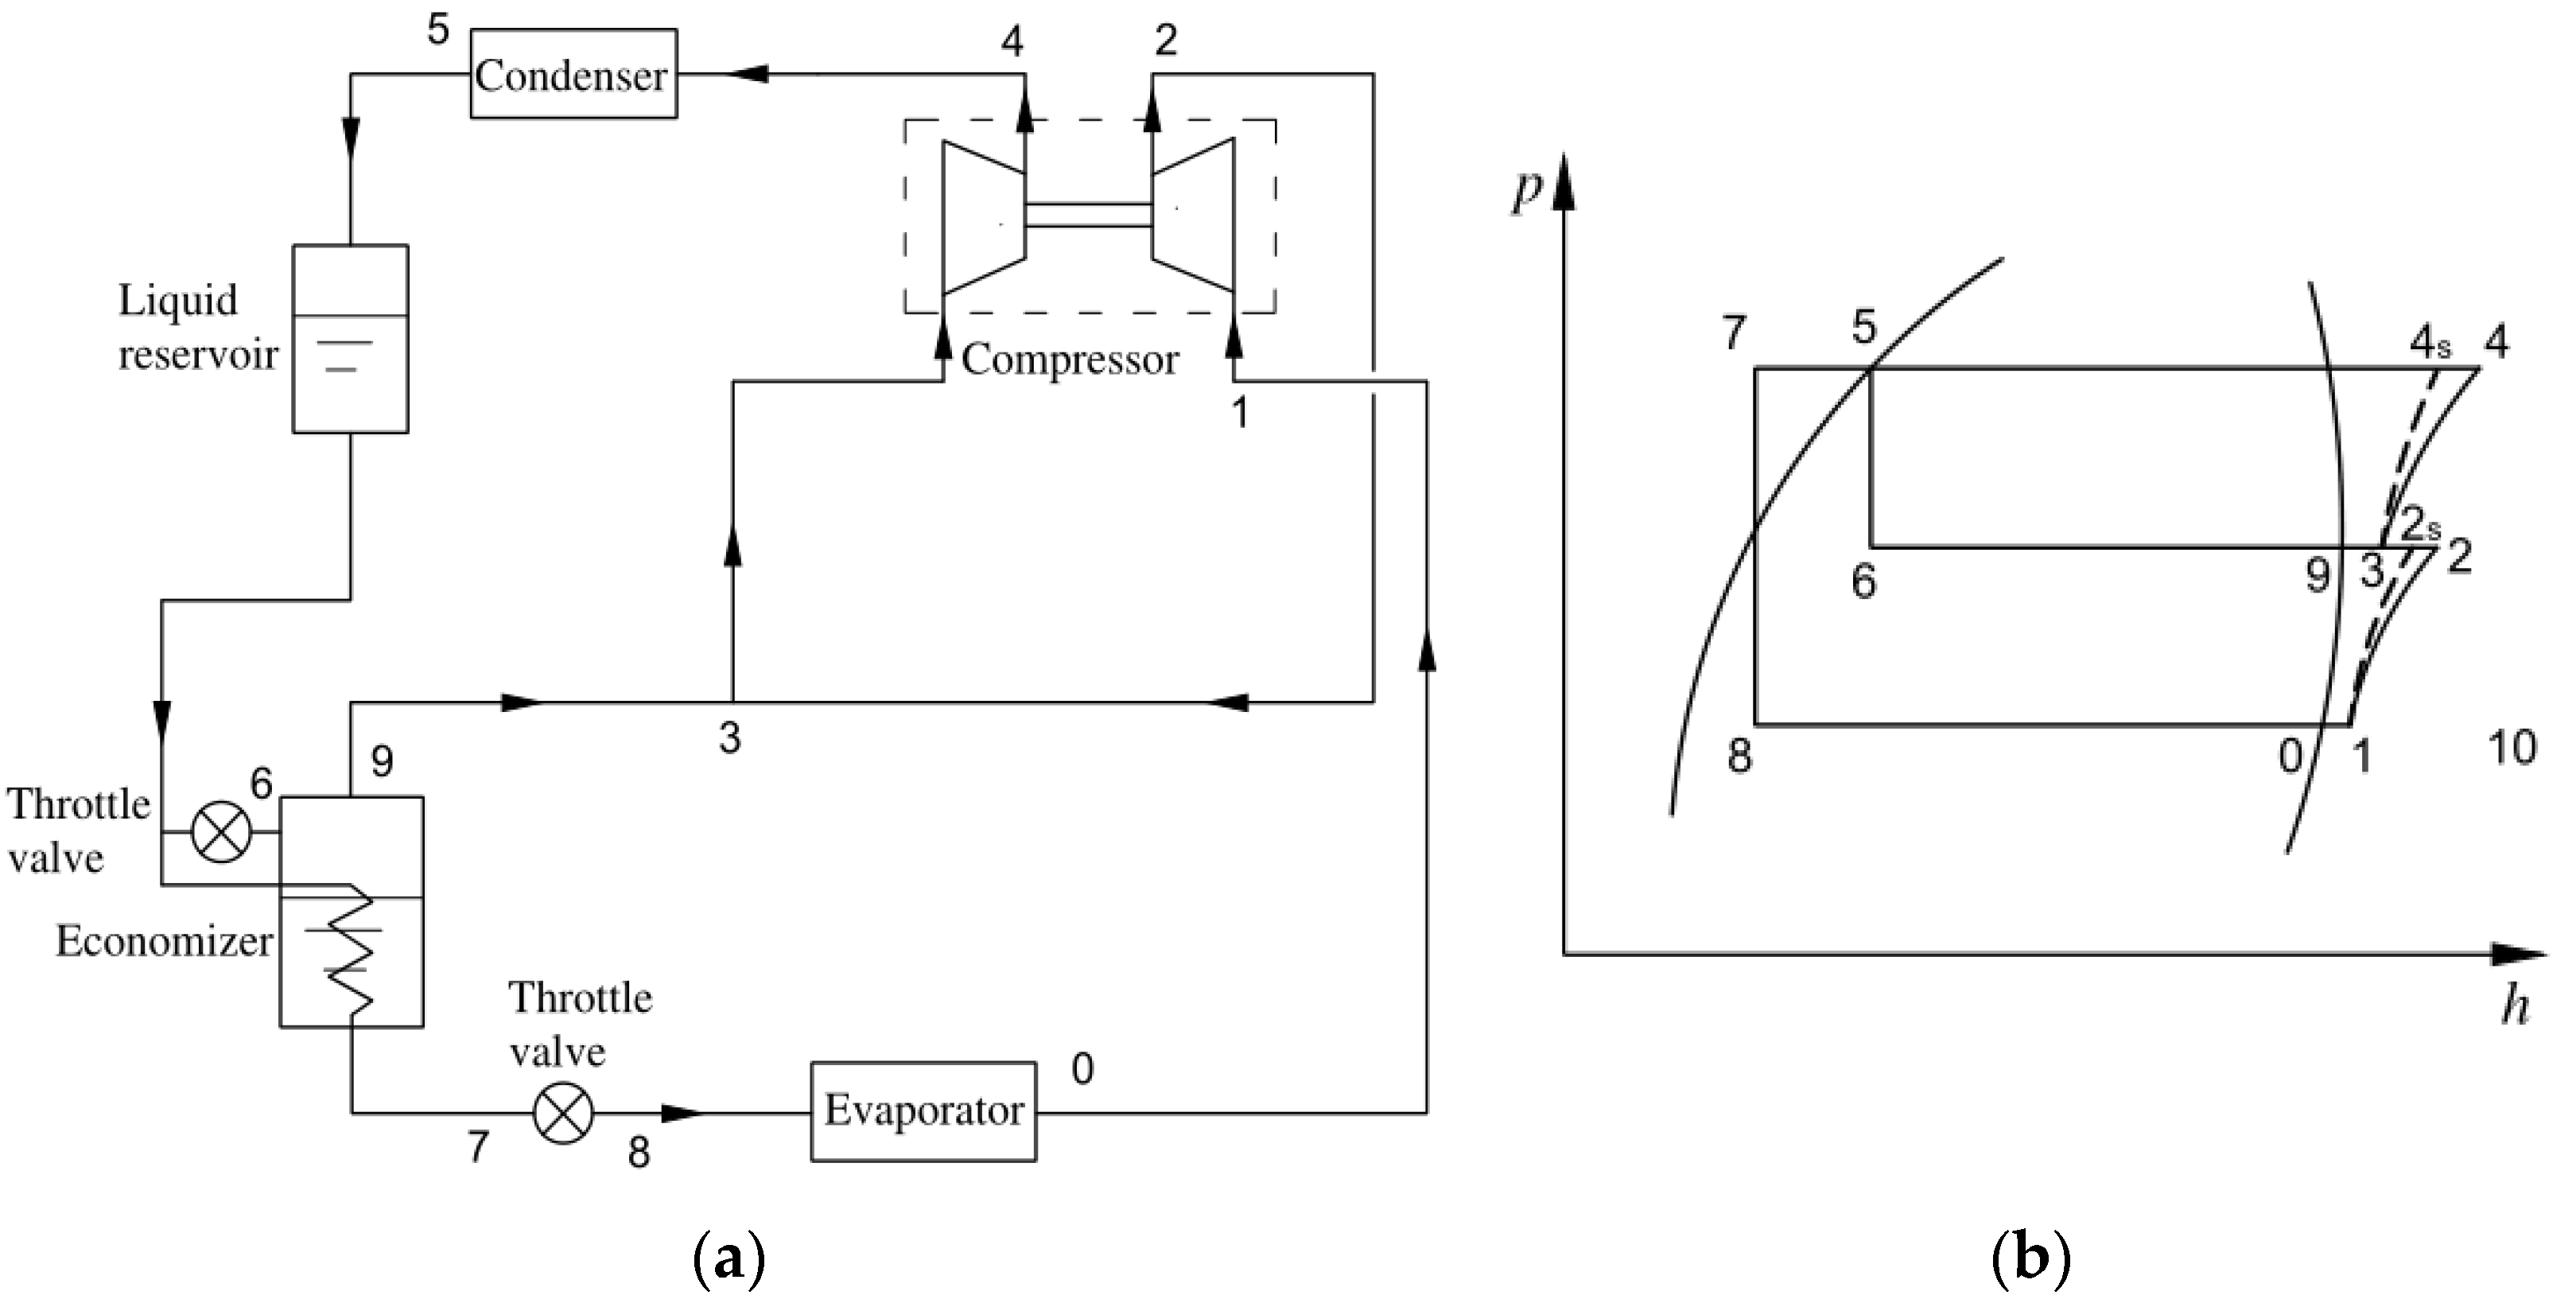
3. Refrigeration Cycle System

The working circuit of the two-stage compression refrigeration cycle system used in this paper is shown in Figure 2a: the low-pressure refrigerant gas from the evaporator is sucked in by the first stage impeller of the compressor, compressed to the intermediate pressure, and mixed with the refrigerant vapor from the intercooler. Additionally, the gas is sucked in by the second stage impeller of the compressor, compressed to the condensation pressure, enters the condenser to be condensed into the refrigerant liquid, and then enters the liquid reservoir. The liquid from the liquid reservoir is divided into two routes: A portion of liquid enters the intercooler to reduce the temperature and becomes a subcooled liquid. After the pressure is reduced by the throttle valve, it is evaporated in the evaporator. Another portion of liquid flows into the intercooler for evaporation after depressurization by the throttle valve. The pressure-specific enthalpy diagram corresponding to this circuit is shown in Figure 2b.
According to the manufacturer’s standard [25],the working conditions of the centrifugal chiller system used in this paper are set, and they are shown in Table 3.

4. Numerical Calculation Methods

4.1. Basic Governing Equations

To simulate the internal flow of centrifugal compressors, the CFD method is used in this paper. Additionally, the details of the governing equations which are used during the simulation process are as follows:
(1)
Mass conservation equation
The mass conservation equation can be expressed as:
ρ t + div ( ρ u ) = 0  
where t is the time, ρ is the density, u is the velocity vector.
(2)
Momentum conservation equation
The momentum conservation equation can be expressed as:
( ρ u x ) t + div ( ρ u x u ) = p x + τ x x x + τ y x y + z x z + F x ( ρ u y ) t + div ( ρ u y u ) = p x + τ x y x + τ y y y + z y z + F y ( ρ u z ) t + div ( ρ u z u ) = p x + τ x z x + τ y z y + z z z + F z
where ux, uy, uz is the component of the velocity vector in the x, y, z direction, p is the pressure on the micro-element body, τi,j (i = x, y, z, j = x, y, z) is the deviatoric stress component, Fx, Fy, Fz is the force on the micro-element body.
(3)
Energy conservation equation
The energy conservation equation can be expressed as:
t [ ρ ( e + V 2 2 ) ] + div [ ρ ( e + V 2 2 ) V ] = ρ q + div ( k T ) div ( p V ) + div ( τ × V ) + F × V
where e is the internal energy per unit mass of fluid, V2/2 is the kinetic energy per unit mass of fluid, q is the heat source per unit volume, div(kT) is the imported heat, −div(pV) +div(τ × V) is the work conducted by surface force, F × V is the work conducted by mass force.

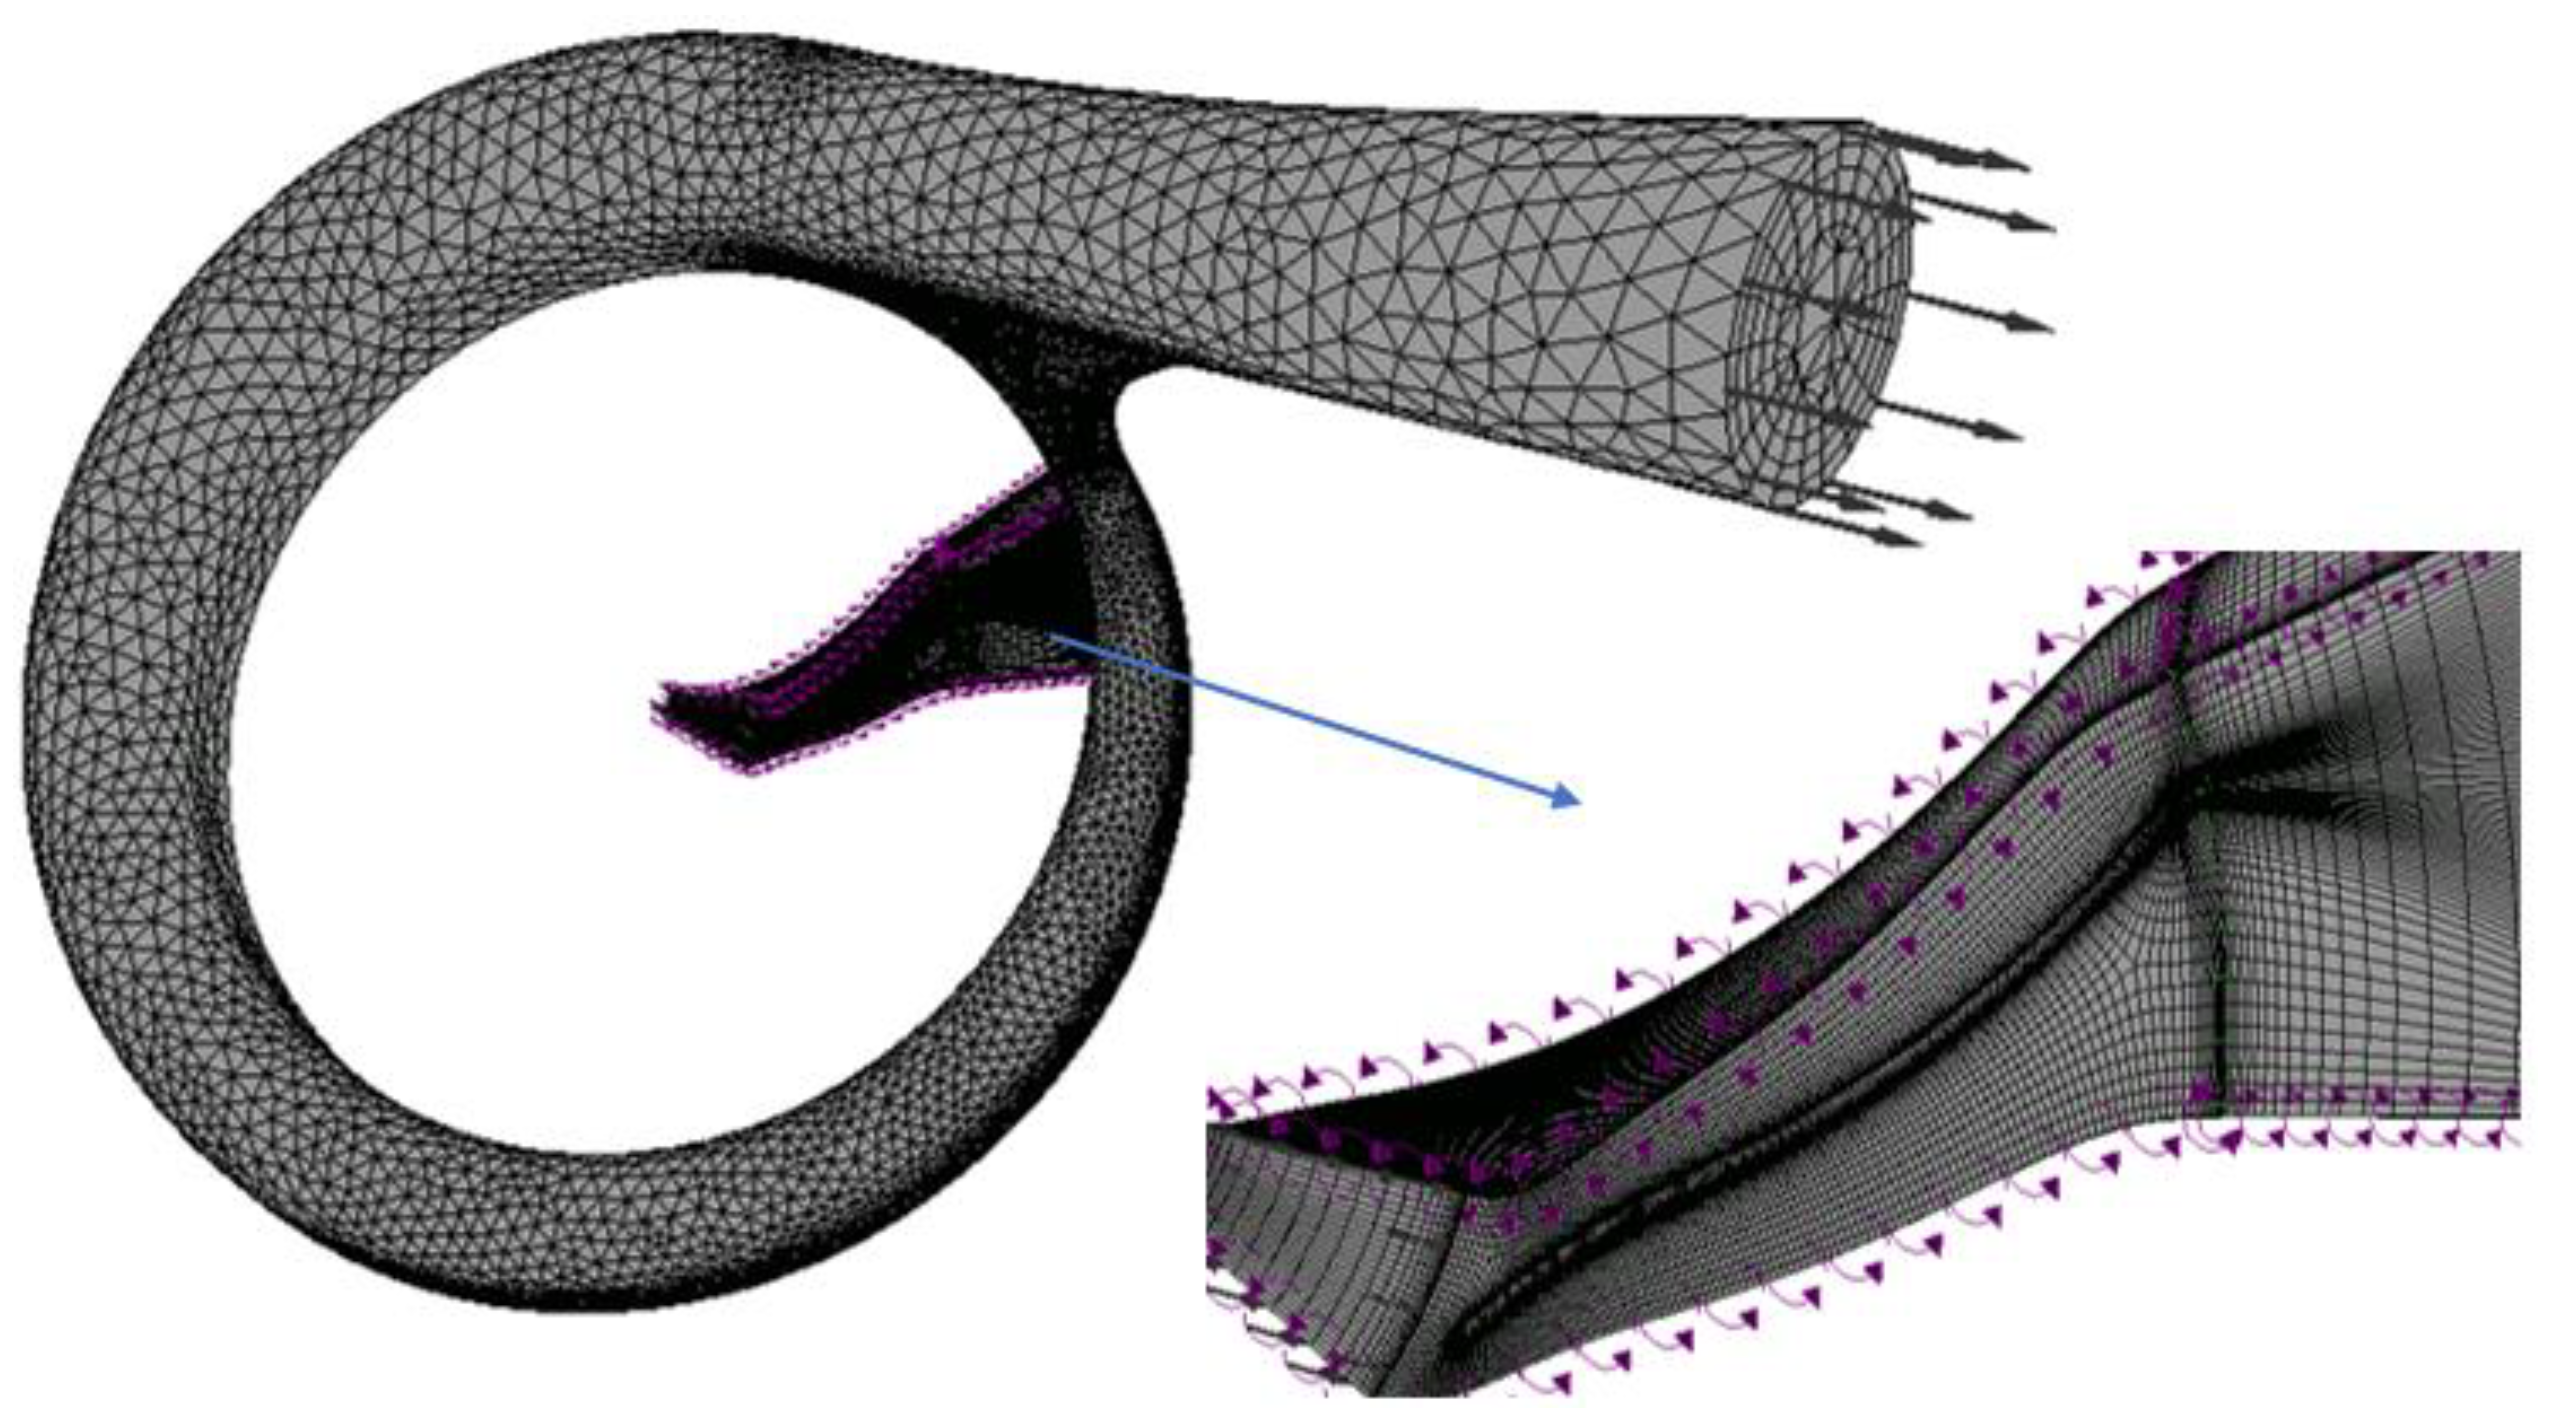
4.2. Geometrical Model

The fluid domain of the centrifugal compressor is extracted as the physical model, which mainly includes the impeller, diffuser, and volute (as shown in Figure 3). The main design parameters of impellers are shown in Table 4.

4.3. Meshing

The hexahedral structured mesh was divided for the single channel of impeller and diffuser, and the unstructured tetrahedral mesh was divided for the volute. The mesh independence verification of the first stage compressor is shown in Figure 4. The outlet pressure when the grid number is 988,413 is only 0.04k Pa lower than that when the grid number is 946,364, so the total number of meshes for the first-stage impeller, diffuser, and volute was 946,364. The same method is adopted for the mesh independence verification of the second stage compressor. The total number of meshes for the second-stage impeller, diffuser, and volute was 872,912. The value of y+ is 25. There are eight boundary layers; the thickness of the first boundary layer is 0.036 mm. The mesh is shown in Figure 5.

4.4. Calculation Parameters and Boundary Conditions

The impeller flow channel is set as the rotating calculation domain, and the diffuser and volute flow channel are set as the static calculation domain. Both the impeller and the diffuser use the periodic interface. Additionally, the interface between the impeller and diffuser and the interface between the diffuser and volute both use the frozen rotor model. The surface of impellers, diffuser, and volute are all set as non-slip, smooth, and adiabatic wall surfaces. The maximum number of iteration steps is 500, an automatic timescale is used, and the timescale factor is 10. Convergence is considered when the residuals converge and the monitored amount remains stationary.
Steady-state simulation is used. The heat transfer model is set to the Total Energy. The turbulence model uses the Shear Stress Transport (SST) model [26]. Due to the analysis found that R1233zd(E) cannot be used as a drop-in replacement refrigerant for R134a, the fluids are set to R134a, R1234yf, and R1234ze(E), respectively. Among them, R1234ze(E) uses the NIST physical property software [27]. The refrigerant physical property data is converted into a physical property table (RGP file), which is imported into the solver for the solution. The physical property table takes pressure and temperature as independent variables. The boundary conditions of the total temperature and total pressure inlet and flow rate outlet are chosen. The total inlet pressure of the three fluids is set to 355.78 kPa, 379.04 kPa, and 263.96 kPa (their saturation pressures at the evaporation temperature of 5.5 °C), respectively. The total inlet temperature is 8.5 °C (superheating temperature is 3 °C), and the outlet flow rate is set according to the working conditions.

4.5. Performance Parameters

The working condition parameters of the refrigeration system which are used in the calculation of the system performance are shown in Table 3. The cooling capacity and the coefficient of performance (COP) are calculated based on two kinds of data. One is the simulation result of the compressors, the other is from the parameters in Table 3 and the thermophysical properties of the refrigerations.
The isentropic efficiency is an important parameter of centrifugal compressors, which is defined as the ratio of the isentropic power of the compressor to the actual compression power, which can also be calculated by the following equation [28]:
η s = h 2 s h 1 h 2 h 1
where h1 (kJ·kg−1) is the specific enthalpy value of the working fluid at the compressor inlet; h2 (kJ·kg−1) is the specific enthalpy value of the working fluid at the outlet of the actual compression process; h2s (kJ·kg−1) is the specific enthalpy value of the working fluid at the outlet of the isentropic compression process.
The cooling capacity of the unit is calculated by the following equation [29]:
Q 0 = q m q 0 = q m ( h 1 h 8 )
where qm (kg·s−1) is the mass flow rate of the refrigerant; q0 (kJ·kg−1) is the unit cooling capacity; h1 (kJ·kg−1) is the specific enthalpy value of the compressor inlet; h8 (kJ·kg−1) is the specific enthalpy value of the evaporator inlet.
The COP of the system is calculated by the following equation:
COP = Q 0 P ed + P eg
where Ped (kW) is the input power of the low-pressure compressor; Peg (kW) is the input power of the high-pressure compressor. They are calculated by the CFD simulation model.

5. Results and Discussions

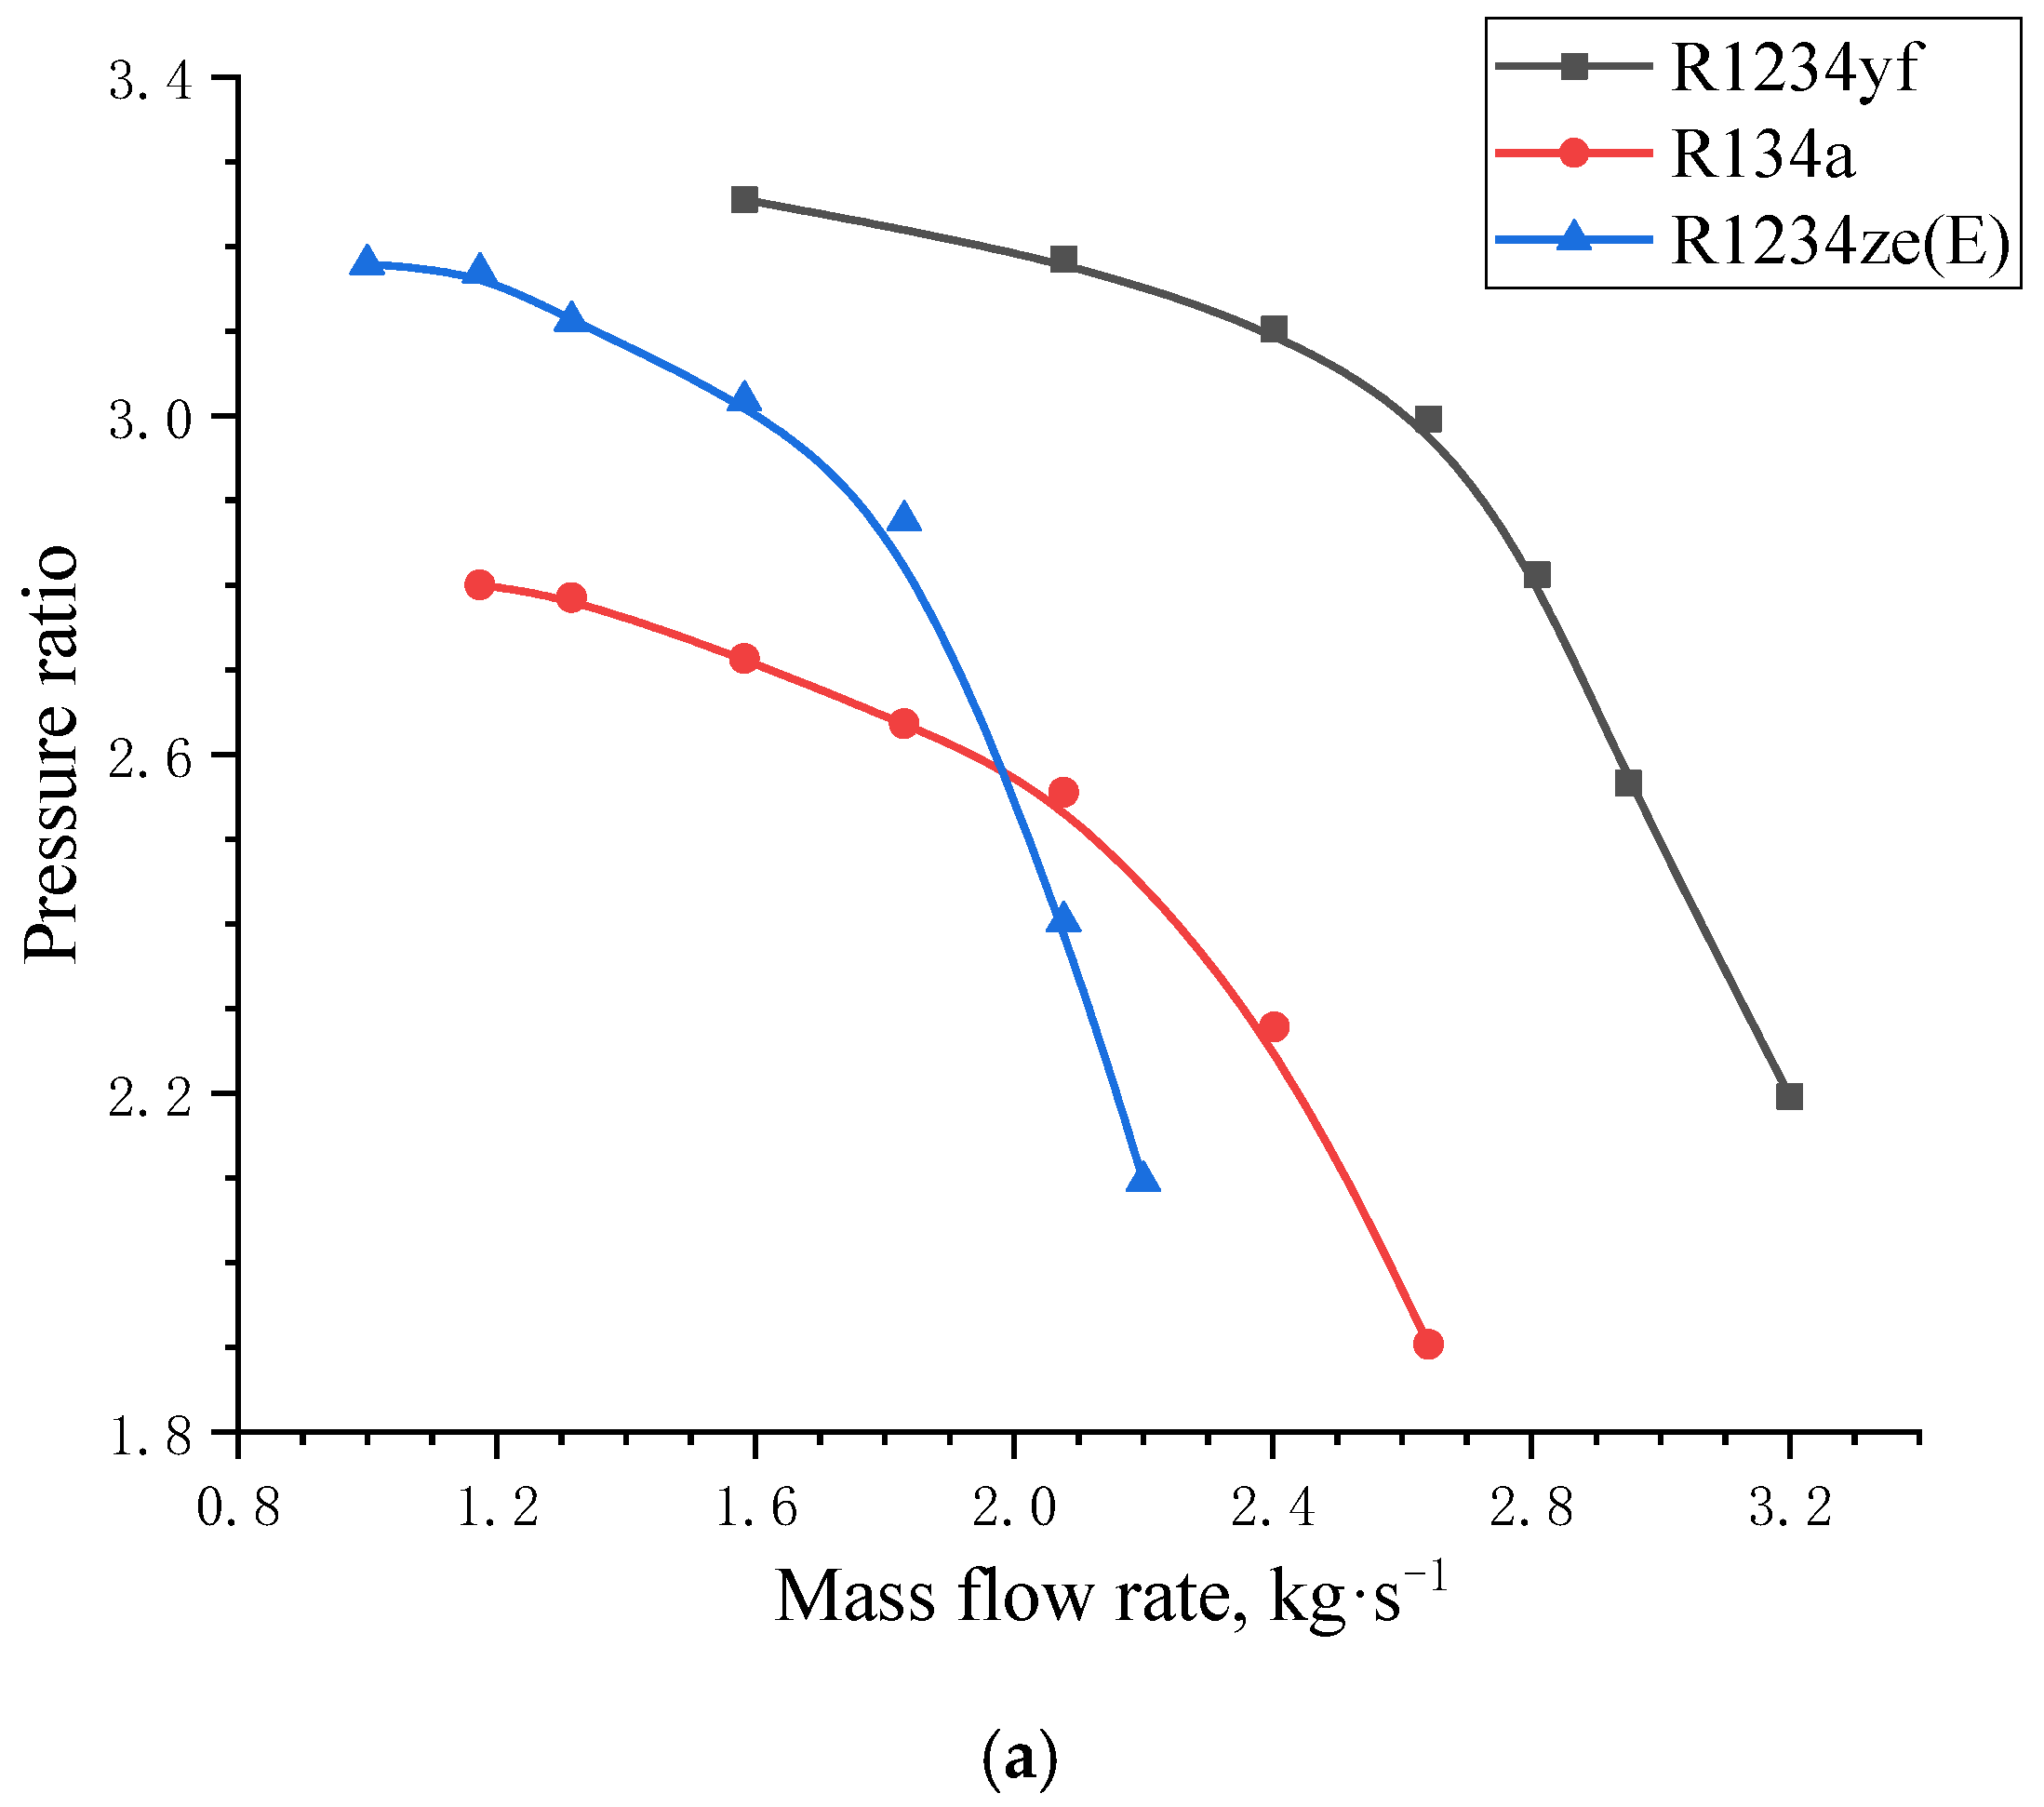
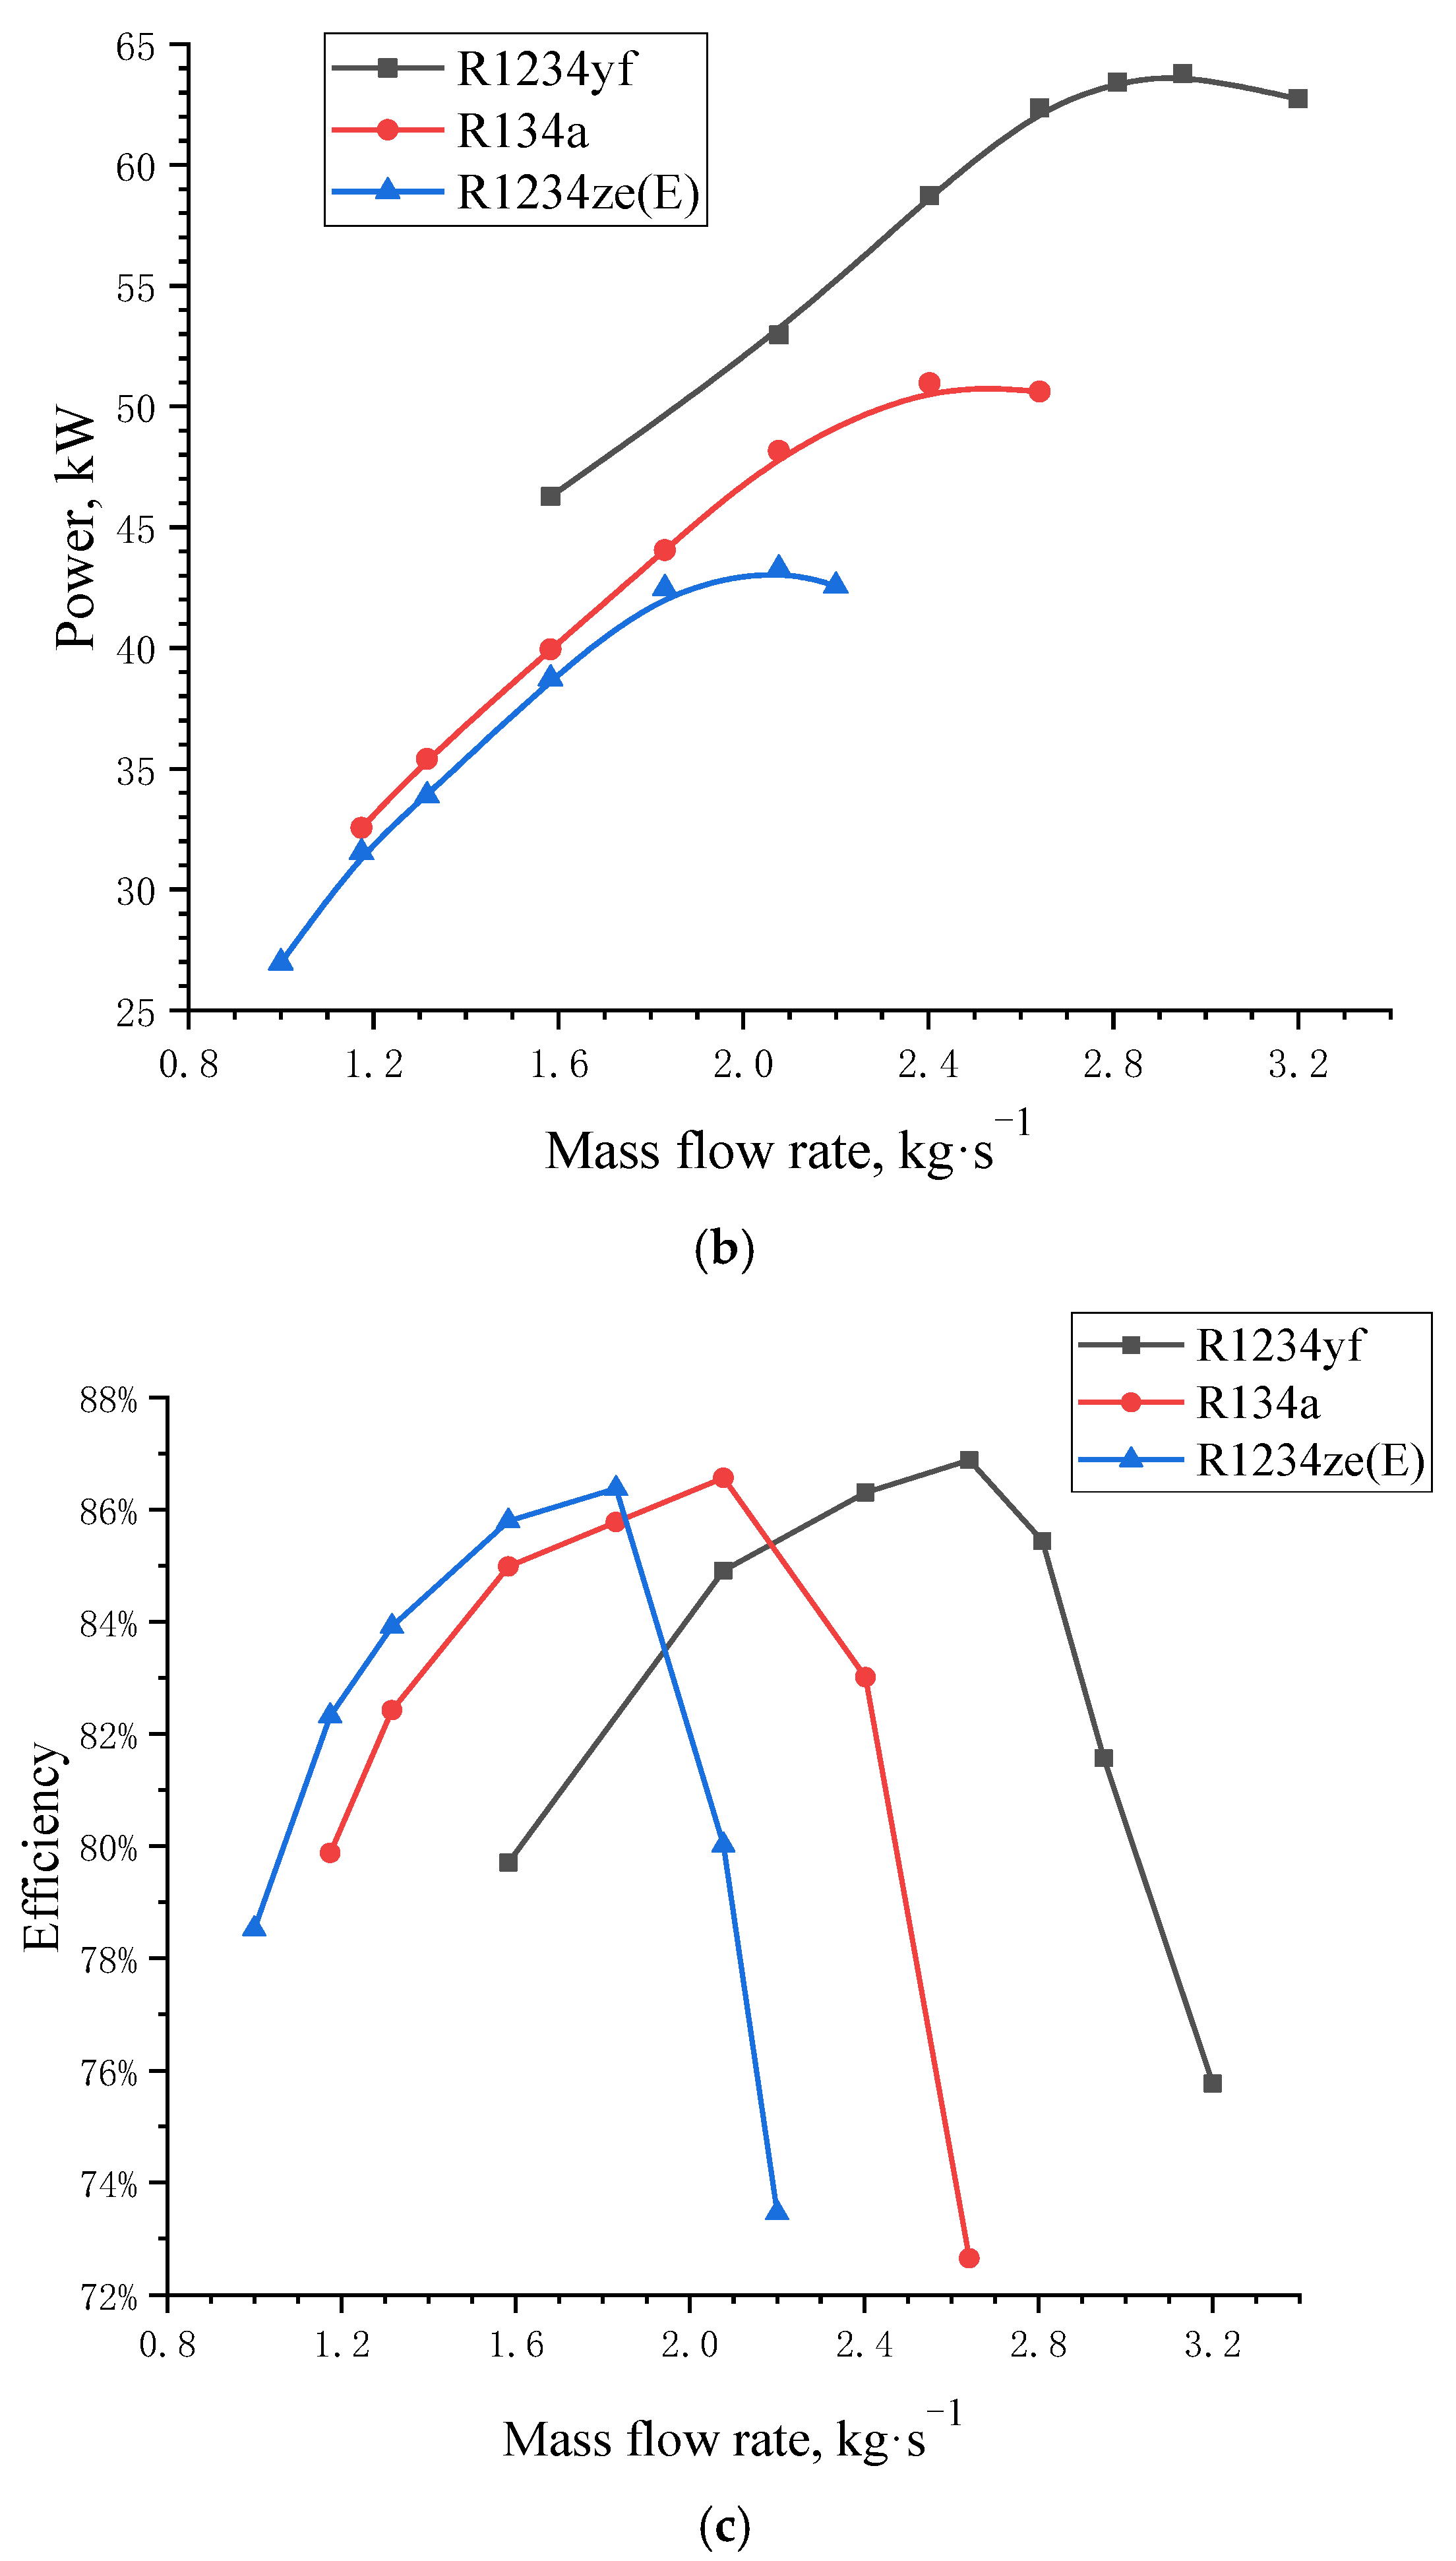
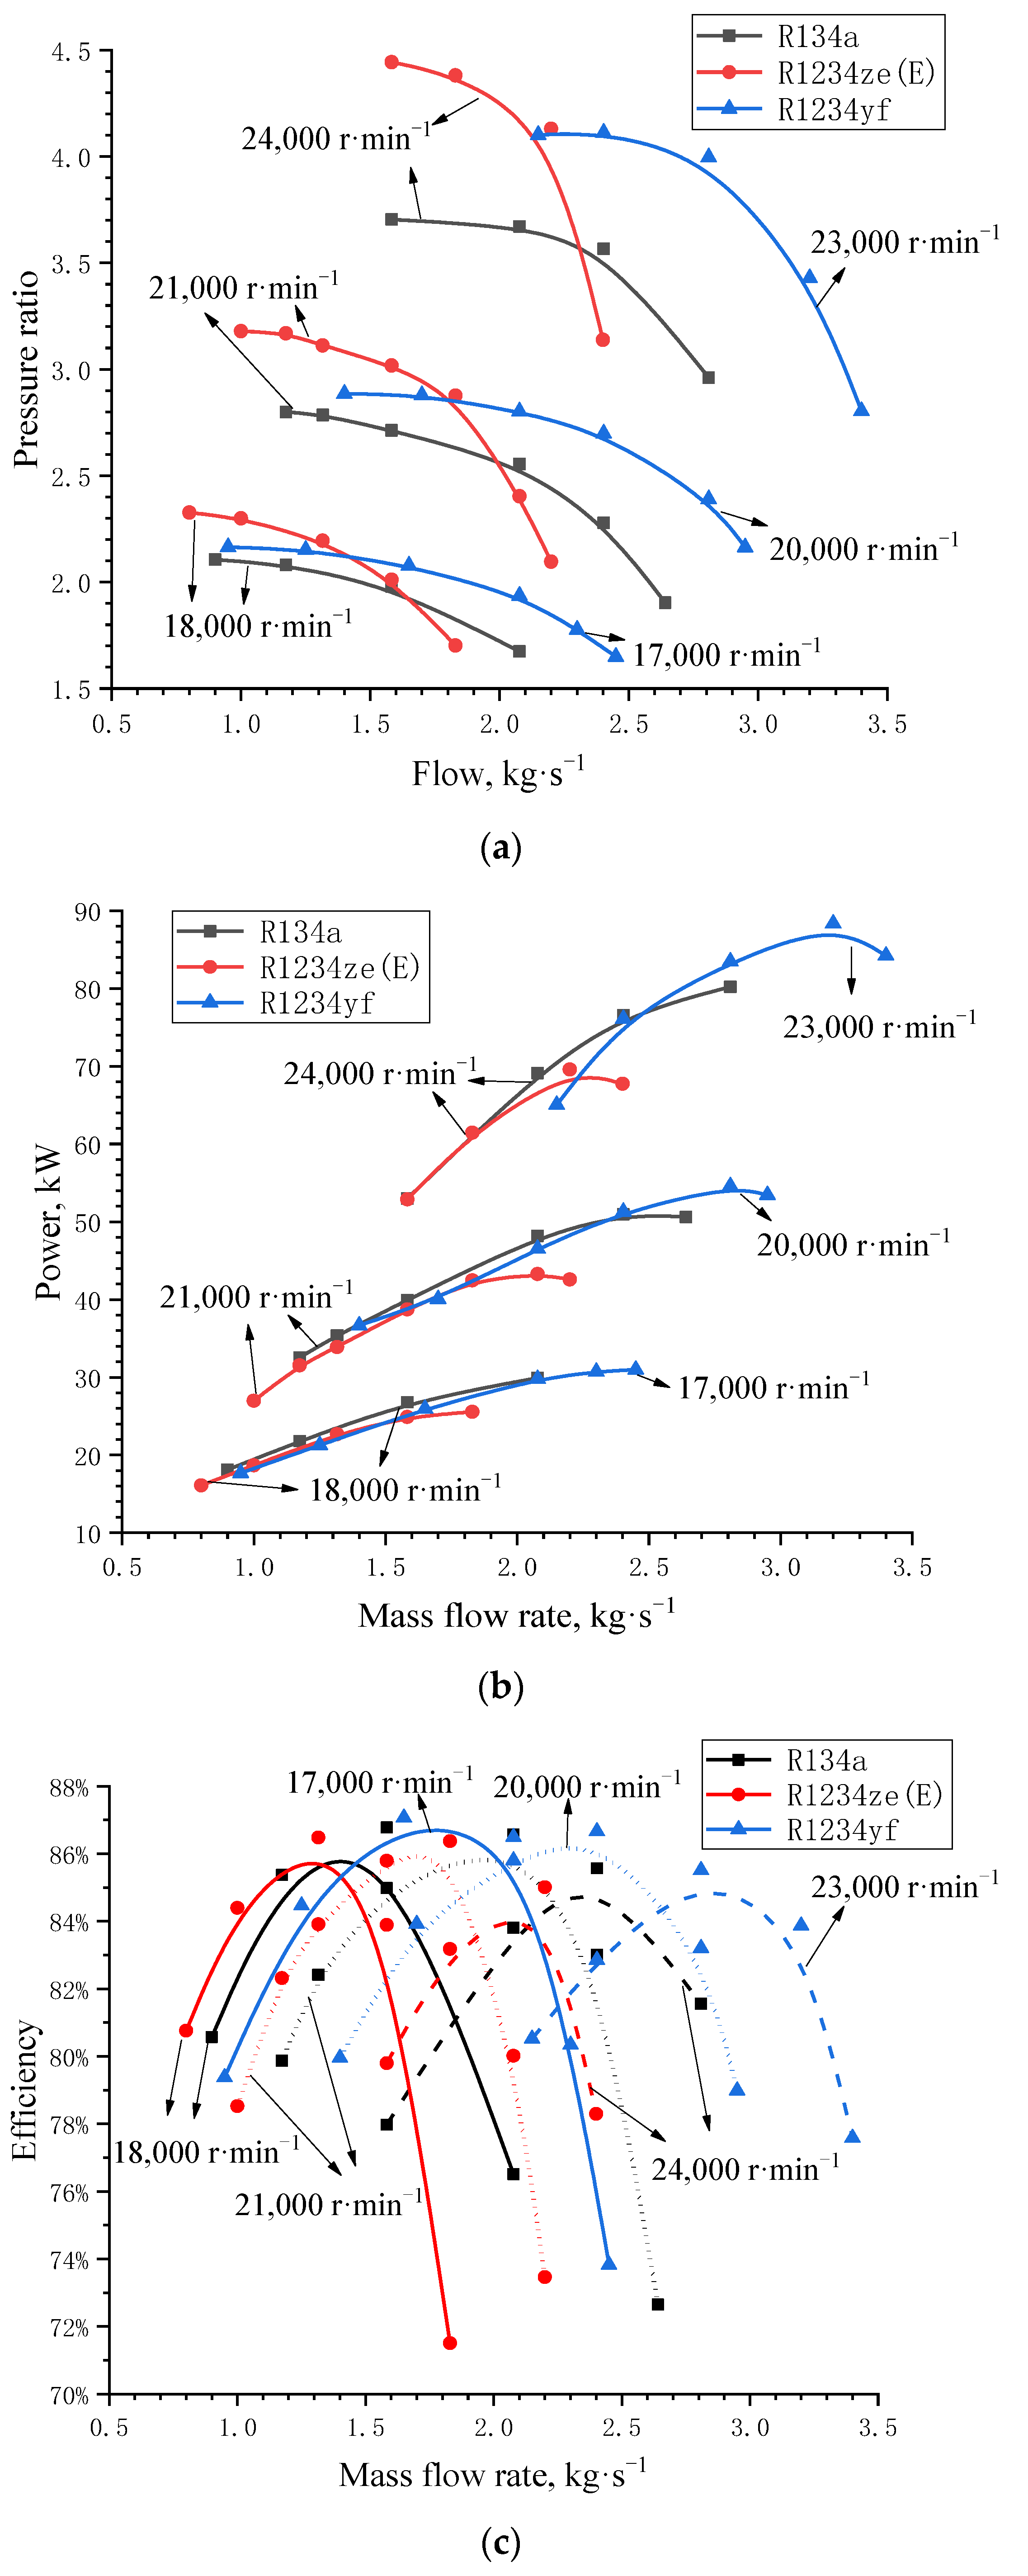
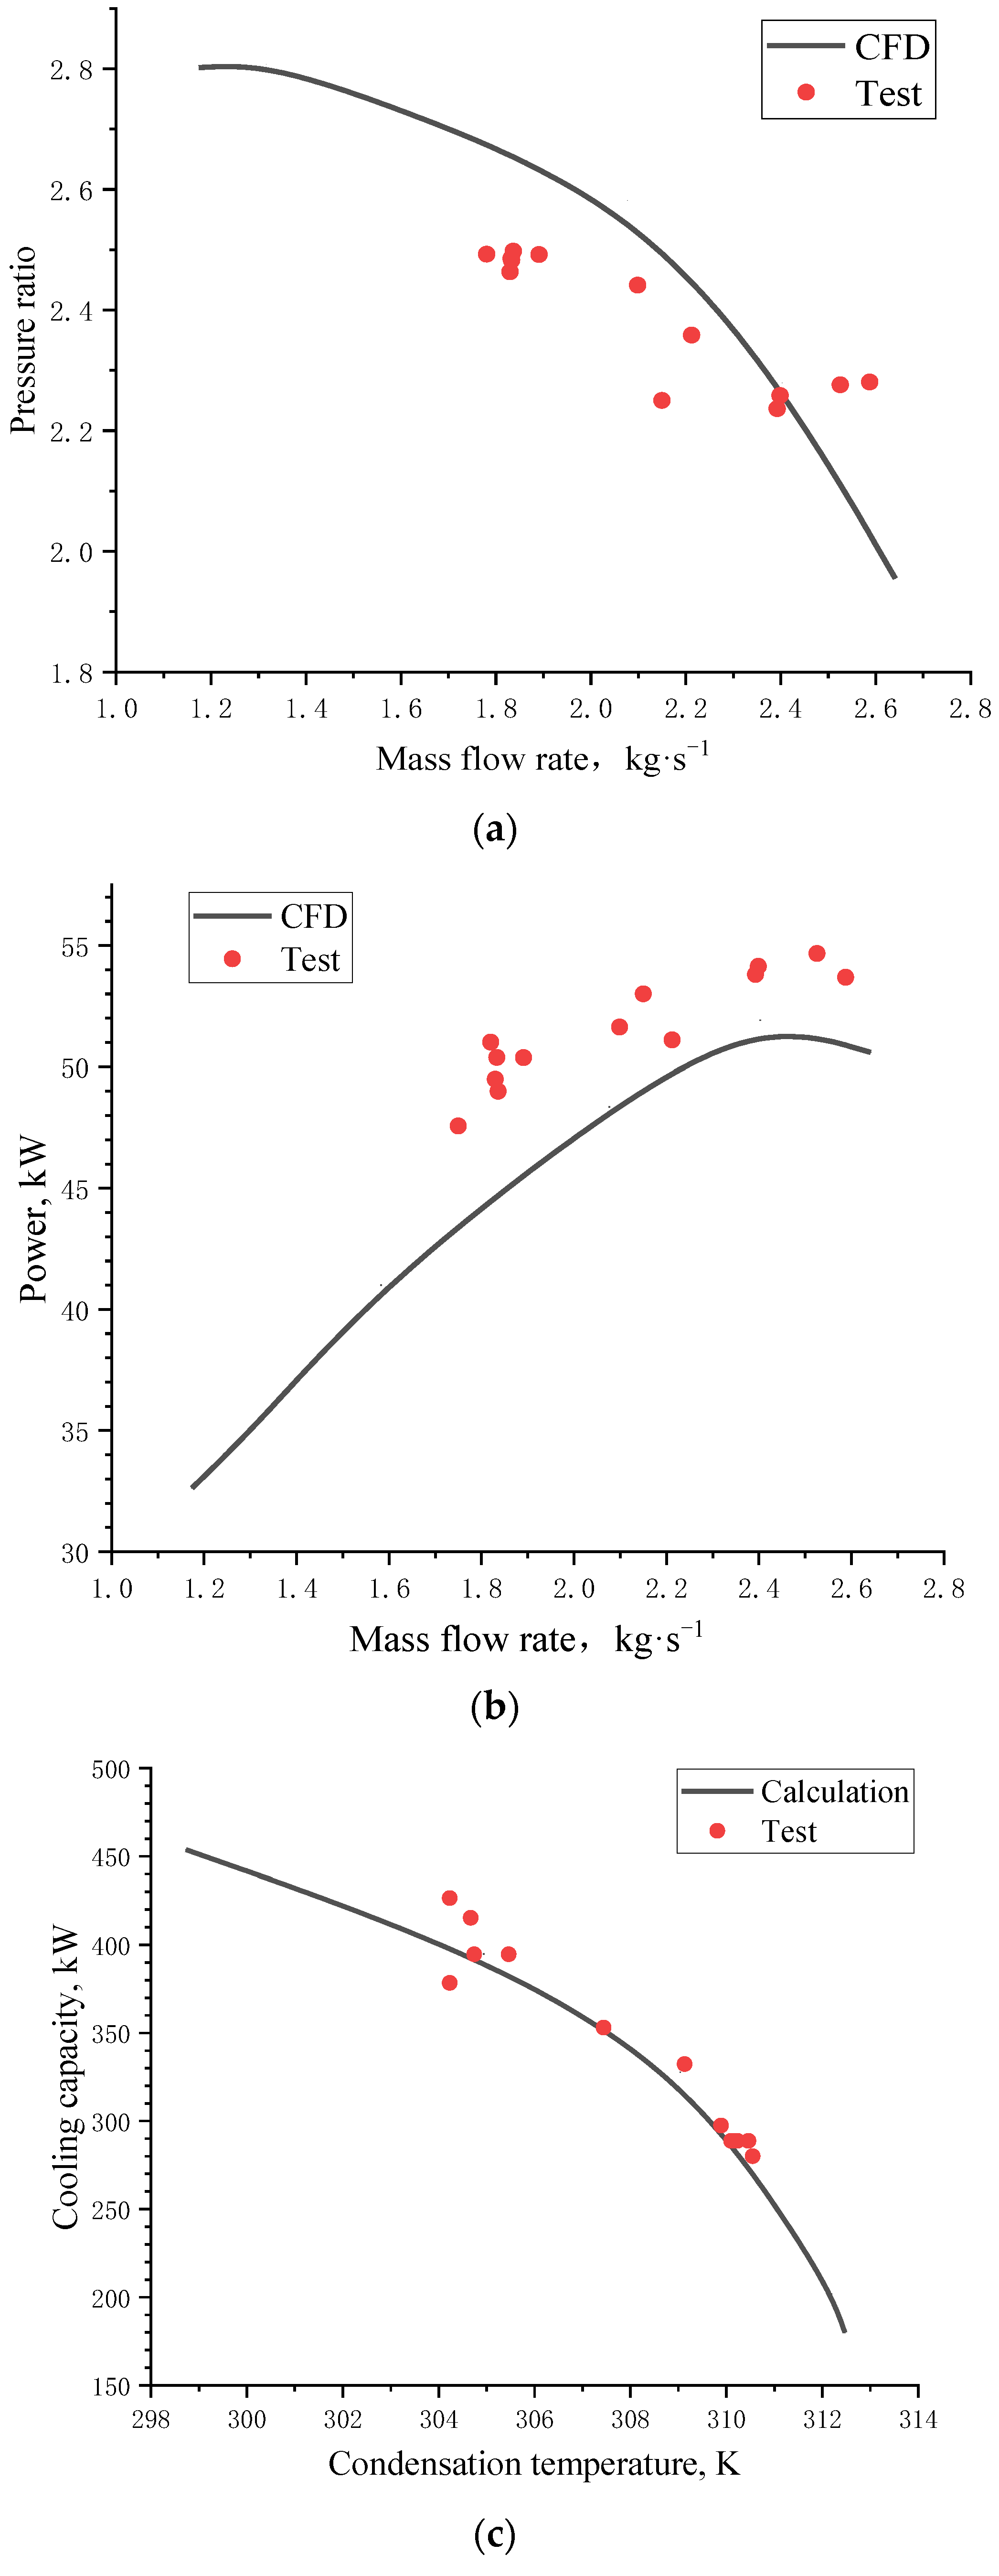
5.1. Centrifugal Compressor Performance

In order to reflect the performance of the compressor under different working conditions, the relationship between the various speeds, inlet flow rate, and outlet pressure (or pressure ratio) of the compressor is usually expressed in the form of curves, which are called the flow characteristic curve or performance curve of the compressor [30].
In this paper, the CFD numerical method was used to calculate the performance curves of the centrifugal refrigeration compressors of the three refrigerants R134a, R1234yf, and R1234ze(E) at a rotational speed of 21,000 r·min−1. Due to their different physical property parameters, their curves are different. The results are shown in Figure 6. Three figures show the relationship of pressure, compressor power, and efficiency with the mass flow rate. The mass flow rate represented by the x-axis is the inlet mass flow rate of the first stage impeller.
Figure 6a show the relationship between the mass flow rate and pressure ratio of the centrifugal compressor. The pressure ratio is defined as the ratio of the outlet pressor of the second stage of the compressor to the inlet pressure of the first stage, which is the total pressure ratio of the compressor. The intermediate injection pressure of gas from the economizer is set the same as the outlet pressure of the first stage compressor. The mass flow rate range of the R134a compressor under the stable working condition is 1.17 kg·s−1 to 2.64 kg·s−1; the mass flow rate range of the R1234ze(E) compressor under the stable working condition is 1.0 kg·s−1 to 2.2 kg·s−1, which is moved to the left and smaller than that of R134a compressor, and the range is smaller by 18.4%; the mass flow rate range of the R1234yf compressor under the stable working condition is 1.58 kg·s−1 to 3.2 kg·s−1, which is moved to the right and larger than that of R134a compressor, and the range is larger by 10.2%. The pressure ratio range of the R134a compressor is 1.9 to 2.8, that of the R1234ze(E) compressor is 2.1 to 3.2, and that of the R1234yf compressor is 2.2 to 3.3. The pressure ratio range of the R1234ze(E) and R1234yf compressor is about 22.2% larger than that of the 134a compressor. Additionally, the pressure ratio curve of R1234ze(E) and R1234yf is higher than that of R134a, which is because the molecular weights of R1234ze(E) and R1234yf are greater than that of 134a. As the molecular weight of gas increases, the pressure ratio curve moves up [31].
When the mass flow rate is less than 2.0 kg·s−1, the pressure ratio of the R1234ze(E) compressor is greater than that of the R134a compressor, and when the flow rate is greater than 2.0 kg·s−1, the pressure ratio of the R134a compressor is greater than that of R1234ze(E) compressor; when the flow rate is the same, the pressure ratio of the R1234yf compressor is greater than that of the R134a compressor and the R1234ze(E) compressor. Compared with R1234yf, the mass flow rate-pressure ratio performance curves of R1234zd(E) and R134a are closer.
Figure 6b show the mass flow rate-power performance curve of the centrifugal compressor. At the same mass flow rate, the power of the R1234ze(E) compressor is less than that of the R134a compressor, and the difference between them increases gradually with the increase of the mass flow rate, the minimum is about 3.1% less, and the maximum is about 10.2% less; the power of the R1234yf compressor is greater than that of the R134a compressor, the minimum is about 9.9% greater, and the maximum is about 23.2% greater.
The mass flow rate–efficiency performance curve of the centrifugal compressor calculated by CFD is shown in Figure 6c. The isentropic efficiency increases first and then decreases with the increase of the flow rate. The maximum isentropic efficiency of the R1234ze€, R134a, and R1234yf compressors are all 86~87%, which indicates that the flow conditions in the compressor are still maintained in a good state after the refrigerant R134a is drop-in replaced by R1234ze(E) or R1234yf.

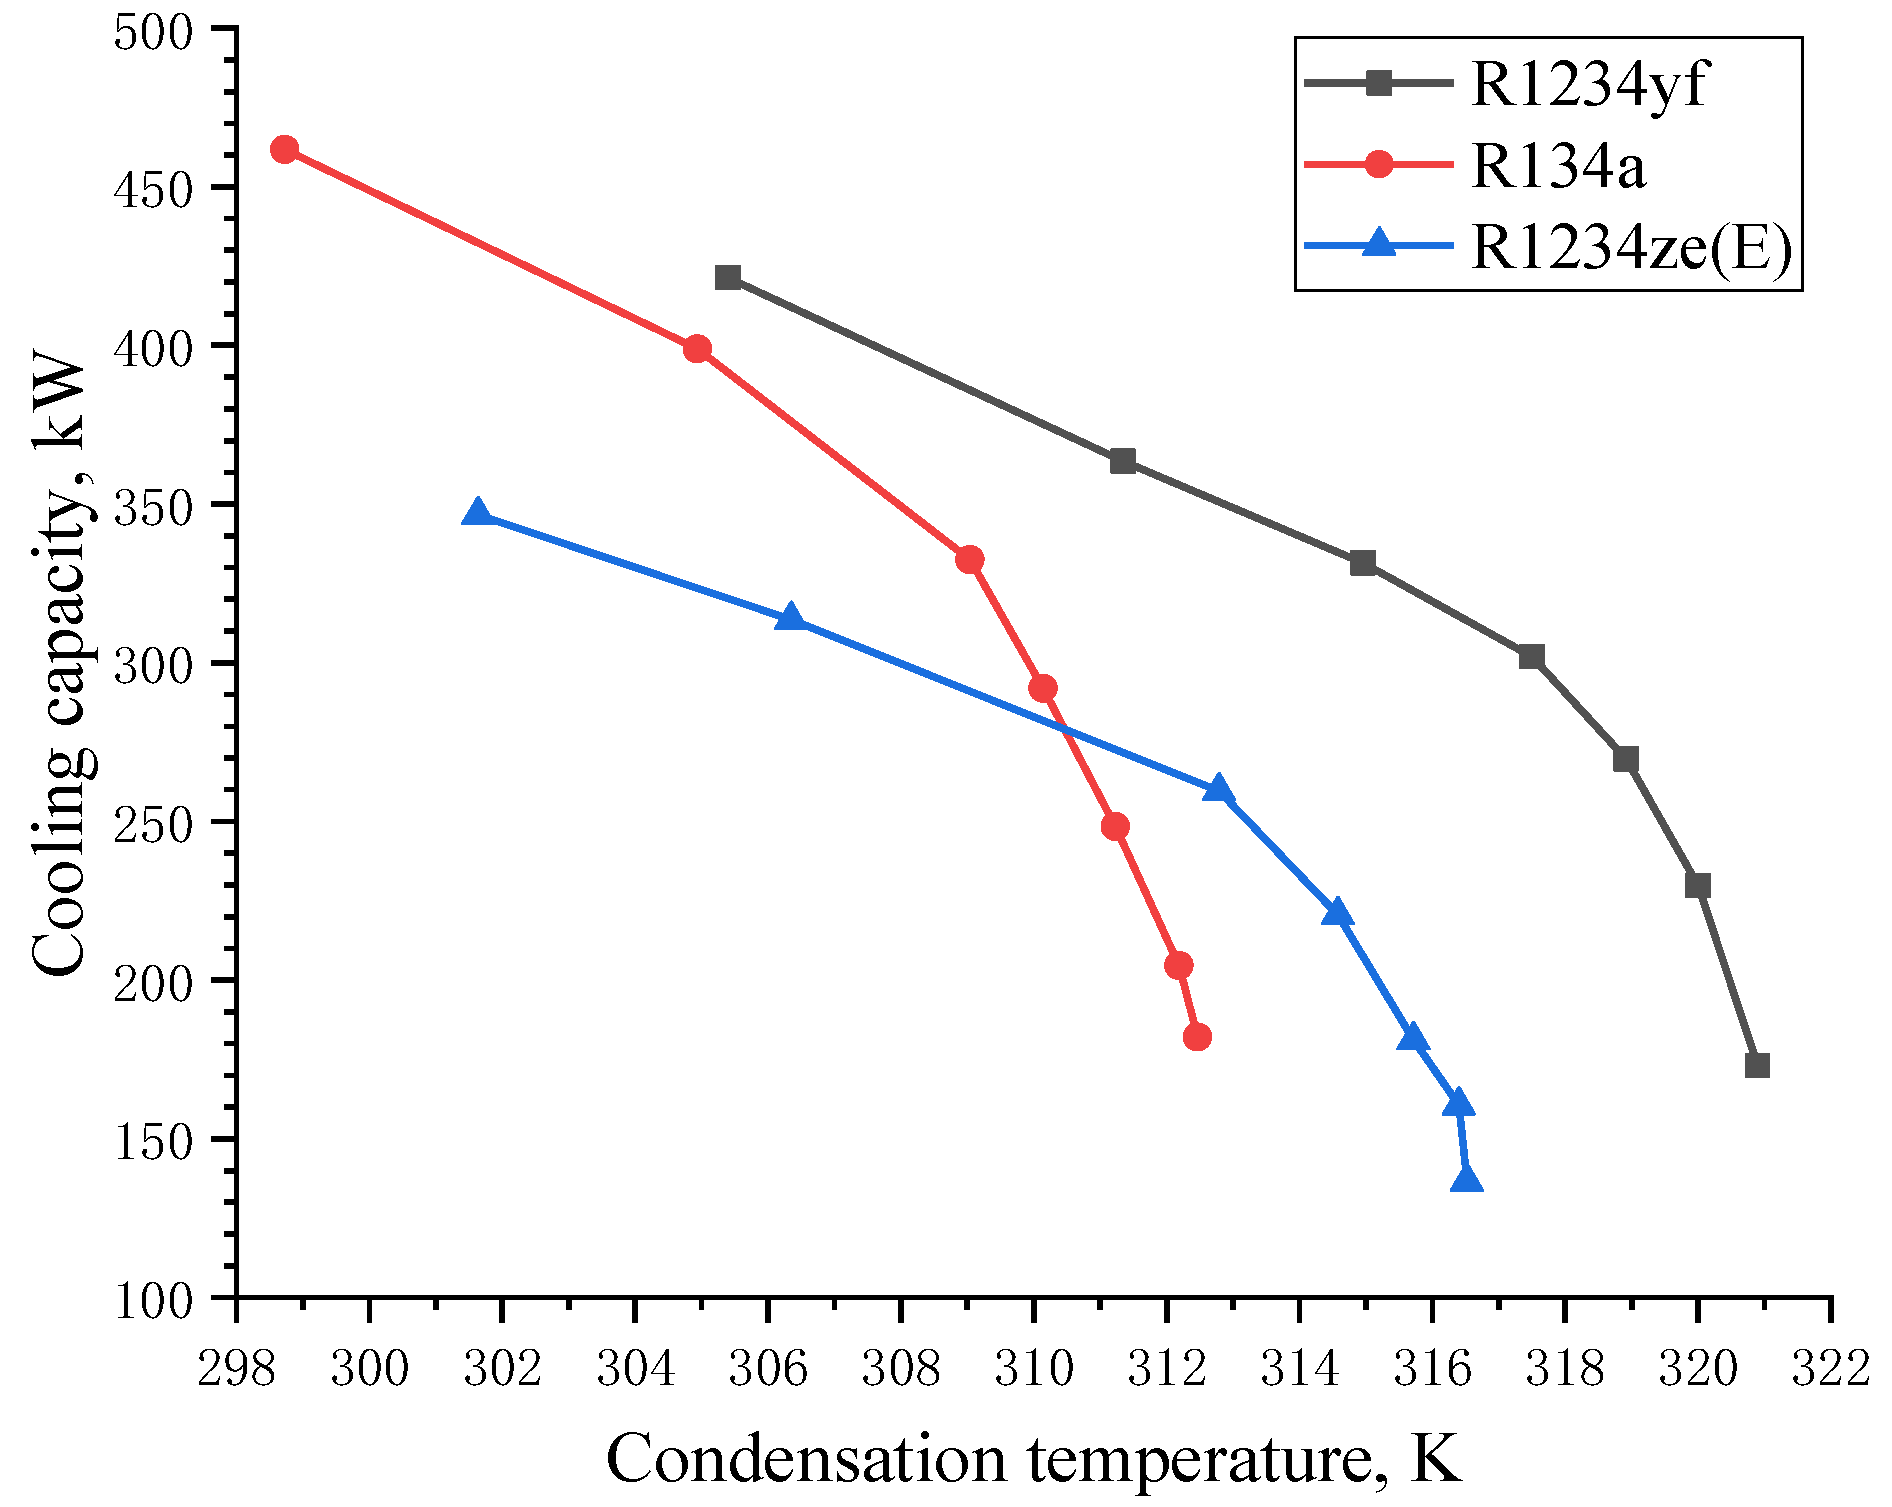
5.2. Cooling Capacity

The cooling capacity at different condensation temperatures is shown in Figure 7. It can be seen that when the condensation temperature is less than 310 K, the cooling capacity of the R1234ze(E) unit is less than that of the R134a unit; when the condensation temperature is greater than 310 K, the cooling capacity of the R1234ze(E) unit is greater than that of the R134a unit; when the condensation temperature is the same, the cooling capacity of the R1234yf unit is greater than that of the R134a unit and the R1234ze(E) unit. Therefore, in the R134a centrifugal chiller, compared to R1234ze(E), directly replacing R134a with R1234yf obtains a higher cooling capacity.

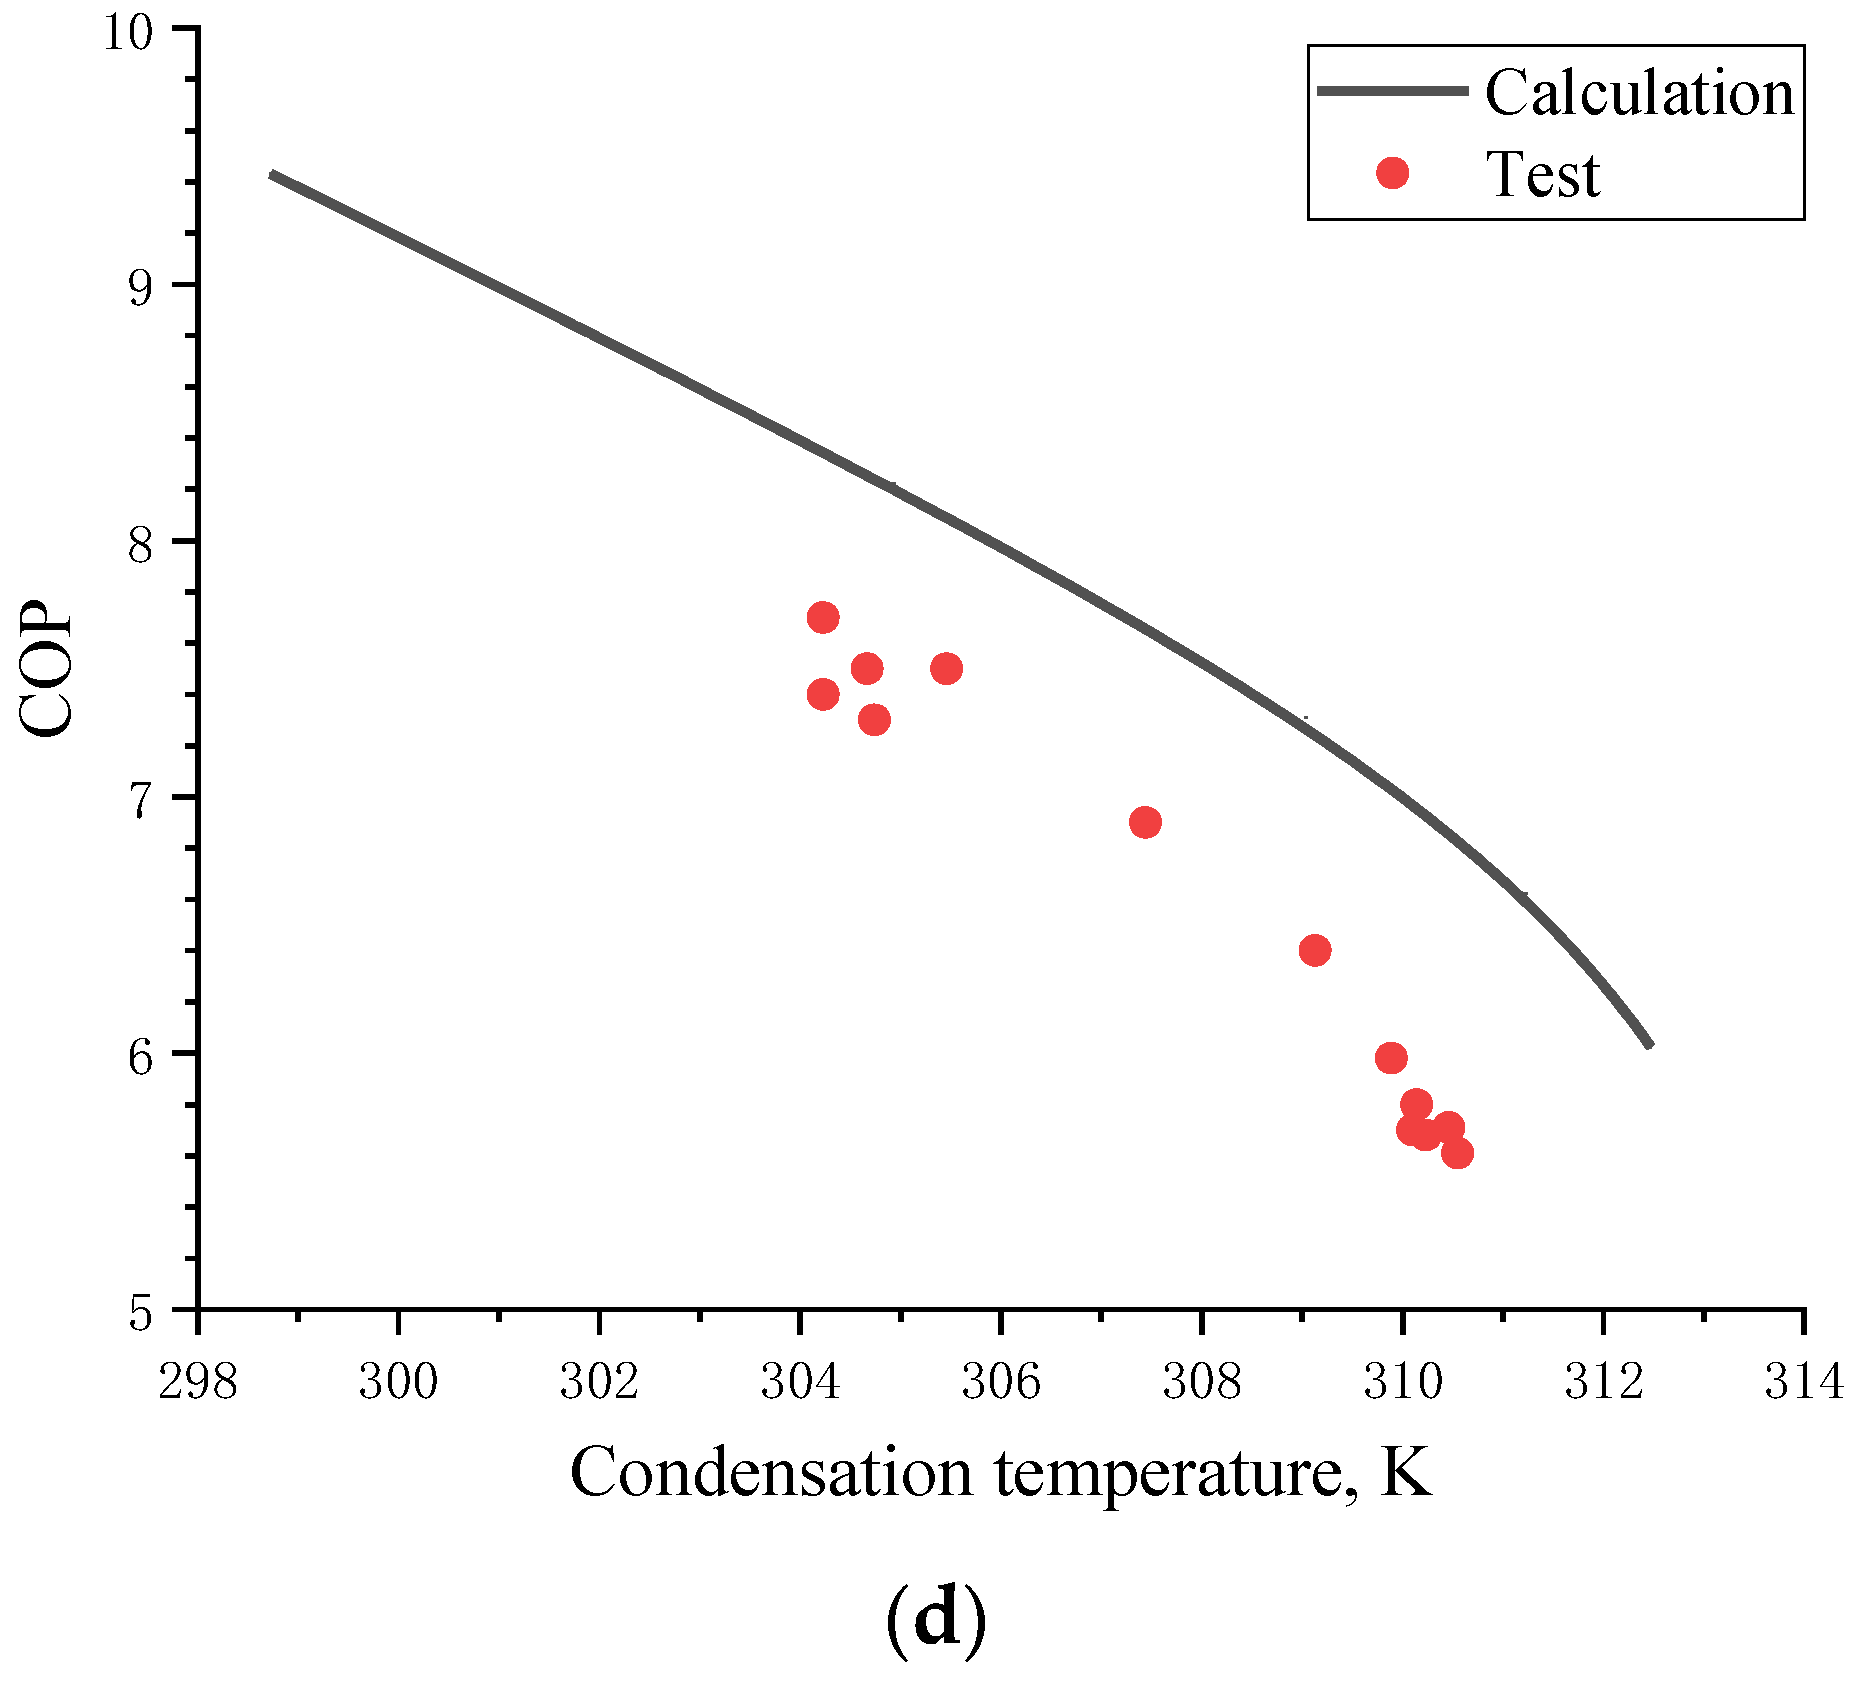
5.3. Coefficient of Performance (COP)

The COP at different condensation temperatures is shown in Figure 8. It can be seen that when the condensation temperature is less than 312 K, the COP of the R1234ze(E) unit is less than that of the R134a unit, which is about 7.0% smaller. When the condensation temperature is the same, the COP of the R1234yf unit is less than that of the R134a unit, which is about 12.5% smaller. Therefore, compared with R1234yf, the reduction of the COP is less when R1234ze(E) is used to replace R134a directly in the R134a centrifugal chiller.

5.4. COP Comparison under Same Conditions

The rotational speeds of the R134a and R1234ze(E) compressors are set as 18,000 r·min−1, 21,000 r·min−1, and 24,000 r·min−1, respectively. When the rotational speed of the R1234yf compressor is the same as that of the R134a compressor, it cannot achieve the same cooling capacity at the same evaporation temperature and condensation temperature, so the rotational speed of the R1234yf compressor is reduced, set to 17,000 r·min−1, 20,000 r·min−1 and 23,000 r·min−1, respectively. The mass flow rate-pressure ratio performance curve of three refrigerants R134a, R1234ze(E), and R1234yf is shown in Figure 9a, the mass flow rate-power performance curve is shown in Figure 9b, and the mass flow rate-efficiency performance curve is shown in Figure 9c.
Figure 10 show the variation of cooling capacity with condensation temperature for R134a, R1234ze(E), and R1234yf units at the same evaporation temperature. When the evaporation temperature, condensation temperature, and cooling capacity of the R134a unit and the R1234ze(E) unit are the same, that is, at the intersection of the black line and the red line in Figure 10, the COP comparison of the two units is shown in Table 5. The COP of the R1234ze(E) unit is reduced by about 5.14% on average compared to that of the R134a unit. When the evaporation temperature, condensation temperature, and cooling capacity of the R134a unit and the R1234yf unit are the same, that is, at the intersection of the black line and the blue line in Figure 10, the COP comparison of the two units is shown in Table 6. The COP of the R1234yf unit is reduced by about 8.93% on average compared to that of the R134a unit.

5.5. Results Verification

This model can run stably in the experiment of the R134a centrifugal water chiller. At the rotating speed of 21,000 r·min−1, the comparisons between the compressor pressure ratio and power calculated by the CFD method and the system cooling capacity and COP calculated by the thermodynamic analysis method and the experimental values are shown in Figure 11. It can be seen that they are relatively close, indicating that the results in this paper are reliable. The reason for the difference is that there will be some flow losses in the experiment, which are not considered in the CFD calculation.

6. Conclusions

In this paper, the CFD numerical method is used to simulate the internal flow of the centrifugal refrigeration compressor, which uses R134a, R1234yf, and R1234ze(E) as refrigerants, respectively. For the R134a centrifugal chiller, the refrigerant is drop-in replaced by R1234yf and R1234ze(E), and the refrigeration performance is compared and analyzed by thermodynamic analysis method under the set working conditions. The main conclusions are as follows: the mass flow rate range of the R1234ze(E) compressor is moved to the left and is smaller than that of the R134a compressor; that of the R1234yf compressor is moved to the right and is larger than that of the R134a compressor. The pressure ratio curve of R1234ze(E) and R1234yf is higher than that of R134a.
At the same mass flow rate, the power of the R1234ze(E) compressor is 3.5% lower than that of the R134a compressor. Additionally, the power of the R1234yf compressor is 13.7% larger than that of the R134a compressor.
At the same rotational speed, in the R134a centrifugal chiller, although using R1234yf to directly replace R134a can obtain higher cooling capacity, the COP is reduced by about 12.5%; using R1234ze(E) to replace R134a can reduce the cooling capacity under certain conditions, the COP is reduced by about 7.0%.
When the evaporation temperature, condensation temperature, and cooling capacity of the R134a unit and the R1234ze(E) unit are the same, the COP of the R1234ze(E) unit is reduced by about 5.14% on average than that of the R134a unit. Additionally, the COP of the R1234yf unit is reduced by about 8.93% on average compared to that of the R134a unit. Therefore, in the R134a centrifugal chiller, compared with R1234yf, directly replacing R134a with R1234ze(E) can obtain better refrigeration performance.
The model can run stably in the experiment of the R134a centrifugal water chiller. The experimental results are relatively close to the calculated results in this paper, which verifies that the results in this paper are reliable.
In this paper, only the drop-in replacement of centrifugal compressors in the R134a centrifugal chiller is studied, and the replacement of heat exchangers and other parts in the system is not considered. Hence, research on the whole system of the drop-in replacement of R134a should be carried out in the future. In addition, relevant experimental research should be carried out in the future.

Author Contributions

Methodology, Y.Z., K.Y., G.L., Q.Y., G.Y. and L.L.; writing—original draft, K.Y.; writing—review and editing, Y.Z. All authors have read and agreed to the published version of the manuscript.

Funding

The work was financially supported by the Taishan Scholar Program of Shandong (No. tsqn 201812073).

Data Availability Statement

Data is contained within the article.

Conflicts of Interest

The authors declare no conflict of interest.

References

  1. Meng, Z.; Zhang, H.; Qiu, J.; Lei, M. Theoretical analysis of R1234ze(E), R152a, and R1234ze(E)/R152a mixtures as replacements of R134a in vapor compression system. Adv. Mech. Eng. 2016, 8, 1–10. [Google Scholar] [CrossRef] [Green Version]
  2. Park, J.; Shin, Y.; Chung, J. Performance Prediction of Centrifugal Compressor for Drop-In Testing Using Low Global Warming Potential Alternative Refrigerants and Performance Test Codes. Energies 2017, 10, 2043. [Google Scholar] [CrossRef] [Green Version]
  3. Atmaca, A.U.; Erek, A.; Ekren, O. Investigation of new generation refrigerants under two different ejector mixing theories. Energy Procedia 2017, 136, 394–401. [Google Scholar] [CrossRef]
  4. Jribi, S.; Saha, B.B.; Koyama, S.; Chakraborty, A.; Ng, K.C. Study on activated carbon/HFO-1234ze(E) based adsorption cooling cycle. Appl. Therm. Eng. 2013, 50, 1570–1575. [Google Scholar] [CrossRef]
  5. Janković, Z.; Sieres Atienza, J.; Martínez Suárez, J.A. Thermodynamic and heat transfer analyses for R1234yf and R1234ze(E) as drop-in replacements for R134a in a small power refrigerating system. Appl. Therm. Eng. 2015, 80, 42–54. [Google Scholar] [CrossRef]
  6. Sieres, J.; Santos, J.M. Experimental analysis of R1234yf as a drop-in replacement for R134a in a small power refrigerating system. Int. J. Refrig. 2018, 91, 230–238. [Google Scholar] [CrossRef]
  7. Lee, Y.; Jung, D. A brief performance comparison of R1234yf and R134a in a bench tester for automobile applications. Appl. Therm. Eng. 2012, 35, 240–242. [Google Scholar] [CrossRef]
  8. Pabon, J.J.G.; Khosravi, A.; Belman-Flores, J.M.; Machado, L.; Revellin, R. Applications of refrigerant R1234yf in heating, air conditioning and refrigeration systems: A decade of researches. Int. J. Refrig. 2020, 118, 104–113. [Google Scholar] [CrossRef]
  9. Niu, Y.; Liu, J.; Zhou, Y.; Lin, E. General introduction of R1234yf and R1234ze(E). Refrig. Air Cond. 2015, 15, 82–91. [Google Scholar]
  10. Zhang, X.; Liu, X.; Li, J.; Wu, J.; Wang, R. Status and development trend of products and technologies for industrial and commercial refrigerant compressor. Refrig. Air Cond. 2017, 17, 49–57. [Google Scholar]
  11. Aral, M.C.; Suhermanto, M.; Hosoz, M. Performance evaluation of an automotive air conditioning and heat pump system using R1234yf and R134a. Sci. Technol. Built Environ. 2020, 27, 44–60. [Google Scholar] [CrossRef]
  12. Qi, Z. Performance improvement potentials of R1234yf mobile air conditioning system. Int. J. Refrig. 2015, 58, 35–40. [Google Scholar] [CrossRef]
  13. Mota-Babiloni, A.; Navarro-Esbrí, J.; Barragán, Á.; Molés, F.; Peris, B. Drop-in energy performance evaluation of R1234yf and R1234ze(E) in a vapor compression system as R134a replacements. Appl. Therm. Eng. 2014, 71, 259–265. [Google Scholar] [CrossRef] [Green Version]
  14. Chen, X.; Liang, K.; Li, Z.; Zhao, Y.; Xu, J.; Jiang, H. Experimental assessment of alternative low global warming potential refrigerants for automotive air conditioners application. Case Stud. Therm. Eng. 2020, 22, 100800. [Google Scholar] [CrossRef]
  15. Yang, C.; Nalbandian, H.; Lin, F. Flow Boiling Heat Transfer and Pressure Drop of Refrigerants HFO-1234yf and HFO-134a in Small Circular Tube. Int. J. Heat Mass Transf. 2018, 121, 726–735. [Google Scholar] [CrossRef]
  16. Yang, C.; Nalbandian, H. Condensation Heat Transfer and Pressure Drop of Refrigerants HFO-1234yf and HFO-134a in Small Circular Tube. Int. J. Heat Mass Transf. 2018, 127, 218–227. [Google Scholar] [CrossRef]
  17. Nagata, R.; Kondou, C.; Koyama, S. Comparative Assessment of Condensation and Pool Boiling Heat Transfer on Horizontal Plain Single Tubes for R1234ze(e), R1234ze(z), and R1233zd(e). Int. J. Refrig. 2016, 63, 157–170. [Google Scholar] [CrossRef] [Green Version]
  18. Ubara, T.; Asano, H.; Sugimoto, K. Falling film evaporation and pool boiling heat transfer of R1233zd(E) on thermal spray coated tube. Appl. Therm. Eng. 2021, 196, 117329. [Google Scholar] [CrossRef]
  19. Elbarghthi, A.F.A.; Mohamed, S.; Nguyen, V.V.; Dvorak, V. CFD Based Design for Ejector Cooling System Using HFOS (1234ze(E) and 1234yf). Energies 2020, 13, 1408. [Google Scholar] [CrossRef] [Green Version]
  20. Nguyen, V.V.; Varga, S.; Dvorak, V. HFO1234ze(e) As an Alternative Refrigerant for Ejector Cooling Technology. Energies 2019, 12, 4045. [Google Scholar] [CrossRef] [Green Version]
  21. Bansal, P.; Shen, B. Analysis of environmentally friendly refrigerant options for window air conditioners. Sci. Technol. Built Environ. 2015, 21, 483–490. [Google Scholar] [CrossRef]
  22. Uusitalo, A.; Turunen-Saaresti, T.; Honkatukia, J.; Tiainen, J.; Jaatinen-Värri, A. Numerical analysis of working fluids for large scale centrifugal compressor driven cascade heat pumps upgrading waste heat. Appl. Energy 2020, 269, 115056. [Google Scholar] [CrossRef]
  23. Wu, D.; Hu, B.; Wang, R.Z. Vapor compression heat pumps with pure Low-GWP refrigerants. Renew. Sustain. Energy Rev. 2021, 138, 110571. [Google Scholar] [CrossRef]
  24. Xue, F.; Su, X.; Wang, Z. Application study of R1233zd(E) into centrifugal chiller. Refrig. Air Cond. 2019, 19, 24–29. [Google Scholar]
  25. JB/T 12843-2016; Centrifugal Refrigerant Compressors. Ministry of Industry and Information Technology of the People’s Republic China: Beijing, China, 2016. (In Chinese)
  26. Pakle, S.; Jiang, K. Design of a transonic centrifugal compressor for High-speed turbomachinery. Proc. Inst. Mech. Eng. Part C J. Mech. Eng. Sci. 2020, 235, 2112–2125. [Google Scholar] [CrossRef]
  27. Lemmon, E.W.; Huber, M.L.; McLinden, M.O. NIST Standard Reference Database 23: Reference Fluid Thermodynamic and Transport Properties—REFPROP. 9.0; NIST NSRDS: Gaithersburg, MD, USA, 2010. [Google Scholar]
  28. Salhi, K.; Mohamed Ramadan, K.; Hadjiat, M.M.; Hamidat, A. Energetic and Exergetic Performance of Solar-Assisted Direct Expansion Air-Conditioning System with Low-GWP Refrigerants in Different Climate Locations. Arab. J. Sci. Eng. 2020, 45, 5385–5398. [Google Scholar] [CrossRef]
  29. De Paula, C.H.; Duarte, W.M.; Rocha, T.T.M.; de Oliveira, R.N.; Mendes, R.d.P.; Maia, A.A.T. Thermo-economic and environmental analysis of a small capacity vapor compression refrigeration system using R290, R1234yf, and R600a. Int. J. Refrig. 2020, 118, 250–260. [Google Scholar] [CrossRef]
  30. Xue, X.; Wang, T. Stall recognition for centrifugal compressors during speed transients. Appl. Therm. Eng. 2019, 153, 104–112. [Google Scholar] [CrossRef]
  31. Ma, X. Research on Performance Optimization and State Evaluation Methods of Centrifugal Compressors; Southwest Petroleum University: Chengdu, China, 2013. [Google Scholar]
Figure 1. Thermodynamic figure comparison of 4 refrigerants: (a) Pressure-enthalpy diagram, (b) Pressure-temperature diagram.
Energies 15 02552 g001
Figure 2. Schematic and pressure-diagrams of refrigeration system: (a) Schematic; (b) Pressure-enthalpy.
Energies 15 02552 g002
Figure 3. Model of impeller, diffuser, and volute.
Energies 15 02552 g003
Figure 4. Mesh independence verification.
Energies 15 02552 g004
Figure 5. Mesh of impeller, diffuser, and volute.
Energies 15 02552 g005
Figure 6. Performance curve of centrifugal compressor: (a) Mass flow rate-pressure ratio performance curve; (b) Mass flow rate-power performance curve; (c) Mass flow rate-efficiency performance curve.
Energies 15 02552 g006aEnergies 15 02552 g006b
Figure 7. Cooling capacity at different condensation temperatures.
Energies 15 02552 g007
Figure 8. COP at different condensation temperatures.
Energies 15 02552 g008
Figure 9. Performance curve of centrifugal compressor: (a) Mass flow rate-pressure ratio performance curve; (b) Mass flow rate-power performance curve; (c) Mass flow rate-efficiency performance curve.
Energies 15 02552 g009
Figure 10. Diagram of the change of cooling capacity with condensation temperatures.
Energies 15 02552 g010
Figure 11. Verification of calculated and experimental: (a) Mass flow rate-pressure ratio performance curve; (b) Mass flow rate-power performance curve; (c) Cooling capacity at different condensation temperatures; (d) COP at different condensation temperatures.
Energies 15 02552 g011aEnergies 15 02552 g011b
Table 1. Main physical property parameters of refrigerants.
R134aR1234yfR1234ze(E)R1233zd(E)
Molecular formulaCH2FCF3C3H2F4C3H2F4C3H2ClF3
Molecular weight102.0114.04114.04130.5
Critical pressure (MPa)4.0593.3823.6363.624
Critical temperature (°C)101.694.7109.4166.5
Normal boiling point (°C)−26.07−29.45−18.9718.3
GWP1430461
ODP0000
Security levelA1A2LA1A1
Table 2. Cooling capacity per unit volume of 4 refrigerant units.
R134aR1234yfR1234ze(E)R1233zd(E)
Evaporation temperature (°C)5.55.55.55.5
Condensation temperature (°C)37373737
Superheating temperature (°C)3333
Subcooling temperature (°C)4444
Cooling capacity (kJ·m−3)2717.42590.82033.0593.1
Table 3. Working conditions of centrifugal chiller system.
R134aR1234yfR1234ze(E)R1233zd(E)
Evaporation temperature (°C)5.5
Evaporation pressure (kPa)355.78379.04263.9660.707
Condensation pressure (kPa)Set according to different working conditions
Superheating temperature (°C)3
Subcooling temperature (°C)4
Table 4. Main design parameters of centrifugal compressor.
Design ParametersFirst Stage ImpellerSecond Stage Impeller
Impeller hub diameter (mm)25.037.0
Impeller inlet diameter (mm)66.764.5
Impeller outlet diameter (mm)127.2114.3
Impeller outlet width (mm)5.74.9
Number of blades1616
Diffuser inlet radius (mm)66.059.5
Diffuser outlet radius (mm)94.085.4
Diffuser width (mm)6.75.8
Radius at 0° of volute profile (mm)94.085.4
Radius at 360° of volute profile (mm)138.7131.4
Table 5. COP comparison of R1234ze(E) unit and R134a unit.
Condensation Temperature (K)COP of R134aCOP of R1234ze(E)Percentage of Reduction
300.810.3609.8225.19%
310.56.8526.4775.47%
322.84.4354.2244.76%
Table 6. COP comparison of R1234yf unit and R134a unit.
Condensation Temperature (K)COP of R134aCOP of R1234ze(E)Percentage of Reduction
296.012.31811.4626.95%
305.28.1637.4169.15%
319.44.9904.45710.7%
Publisher’s Note: MDPI stays neutral with regard to jurisdictional claims in published maps and institutional affiliations.

