Article

An FEA-Assisted Decision-Making Framework for PEMFC Gasket Material Selection

by
Kang-Min Cheon
,
Ugochukwu Ejike Akpudo
,
Akeem Bayo Kareem
,
Okwuosa Chibuzo Nwabufo
,
Hyeong-Ryeol Jeon
and
Jang-Wook Hur
*
Department of Mechanical Engineering (Department of Aeronautics, Mechanical and Electronic Convergence Engineering), Kumoh National Institute of Technology, 61 Daehak-ro, Gumi-si 39177, Korea
*
Author to whom correspondence should be addressed.
Energies 2022, 15(7), 2580; https://doi.org/10.3390/en15072580
Submission received: 17 February 2022 / Revised: 24 March 2022 / Accepted: 25 March 2022 / Published: 1 April 2022
(This article belongs to the Special Issue Control Part of Cyber-Physical Systems: Modeling, Design and Analysis)

Abstract

:
Recent research studies on industrial cyber-physical systems (ICPSs) have witnessed vast patronage with emphasis on data utility for improved design, maintenance, and high-level decision making. The design of proton-exchange membrane fuel cells (PEMFC) is geared towards improving performance and extending life cycles. More often, material selection of PEMFC components contributes a major determining factor for efficiency and durability with the seal/gasket quality being one of the most critical components. Finite element analysis (FEA) offers a simulated alternative to real-life stress analysis of components and has been employed on different rubber-like gasket materials for hydrogen fuel cells for determining an optimal strain energy density function using different hyperelastic models following uniaxial tensile testing. The results show that the Mooney–Rivlin, Ogden, and Yeoh models were the most fitting model with the best stress–strain fit following a weighted error evaluation criteria which returned 18.54%, 19.31%, and 21.96% for 25% displacement, and 22.1%, 21.7%, and 21.17% for 40% displacements, respectively. Further empirical analysis using the multi-metric regression technique for compatibility testing (curve similarity) between the hyperelastic model outputs and the tensile data reveal that the Yeoh model is the most consistent as seen in the marginal error difference amidst increasing displacement while the Arruda–Boyce model is most inconsistent as shown in the high error margin as the displacement increases from 25% to 40%. Lastly, a comparative assessment between different rubber-like materials (RLM) was presented and is expected to contribute to improved decision-making and material selection.

1. Introduction

PEMFC achieve a low-carbon society, with hydrogen serving as an energy transporter. In many zero-emission applications, hydrogen, like other zero-emission energy sources, produces a steady and carbon-free path to generate power that is flexible and dependable, and have improved over time in comparison to traditional energy sources. On one hand, hydrogen fuel cell (HFC) is associated with advantages like high performance, durability, reduced time-to-market, and environmental friendliness [1]. On the other hand, there is a need to address issues like the production cost, durability, and reliability of the fuel cell system for mass production. Particularly, the inherent system degradation as a result of component wear, prolonged usage, and uncertainties have motivated the need for improved design, decision-making, and material selection [2].
Popularly known as HFC gaskets, the PEMFC gas diffusion layer (GDL) is one of the most critical components of the PEMFC that demands material quality and design compatibility to ensure long-term PEMFC stack firmness and sealing. To minimize leakage and guarantee good electrical conductivity, the fuel cell components must be mechanically held together. Gas leaks in fuel cells not only reduce performance but also create potentially dangerous circumstances. Because of the need for tightness and minimal contact resistance, stack design requires high compression pressure values. Over-compressing fuel cell components, such as the gas diffusion layer (GDL), disrupts their porous architectures, lowering the fuel cell’s performance [3]. For instance, the brittleness of the graphite-based plates can cause the bipolar plates (BPP) to break while over-compressing fuel cell components, like the (GDL) disrupts their porous architectures, thereby lowering the fuel cell’s performance [3]. Consequently, it becomes critical to achieve a homogeneous internal stress distribution for each cell component. Undoubtedly, stack design parameters directly affect the performance of a PEMFC and its product lifespan. This presents the need for stress tests and analysis under diverse loading (and harsh) conditions to ascertain the quality of the GDL. Fortunately, non-destructive tests accompanied with FEA-based tests provide an ample opportunity for conducting these tests reliably.
Prior to existing knowledge, the questions—which hyperelastic model(s) should be prioritized for FEA-assisted material selection? Which of the popularly available materials should be prioritized during manufacturing? How possible is it to design a decision-making paradigm that integrates both factors (based on compatibility) for improved model and material selection?—remain a major motivation for our study. In the quest for evaluating the strengths and weaknesses of hyperelastic models using FEA (and empirically)-assisted tensile testing on different materials, this study makes the following contributions:
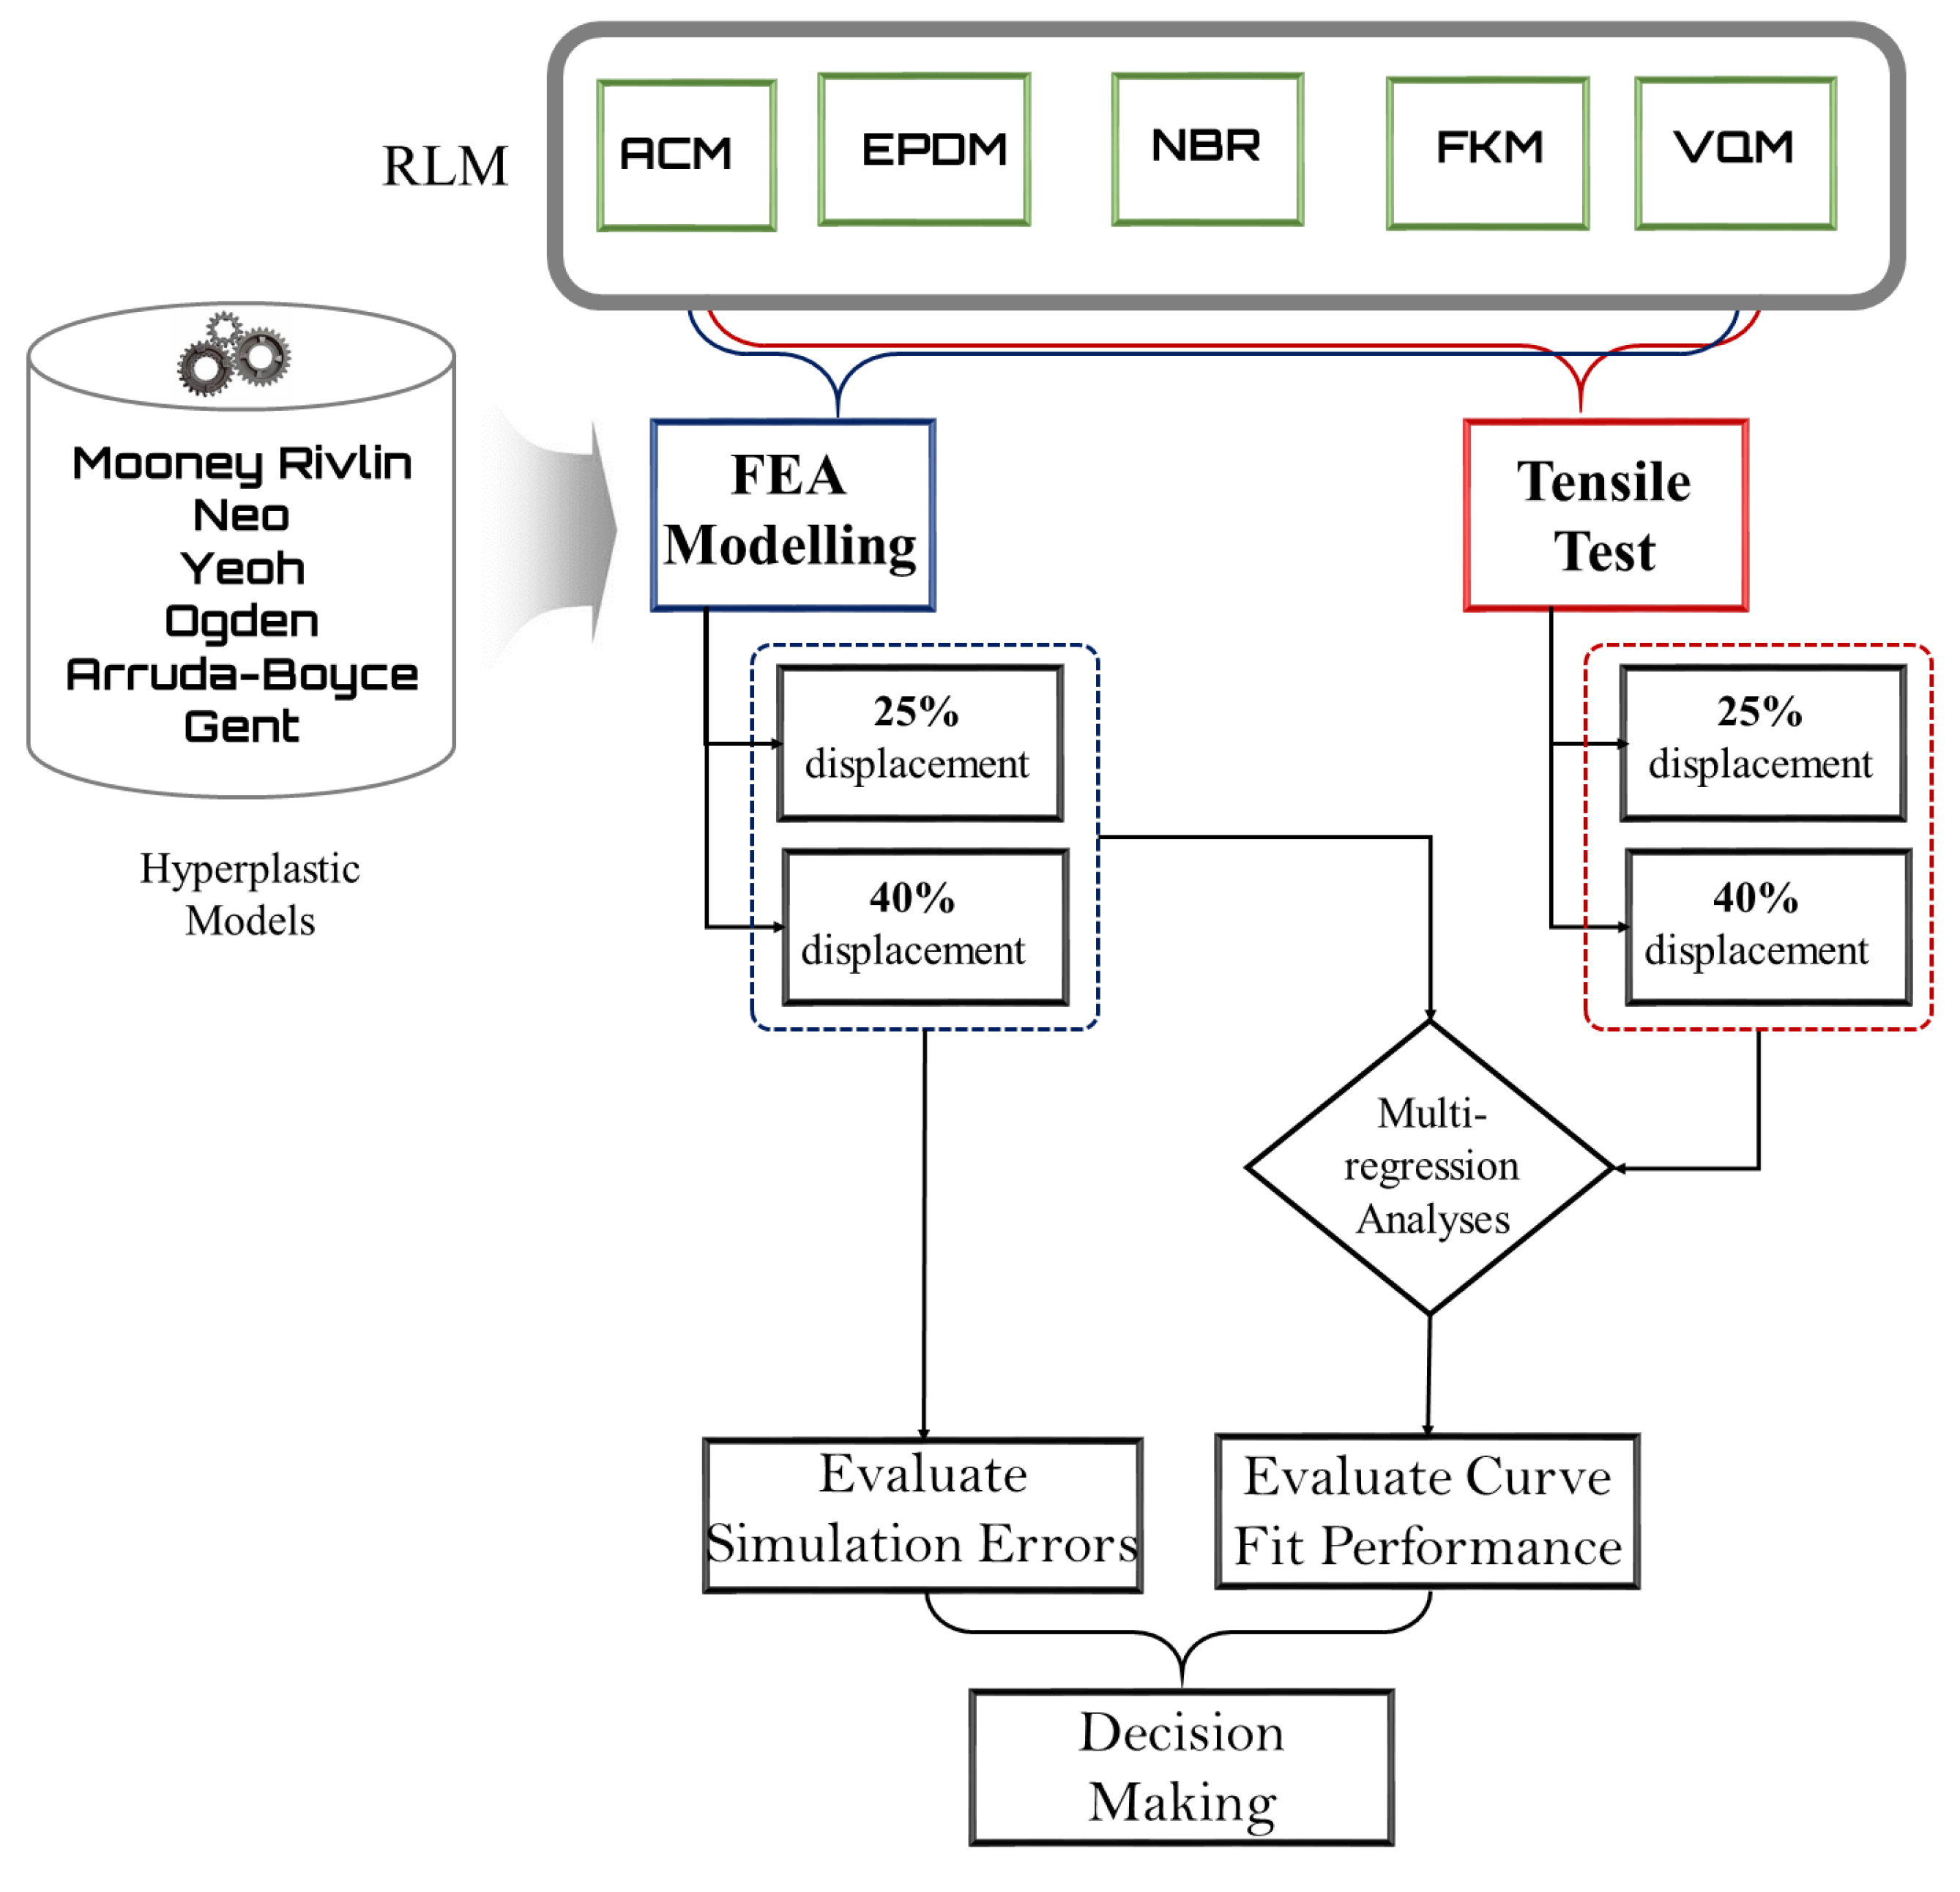
  • Discovery of and validation of optimal material models (and parameters) between widely-recommended models using FEA-assisted evaluations and tensile testing results.
  • Proposal of a reliable (and comprehensive) evaluation paradigm for the choice of (and validation) of material model—a multi-metric regression analysis which compares the hypereleastic models’ fitness based on a weighted averaged sum of the curve fitting errors between the simulated and real stress–strain curves of the respective models.
  • Extensive empirical and descriptive deductions are presented for the material model comparison and the rationale between the material selection criteria between the RLMs.
The rest of the paper is organised thusly: Section 2 presents the motivation for the proposed study alongside related works. Section 3 provides the decision-making paradigm for material (and model) selection while Section 4 presents the exploratory and empirical analysis. Section 5 discusses the paper with inherent issues/limitations and future works while Section 6 concludes the paper.

2. Motivation, Related Works, and Literature Review

Amidst the abundance of available options in the market, the use of RLM for PEMFC gaskets still face certain challenges including production costs, durability, thermal resistance, and particularly (as it relates to our study), the compatibility with existing hyperelastic models for design improvement and/or non-destructive assessments. Interestingly, FEA-based assessments offer an avenue for understanding behavioural changes (nonlinear, elastic, incompressible, and isotropic) of these RLM materials under different tensile, compression, and shear testing using hyperelastic material models, and that directs one’s curiosity towards—could the knowledge discovered from FEA and tensile testing be leveraged for comprehensively assessing RLM materials to influence decision-making for material selection and hyperelastic model validation?

2.1. Gasket Material Selection

Unlike the conventional design of PEMFC which are metal-based, the elastomeric characteristics of rubber gaskets offer superior advantages—maintaining elasticity through high deformations and loading conditions, manufacturing cost efficiency, and zero-leakage sealing (as desired in PEMFC designs) [4]. Different RLM gaskets abound for exploration including natural rubber, Silicone Vinyl Methyl Silicone (VMQ), Alkyl Acrylate Copolymer (ACM), nitrile-butadiene rubber (NBR), Fluro-Elastomer (FKM), Ethylene Propylene Diene Terpolymer (EPDM), Butyl, Styrene Butadiene rubbers, etc. While most of them have high elastic properties and good resistance to hydrocarbons and oils, natural rubber, Butyl rubber, and EPDM offer great resistance to ozone, strong acids and alkalis, Acrylonitrile-butadiene, natural rubber, Chlorbutadiene Rubber, and Styrene Butadiene rubber offer comparatively less thermal resistance (between 60 ° to 100 °C), EPDM offers a fairly higher thermal resistance (between 50 ° to 150 °C), while VMQ and FKM offer comparatively higher thermal resistance (between 60 ° to 200 °C) [5,6]. Although FKM is particularly excellent for oils and greases, fuels, aliphatic, and aromatic hydrocarbons, their unusual resistance to oils and chemicals at elevated temperatures renders them obsolete for most safety-critical applications like the PEMFC.
Material selection for the PEMFC gasket extremely depends on the required parameters such as operating conditions, computational cost, and its properties which can offer chemical stability and tensile strength, and makes it applicable for low temperature and pressure usage [5]. In [7], a criticality assessment was studied on the materials for PEMFC most especially the sealants and categorized EPDM and VMQ as the most selected materials based on low manufacturing cost, material criticality, environmental effects, and risk of supply. Based on its low-temperature range during operation, RLM often provide reliable sealing efficiencies. The unique molecular structure of VMQ has motivated its use over hydrocarbons particularly at the GDL stage in many recent PEMFC applications across industries including aerospace, munitions, automobile, construction, etc. [8]. The degradation of VMQ using a simulated environment with diverse conclusions namely the ageing environment and temperature cycles play an adverse role. A noticeable increase in the thickness of the rubber under acidic conditions, and normal condition compared to air shows the surface topography exhibits cycle-dependent degradation [9]. On the other hand, EPDM’s saturated polymer backbone provides an excellent mix of weather and heat resistance (unlike many other rubbers) and is resistant to temperatures ranging from −45 °C to + 120 °C which corroborate its use for most PEMFC applications [5]. Comparing EPDM and VMQ based on their material properties, an experimental result in [10] validates VMQ as having a superior mechanical quality based on the compression rate. Likewise, VMQ adapts better under adverse temperature conditions with better sealing ability. However, at negative temperature ranges (usually at cold start, their performance seems uncertain and remains open for continued investigations.
In a different study, a compression under different clamping forces as high as 10 kN using VMQ, EPDM, and FKM as a case study to check for interfacial leak and gas permeation methods was proposed. The permeability and diffusion coefficient of EPDM was lower than VMQ following the sealing performance investigation, making VMQ a better candidate for selection in the PEMFC stack [11]. Interestingly, the interfacial leak experiment was studied with only the EPDM. The result indicates a leakage occurs at a low contact pressure (the resulting interfacial rate value was lower than the permeability of the EPDM) which suffice EPDM being a good material for consideration [11,12]. However, another study shows that under normal working conditions and assembly of PEMFC, the heat distribution helps improve the sealing while the stress affects the nearby materials like the bipolar plate and membrane electrode assembly (MEA) [13].

2.2. FEA-Assisted Decision-Making

Recent studies on design optimization of RLM for PEMFC gasket have used FEA to understand their behavior (nonlinear, elastic, incompressible, and isotropic) under different tensile, compression, and shear testing. The process involves conducting either/both uniaxial or biaxial tests to determine the material properties and comparing the experimental data with the right hyperelastic models that would reflect the mechanical behavior of the RLM gasket [14,15]. Interestingly, there has been several arguments on the choice of hyperelastic models with different suggestions for a single-dimension or integrated constitutive modelling. A combination of uniaxial and biaxial tension data was understudied simultaneously with a new improved Mooney Rivlin model using 4-parameters to equal the Ogden 6-parameters in response time [16]. A different approach named hybrid integral approach (HIA) was proposed and it was found to predict the stress curve of the incompressible RLM using multiple tension (uniaxial and equibiaxial), compression (uniaxial), and shear test data. However, it is still a challenge for researchers to pick the best hyperelastic model for RLM applications. Forty-four hyperelastic models were selected and categorized into four, namely, invariant-based phenomenological models, principal stretch-based models, micro mechanically based material models, and mixed invariant and principal stretch-based models [17].
Among the many models available for exploration, the Neo Hookean model offers a fundamental paradigm for hyperelastic material assessments; however, its limitations for large strain deformations (beyond 20% of strain deformation) [18] renders it unsuitable for most modern applications. Although reliable, the Mooney–Rivlin class of models do not give a detailed description of material behaviors of the materials, rather they provide only the tensile response based on the stress–strain curve. However, their accuracy on experimental data increases as the number of parameters increases. Another popular model—Yeoh model was earlier proposed in 1993 based on the independence of its strain-energy function on the second invariant of the Cauchy–Green deformation tenors [19]. It is amongst the numerous phenomenological models for FEM and FEA of virtually all incompressible elastomers and although similar to Mooney–Rivlin, its simplicity is a major advantage. Recent studies on the Yeoh model has shown that its advantages include: ease of usage as it requires few parameters, requires a lesser amount of experimental data due to its dependence on the first invariant of the Cauchy–Green strain tenor to achieve good numerical results, its input parameters can be obtained only through tensile experiments [19], and it can be used to describe a wide range of deformation [20]. Proposed by Raymond Ogden in 1972, the Ogden material model imitates the non-linear behaviour of biological tissues for FEM and FEA of hyperealstic materials [20]. Interestingly, this model is unique for expressing its strain energy as a function of the principal stretches unlike the previously discussed models that express their strain energy functions in terms of invariants. This makes it popular for capturing upturn(stiffening) of stress-stain curve and model rubber with great accuracy over large ranges of deformation and is capable of accommodating deformations up to 700% [21]. Unlike the Mooney–Rivlin model, they can be used for modelling slightly compressible materials like foam. On the downside, it lacks generality and transferability. Following decades of improvements and innovative research welcomed the first constitutive model in 1993 by Ellen Marie Arruda and Mary Cunningham Boyce known as as the Arruda–Boyce hyperelastic model. This robust model functions under the assumption of material incompressibility and exploits the statistical mechanics of hyperelastic materials with a cubic representative volume element that contain chains running diagonally.
It is common knowledge that hyperelastic models for RLM modelling and analysis are prone to parameter selection in respect to the experimental result which often motivates the selection of one or more parameters and can be termed a knowledge-based approach [22,23]. A preferred model is only selected if it can reproduce a suitable result from either a single or multiple parameters under various loading conditions. On the other hand, rubber gasket materials like EPDM and VMQ are mostly subject to uniaxial tension or/and compression in PEMFC application. Parameter identification problem can best be addressed with optimization approach using mean square error and scalarization using weights as the parameter. Conclusively, it can be denoted from the result that the performance of each model is subject to the type of data (uniaxial, biaxial, equibiaxial, and shear), quality of fit, and parameter number [17]. This brings the selection/choice of the hyperelastic model in this research to Mooney–Rivlin, Yeoh, Arruda and Boyce, Neo Hookean and Ogden based on the test data type, test data size, and compression ratio. Consequently, it becomes necessary to assess the models’ curve fitting efficiencies on the tensile data to determine their sufficiency for accurately providing a virtual replication of the material behaviour to aid non-destructive testing, propel predictive assessments, and assist in the decision-making process for material selection.

3. FEA-Based Model/Material Selection Process

This section presents the flowchart/methodology for optimal RLM gasket selection and the simulation process using tensile testing and FEA as shown in Figure 1 which provides the road-map for the proposed investigation. Following a non-destructive short tensile testing on each of the materials at 25% and 40% displacement, respectively, their respective parameters are obtained for FEA using the different hyperelastic models. The subsections below explains the key modules in Figure 1.

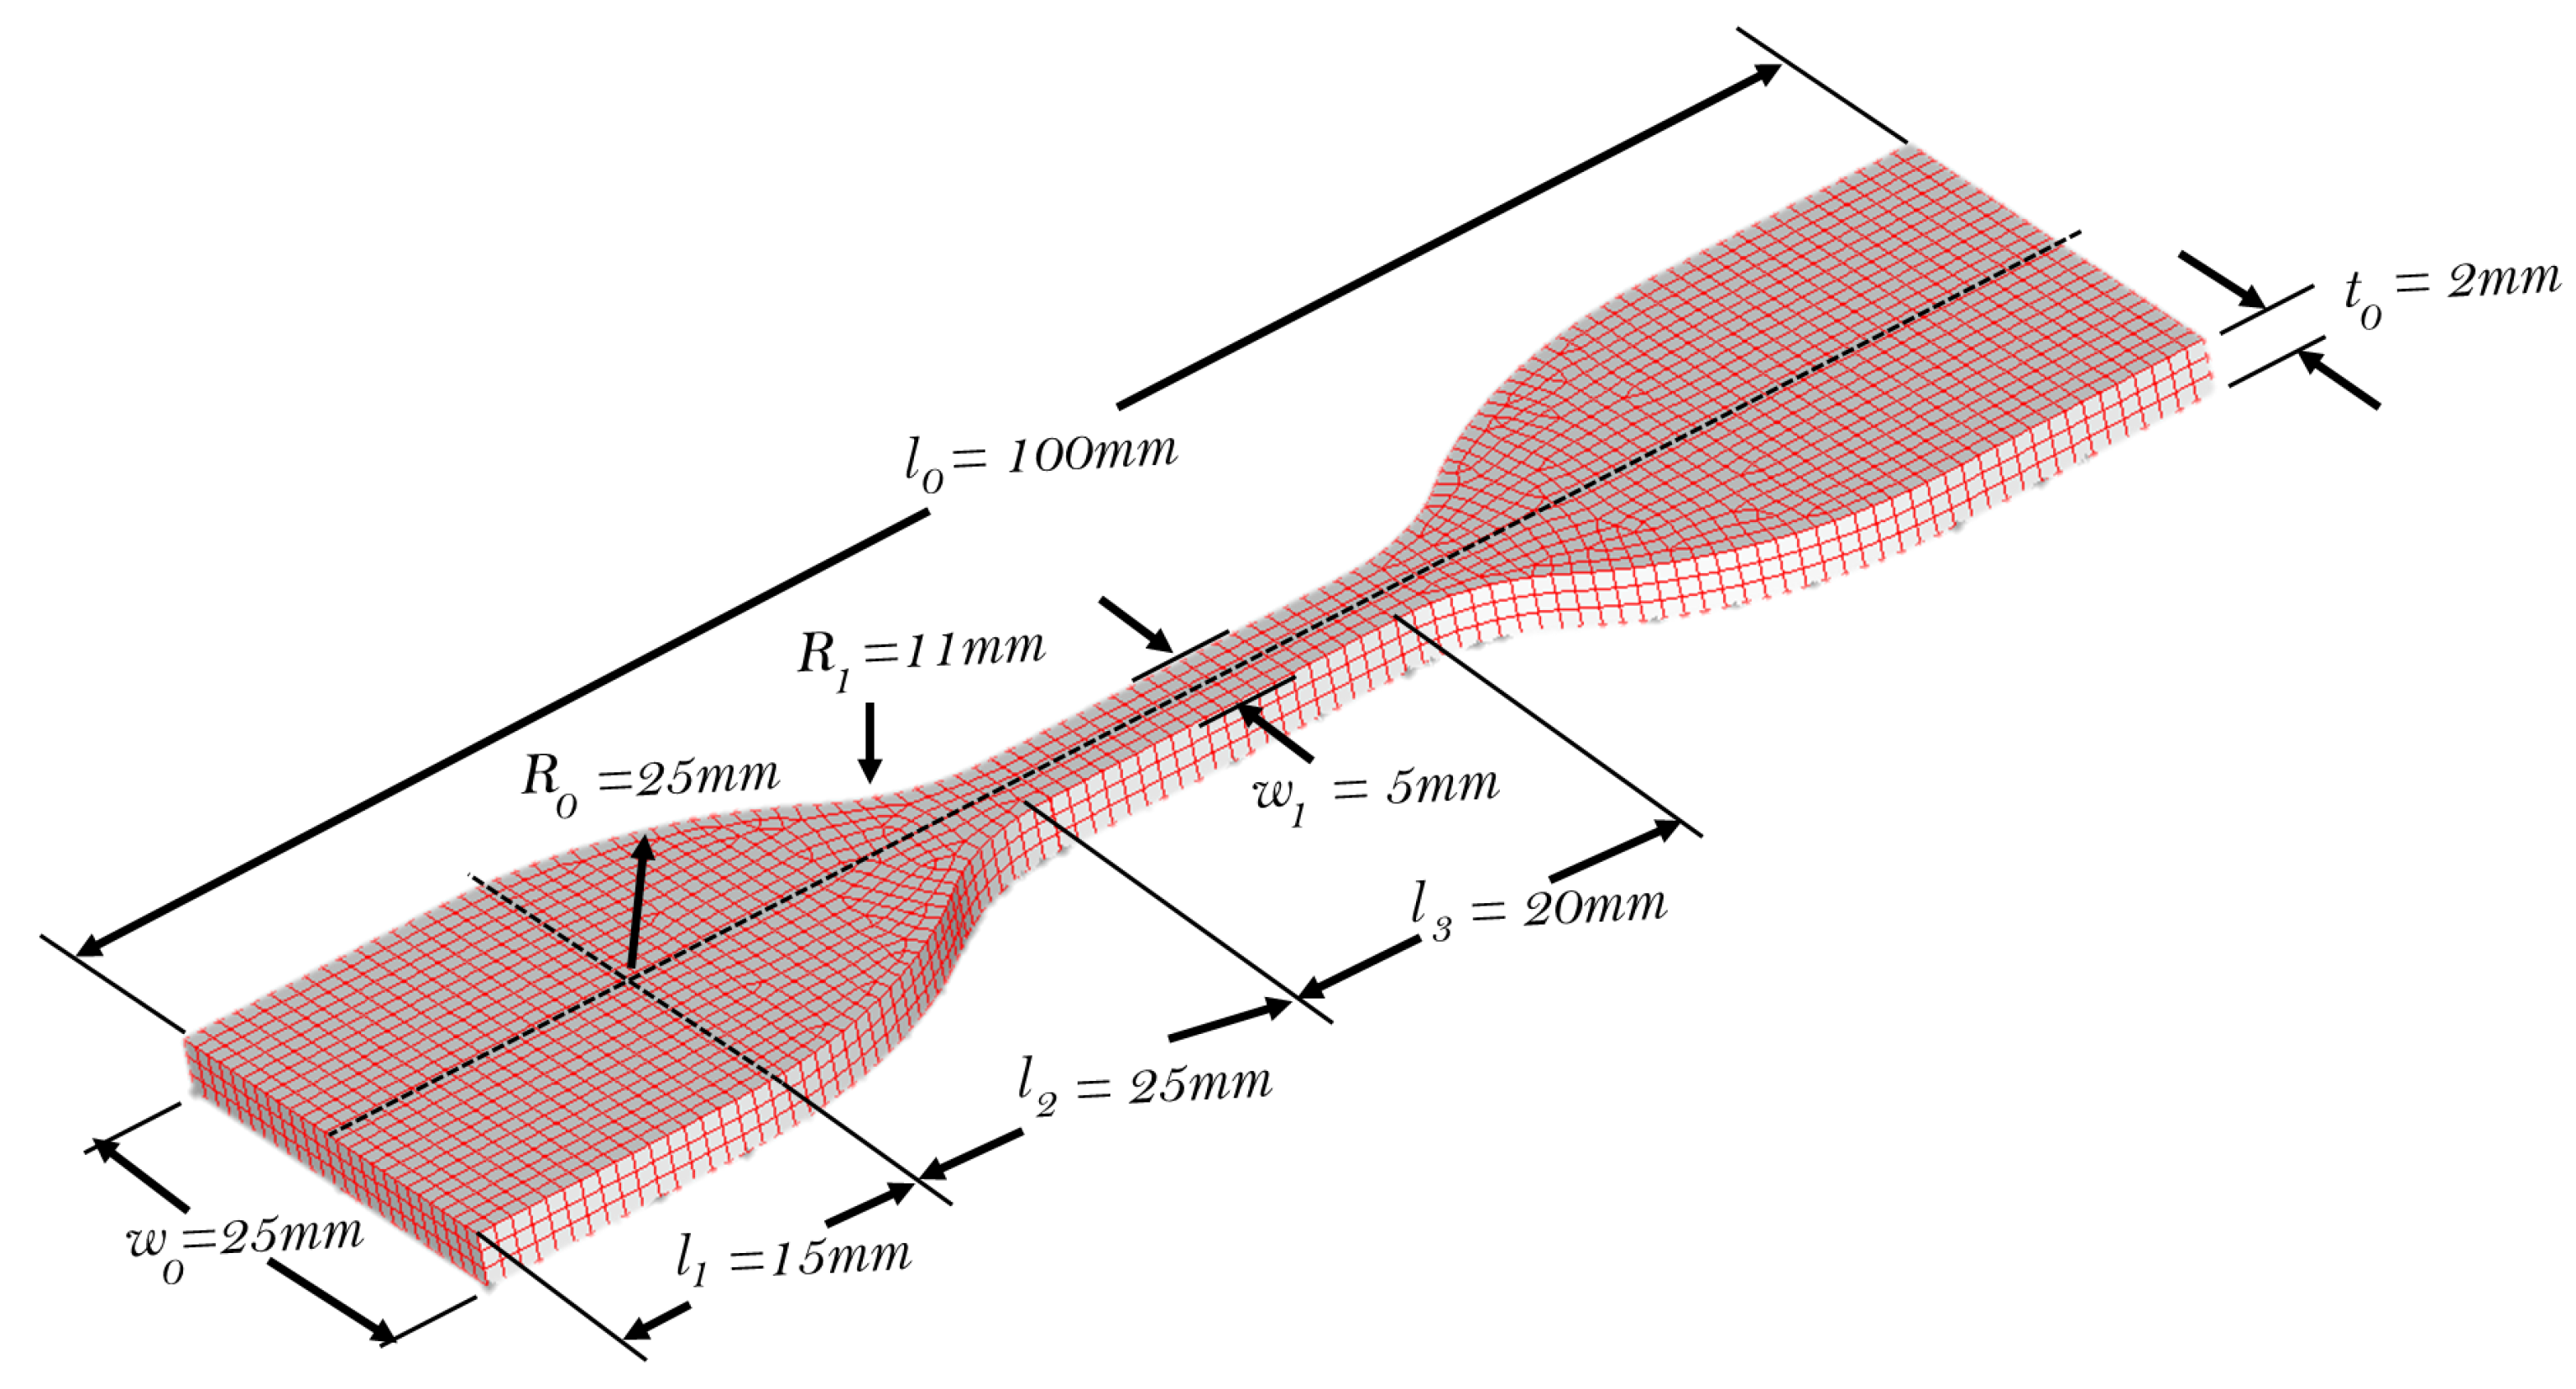
3.1. Tensile Testing Procedure

As part of quality control and design optimization, non-destructive tensile testing helps provide useful design specifications. For FEA, the material constant of each rubber material is required and these could be achieved via various types of load tests such as short tensile, biaxial tensile, and short compression tests. Although not as efficient as its counterparts, short tensile testing offers ease of use, computational cost advantage, and minimal simulation modelling complexities; hence, was employed.
The experiment was conducted at room temperature. As loading increases uniformly, the molecular structure of the hyperelastic materials changes; resulting in a Mullins effect—a situation whereby stresses gradually decrease and then stabilizes. For the series of short tensile tests on the rubber materials of ACM, EPDM, FKM, NBR, and VMQ, the stress and strain values for each material were collected for up to 25% and 40% displacements, respectively, and stored digitally in ‘.xlsx’ files via the software—Trapezium X. To conduct the experiment for each material, a load cell is attached to the upper end of the grip holding the specimen in the tensile testing machine while the elastic body (or sensing part) that generates structurally stable deformation against force or pressure and the strain gauge measures the amount of change. Figure 2 shows the different tensile curves of the materials for the displacement ratios.
In addition to providing a visual representation of the acquired tensile testing data, the gap between NBR, FKM, and the others in Figure 2 also hints that the other materials are more elastic than FKM and NBR, and that the two materials—FKM and NBR display a similar tensile behavior (similar elasticity levels). As shown, NBR and FKM are the least elastic with a high stress–strain gradient while the rest are highly elastic as shown by their relatively lower stress–strain gradient with ACM being the most elastic. Ideally, these ranges—25% to 40% displacement provide enough data needed for hyperelastic modelling without causing a permanent damage to the materials. This is particularly the case at Pyung Hwa Industry Co., Ltd., Korea, where rubber PEMFC seals are manufactured for commercial use. Subjecting the rubber samples to 25% to 40% displacement offers a safe non-destructive testing while also providing enough material stress–strain information needed for FEA-assisted decision making. When observing Figure 2, one can easily see the respective materials’ stress–strain similarities: a quadratic stress–strain curve and dissimilarities, different gradients implying different elasticity.

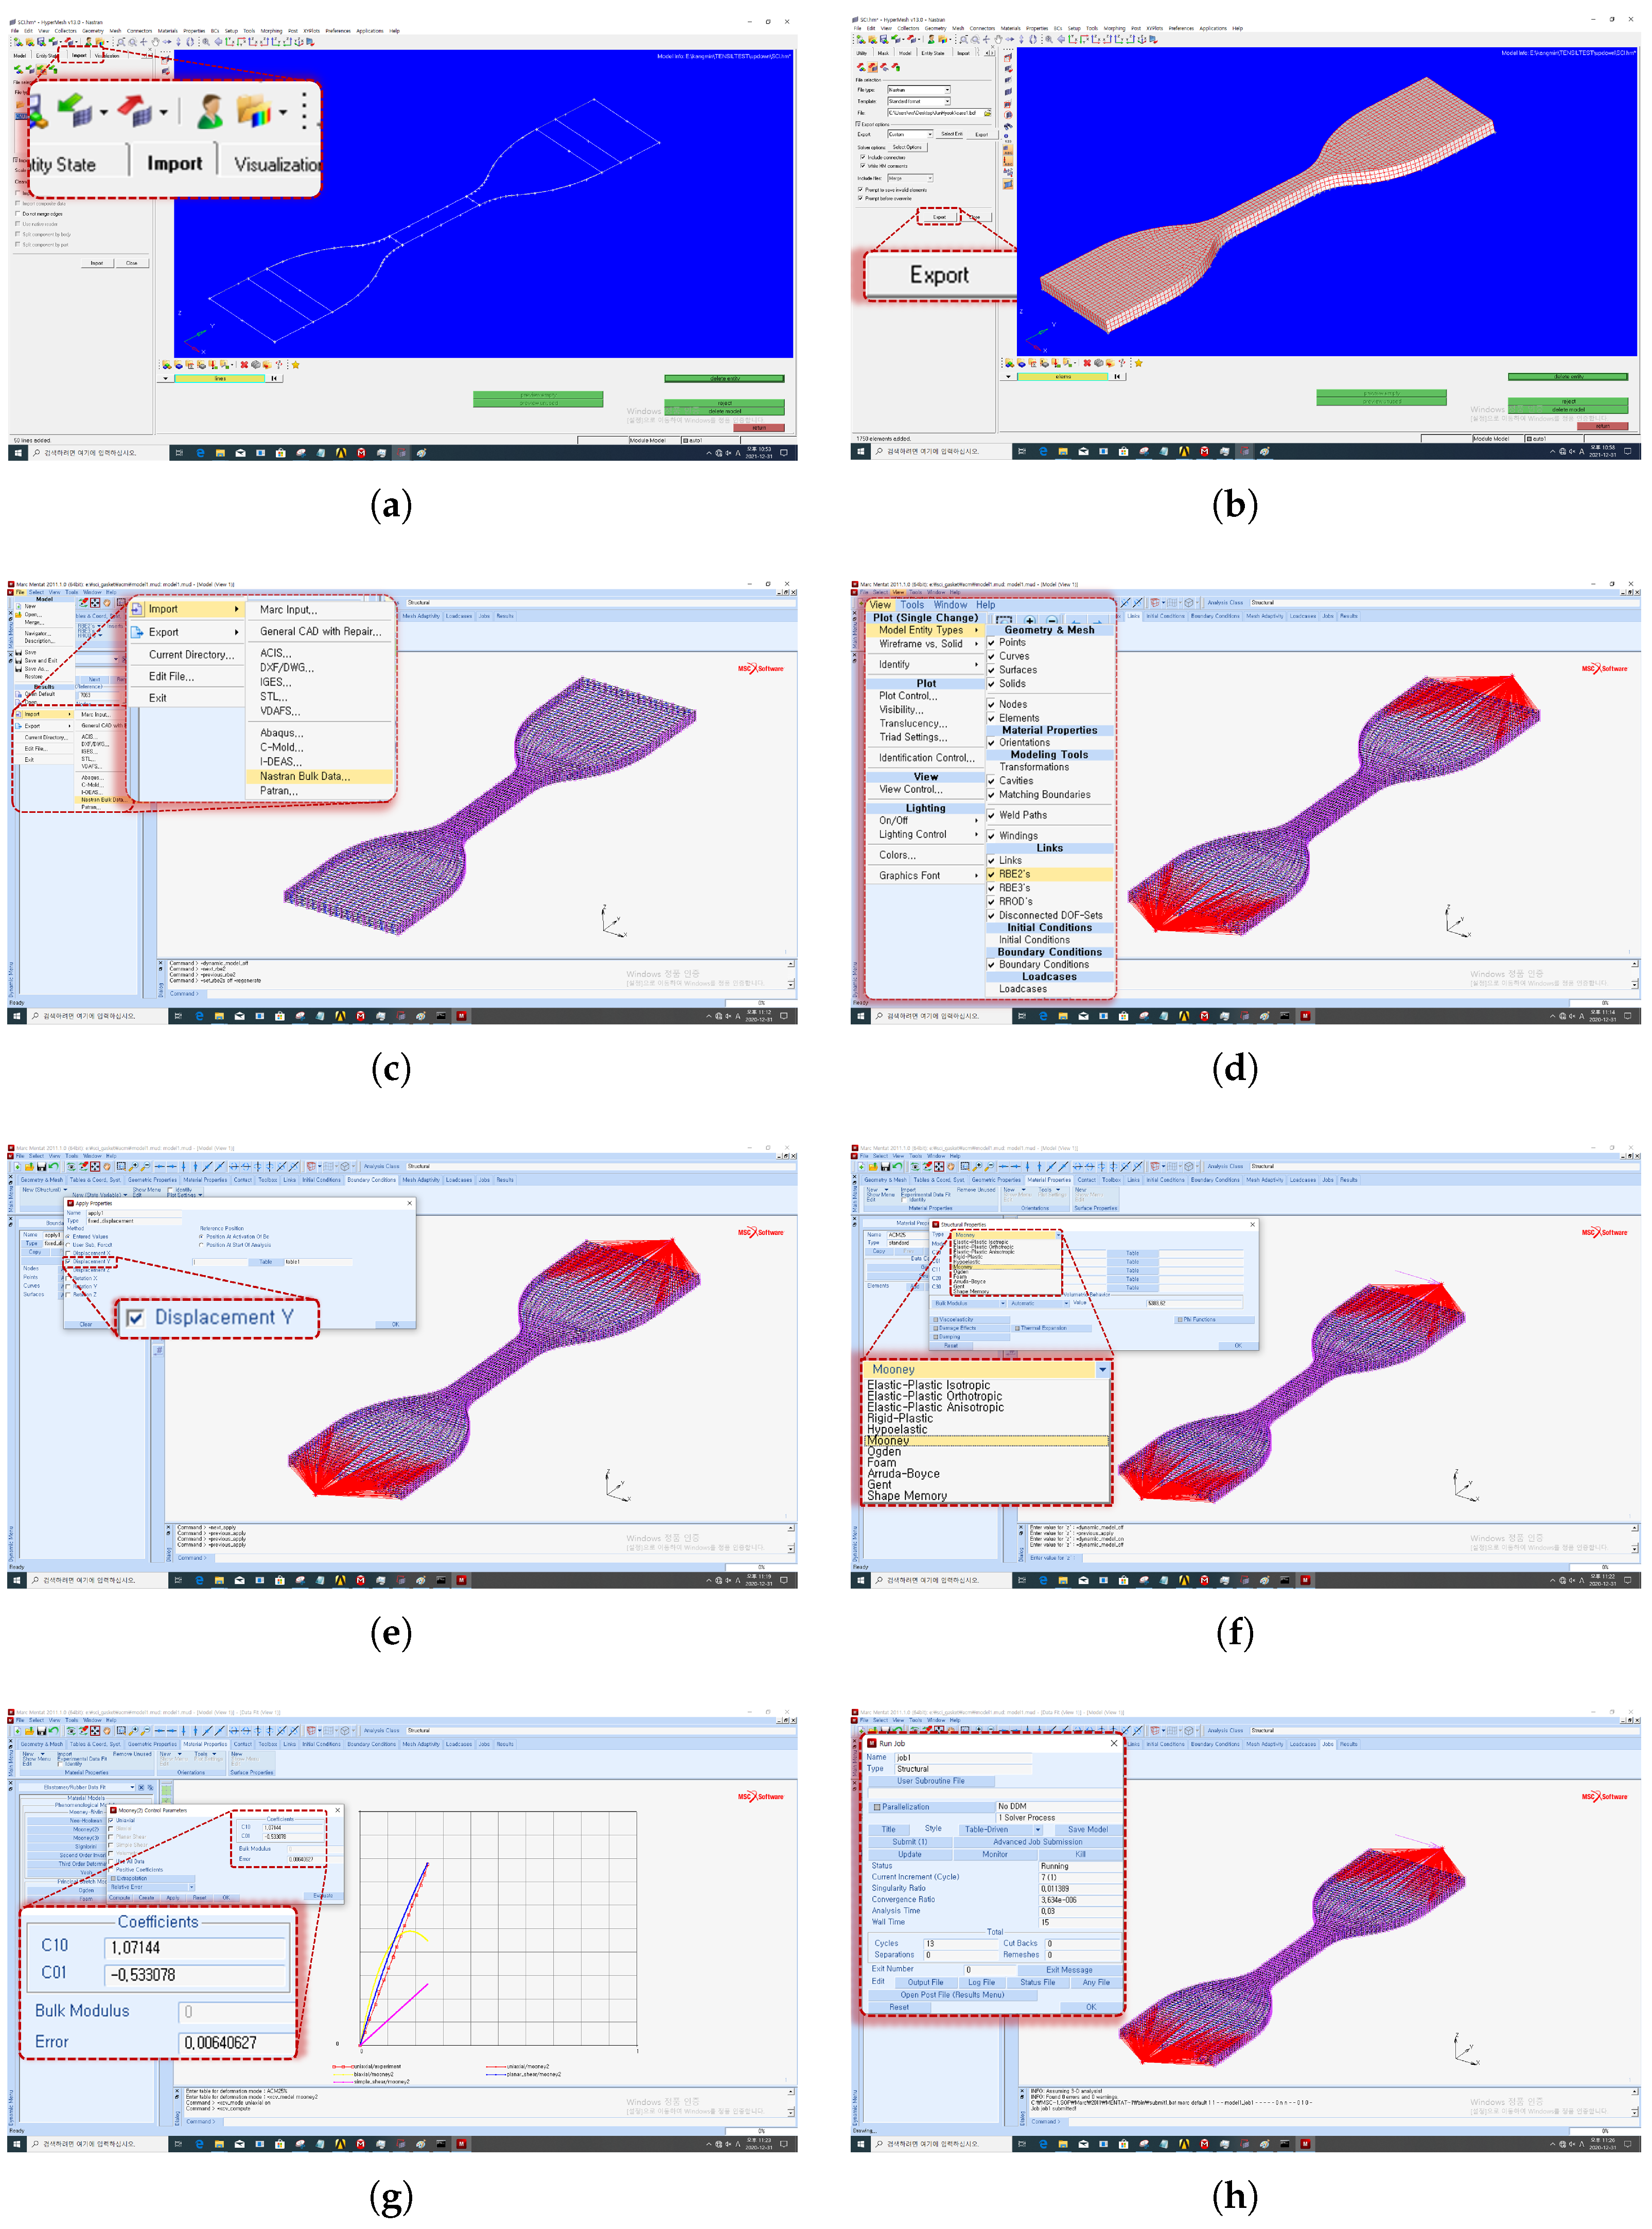
3.2. FEA Environment and Simulation Procedure

The gasket geometry was modeled in three dimensions using CATIA and was divided into different elements using Hypermesh by following the KS M 6518 specimen for the tensile test [24]. Figure 3 shows the geometry of the specimen.
As shown, l 0 , l 1 , l 2 , l 3 , w 0 , w 1 , R 0 , R 1 , and t 0 represent the total length, grip length, grip–gauge length, gauge length, grip width, gauge width, inner radius, outer radius, and drag (thickness), respectively.
Afterwards, the elements were exported for FEA using the MARC program. Ideally, the static friction coefficient for rubber materials is 0.3 [25] and was set for analyses. Figure 4 illustrates the key simulation stages from importing the CAD file to the actual FEA using the Hypermesh and MARC programs, respectively.
To achieve the 25% and 40% displacement, respectively, the boundary conditions are set such that the displacement only occurs in the Y direction as shown in Figure 4e. This is followed by an iterative process of choosing the different hyperelastic models, fitting the curve using the experimental data (stress–strain data from the tensile testing) and running the program. Table 1 summarizes the FEA results from the hyperelastic models on the different rubber materials.
For each of the tensile testing data from the materials (25% and 40% displacement), the different hyperlastic models were employed while their respective coefficients/parameters and errors were recorded. Also, for each of the hyperelastic models, rubber materials, and displacements, the stress–strain data were exported for empirical analysis.

3.3. Evaluation and Decision-Making Paradigm

For most curve fitting problems, regression models are widely used since they are simple and offer different curve fitting functions ranging from the simple linear regression to the high-order polynomial functions. Given a set independent variables X = { x 1 , x 2 , , x n } , regression models function based on the assumption that the regression function E ( y | X ) can be approximated as a function of X as follows [26]:
y ^ = f ( X ) = β 0 + i = 1 n l = 1 L β i l · x i l
where x i is the input variables, β 0 , β i are the unknown coefficients, and l is the degree of the regression function whereby for linear regression models, l =1; for quadratic, l = 2; and for cubic, l = 3, etc.
Considering m examples of ( Y , X ), where X = X 1 , X 2 , , X m , X m = x m , 1 , x m , 2 , , x m , n , and Y = y 1 , y 2 , , y m . determining the coefficients— β , can be achieved by minimizing the residual sum of squares (RSS) between the measured value y j and the regression value y j ^ such that:
RSS ( β ) = j = 1 m y j y j ^ 2
Ideally, the hyperelastic models’ outputs—stress–strain data should be identical to the actual tensile data; however, due to each model’s underlying assumptions, miscalculations are bound to occur (though minimal). Such a relationship (linear, quadratic, and/or polynomial) between the models’ outputs and the tensile data provides an avenue for assessing the respective models’ curve similarity with the actual tensile data. In this context, standard performance evaluation metrics for regression models would suffice. These metrics include the root mean square error (RMSE), R-squared (R2), mean absolute percentage error (MAPE), etc. Because each metric reflects a unique error assessment criteria, a comprehensive assessment can be achieved by integrating these metrics as their weighted average as shown in Equation (3)
Ω = i = 1 n ε i w i i = 1 n w i
where ε i represents each evaluation metric value while w i represents their respective weights.
On one hand, the empirical assessment of each model’s simulation progress (errors) provide insight on the models’ efficiency for modelling the materials while on the other hand, the multi-metric regression analysis (curve fitting evaluation) between the tensile curve and each model’s simulation output provides compatibility assessment of each hyperelastic model with the materials. These two standpoints provide reliable support for decision making and further contributes to optimal model (and material) selection process.

4. Empirical Analyses

Following Figure 1, each material’s tensile data and their corresponding simulation data (from the hyperelastic materials) for the 25% and 40% displacement were compared using the proposed multi-metric regression approach. Firstly, the respective hyperelastic models’ stress–strain outputs were exported for comparison between the corresponding (respective) tensile data. They are shown in Figure 5 below where the figures in the left and right columns are for 25% and 40% displacements, respectively, and the black star-dotted lines represent the actual tensile data while the colored dotted lines represent the various hyperelastic models’ stress–strain outputs.
As shown for each material, the hyperelastic models returned different stress values at increasing strain values. Although similar, the need for optimal model selection is quite obvious. In this quest, a quadratic regression model (l = 2) was employed on all the tensile curves since from observation, the different curves for each material for the different displacements reveal a quadratic behavior over increased loading. Figure 6 show the curve fittings for the different materials’ stress–strain data where the figures in the left and right columns are for 25% and 40% displacements, respectively.
Although the models’ curve fitting results are closely similar to the actual tensile curve (in black line) for different materials and displacements, it can be observed in Figure 6d,e that the models’ inaccuracies for replicating a similar stress–strain curve, like how the actual tensile curves for ACM and VMQ are significant in comparison with the other materials. Notwithstanding, it is also observed that this poor curve similarity is reduced as the displacement is increased from 25% to 40%. This hints at the improved modelling efficiency of the hyperelastic models when sufficient tensile data is provided.

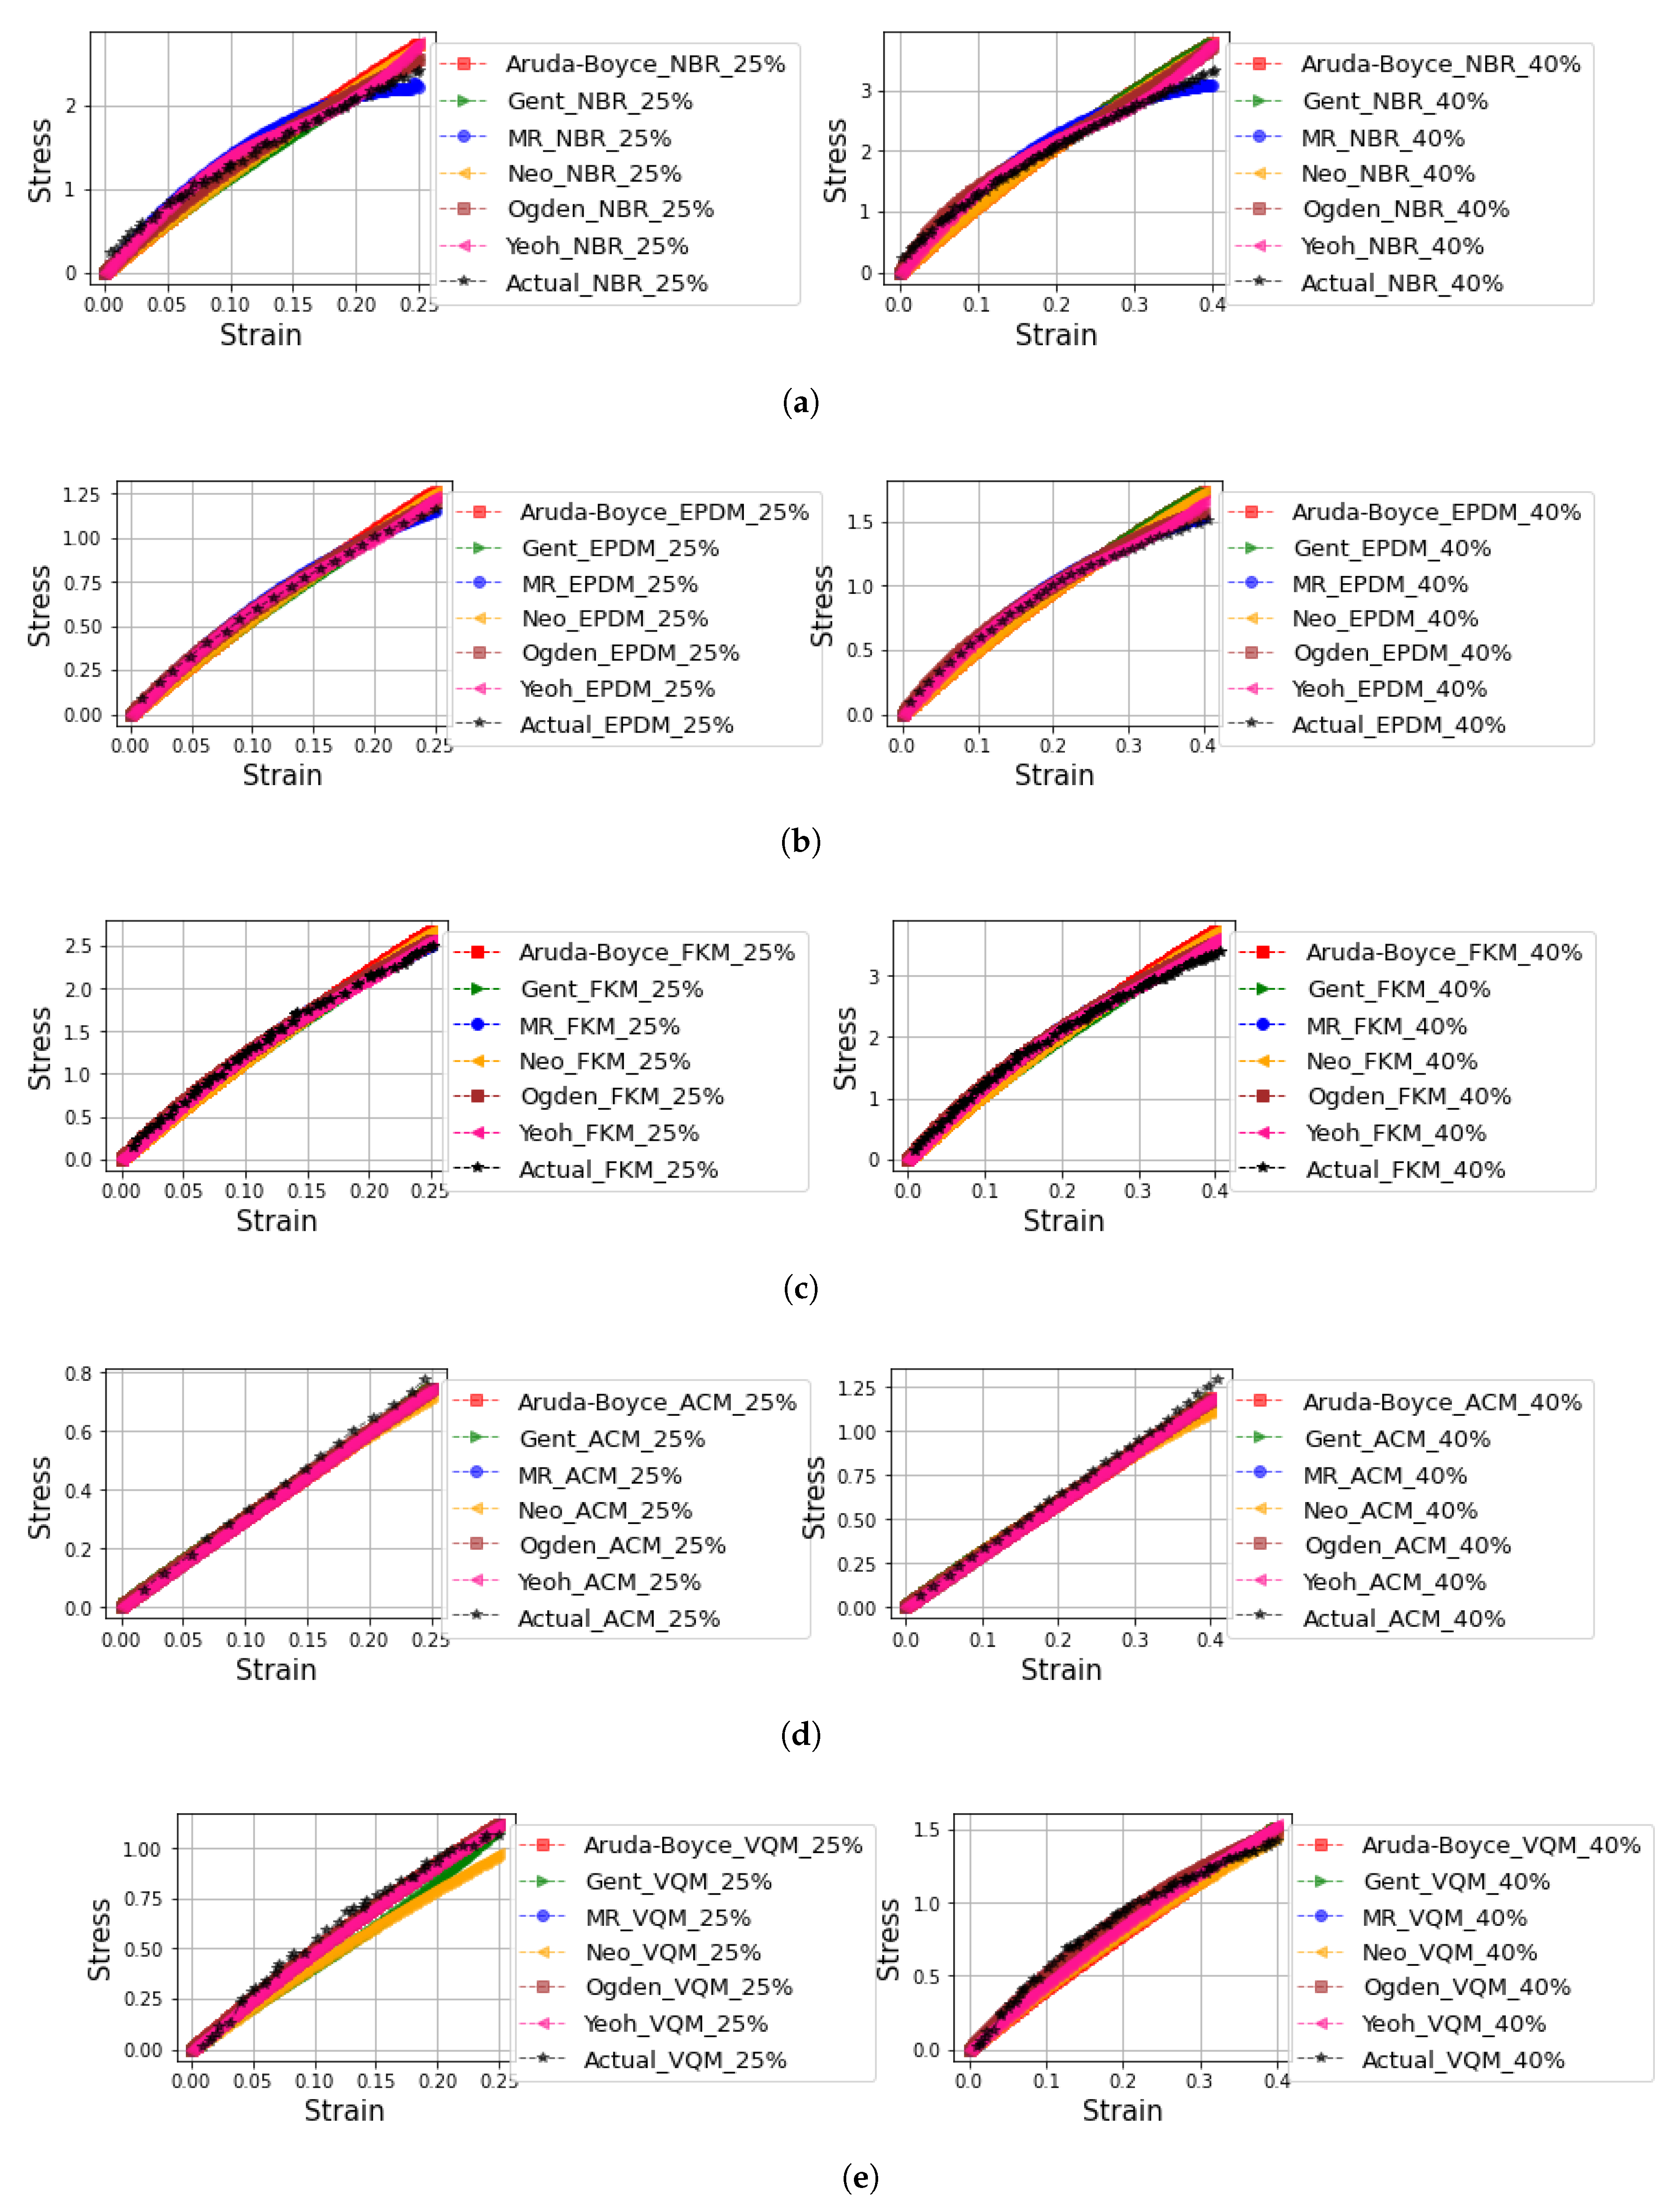
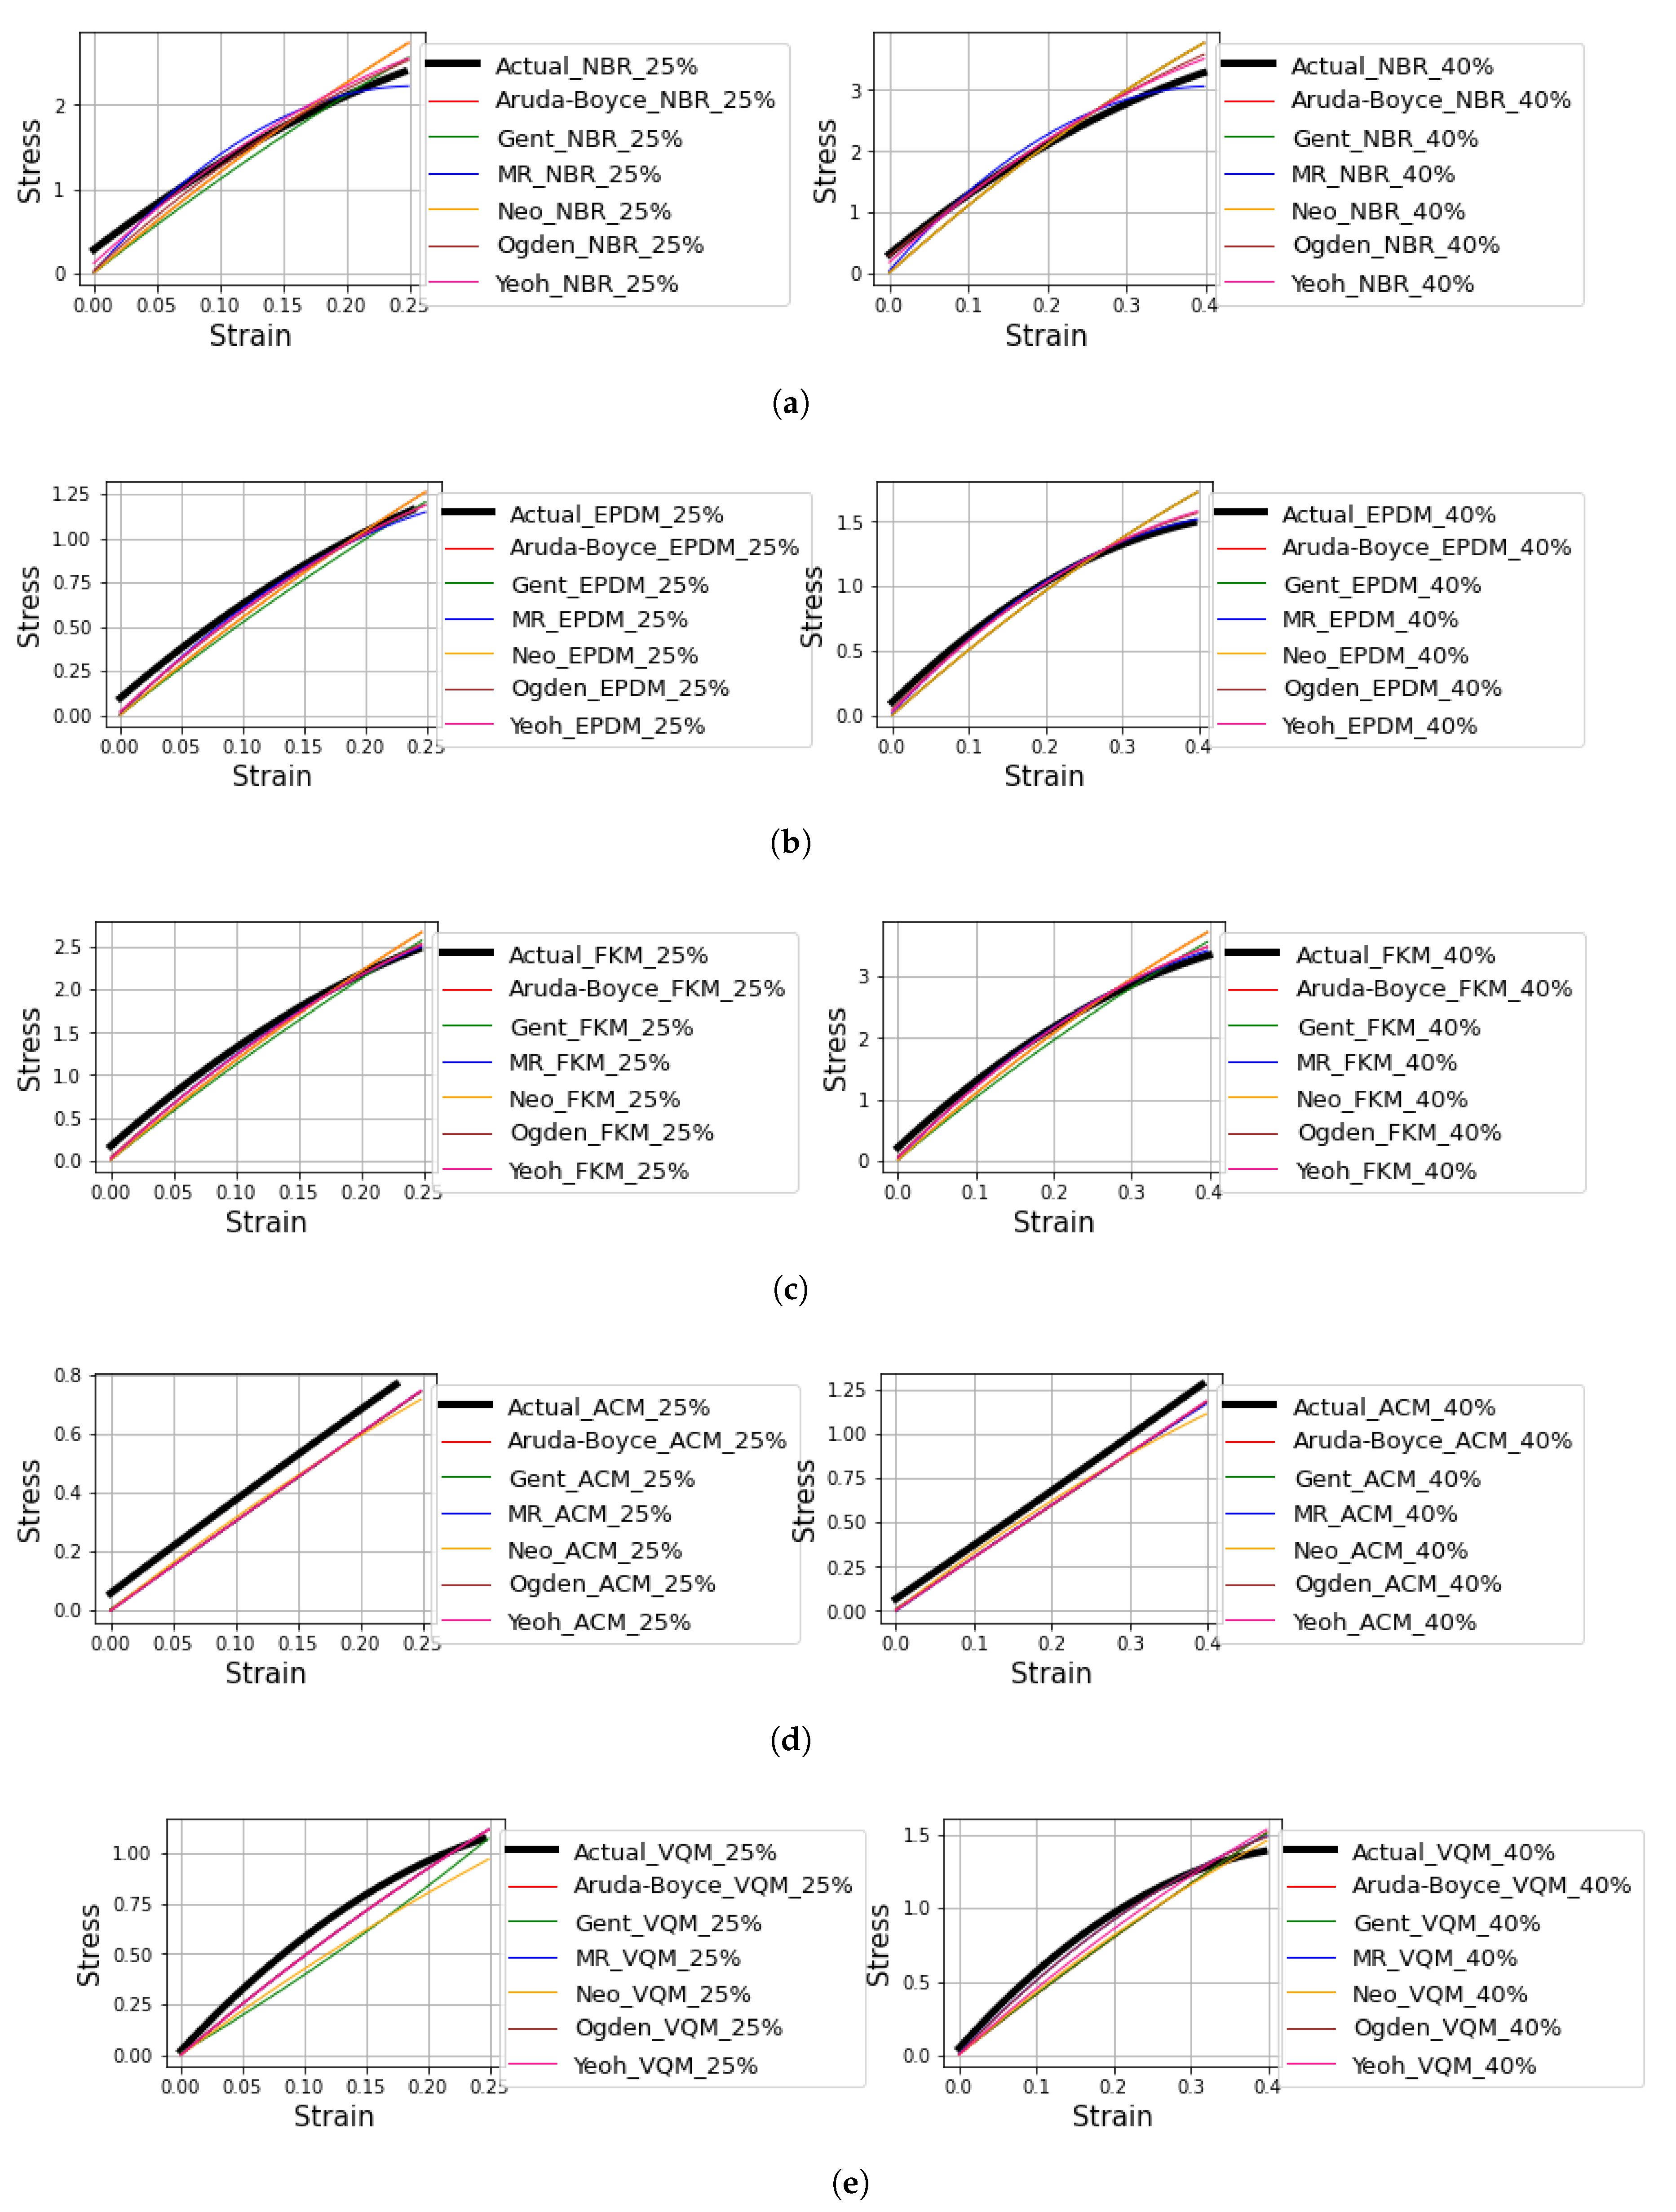
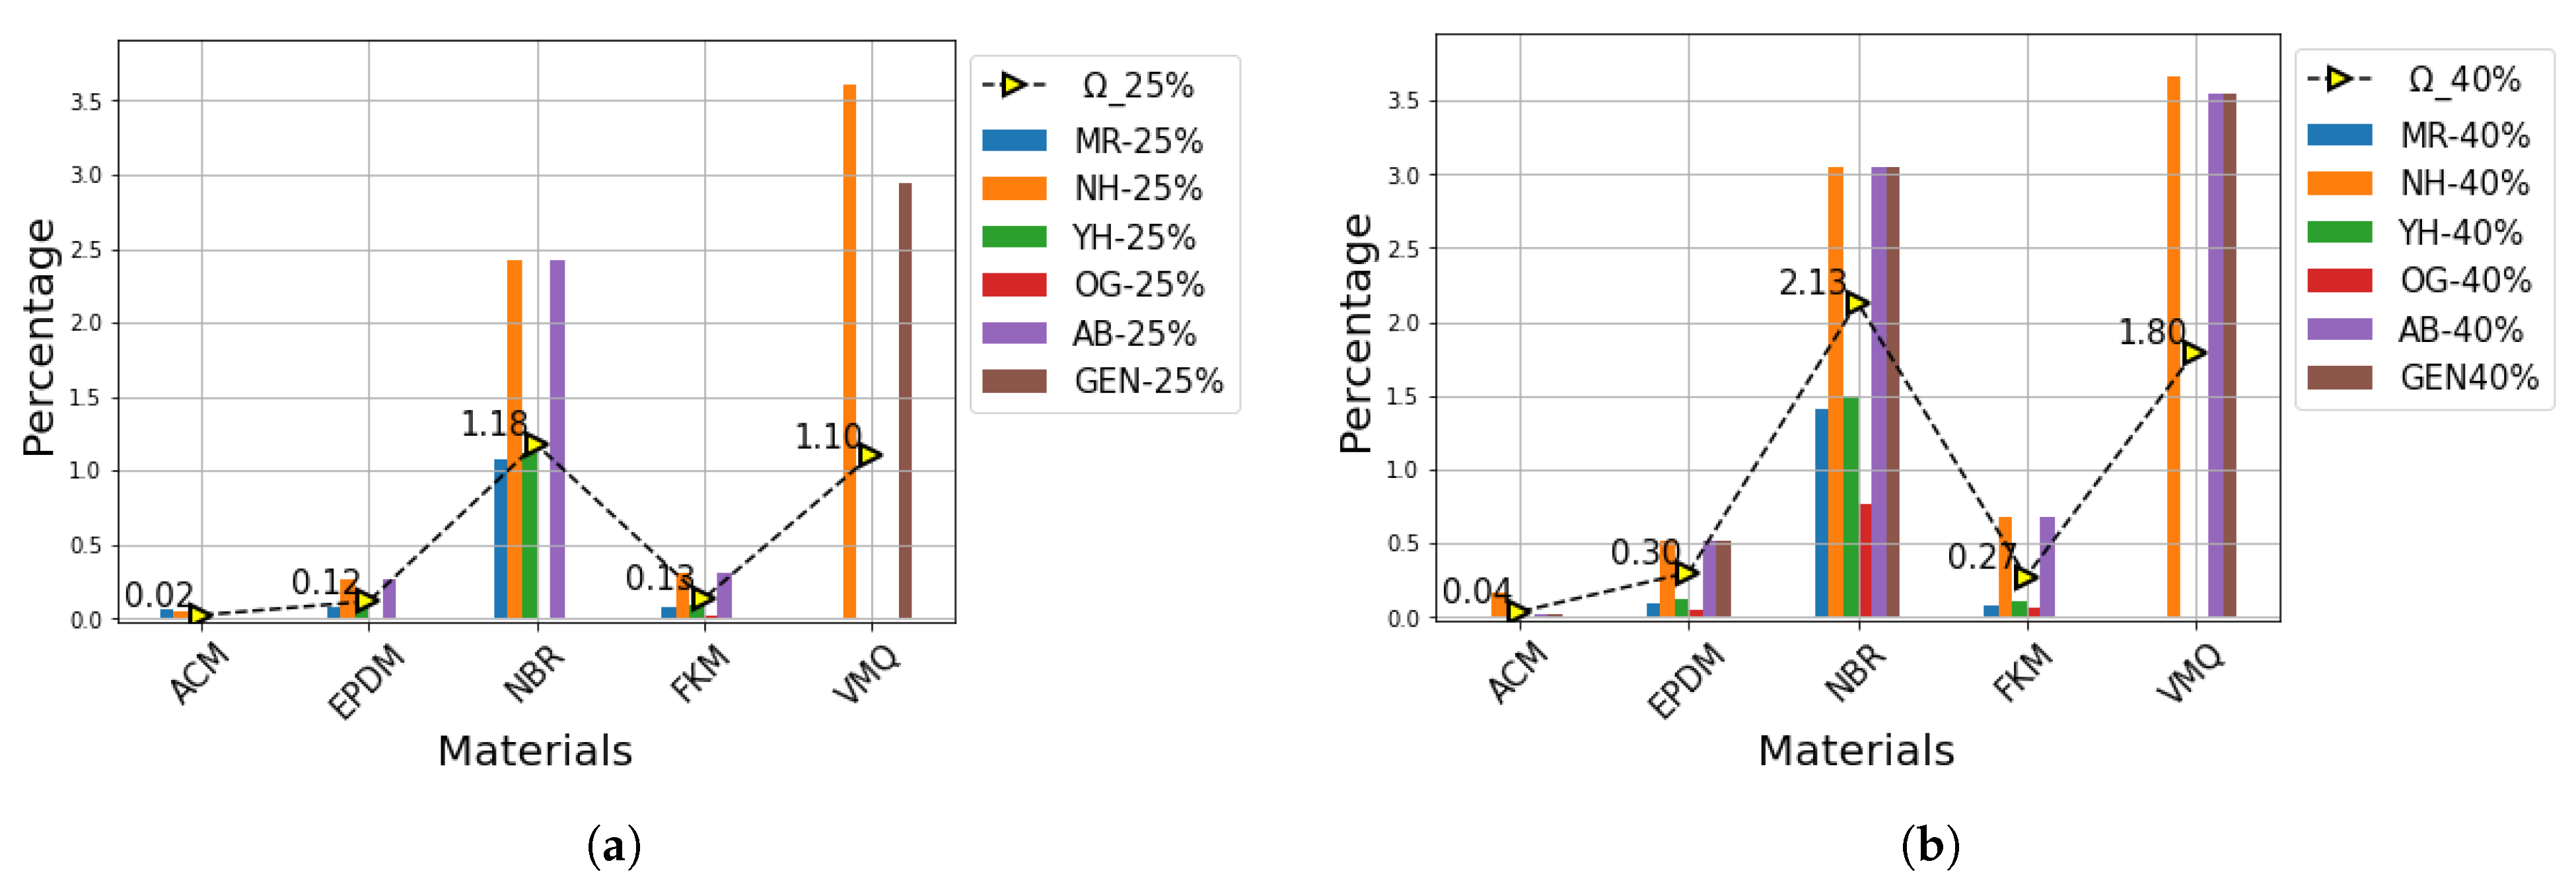
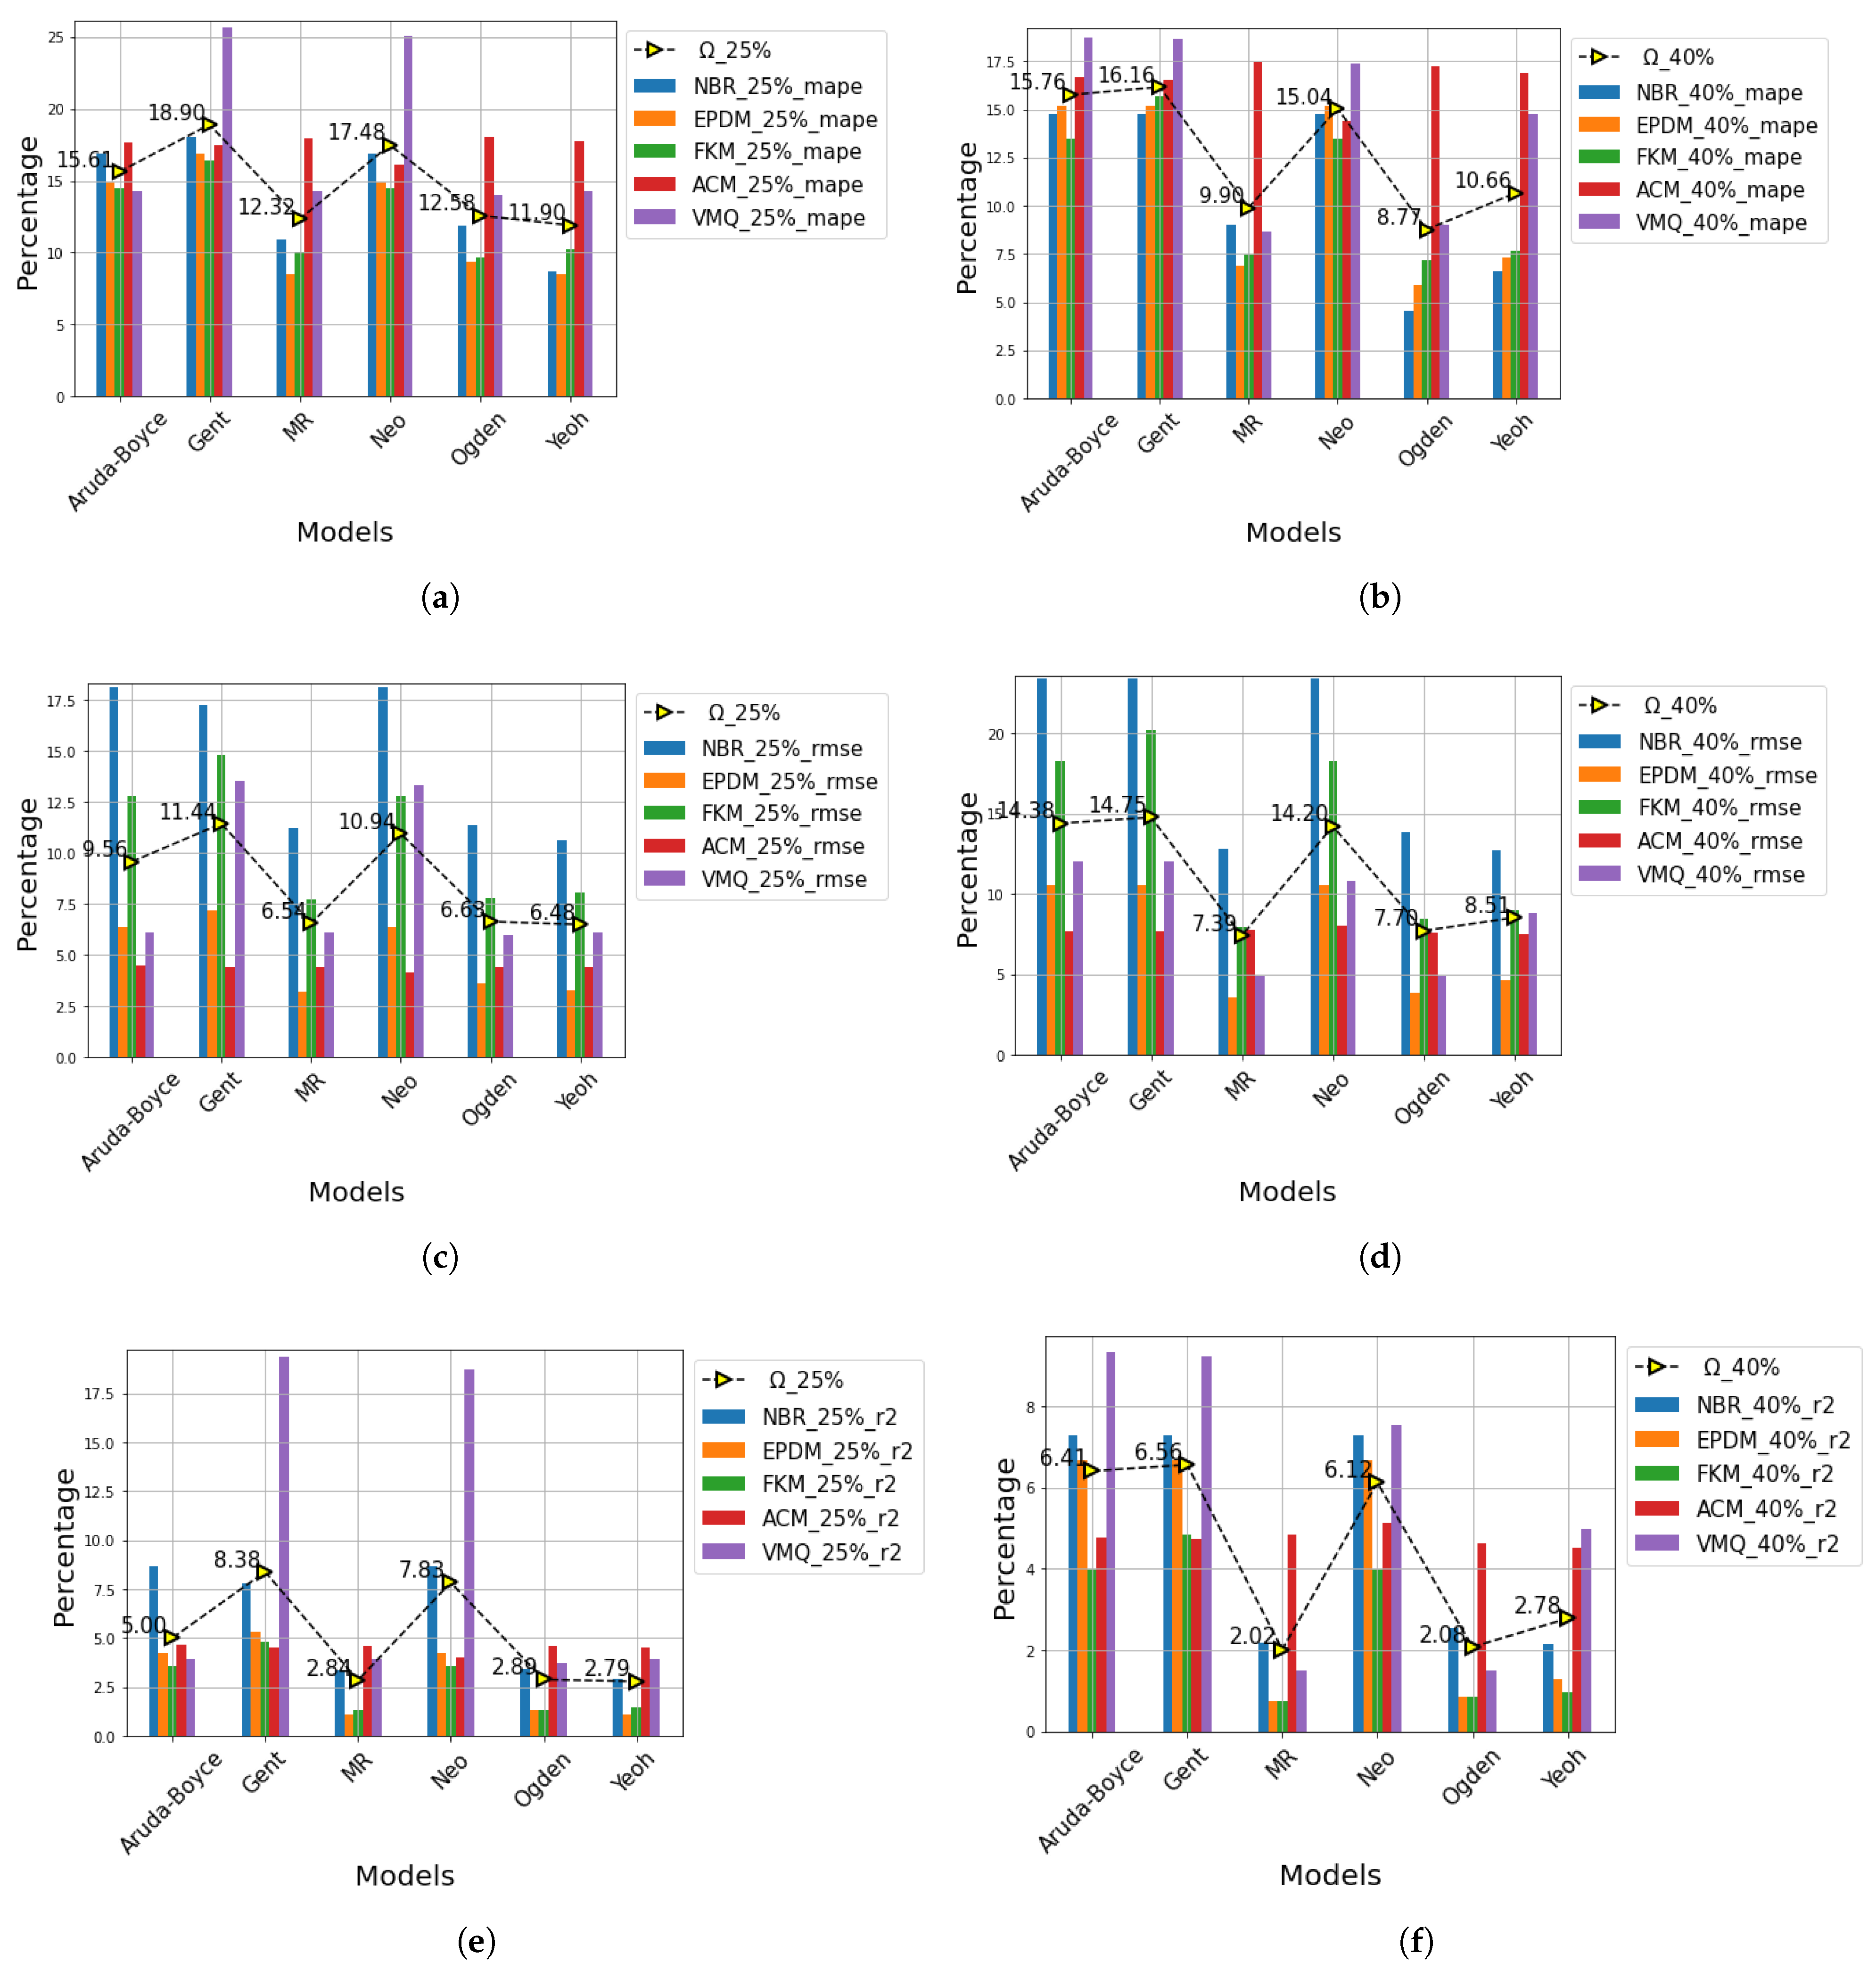
Hyperelastic Model Evaluation for Material Selection

As the study proposes, amidst the abundance of different hyperelastic/rubber materials for HFC gaskets, the choice of hyperelastic models for FEA-assisted decision making (material selection) offers strong rationale for investigation. Following the simulation and curve fitting process on each hyperelastic model’s outputs, the simulation errors were recorded and compared between the hyperleastic materials. Figure 7 show each models’ simulation error on the materials at 25% and 40%, respectively.
As observed in their low weighted averaged simulation errors for the materials, respectively, the FEA analysis of the materials reveal that the hyperelastic models are most efficient for ACM, EPDM, and FKM. Overall, the inaccuracy of the models for NBR is highest (followed by VMQ) as observed from the high weighted average values; thus not recommended for modelling these rubber materials. Nonetheless, the models—Ogden, Yeoh, and Mooney–Rivlin are quite efficient for VMQ material as observed in the relatively lower simulation errors for both 25% and 40% displacements. In addition, it is also observed that the Neo model (in yellow bars) is the most inaccurate for all materials followed by Arruda–Boyce (in purple bars) and Gent (in brown bars) for both displacements, while Ogden (in red bars) is the most accurate (followed by Mooney–Rivlin) for all materials. Notwithstanding, its inaccuracy is significantly observable for the NBR at 40% displacement.
On one hand, the simulation errors provide insights on the model-specific dynamic modelling imperfections due to their respective modelling assumptions. On the other hand, the curve similarity assessment between their simulated tensile outputs and the actual tensile data provides an avenue for further compatibility, and/or consistency assessment between the models based on the proposed multi-metric regression analysis. Figure 8 present the MAPE, RMSE, and R2 values for each hyperelastic model’s outputs on the RLM at 25% and 40% displacements, respectively.
The regression analyses above reveal that overall, the outputs from the MR, Ogden, and Yeoh hyperplastic models are the most compatible with the tensile data as shown in their low MAPE, RMSE, and R2 values. These results actually support the results in the simulation errors. Amidst this performance, the Yeoh and Ogden models are quite efficient (particularly for EPDM, NBR, and FKM) as shown in the short yellow, blue, and green bars, respectively. On the flip side, the results for the Gent, Arruda–Boyce, and Neo models are the most incompatible as shown in their relatively high error values in all the figures and should be given low priority. Unfortunately, the curve fitting efficiencies of the models for VMQ and ACM are quite low (as observed in the long blue and purple bars in the figures). This also suggests that although VMQ may be chosen (based on an individual’s preference), the available hyperplastic models may not be suitable for accurate FEA-assisted design/analysis; hence not advised.
From a different perspective, we assessed the curve fitting errors of the hyperelastic models per material using the proposed multi-metric regression analysis. In addition to physical and chemical properties, durability, and costs, this would provide a reliable standpoint for material selection. Figure 9 presents the MAPE, RMSE, and R2 values for each RLM per hyperelastic model at 25% and 40% displacements, respectively.
As shown, in the short green, purple, and brown bars, the Mooney–Rivlin, Ogden, and Yeoh models are the most compatible models for all the materials across the different metrics. This hints at their superior efficiencies over the other models. However, one may not draw a valid conclusion on the material(s) with the least curve fitting error. For instance, although the R2 for FKM is the least for both 25% and 40% displacements (see Figure 9e,f), ACM and EPDM have the least RMSE at 25% and 40% displacements, respectively, (Figure 9c,d) while EPDM and NBR have the least MAPE at 25% and 40% displacements, respectively, (Figure 9a,b). This presents a valid opportunity for the proposed weighted averageing technique for comprehensively assessing the MAPE, RMSE, and R2 values per hyperelastic model as well as the RLM.
Overall, the weighted average of the metrics—MAPE, RMSE, and R2—were computed for each of the hyperelastic models and the RLM, and their results presented in Figure 10 below for 25% and 40% displacements.
The values were computed by summing the weighted MAPE, RMSE, and R2 values of each hyperlastic model and RLM for the 25% and 40% displacements, respectively, and dividing by the sum of the weights. For Figure 10a, each of the respective model’s metric-specific weights were calculated as the sum of the metric-specific value for the different materials per model while for the materials (see Figure 10b), the respective RLM metric specific weights were calculated as the sum of the metric-specific value for the different models per RLM. As shown in Figure 10a, the Ogden, MR, and Yeoh models are clearly the most efficient models with Ω values of 18.54%, 19.31%, and 21.96% for 40% displacement, and 22.1%, 21.7%, and 21.17% for 25% displacement, respectively. In contrast, the Arruda–Boyce, Gent, and Neo models are the most inefficient models with the Gent returning the highest weighted average error of 37.48%, and 38.71% for 25% and 40% displacements, respectively. Amidst the efficiencies of the Ogden, Mooney–Rivlin, and Yeoh models, although the Ogden model returned the least weighted average error of 18.54%, one may be inclined to choosing the Mooney–Rivlin considering its efficiency (low weighted averaged error values) even as the displacement increases from 25% to 40%. This is in contrast to the Ogden whose weighted averaged error value increase to 22.10% as the displacement increases to 40%. From a consistency standpoint, the Yeoh model is the most consistent as seen in the marginal error difference amidst increasing displacement while the Arruda–Boyce model is most inconsistent as shown in the high error margin as the displacement increases from 25% to 40%.
On the other hand, EPDM reveals strong superiority over the other RLM (followed by FKM) as the displacement increases from 25% to 40%. In addition to these empirical validation, the choice of material would most likely be in favor of the EPDM and/or FKM since both materials are both thermally efficient; hence durable at high (and low) temperatures. However, because EPDM is cheaper than the FKM (although the latter is more resistant to chemical attack) and is supported by the empirical investigation in Figure 10b, we strongly recommend the EPDM for cost-aware applications (as is usually the case for mass produced PEMFC). In contrast, although VMQ is also popular for affordability and thermal efficiency, the empirical results thus far discourages the authors to make any recommendation in its favour; especially with the EPDM being as affordable as VMQ is. In sharp contrast, although NBR has a similar thermal efficiency like the EPDM, VMQ, and FKM, is very resilient (stronger than the other RLM), and readily affordable, the poor empirical assessment discourages the authors since the available hyperelastic models lack the capacity to accurately model its behaviour.

5. Discussions, Open Issues, and Future Works

Notwithstanding the superior advantages of the PEMFC [1], the high demand for their durability, reliability, and safety remains a major concern and these have motivated the need for improved decision-making paradigms for design improvement [2]. PEMFC stack demands gaskets to enclose the oxidation and reduction gases during operation therefore, require long-term reliability especially under varying thermal, stress, and uncertain conditions. This heightens the need for conducting failure mode effect and criticality analysis (FMECA) for extracting optimized design specifications and chiefly, ensuring appropriate material selection [27]. So far, the motivation behind this study has been supported by the empirical investigations for hyperelastic model selection on one hand and material selection on the other. Although the results provide stronger decision making paradigm for model selection, they contribute little to material selection since material selection also depends on other factors like thermal resistance, costs, resistance to chemical attack, degradation rate, etc. [5,7,8,9,10,11,12,27]. Nonetheless, it provides an extra assessment framework for RLM selection based on the availability of hyperelastic models for FEM and/or FEA. One may argue that since there are commercialized RLM gaskets in the market and that further investigative studies related to ours are no longer needed; however, the question of which hyperelastic model(s) should be prioritized for FEA-assisted material selection remains open for continued studies. Although our study does not cover all the commercially available RLM gaskets and all the existing hyperleastic models, we believe our study opens up the room for exploring relevant answers to the question and would motivate continued research in the area.
Amidst the strengths of this study, the generality of the findings remain open for continued investigations since for instance, the effect of different temperature ranges, chemical attack, ageing (degradation) and/or pressure distribution were not considered [3]. Although most of the investigated RLM offer high reliability and are inter-replaceable, the question of which outperforms the other (considering key performance indicators) remains critical [15,16]. Notwithstanding the material of choice, it is even more critical to assess the appropriate models using FEA for optimal/accurate long-term temperature-dependent and time-dependent assessments on the materials under stresses/compression [15,16,17,18,19,20,21,22,23]. This provides an avenue for accurate non-destructive reliability tests for improved design specifications and decision-making. On the other hand, even as our findings are valid for room temperature operation of the PEMFC, it is uncertain which amongst the materials would be most durable at extreme temperature conditions (such as cold start and overheating), and which of the hyperelastic models is most suitable for FEM and/or FEA at such extreme temperature conditions. Regardless, our findings provide supplementary (empirical) evidence to already-conducted studies on the RLM for material selection. We are confident that these would motivate continued research in the domain with the objective of assessing the materials (including other RLM) under different stress and pressure distributions, thermal conditions, chemical attack, and /or time-dependent factors such as ageing, degradation, and fatigue.
On a different note, FEA-based assessments offer an avenue for understanding behavioural changes (nonlinear, elastic, incompressible, and isotropic) under different tensile, compression, and shear testing using hyperelastic material models [14,15]. Although uniaxial testing alone may provide ample avenue for determining the material properties, multiple and/or integrated constitutive modelling offer better efficiencies over a single-dimension approach. Beyond uniaxial testing, biaxial and shear testing offer their individual efficiencies too and may be more reliable when integrated into a hybrid framework. This may better present a more global standpoint for critically investigating the most reliable hyperelastic model (and their variants too). These factors too shall also direct continued research since it also presents another opportunity for combining multiple materials together to improve material characteristics and application in PEMFC.

6. Conclusions

This study provides an FEA-assisted decision-making framework for choosing and/or considering the choice of rubber-like gasket materials while considering available hyperplastic models for compatibility. The empirical investigation utilizes the stress–strain data from non-destructive tensile tests on the rubber-like gasket materials at 25% and 40% displacements with the KS M 6518 standard for testing vulcanized rubbers. The proposed decision-making framework leverages a multi-metric regression analysis which compares the hypereleastic models’ fitness based on a weighted averaged sum of the curve fitting errors between the simulated and real stress–strain curves of the respective models. The results reveal the following:
  • The outputs from the MR, Ogden, and Yeoh hyperplastic models are the most compatible with the tensile data as shown in their low MAPE, RMSE, and R2 values while in contrast, the Gent, Arruda–Boyce, and Neo models are the most incompatible with the studied RLM samples.
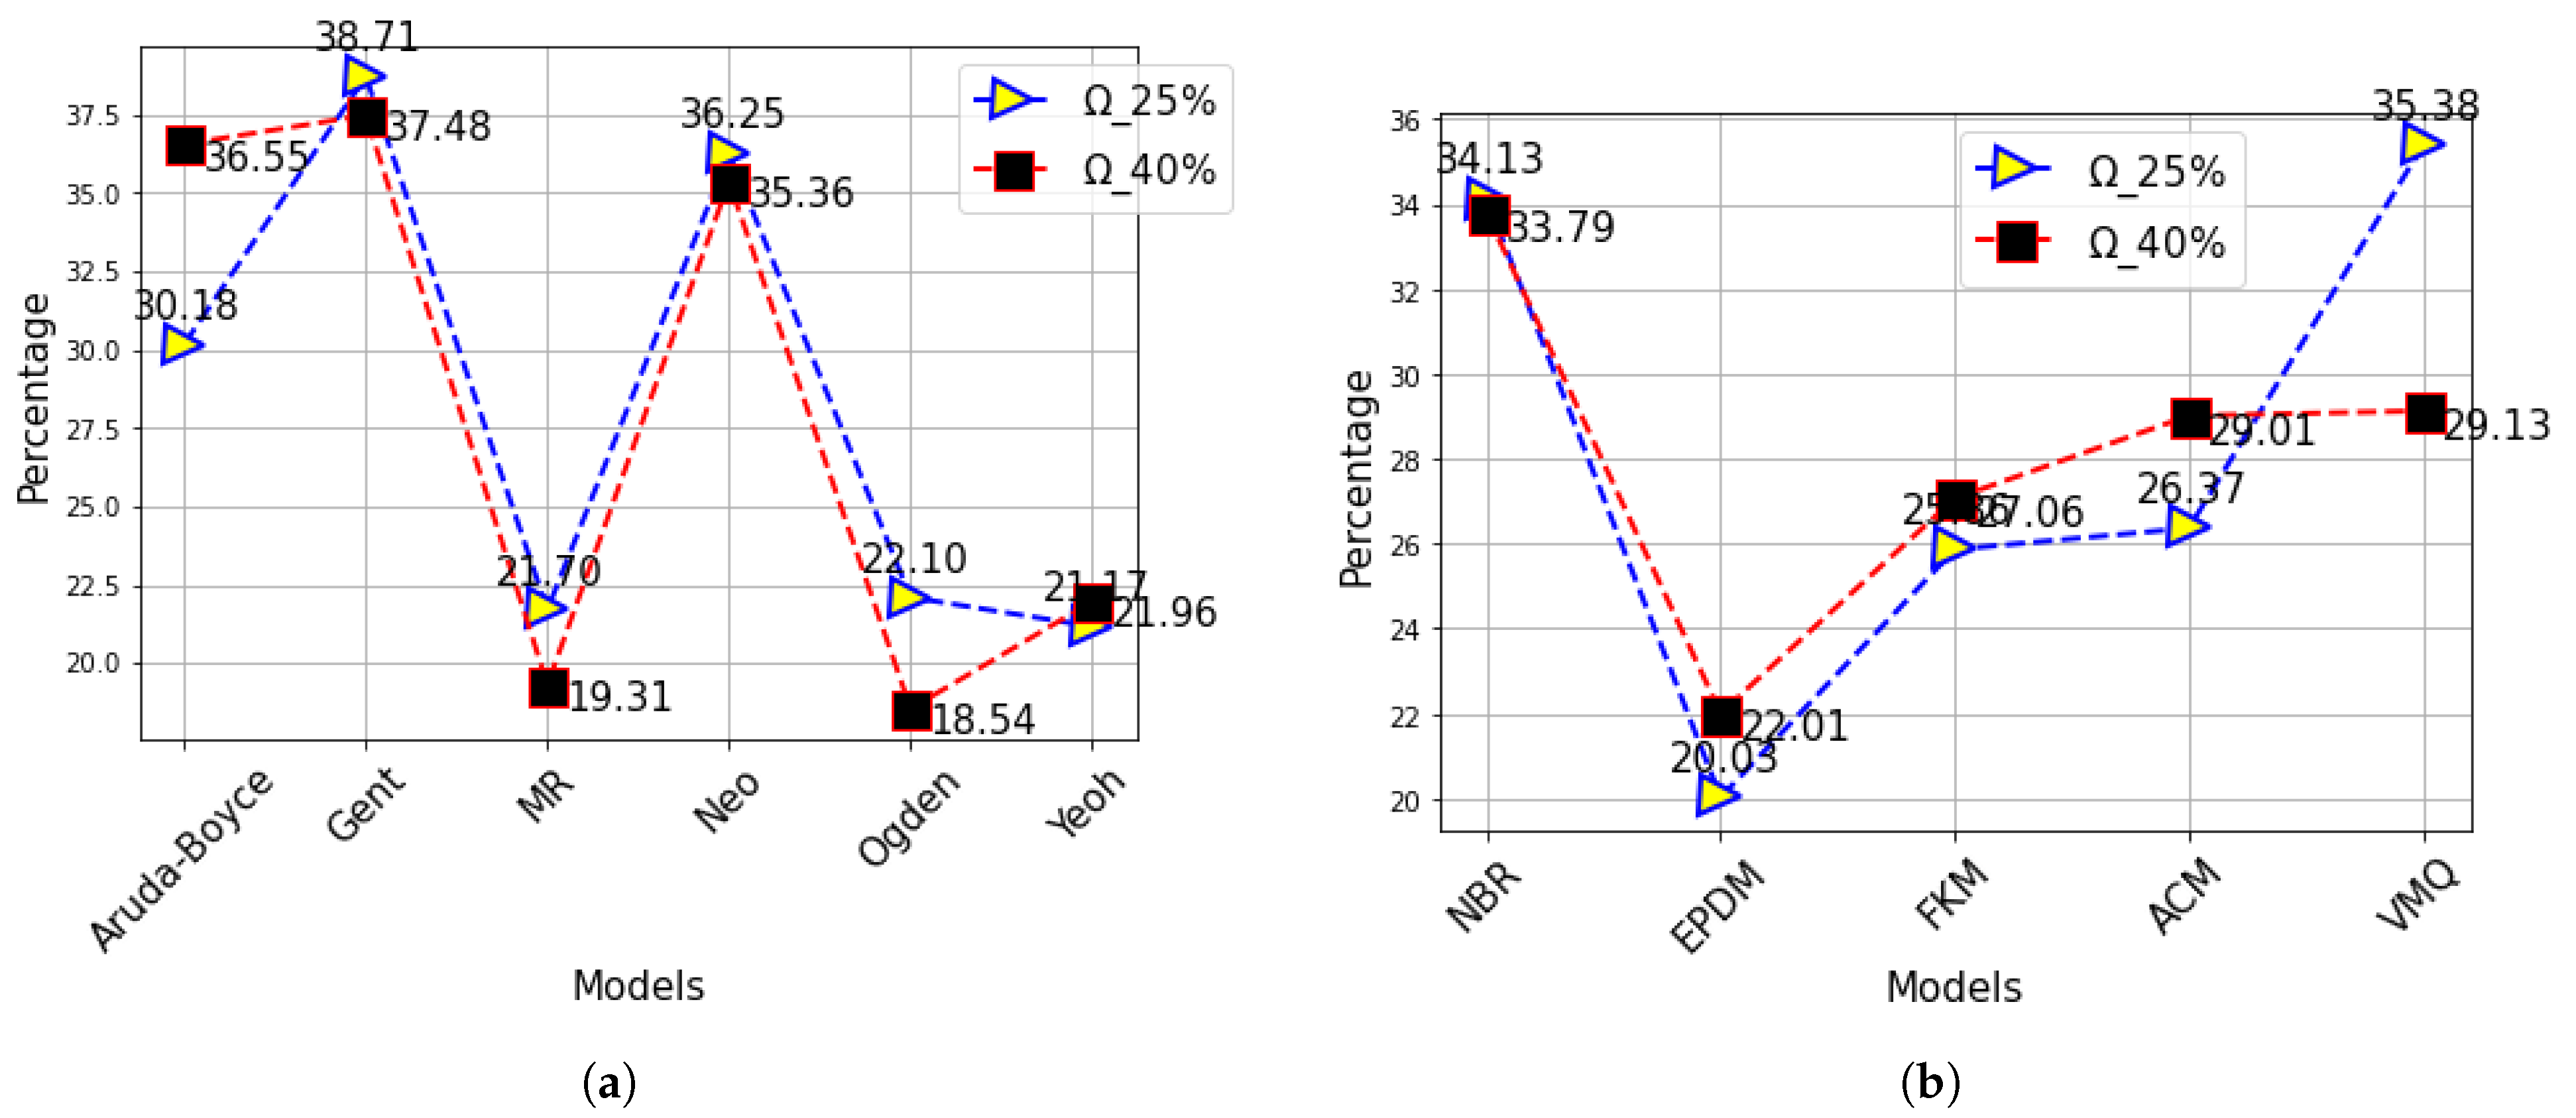
  • The proposed comprehensive decision-making metric Ω also revealed that the Ogden, MR, and Yeoh models are clearly the most efficient models with Ω values of 18.54%, 19.31%, and 21.96% for 40% displacement, and 22.1%, 21.7% and 21.17% for 25% displacement, respectively. In contrast, the Arruda–Boyce, Gent, and Neo models are the most inefficient models with the Gent returning the highest weighted average error of 37.48% and 38.71% for 25% and 40% displacements, respectively.
  • From a consistency standpoint, the Yeoh model is the most consistent as seen in the marginal error difference amidst increasing displacement while the Arruda–Boyce model is most inconsistent as shown in the high error margin as the displacement increases from 25% to 40%.
  • EPDM reveals strong superiority over the other RLM (followed by FKM and VMQ) as the displacement increases from 25% to 40%.
  • Although NBR is very resilient, has a similar thermal efficiency like the EPDM, VMQ, and FKM, and is readily affordable, the poor empirical results discourage the authors to make any favorable recommendations since the available hyperelastic models lack the capacity to accurately model its behaviour.
Overall, our findings provide supplementary (empirical) evidence to already-conducted studies on the RLM for FEA-assisted decision making and material selection. We are confident that these would motivate continued research in the domain with the objective of assessing the materials (including other RLM) under different conditions.

Author Contributions

Conceptualization, K.-M.C. and U.E.A.; methodology, U.E.A.; software, K.-M.C., U.E.A. and H.-R.J.; validation, U.E.A., A.B.K. and O.C.N.; formal analysis, U.E.A.; investigation, K.-M.C., U.E.A., A.B.K. and O.C.N.; resources, H.-R.J. and J.-W.H.; data curation, K.-M.C., U.E.A., A.B.K. and O.C.N.; writing—original draft preparation, K.-M.C., U.E.A., A.B.K. and O.C.N.; writing—review and editing, U.E.A., A.B.K. and O.C.N.; visualization, K.-M.C. and U.E.A.; supervision, J.-W.H.; project administration, J.-W.H.; funding acquisition, J.-W.H. All authors have read and agreed to the published version of the manuscript.

Funding

This study was conducted as a result of research on material parts technology development-strategic core material independence technology development by the Ministry of Commerce, Industry and Energy and the Korea Industrial Technology Evaluation Management Agency (K_G012000998302).

Institutional Review Board Statement

Not applicable.

Informed Consent Statement

Not applicable.

Data Availability Statement

The data presented in this study are available on request from the corresponding author. The data are not publicly available due to laboratory regulations.

Conflicts of Interest

The authors declare no conflict of interest.

References

  1. Liu, W.; Qiu, D.; Peng, L.; Yi, P.; Lai, X. Mechanical degradation of proton exchange membrane during assembly and running processes in proton exchange membrane fuel cells with metallic bipolar plates. Int. J. Energy Res. 2020, 44, 8622–8634. [Google Scholar] [CrossRef]
  2. Zhang, D.; Cadet, C.; Yousfi-Steiner, N.; Druart, F.; Bérenguer, C. PHM-oriented Degradation Indicators for Batteries and Fuel Cells. Fuel Cells 2017, 17, 268–276. [Google Scholar] [CrossRef]
  3. Bressel, M.; Hilairet, M.; Hissel, D.; Ould Bouamama, B. Remaining Useful Life Prediction and Uncertainty Quantification of Proton Exchange Membrane Fuel Cell Under Variable Load. IEEE Trans. Ind. Electron. 2016, 63, 2569–2577. [Google Scholar] [CrossRef]
  4. Faydi, Y.; Lachat, R.; Meyer, Y. Thermomechanical characterization of commercial Gas Diffusion Layers of a Proton Exchange Membrane Fuel Cell for high compressive pre-load sunder dynamic excitation Fuel. J. Power Sources 2016, 182, 124–130. [Google Scholar] [CrossRef]
  5. Basuli, U.; Jose, J.; Lee, R.H.; Yoo, Y.H.; Jeong, K.U.; Ahn, J.H.; Nah, C. Properties and degradation of the gasket component of a proton exchange membrane fuel cell–a review. J. Nanosci. Nanotechnol. 2012, 12, 7641–7657. [Google Scholar] [CrossRef]
  6. Bryan Hose & Gasket. All about Non-Metallic Gaskets. Available online: https://blog.bryanhose.com/all-about-non-metallic-gaskets/ (accessed on 19 September 2016).
  7. Mori, M.; Stropnik, R.; Sekavčnik, M.; Lotrič, A. Criticality and Life-Cycle Assessment of Materials Used in Fuel-Cell and Hydrogen Technologies. Sustainability 2021, 13, 3565. [Google Scholar] [CrossRef]
  8. Wu, F.; Chen, B.; Yan, Y.; Chen, Y.; Pan, M. Degradation of Silicone Rubbers as Sealing Materials for Proton Exchange Membrane Fuel Cells under Temperature Cycling. Polymers 2018, 10, 522. [Google Scholar] [CrossRef] [Green Version]
  9. Tan, J.; Chao, Y.J.; Yang, M.; Williams, C.T.; Van Zee, J.W. Degradation characteristics of elastomeric gasket materials in a simulated PEM fuel cell environment. J. Mater. Eng. Perform. 2008, 17, 779–785. [Google Scholar] [CrossRef] [Green Version]
  10. Diankai, Q.; Peng, L.; Linfa, P.; Peiyun, Y.; Lai, X.; Ni, J. Material behavior of rubber sealing for proton exchange membrane fuel cells. Int. J. Hydrogen Energy 2020, 45, 5465–5473. [Google Scholar] [CrossRef]
  11. Qiang, X.; Jinghui, Z.; Yanqin, C.; Shaoquan, L.; Zixi, W. Effects of gas permeation on the sealing performance of PEMFC stacks. Int. J. Hydrogen Energy 2021, 46, 36424–36435. [Google Scholar] [CrossRef]
  12. Aweimer, A.; Bouzid, A.H. Evaluation of interfacial and permeation leaks in gaskets and compression packing. J. Nucl. Eng. Radiat. Sci. 2019, 5, 9. [Google Scholar] [CrossRef]
  13. Zhang, J.; Yang, H.; Chuanjun, H.; Han, Z. Stress response and contact behavior of PEMFC during the assembly and working condition. Int. J. Hydrogen Energy 2021, 46, 30467–30478. [Google Scholar] [CrossRef]
  14. Gilles, M.; Erwan, V. Comparison of hyperelastic models for rubber-like materials. Rubber Chemistry and Technology. Am. Chem. Soc. 2006, 79, 835–858. [Google Scholar] [CrossRef]
  15. Zihan, Z.; Xihui, M.; Fengpo, D. modelling and Verification of a New Hyperelastic Model for Rubber-Like Materials. Math. Probl. Eng. 2019, 2019, 2832059. [Google Scholar] [CrossRef]
  16. Yaya, K.; Bechir, H. A new hyperelastic model for predicting multi-axial behavior of rubber-like materials: Formulation and computational aspects. Mech. Time-Depend. Mater. 2018, 22, 167–186. [Google Scholar] [CrossRef]
  17. Dal, H.; Açıkgöz, K.; Badienia, Y. On the Performance of Isotropic Hyperelastic Constitutive Models for Rubber-Like Materials: A State of the Art Review. ASME. Appl. Mech. Rev. March 2021, 73, 020802. [Google Scholar] [CrossRef]
  18. Meng, L.; Yang, X.; Salcedo, E.; Baek, D.-C.; Ryu, J.E.; Lu, Z.; Zhang, J. A combined modelling and Experimental Study of Tensile Properties of Additively Manufasctured Polymeric Compaosite Materials. J. Mater. Eng. Perform 2020, 29, 2597–2604. [Google Scholar] [CrossRef]
  19. Michael, R. Curve Fitting for Ogden, Yeoh and Polynomial Models. In Proceedings of the 7th International Scilab Users Conference, Paris, France, 28 June 2016. [Google Scholar] [CrossRef]
  20. Majid, S.; Ali, K.; Muhammad, Z.S.; Muhammad, F. Mechanical Characterization and FE Modelling of a Hyperelastic Material. Mater. Res. 2015, 18, 918–924. [Google Scholar] [CrossRef] [Green Version]
  21. Qiao, Y.; Zhang, J.; Zhang, M.; Liu, L.; Zhai, P. A Magneto-Hyperelastic Model for Silicone Rubber-Based Isotropic Magnetorheological Elastomer under Quasi-Static Compressive Loading. Polymers 2020, 12, 2435. [Google Scholar] [CrossRef]
  22. Ogden, R.W.; Saccomandi, G.; Sgura, I. Fitting Hyperelastic Models to Experimental Data. Comput. Mech. 2004, 34, 484–502. [Google Scholar] [CrossRef] [Green Version]
  23. Dal, H.; Badienia, Y.; Açikgöz, K.; Denlel, F.A. A Comparative Study on Hyperelastic Constitutive Models on Rubber: State of the Art After 2006. In Proceedings of the 11th European Conference on Constitutive Models for Rubber (ECCMR XI), Nantes, France, 25–27 June 2019; pp. 239–244. [Google Scholar] [CrossRef]
  24. KS M 6518:2016; Physical Test Methods for Vulcanized Rubber. Korean Industrial Standards: Seoul, Korea, 2016. Available online: https://infostore.saiglobal.com/en-gb/standards/ks-m-6518-2006-638593_saig_ksa_ksa_1507278/ (accessed on 13 January 2022).
  25. Cheon, K.M.; Jang, J.H.; Hur, J.W. Finite Element Analysis of Gaskets for Hydrogen Fuel Cells. J. Korean Soc. Manuf. Process Eng. 2021, 20, 95–101. [Google Scholar] [CrossRef]
  26. Costantini, L.; Mammi, E.; Teodori, M.; Attanasio, V. Polynomial regression models to explain the relationship between network and service key performance indicators. IET Netw. 2017, 6, 125–132. [Google Scholar] [CrossRef]
  27. Rastayesh, S.; Bahrebar, S.; Bahman, A.S.; Sørensen, J.D.; Blaabjerg, F. Lifetime Estimation and Failure Risk Analysis in a Power Stage Used in Wind-Fuel Cell Hybrid Energy Systems. Electronics 2019, 8, 1412. [Google Scholar] [CrossRef] [Green Version]
Figure 1. FEA-based Model/material Selection Procedure.
Energies 15 02580 g001
Figure 2. Stress–strain curve from short tensile testing (a) 25% displacement (b) 40% displacement.
Energies 15 02580 g002
Figure 3. KS M 6518 specimen and dimension.
Energies 15 02580 g003
Figure 4. An illustration of the FEA process (a) importing the CAD file in Hypermesh, (b) exporting the mesh after specifying the drag in Hypermesh, (c) importing the mesh file in MARC, (d) specifying the nodes, (e) specifying the boundary conditions, (f) choosing the hyperelastic model(s), (g) curve fitting using experimental data, and (h) simulation/analysis progress window.
Energies 15 02580 g004
Figure 5. Stress–strain outputs from the hyperelastic models for the materials at 25% and 40% displacement (a) NBR, (b) EPDM, (c) FKM, (d) ACM, and (e) VMQ.
Energies 15 02580 g005
Figure 6. Curve fitting by quadratic regression model on the hyperelastic model outputs for the materials at 25% and 40% displacement (a) NBR, (b) EPDM, (c) FKM, (d) ACM, and (e) VMQ.
Energies 15 02580 g006
Figure 7. Simulation error analysis on each hyperlastic model’s performance on the materials (a) 25% displacement, (b) 40% displacement.
Energies 15 02580 g007
Figure 8. Curve similarity assessment of RLM per hyperelastic model (a) MAPE at 25% displacement, (b) MAPE at 40% displacement, (c) RMSE at 25% displacement, (d) RMSE at 40% displacement, (e) R2 at 25% displacement, and (f) R2 at 40% displacement.
Energies 15 02580 g008
Figure 9. Curve similarity assessment of hyperelastic models per RLM (a) MAPE at 25% displacement, (b) MAPE at 40% displacement, (c) RMSE at 25% displacement, (d) RMSE at 40% displacement, (e) R2 at 25% displacement, and (f) R2 at 40% displacement.
Energies 15 02580 g009
Figure 10. Weighted averaged error assessment (a) hyperelastic models (b) RLM.
Energies 15 02580 g010
Table 1. Hyperelastic Model Constant Values for the selected RLM.
Mooney RivlinNeo HookeanYeoh
Material25%40%25%40%25%40%
ACM C 10 = 1.07 C 10 = 1.11 C 10 = 0.60 C 10 = 0.63 C 10 = 0.56 C 10 = 0.57
C 01 = −0.53 C 01 = −0.57 C 20 = 0.55 C 20 = 0.28
C 30 = −1.21 C 30 = −0.18
EPDM C 10 = − 0.61 C 10 = − 0.24 C 10 = 1.05 C 10 = 0.97 C 10 = 1.24 C 10 = 1.17
C 01 = 1.90 C 01 = 1.49 C 20 = − 2.46 C 20 = − 0.98
C 30 = 6.90 C 30 = 1.01
NBR C 10 = − 3.89 C 10 = 1.33 C 10 = 2.28 C 10 = 2.12 C 10 = 3.05 C 10 = 2.73
C 01 = 7.09 C 01 = 4.21 C 20 = −10.13 C 20 = −3.61
C 30 = 30.56 C 30 = 4.66
FKM C 10 = − 0.15 C 10 = 0.26 C 10 = 2.22 C 10 = 2.10 C 10 = 2.47 C 10 = 2.40
C 01 = 2.70 C 01 = 2.24 C 20 = − 3.07 C 20 = −1.54
C 30 = 7.562 C 30 = 1.61
VMQ C 10 = 0.93 C 10 = 0.28 C 10 = 0.81 C 10 = 0.82 C 10 = 0.93 C 10 = 0.86
C 01 = 1.9 × 10 7 C 01 = 0.75 C 20 = 1.47 × 10 6 C 20 = 7.10 × 10 9
C 30 = 5.54 × 10 07 C 30 = 1.66 × 10 9
OgdenArruda and BoyceGent
Material25%40%25%40%25%40%
ACM μ 1 = 0.81, α 1 = −3.04 μ 1 = 0.90, α 1 = 3.11NKT = 0.10NKT = 0.36E = 3.40E = 3.47
μ 2 = 0.77, α 2 = 1.49 μ 2 = 0.12, α 2 = −5.15N = 0.60N = 1.04 I m a x = 4.16 I m a x = 4.96
μ 3 = 2.06, α 3 = 1.67 μ 3 = −0.25, α 3 = 0.08
EPDM μ 1 = −0.70, α 1 = −7.36 μ 1 = −0.60, α 1 = −10.37NKT = 2.10NKT = 1.94E = 5.98E = 5.83
μ 2 = 4.01 × 10 5 , α 2 = −0.10 μ 2 = 0.12, α 2 = 10.07N = 2976N = 2389 I m a x = 15.81 I m a x = 1.28
μ 3 = 0.00036, α 3 = 0.041 μ 3 = 0.07, α 3 = 10.39
NBR μ 1 = −1.69, α 1 = −6.51 μ 1 = 0.89, α 1 = −4.79NKT = 4.57NKT = 4.25E = 12.73E = 12.75
μ 2 = 6.17 × 10 5 , α 2 = −0.04 μ 2 = −2.92, α 2 = −9.60N = 65.5N = 173,211 I m a x = 15.81 I m a x = 4215
μ 3 = 7.33 × 10 6 , α 3 = −0.04 μ 3 = −1.95, α 3 = 4.46
FKM μ 1 = −3.50, α 1 = −6.10 μ 1 = −44.51, α 1 = −5.22NKT = 4.45NKT = 4.19E = 12.76E = 11.81
μ 2 = 33.56, α 2 = 0.13 μ 2 = 26.34, α 2 = 0.099N = 232,248N = 544,990 I m a x = 15.82 I m a x = 16.99
μ 3 = 4.02, α 3 = −3.74 μ 3 = 43.31, α 3 = −5.18
VMQ μ 1 = 0.00052, α 1 = 0.14 μ 1 = −8.99, α 1 −0.15NKT = 1.83NKT = 0.87E = 4.40E = 4.76
μ 2 = 0.00026, α 2 = 0.178 μ 2 = −17.35, α 2 = −0.14N = 31.61N = 1.63 I m a x = 3.53 I m a x = 1.63
μ 3 = 2.01, α 3 = 1.87 μ 3 = −3.92, α 3 = −0.074
Publisher’s Note: MDPI stays neutral with regard to jurisdictional claims in published maps and institutional affiliations.

