1. Introduction
The chemical composition of lithium-ion batteries (LIBs) is known and extensively analyzed in the literature [
1]. Due to their properties, LIBs find application in various fields, such as portable electronics, electric vehicles (EVs), plug-in hybrid electric vehicles (PHEVs) and energy storage systems (ESS) [
2]. The emerging aspect is related to the safety of these devices when subjected to abuse, i.e., electrical, mechanical and thermal [
3], that can lead to thermal runaway (TR) [
4,
5] with emission of gases, such as hydrogen fluoride (HF) and phosphoryl fluoride (POF
3) [
6,
7], vapors, fire, explosion and projectiles [
8]. LIB fires have attracted attention for the intensity of the fire, the toxic gases emitted, and the high speed of the reaction. Some recent examples are the recall of Samsung’s Note 7 [
9,
10] or road accidents involving a Tesla Model S in Austria [
11]. Use of Li-ion cells in module and/or pack implies an increased risk as a single cell failure could spread to adjacent cells (domino effect) [
12].
Various studies have been carried out in the recent years to investigate the thermal stability of LIBs under thermal abuse mainly focused on the temperature profile and heat release rate (HRR) [
13]. The principal parameters that influence the thermal runaway are the internal chemical composition and the state of charge (SoC) [
14].
The behavior of a cell under heating is characterized by four general phases: ignition, violent ejection or explosion, stable burning, and extinguishment [
15]. The decomposition processes that identify each phase can be characterized by thermal analysis on the single components through Differential Scanning Calorimetry (DSC) and Thermal Gravimetric Analysis (TGA) and on the whole cell through Cone Calorimeter [
16]. The decomposition reactions of the electrolyte take place between 333–503 K, while over 408 K melting of the polymeric separator occurs, causing the electrical contact between the electrodes and their degradation reactions [
17]. Being highly exothermic reactions, they occur spontaneously and uncontrollably, causing an increase in temperatures which leads to the TR, with maximum temperatures around 723 K. The degradation reactions that occur at the anode, usually made of graphite, are attributable to the reaction of lithium both with organic carbonates, i.e., ethylene carbonate (EC), diethyl carbonate (DEC), dimethyl carbonate (DMC), and with the polyvinyldenfluoride (PVDF) binder [
18,
19].
The reactions at the cathode depend on the chemical composition of the active material [
20]. Specifically, it includes the decomposition of the metal oxide resulting in the formation of oxygen which can subsequently react with the electrolytic solution [
21].
Heat release rate (HRR) is the parameter generally used to evaluate the risk of fire to materials, to quantify the rate of fire growth, the material’s ability to ignite and contribute to the development of the heat produced during the fire and the release of smoke and toxic gases [
22]. HRR can be measured by different apparatuses, such as the cone calorimeter [
23,
24,
25], Tewarson calorimeter [
26] and the Single Burning Item (SBI) [
6,
27].
The effect of SoC on HRR was investigated through experiments in a cone calorimeter, which have shown that batteries with higher SoC present major fire hazards [
25,
28] and higher CO production, while the toxicity of gases is greater in the event of no fire than when the released gases are ignited [
29]. Among the works that examined the behavior of LIBs with different SoCs, only a few include deep discharge conditions. Ye et al. [
30] investigated the dynamic thermal behavior of LIBs during overcharge under adiabatic condition by combining a multi-channel battery cycler with an accelerating rate calorimeter (ARC). The results show that the temperature reached during thermal runaway of LIBs was higher under discharge conditions. Ouyang et al. [
31,
32], when exploring the thermal behaviors and fire hazards of LFP (Lithium-Iron Phosphate) batteries under discharge and overcharge conditions, found that the discharge has a significant influence on the thermal behavior of LIBs—accelerating the warm-up phase, which results in earlier TR, and reducing the heat released. Overcharge, on the other hand, makes LIBs more unstable and easier to attain the thermal runaway.
Large-scale tests on LIBs [
33,
34] and full-scale burning tests on high-energy LIBs confirmed that the maximum HRR, the overall heat generation, and mass loss increase with the increasing of the SoC [
35]. With these tests, it is also possible to evaluate the speed of fire propagation [
36]. Indeed, experiments on multiple cells shows that arrangements of batteries with bigger heating areas have riskier and more severe fires compared with others [
35,
37,
38].
The works currently present in the literature analyze the influence of parameters, such as SoC and chemical composition, on the occurrence of thermal runaway and the corresponding HRR. However, the comparison between the behavior of cells with the operating state of charge (i.e., 50% and 100%) and over-discharged cells (0% of SoC) is not well-investigated under different thermal abuse conditions. Specifically, the impact of the over-discharge on venting and TR time, temperature, and HRR compared to those of charged cells was not previously assessed at various heating rates (i.e., radiative heat flux). Furthermore, there are no systematic and exhaustive comparative studies between cells before and after thermal runaway, in terms of internal chemical composition, especially when subjected to different radiative heat fluxes. This information is essential for correct management of both the critical phases of fires involving LIBs and the subsequent disposal of battery residues.
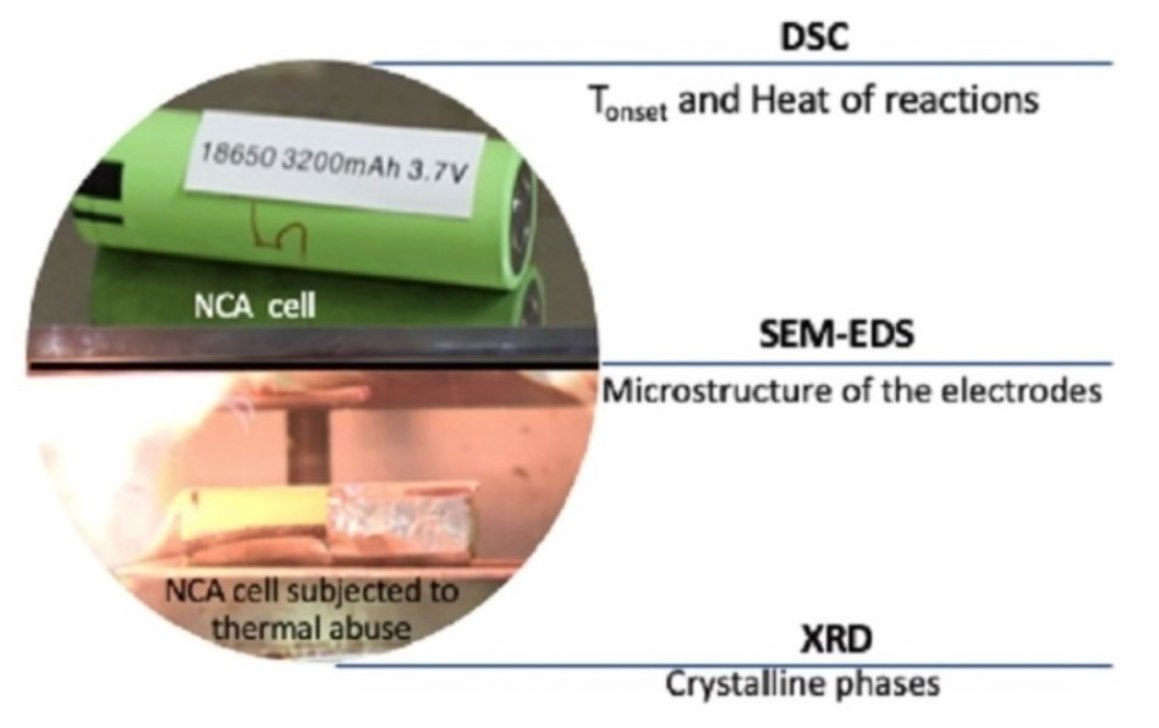
To fill this gap, the aim of this work is to study the thermal abuse behavior of Li-ion cells at different states of charge and especially focusing on over-discharged cells. Fire tests are performed on NCA 18650 cell. Measurements of the HRR are made using a cone calorimeter, varying the state of charge and the radiative heat flux of the conical heater, with the intent to reproduce the conditions that are established during a fire. Moreover, cell components are characterized before and after cone calorimetric tests using a DSC, a useful tool for evaluating the decomposition mechanism of dangerous reactive chemicals, while Scanning Electron Microscopy—Energy Dispersive X-ray Spectroscopy (SEM-EDS) and X-ray Diffraction (XRD) are used to determine the structural, morphological, and compositional changes of the cell components.
2. Materials and Methods
2.1. Materials
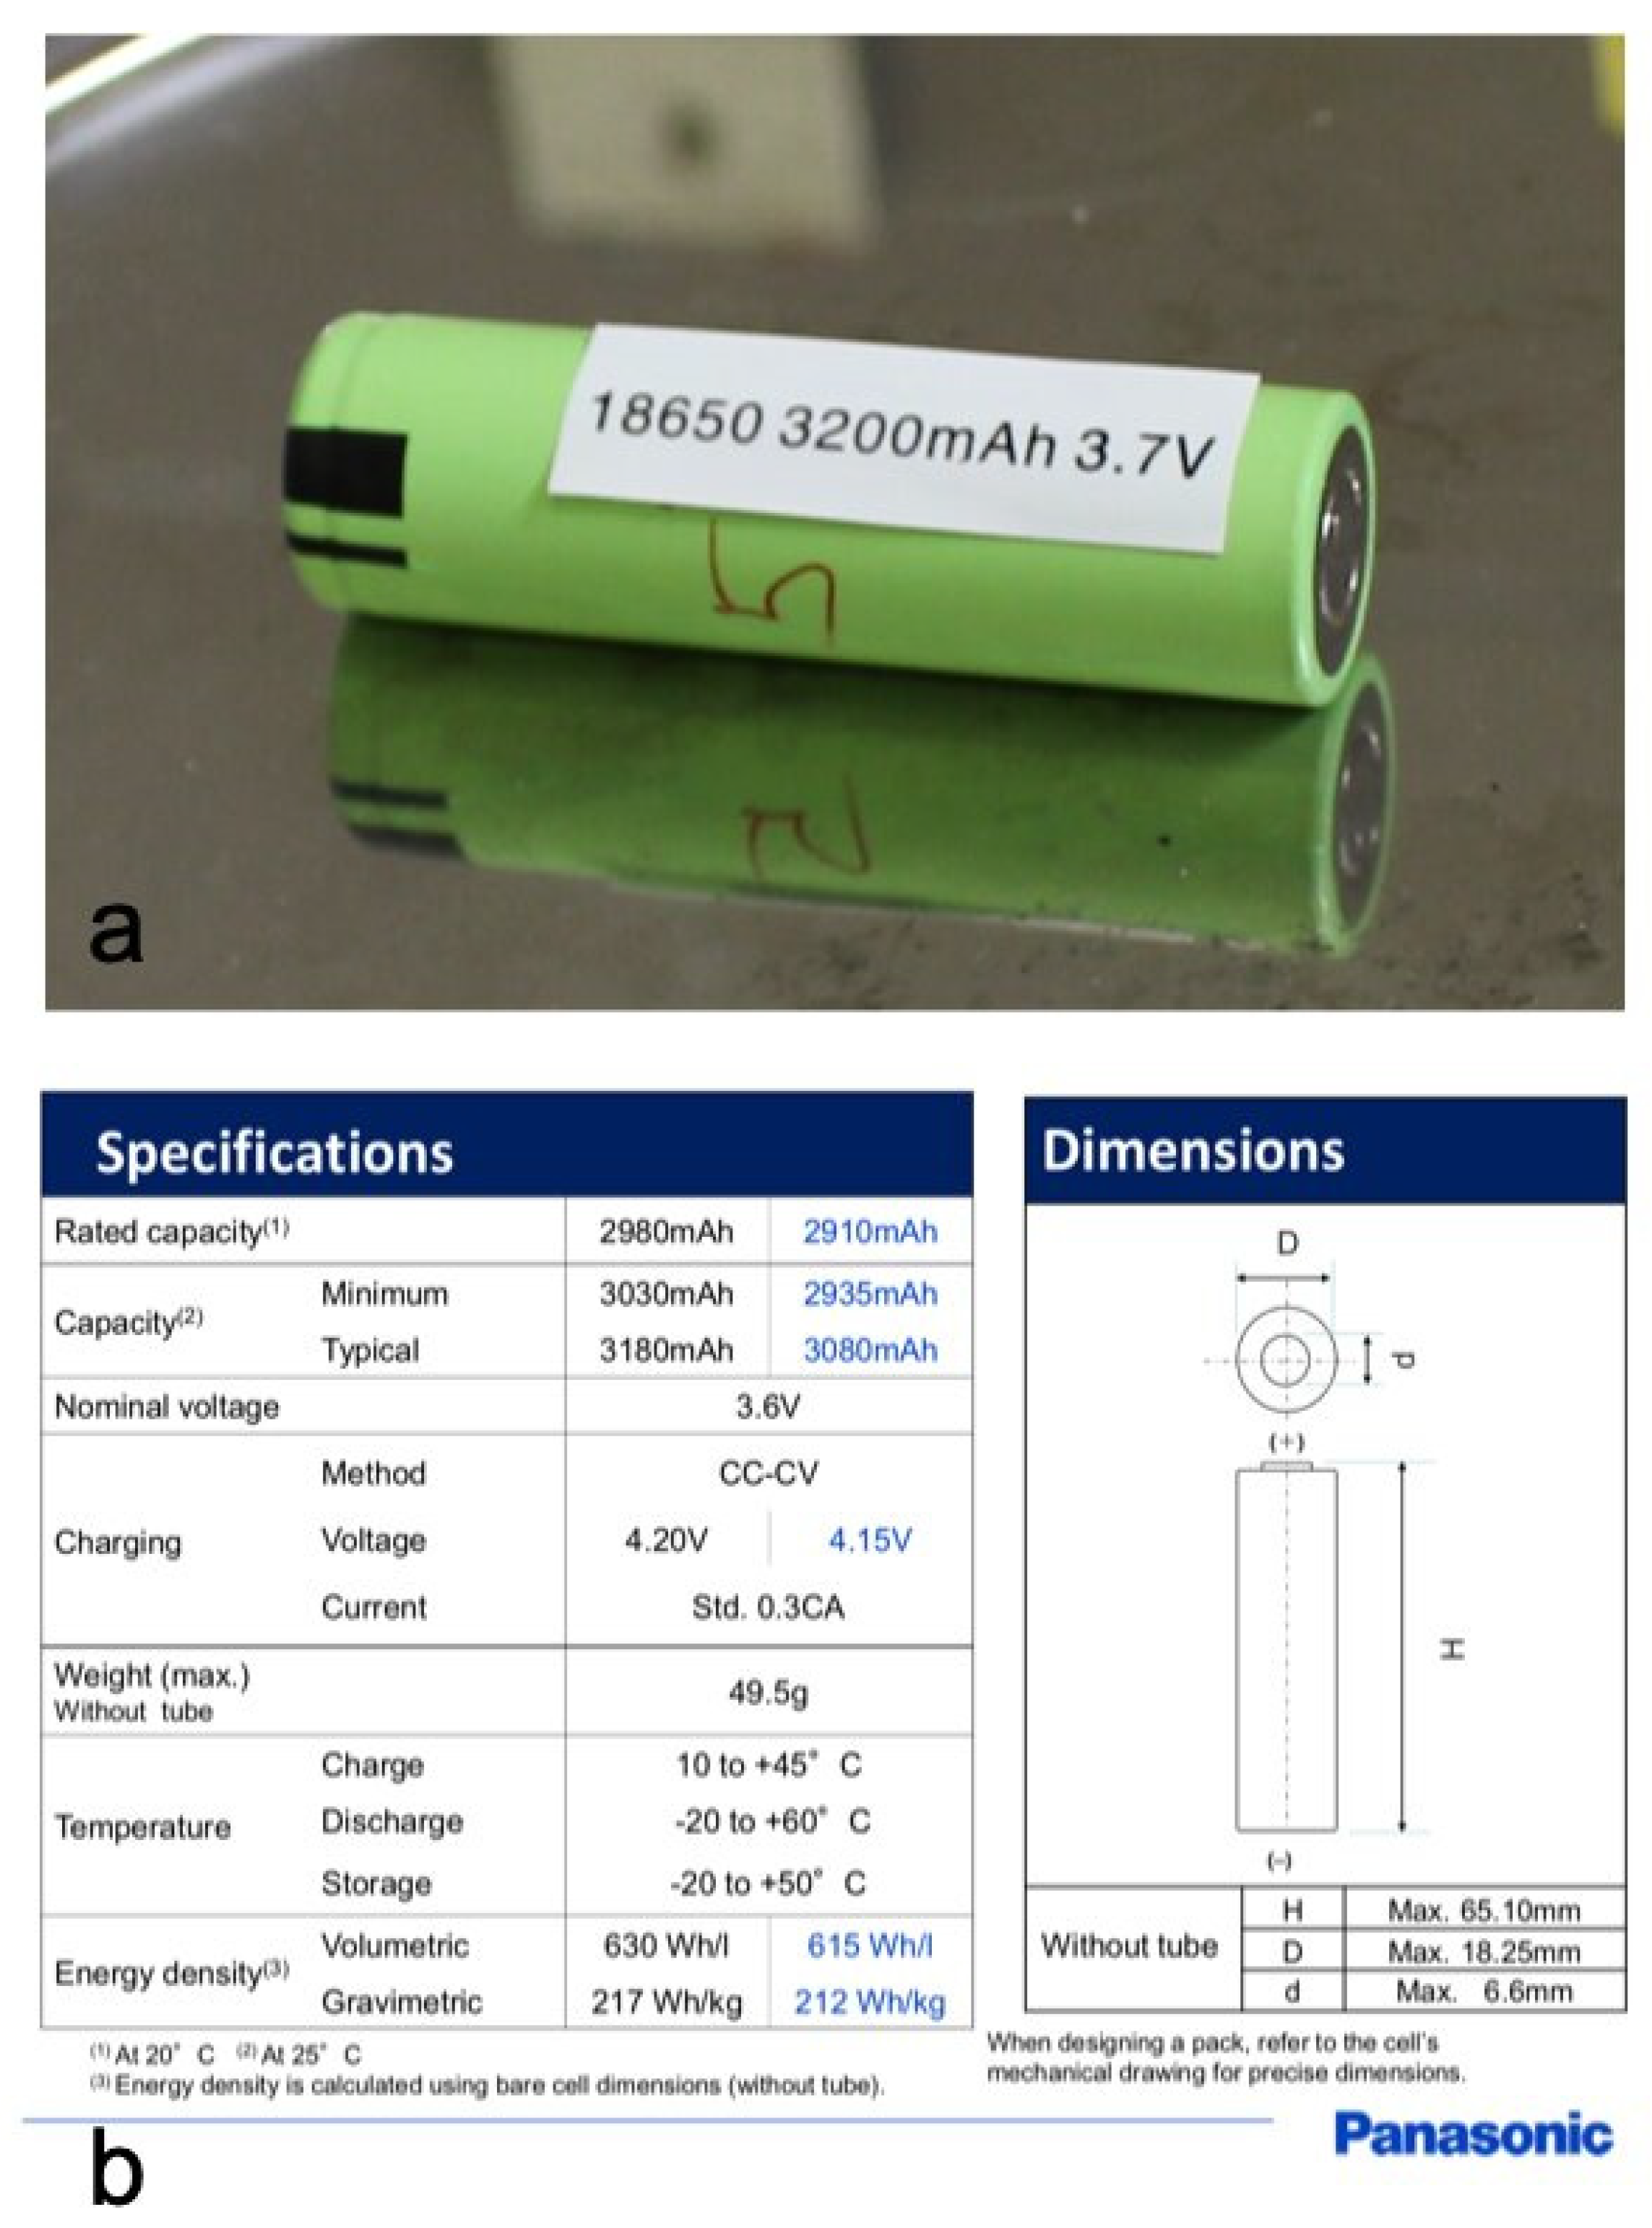
Panasonic’s 18,650 lithium-ion cylindrical cells, NCR18650B, were used in the experiments.
Figure 1 shows a cell, its dimensions, and its technical specifications [
39]. Lithium cobalt nickel aluminum oxide (LiCoNiAlO
2, 40%
w/
w) (NCA) and graphite (G, 23%
w/
w) are the active materials for the cathode and anode, respectively, while the separator is made of polyolefins (i.e., polyethylene and polypropylene). The electrodes are immersed in an electrolyte solution made of ethylene carbonate (C
3H
4O
3) (EC, 3%
w/
w), diethyl carbonate (C
5H
10O
3) (DEC, 3%
w/
w), and dimethyl carbonate (C
3H
6O
3) (DMC, 3%
w/
w) as solvents, and lithium hexafluorophosphate (LiPF
6, 2%
w/
w) as the salt, as reported in the safety data sheet.
Before fire tests, a standard procedure consisting of five charge-discharge cycles for the formation of the Solid Electrolyte Interface (SEI) was carried out on the cells. Then the cells were charged using a PS 8000 2U series power supply from Elektro-Automatik (EA). For cells at SoC = 100%, six cells in parallel were first charged at a constant current (CC) load of 12 A for 1 h, and at a maximum limit voltage of 4.2 V, then at constant voltage (CV) decreasing current to a value of 0.9 A. The same procedure was followed to obtain cells at SoC = 50% (maximum voltage of 3.35 V). For completely discharged cells (SoC = 0%), an external load (EA-EL 9080-200) was applied, with a discharge current of 0.3 A per cell. Some cells, indicated with the term new, were only subjected to a single discharge cycle, without SEI formation procedure, and used as reference in the subsequent analysis.
2.2. DSC Measurements
Prior to tests, cells were carefully dismantled in a glovebox filled with argon and the main cell components as identified in
Figure 2.
Then the two electrodes and separator were carefully kept in separate sealed containers until the DSC tests. The electrodes were tested, including the current collector, with the purpose of studying the real system “current collector/active material” and did not change the electrode system completely. High pressure resistant pans (up to 24 atm) from Perkin Elmer, hermetically sealed, were used to perform the tests, to prevent the leakage of the gases formed during the test and to avoid the danger of a catastrophic rupture of the capsule and the consequent loss of the contained material.
About 10–20 mg of the electrodes were loaded. The high-pressure capsules were crimped using a special sealing tool provided by the PerkinElmer, with fixed torque. All the tested samples were weighted before and after the experiment to test their actual hermetic closure.
DSC measurements were performed using a conventional Perkin Elmer DSC equipment (model 8500) in nitrogen flow (20 mL min
−1), in the temperature range of 298–623 K and at a heating rate of 5 K min
−1. Experimental data were carefully analyzed by Pyris software provided by the PerkinElmer [
40].
2.3. Cone Calorimeter
Tests were performed in a cone calorimeter on a single cell by varying the state of charge of the cells (i.e., 0%, 50% and 100% SoC) and the radiative heat flux of the conical heater (15 and 50 kW m−2). The values of the states of charge have been chosen to consider three typical conditions of the cell: fully charged (100%), discharged (0%) and intermediate condition (50%). These three conditions differ both for the quantity of energy stored inside the cells and for the distribution of the lithium ions. In fact, when the cell is fully charged, the Li-ions are intercalated in the anode material. When it is discharged, they are in the cathode material, while at 50% SoC, they are present in both electrode materials.
The values of the radiative heat flux were set to 15 and 50 kWm
−2 in order to compare two limiting conditions. These values were chosen based on studies present in the literature [
18,
25], which showed that for radiative heat flux lower than 15 kWm
−2, no catastrophic event occurs, but only the opening of the valve, while the opening of the valve and the explosion are observed for radiative heat flux equal to or greater than 50 kWm
−2. For each test, the temperature on the surface of the cell was monitored by a thermocouple positioned in the middle of the cell. The tests were also recorded by a video camera, and from the videos, it was possible to obtain the times relating to major events, such as venting and thermal runaway. The gas venting time, t
venting, was defined by a clearly audible sound, immediately followed by an appearance of aerosol jets from the safety vent ports. The explosion time, t
explosion, is the time when the failure of cell was observed.
The HRR was calculated following the calculation method proposed by ISO 5660-1:2015 [
23]. This method is based on the Oxygen Consumption Calorimetry (OCC) and is calculated according to Equation (1):
where
is the net heat of combustion,
is the stoichiometric oxygen/fuel mass ratio,
is the orifice flow meter calibration constant,
is the orifice meter pressure differential,
is the initial value of oxygen analyzer reading, and
is the oxygen analyzer reading (mole fraction of oxygen). Δ
hc/
r0 for the specimen is taken as 13.1 × 10
3 kJ/kg, while
is determined as the average of the oxygen analyzer output measured during the 1-min baseline measurements.
The fundamental advantage associated with this method is that the evaluation can be performed by only measuring the variation in time of the mass of oxygen, without the exact chemical composition of the material being known; it is, therefore, possible to perform tests on non-homogeneous materials such as cells and lithium-ion batteries. The error of the HRR values was calculated to be about 20%.
2.4. XRD Analysis
The crystalline phase of the samples was determined by X-ray Diffraction (XRD) analysis using a Philips Analytical PW1830 X-ray diffractometer, equipped with Cu Kα (1.54056 Å) radiation, in the 2θ range from 15 to 70° with a step size of 0.02° and a time for step of 3.5 s. The data were collected with an acceleration voltage and applied current of 40 kV and 30 mA, respectively. The crystalline phases in the resulting diffractograms were identified through the COD (Crystallography Open Database-an open-access collection of crystal structures) [
41]. No pretreatment was applied to the samples.
2.5. SEM-EDS Analysis
The microstructure of the electrodes was investigated before and after the abuse tests using a FEG-SEM MIRA3, TESCAN (Brno, Czech Republic) equipped with a SE/BSE detector at an accelerating voltage 15 kV and at different magnifications 100×–5000×. The specimens were observed as such, without metallization or other treatments [
42,
43].
3. Results
3.1. Cone Calorimeter Tests
The cone calorimeter was used to determine the time and temperatures of the main events and to calculate the HRR of NCA 18650 Li-ion cells when subject to a thermal abuse.
According to the literature, three main phases have been identified [
25]:
The onset of the thermal runaway with smoke production without flame;
The venting and ignition of the gases released: a flame is visible during this stage;
The catastrophic failure of the cell with the presence of the flame.
In
Figure 3, the pictures of these phases are shown from tests performed with cells of SoC = 0% (b–d), 50% (e–g) and 100% (h–j) at 50 kWm
−2 and 100% (k–m) at 15 kWm
−2. It was observed that at 15 kW/m
2, the venting phase is not accompanied by a flame.
In
Figure 4, pictures of the cell residues are shown, after the thermal abuse tests presented in
Figure 3.
From the comparison reported in
Figure 4, it is clear that the loss of the internal material is variable in different experimental conditions. In the case of the 50 kWm
−2, 50% SoC test (
Figure 4c), there is the expulsion with complete detachment of the internal solid material, while for 0% SoC (
Figure 4d), the internal material remains attached to the cell casing. On the contrary, the loss of internal material is not observed for cells of 100% SoC (
Figure 4a,b).
Figure 5 reports the results in terms of HRR vs. time obtained for the test at 50 kWm
−2.
Table 1 shows the results of the tests performed in the various experimental conditions, i.e., radiative heat flux of 15 and 50 kWm
−2, on cells at different state of charge, i.e., 0%, 50% and 100%.
The results show that the SoC is an important parameter for the prediction of the behavior of the Li-ion cells when exposed to a thermal abuse because it affects the onset of the thermal runaway and consequently HRR (
Figure 4). In particular, for the over-discharged cell, a catastrophic failure was not observed at low radiative heat flux (15 kWm
−2), while at high radiative heat flux (50 kWm
−2), the values of HRR peak and of the maximum temperature were found higher than those for cells at SoC = 50% and 100%. Moreover, for cells which have undergone a deep discharge cycle, the venting time and the explosion time, when it occurs, is shorter than those for cells at SoC = 50% and 100% (
Figure 3,
Table 1). These results are in agreement with the literature [
32], where it is found that batteries which undergo a deep discharge when exposed to an external heat source fail earlier. This behavior is justified by the fact that the over-discharge mechanism causes the extraction of the lithium ions intercalated at the anode, which, passing through the membrane, are deposited on the cathode. The continuous deposition of lithium ions on the cathode surface leads to the continuous growth of dendrites, which can then penetrate the separator, causing an internal short circuit [
44]. It is therefore possible to say that a complete discharge can be considered electrical abuse.
Regarding the comparison between cells at SoC = 50% and 100%, the results reported in
Figure 4 at 50 kWm
−2 show that for fully charged cells, the increase in HRR occurs at a shorter time with a rapid evolution of the reactions that quickly lead to the catastrophic failure of the cell. This result can be ascribed to both the greater energy accumulated inside the cell [
6,
7,
27], and the higher amount of lithium (metallic and intercalated) available at the anode of the cell with SoC = 100% than that 50% [
45]. In fact, as will also be demonstrated later by the results of the DSC analysis, the first degradation reaction that occurs (in the range 423–443 K) inside the cell is at the anode and involves the electrolyte solution. Therefore, when the cell is fully charged, there is a greater availability of lithium which allows a faster kinetics of the reaction on one side, and on the other, the energy content of the cell is higher, and it is available to the cell to reach the activation energy for the reaction faster.
This behavior is emphasized at higher radiative heat flux. In fact, comparing the results of tests at different radiative heat fluxes for both cells with SoC = 50% and 100%, the venting and explosion times at 50 kWm
−2 are lower than those at 15 kWm
−2 (
Table 1).
Furthermore, for cells with SoC = 100%, a similar peak value of HRR (0.8 kW vs. 1.0 kW) and the same value of total energy released (34 kJ) were measured compared to cells with SoC = 50%. It should also be emphasized that the value of 15 kWm
−2 was chosen to identify the minimum conditions at which the thermal runaway occurs, and for tests with a 0% SoC cell in these conditions, the change in O
2 concentration was lower than sensitivity of the instrument (n.d. in
Table 1).
Analyzing the total energy released, calculated by integrating the HRR vs. time profile, it was also found that at higher radiative heat flux, the values of total energy released from cell are comparable and independent from the SoC, while at lower radiative heat flux, the energy released increased with the SoC. In the literature, conflicting results are reported [
22,
32], while Wang et al. [
14] found similar results. The observed behavior can be attributed to the shortest time for the onset of thermal runaway observed at higher radiative heat flux and, hence, to the lower degree of completion of the chemical reactions which leads to a lower release of the total thermal energy [
46].
3.2. DSC Analysis
DSC tests were performed both on the components (anode and cathode) of the “new” cell and on the residues of the cell recovered at the end of the cone calorimeter tests (A4-B1). The experimental conditions of the cone calorimeter tests to which the samples refer are reported in
Table 1.
Figure 6 shows the DSC curve referring to the anode of a new cell, discharged and not subjected to the SEI formation cycles.
Two exothermic peaks are observed at 430 K (ΔH = −11.24 J/g) and 503 K (ΔH = −0.70 J/g), respectively. Replicate tests on anode samples show both exothermic peaks, but the first is in the range of temperatures 423–443 K, and the second in the range 502–546 K.
The DSC peaks in
Figure 6 can be attributed to the decomposition reactions of the electrolyte contained inside the porosity of the electrode. Indeed, while the carbonate solvents are relatively stable on their own, the addition of LiPF
6 has been demonstrated to catalyze thermal breakdown of the solvents into various volatile species [
47,
48].
Solid LiPF
6 is in equilibrium with solid LiF and PF
5 gas. In the bulk electrolyte, the equilibrium can move toward products as PF
5 reacts with the solvents. The Lewis acid property of the PF
5 induces a ring-opening polymerization of the EC that is present in the electrolyte and can lead to polyethylene oxide (PEO)-like polymers. The polymerization is exothermic and leads to a violent decomposition. The PEO-like polymers also react with the PF
5 to yield further products that may be soluble in the electrolyte (e.g., carbonate) [
49]. Additionally, the presence of water impurities has been shown to have an impact on the decomposition of battery electrolytes. The presence of trace water or alcohol impurities allows for the formation of POF
3, which catalyzes further decomposition of the electrolyte [
47,
50].
The DSC curve obtained from the cathode of a new cell is reported in
Figure 7.
One exothermic peak is observed at 528 K (ΔH = −5.15 J/g). As reported in the literature during the decomposition of cathode, various processes were identified: evaporation of electrolyte, decomposition of lithium cobalt nickel aluminum oxide (NCA) with liberation of oxygen, combustion of electrolyte with the liberated oxygen, decomposition of binder, decomposition of EC and combustion of carbon additive [
16]. Results of two DSC measurements from the same publication [
51] about NCA cathode, where one sample contains electrolyte and the other does not, showed that DSC curves have identical onset behavior, but the case with electrolyte achieved more heat release and in a narrower temperature range. This suggests that the carbonate solvent is more accessible or reactive than the PVDF binder and carbon black filler. Therefore, it is expected that the decomposition of cathodic material and oxidation of electrolyte are responsible for the exothermic peak observed in
Figure 7.
The results of the DSC analysis carried out on the electrodes from the cell residues after cone calorimeter tests are shown in
Figure 8.
With regard to the anode in
Figure 8a, for sample 1B and A4, the DSC curves show an exothermic peak at 518 K (ΔH = −0.38 J/g) and at 521 K (ΔH = −0.77 J/g), respectively, which can be attributed to the degradation reaction of the of electrolyte. Regarding the cathode residues, from the analysis of the DSC traces in
Figure 8b, no further significant reactions seem to occur.
The results of the DSC analysis are summarized in
Table 2.
From the comparison between the new cell and the cell residues, significant differences emerge (
Table 2). In fact, the anode of the new cell showed two exothermic reactions peaks (430 and 503 K), while only one exothermic peak (518–521 K), attributed to the thermal degradation of the electrolyte, was found for the anode of cell residues corresponding to the two tests (A4 and 1B) performed with fully charged cells. For the cathode, an exothermic reaction at 528 K was observed only for the new cell, while cell residues did not show any reaction. This is probably due to the complete release of the electrolyte during the cone calorimeter tests.
3.3. XRD Analysis
Figure 9 and
Figure 10 show the XRD pattern of the electrodes, anode, and cathode, respectively, before (new cell) and after the thermal abuse tests at the test conditions reported in
Table 1. After the tests performed at the cone calorimeter, the electrodes and current collectors of the cell become very fragile and cannot be easily separated. For this reason, some XRD patterns of the electrodes after the abuse tests showed the mixture of the active materials of the electrodes.
XRD spectra relative to the new anode have a simple profile, and the peaks are attributable to the chemical components: graphite (G), the active material of the anode, and copper (C), the metal collector.
The spectra obtained from the analysis of anodic residues after thermal abuse, on the other hand, show a greater number of peaks. This complexity is due to the degradation of the electrolyte and the binder, PVDF. The products of these reactions, mainly lithium carbonate (Li2CO3) (LC) and lithium fluoride LiF (LF), are present in all spectra, but with different intensity (counts a.u.).
Comparing the spectra of the anode residues from cells with the same SoC (100%: 1B and A4, 50%: 5B and E2, 0%: 9B and F1), significant differences emerge only in the intensity of the peaks but not in the composition. The difference in intensity is found for samples from tests with different radiative heat flux, the most intense spectra are those with flux at 15 kWm−2. Presumably, the higher temperature reached at 50 kWm−2 allow a partial degradation of lithium carbonate.
XRD spectra of the cathode for the new cell and for the thermal abuse residues, reported in
Figure 10, show more complex patterns, in terms of number of peaks and intensity, than those previously observed for the anode, both for the initial chemical composition and the greater brittleness of the solid residues.
The spectrum of the new cathode shows peaks attributable only to the initial chemical composition of active material, i.e., lithium cobalt nickel aluminum oxide (LiCoNiAlO2). On the other hand, the diffraction patterns of cathode residues are very different from each other in terms of peak intensities and of identified compounds. Specifically, the main cathode degradation products are metallic nickel (N) and nickel oxide (NO). These two compounds are present in all spectra except the 1B spectra (100% SoC and radiative heat flux 15 kWm−2).
Metallic nickel can be formed by direct reduction of nickel oxide with the carbon present on the negative electrode, or alternatively, by decomposition of metal oxide by the rock-salt phase cathode. The rock-salt phase cathode might decompose to metal oxide and even metal as in the following reactions [
18]:
In addition to the degradation products of the cathode, it is possible to observe that compounds due to anodic degradation are also present, especially graphite (G) and lithium carbonate (Li2CO3) (LC). This contamination is always due to the fragility of the residues and therefore the difficulty of separating the two electrode active materials.
3.4. SEM-EDS Analysis
The results of SEM-EDS analysis of electrodes are reported in
Figure 11 and
Figure 12 for the new cell and after the abuse test (i.e., A4 test cell), respectively. EDAX analysis were conducted on multiple areas of the same size both on new and abused electrodes. The areas on which the analysis is carried out are identified by the red boxes in the
Figure 11a,b and
Figure 12a,b.
For the anode of the new cell, the main peak is that of carbon; it can be said that the graphite particles are homogeneously distributed on the collector surface,
Figure 11a.
Traces of fluorine and phosphorus are also visible, which can be attributable to the presence of traces of LiPF6, the electrolyte salt usually dissolved in the electrolyte solution.
For the cathode, the analysis reveals the presence of nickel, cobalt, aluminum and oxygen, all constituents of the active material of the positive electrode, which indicates that the mixed lithium oxides particles are homogeneously distributed on the collector surface. As for the negative electrode, there are traces of fluorine and phosphorus, which reveal the probable presence of traces of LiPF6.
The SEM-EDS analysis of the cell electrodes after the cone calorimeter test, reported in
Figure 12, shows that the anode has a high amount of oxygen, in addition to carbon, which confirms the formation of lithium carbonate (Li
2CO
3).
For the cathode, it is observed that in some areas (Area 1 in
Figure 12b) all the components of the active material are present, while in other areas (Area 2 in
Figure 12b), only the aluminum peak is observed and information on the composition of the cathode material is lost. This is the result of the thermal abuse that leaves the current collector, made of aluminum, partially uncovered. This appears clearly in the image in
Figure 13, where the two cathode layers (collector and active material) are clearly detached one from the other in the cell residues after cone calorimeter test.
From comparison of SEM images of the electrodes before and after cone calorimeter tests it clearly appears that both electrodes’ surfaces are not homogeneous (
Figure 14).
The damage of the original lattice structure is evident. This is due to severe conditions reached during the thermal abuse tests which modify the original lattice structure so that the particles are redistributed unmannerly and those of the anode can react while those of cathode can become disordered [
32].
4. Discussion
The results of cone calorimeter tests showed that the venting of the gases and the consequent explosion of the cell occur in a shorter time for cells with higher SoC, while the total energy released is slightly lower for cells with higher SoC. The shorter time needed to start the thermal runaway can be due to the higher energy content of the cell and to the higher amount of lithium (metallic and intercalated) available at the anode of the cell where the first reactions occur. On the other hand, the lower total energy release is probably due to the uncomplete reactions of the cell components. An important implication, derived from these results, is that the electric energy content provides the activation energy necessary to trigger the thermal runaway.
An unexpected result is that a deep discharge (SoC = 0%) can accelerate the warming phase, causing the earlier ignition of thermal runaway. This behavior was justified by considering that the over-discharge causes the extraction of the lithium ions intercalated at the anode, which pass through the membrane and are deposited on the cathode. The continuous deposition of lithium ions on the cathode surface leads to the continuous growth of dendrites, which can then penetrate the separator, causing an internal short circuit.
This means that a deep discharge can be very dangerous, and it can be considered an electrical abuse.
From the characterization of the anode and cathode material, it was possible to obtain information on the main chemical reaction involved, with relative temperatures and heat of reaction, by DSC analysis, their chemical composition, by XRD analysis, and their surface distribution, by SEM-EDS analysis. Both the electrodes, when subjected to thermal abuse, exhibit exothermic reactions due to the decomposition reactions of the electrolyte at the anode and decomposition of the cathode and oxidation of electrolyte. The chemical composition reported in the safety data sheet is confirmed by the XRD study: anode is made of graphite on a copper collector and lithium cobalt nickel aluminum oxide (LiCoNiAlO2) on an aluminum collector for the cathode. From the SEM-EDS analysis, a homogeneous distribution of the two active materials on the surface of the collectors was observed.
The results obtained by carrying out the same analyses on residues of cell electrodes after cone calorimeter tests showed a significantly different behavior. In fact, the residues subjected to thermal analysis (DSC) did not show any reaction, demonstrating that during the thermal abuse, the decomposition reactions of the electrolyte and that of the cathode material took place. The first reaction did not occur completely when the radiative heat flux was low (15 kWm−2). The XRD analysis confirmed the presence to lithium carbonate (Li2CO3) in the anode, and of metallic nickel and NO in the cathode given by decomposition of metal oxide by the rock-salt phase cathode.
In addition, it is observed that the thermal abuse causes an embrittlement of the electrode’s structure and the detachment of the active layer from the collector, especially for the cathode.
It can be concluded that the use of the cone calorimeter allows us to obtain useful data for the design and implementation of fire risk mitigation strategies for Li-ion batteries. In fact, it is possible to simulate the conditions that can occur when a cell is involved in a fire.
Furthermore, knowledge of the chemical composition of solid residues originating from lithium-ion battery abuse tests is essential for emergency interventions, remediation of areas affected by an accident, and environmental exposure assessments for the population.
The information obtained can also be used to develop safe procedures to follow when responding to accidents involving LIBs.


 ,
, 


