1. Introduction
As a rule, two independent power supply sources are used to ensure reliability at facilities requiring uninterrupted power supply. A backup source is installed additionally if there is a special group of consumers. An uninterrupted power supply system that ensures a constant quality of power supply may also be needed if power outages are too long. An uninterruptible power supply (UPS) or automatic transfer switch (ATS) to an alternative network is installed in the system, which allow a qualitative transition to the backup power line to be performed during the shutdown of the main source. To do this, energy storage devices are introduced into the UPS: batteries [
1,
2,
3,
4], supercapacitors [
5], mechanical energy storage devices [
6], or others.
Flow batteries (vanadium redox flow battery, VRFB) are one of the most efficient energy storage devices. They are suitable for long-term energy storage and have good cost characteristics with prospects for reducing the cost of stored kWh of energy [
7].
The main technical characteristics of VRFB are as follows:
Energy storage density: 30–70 J/g.
Charge/discharge efficiency: 75–80%.
Service life: 10–20 years as part of an UPS system.
Number of charge/discharge cycles: 10,000.
Nominal cell voltage: 1.15–1.55 V.
The advantages of VRFB are durability, four-fold overload capability, low self-discharge, and low cost [
8].
The disadvantages of VRFB are the complexity of the control system and the low energy storage density, which leads to an increase in weight and dimensions.
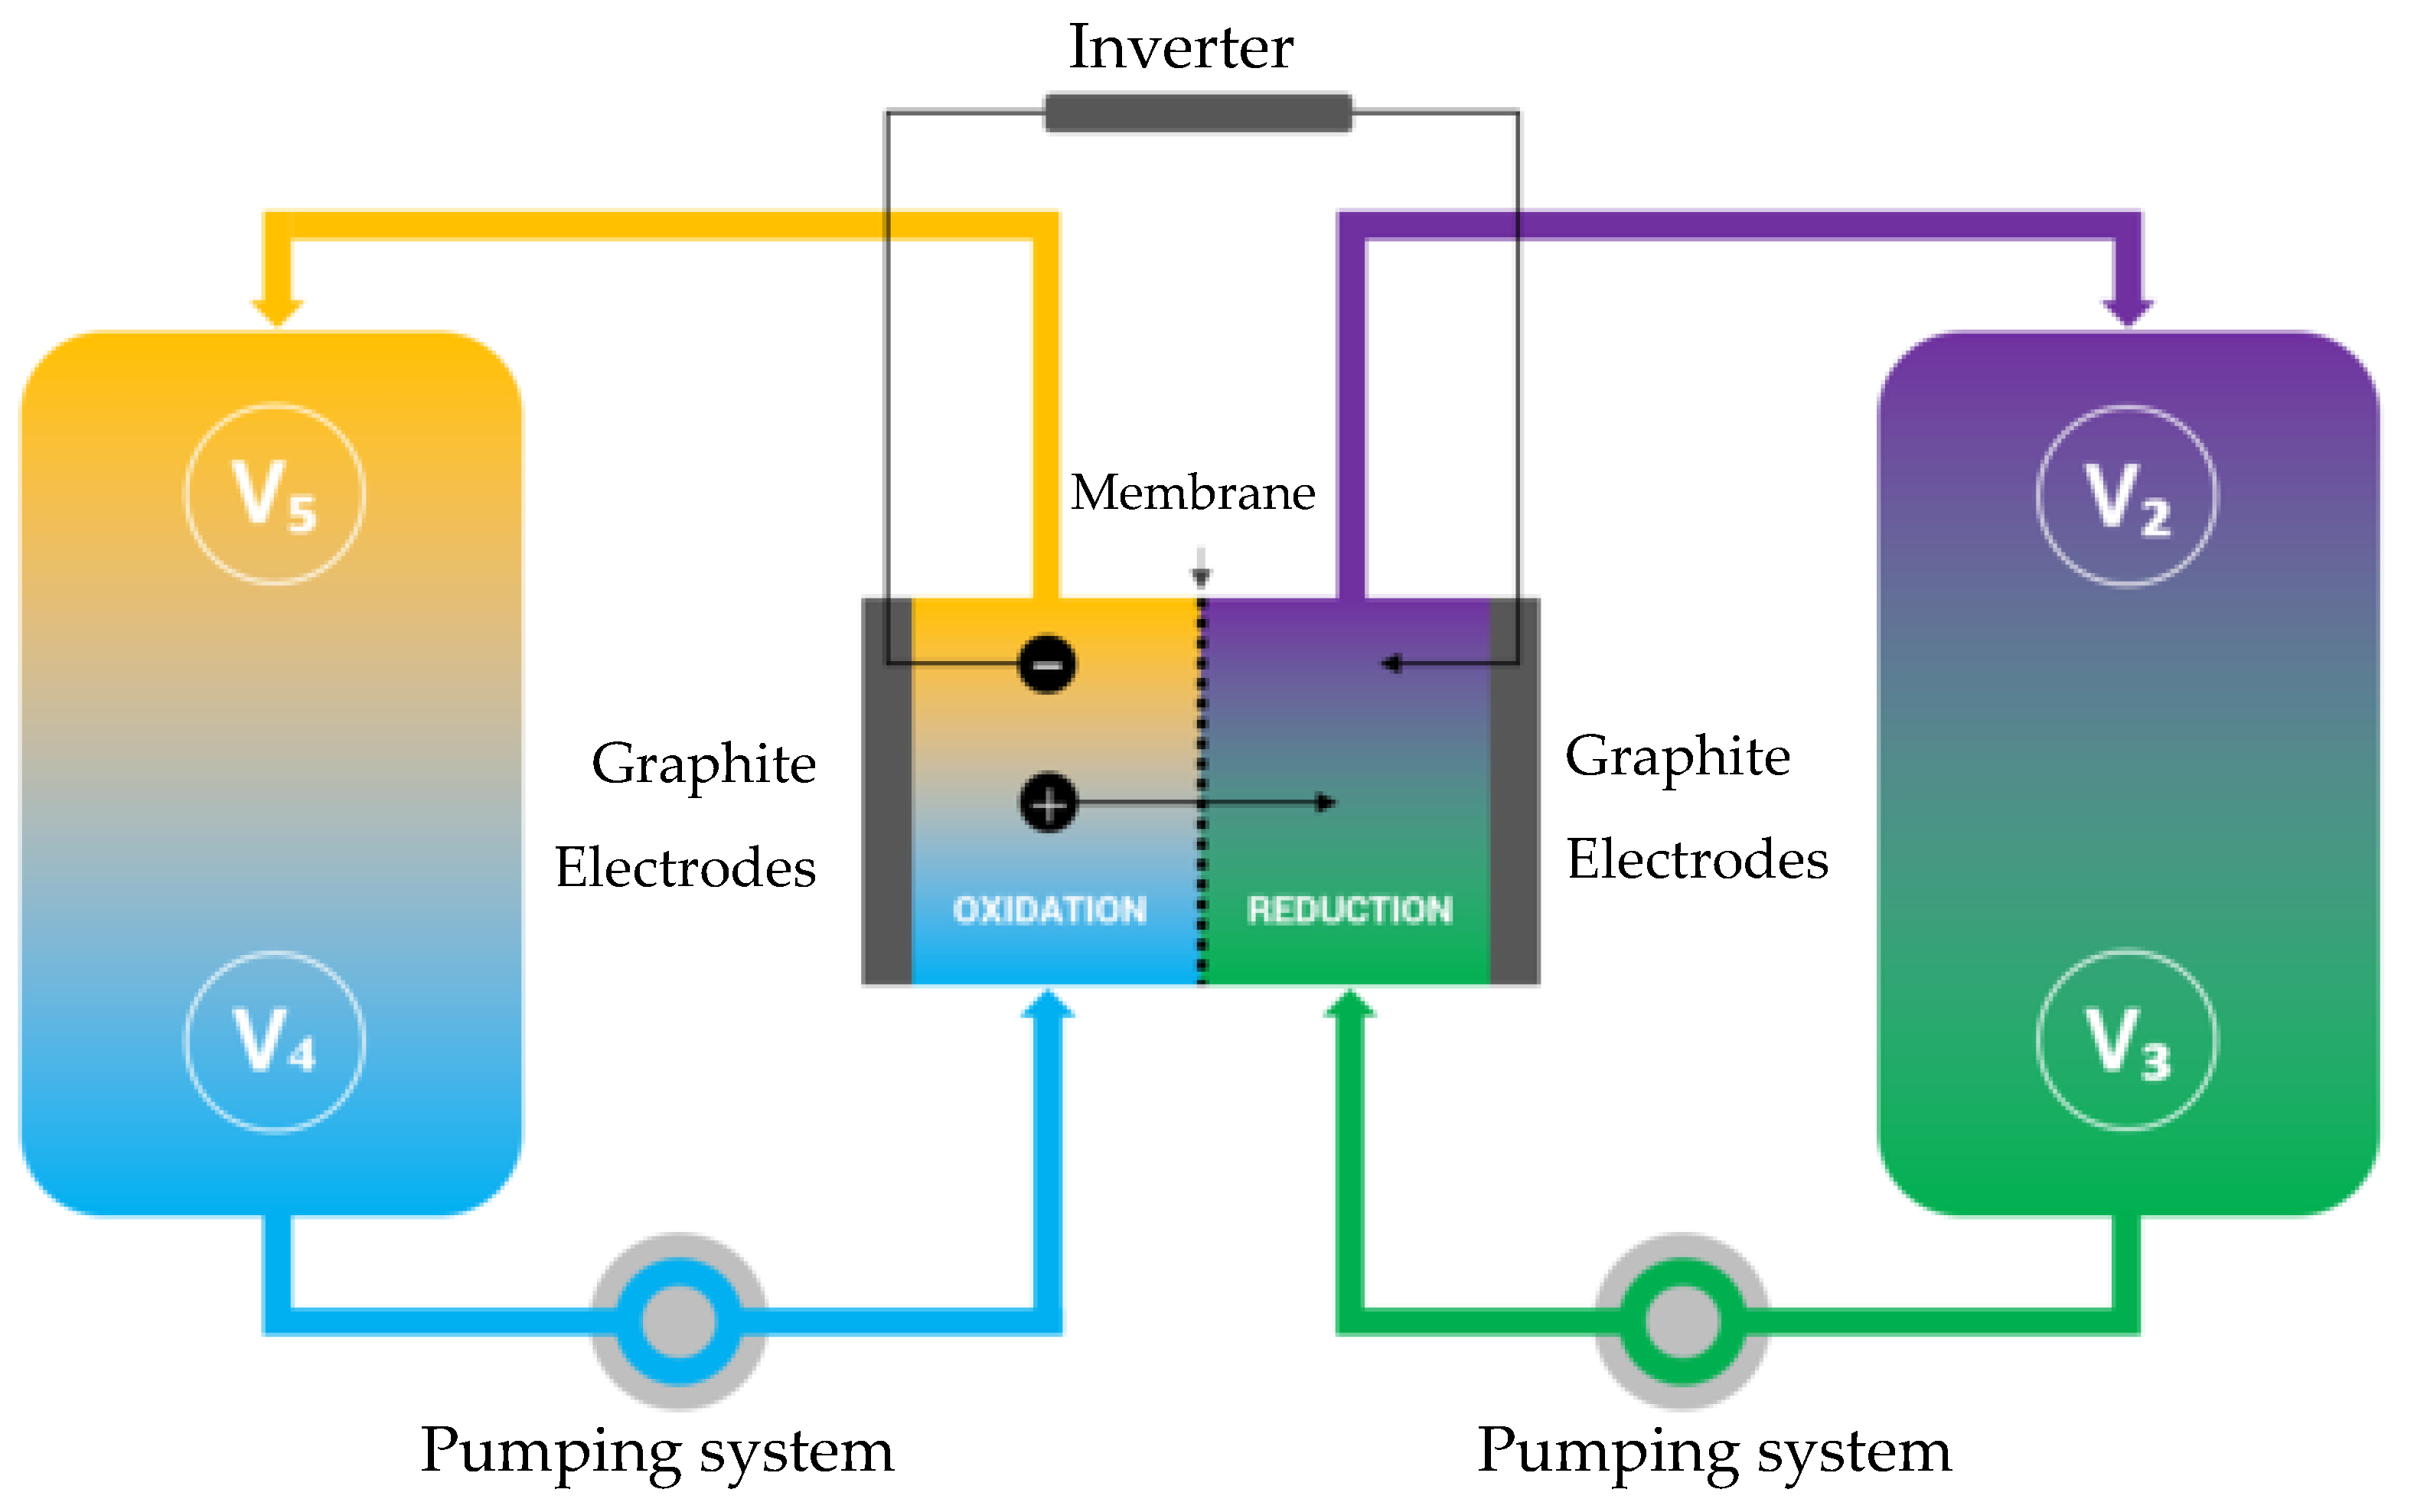
The energy of VRFB is stored in separated positive and negative electrolytes, which provide the driving force that initiates the oxidation–reduction reaction [
8]. The use of energy stored in the form of chemical energy is a mode of storage that does not entail any geographical restrictions. This is expected to facilitate large-scale energy storage and has significant environmental and socio-economic advantages. VRFBs have been utilized as large-scale energy storage systems in the last decade [
9,
10,
11,
12], because they are one of the most promising technologies for mid-to-large-scale (kW to MW) energy storage and was first proposed by Skyllas-Kazacos in 1985 [
9,
13].
Currently, electric energy storage systems (ESS) (which also include VRFB-based uninterruptible power systems) are widely used in various sectors of the economy. There are already more than 100 facilities equipped with such systems with a total capacity of more than 300 MW, according to the US Department of Energy (DOE). The main producers are the USA and China. The share of the installed capacity of flow batteries in relation to other electrochemical energy storage devices is 10% and is increasing every year [
5].
To optimize the flow battery design, it is necessary to understand the flow distribution, local current distribution, limits, and maximum current density. Understanding the shunt current and pressure distribution allows the flow battery stack to be designed with high power, large capacity, and high system efficiencies [
9,
10].
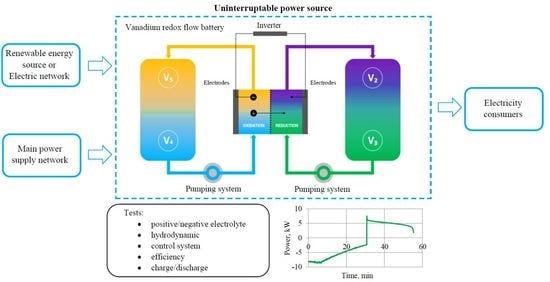
The purpose of the article is to develop and manufacture a prototype of an UPS system based on VRFB with a rated power of 5 kW and a capacity of 15 kWh.
A technology for manufacturing an electrolyte for a flow battery has been developed, and it has been synthesized at a volume sufficient for laboratory research. A 5 kW VRFB has been tested, and a layout of laboratory technological equipment for industrial electrolyte synthesis has been developed [
9].
To achieve this goal, the following main tasks have been performed:
Analysis of new-generation UPS systems based on flow batteries.
Study of the influence of the characteristics and design of electric energy storage devices on the operation of UPS systems.
The development of power converters for hybrid specialized sources.
Mathematical description and control algorithms for power supply systems with specialized power supplies.
Experimental studies of operating modes of specialized sources in power-supply systems with developed infrastructure.
The scientific novelty lies in the development and research of unique control algorithms for a UPS system based on batteries, depending on the consumer’s load, which will increase the ESS efficiency. It is also necessary to conduct a study of the operability of the UPS system in emergency situations in order to optimize the operation of the control algorithm. Within the framework of this work, the stability of the electrolyte during cycling has been determined, and ways of restoring the resource of a vanadium redox flow battery without changing the electrolyte in the system have been investigated.
3. Materials and Methods
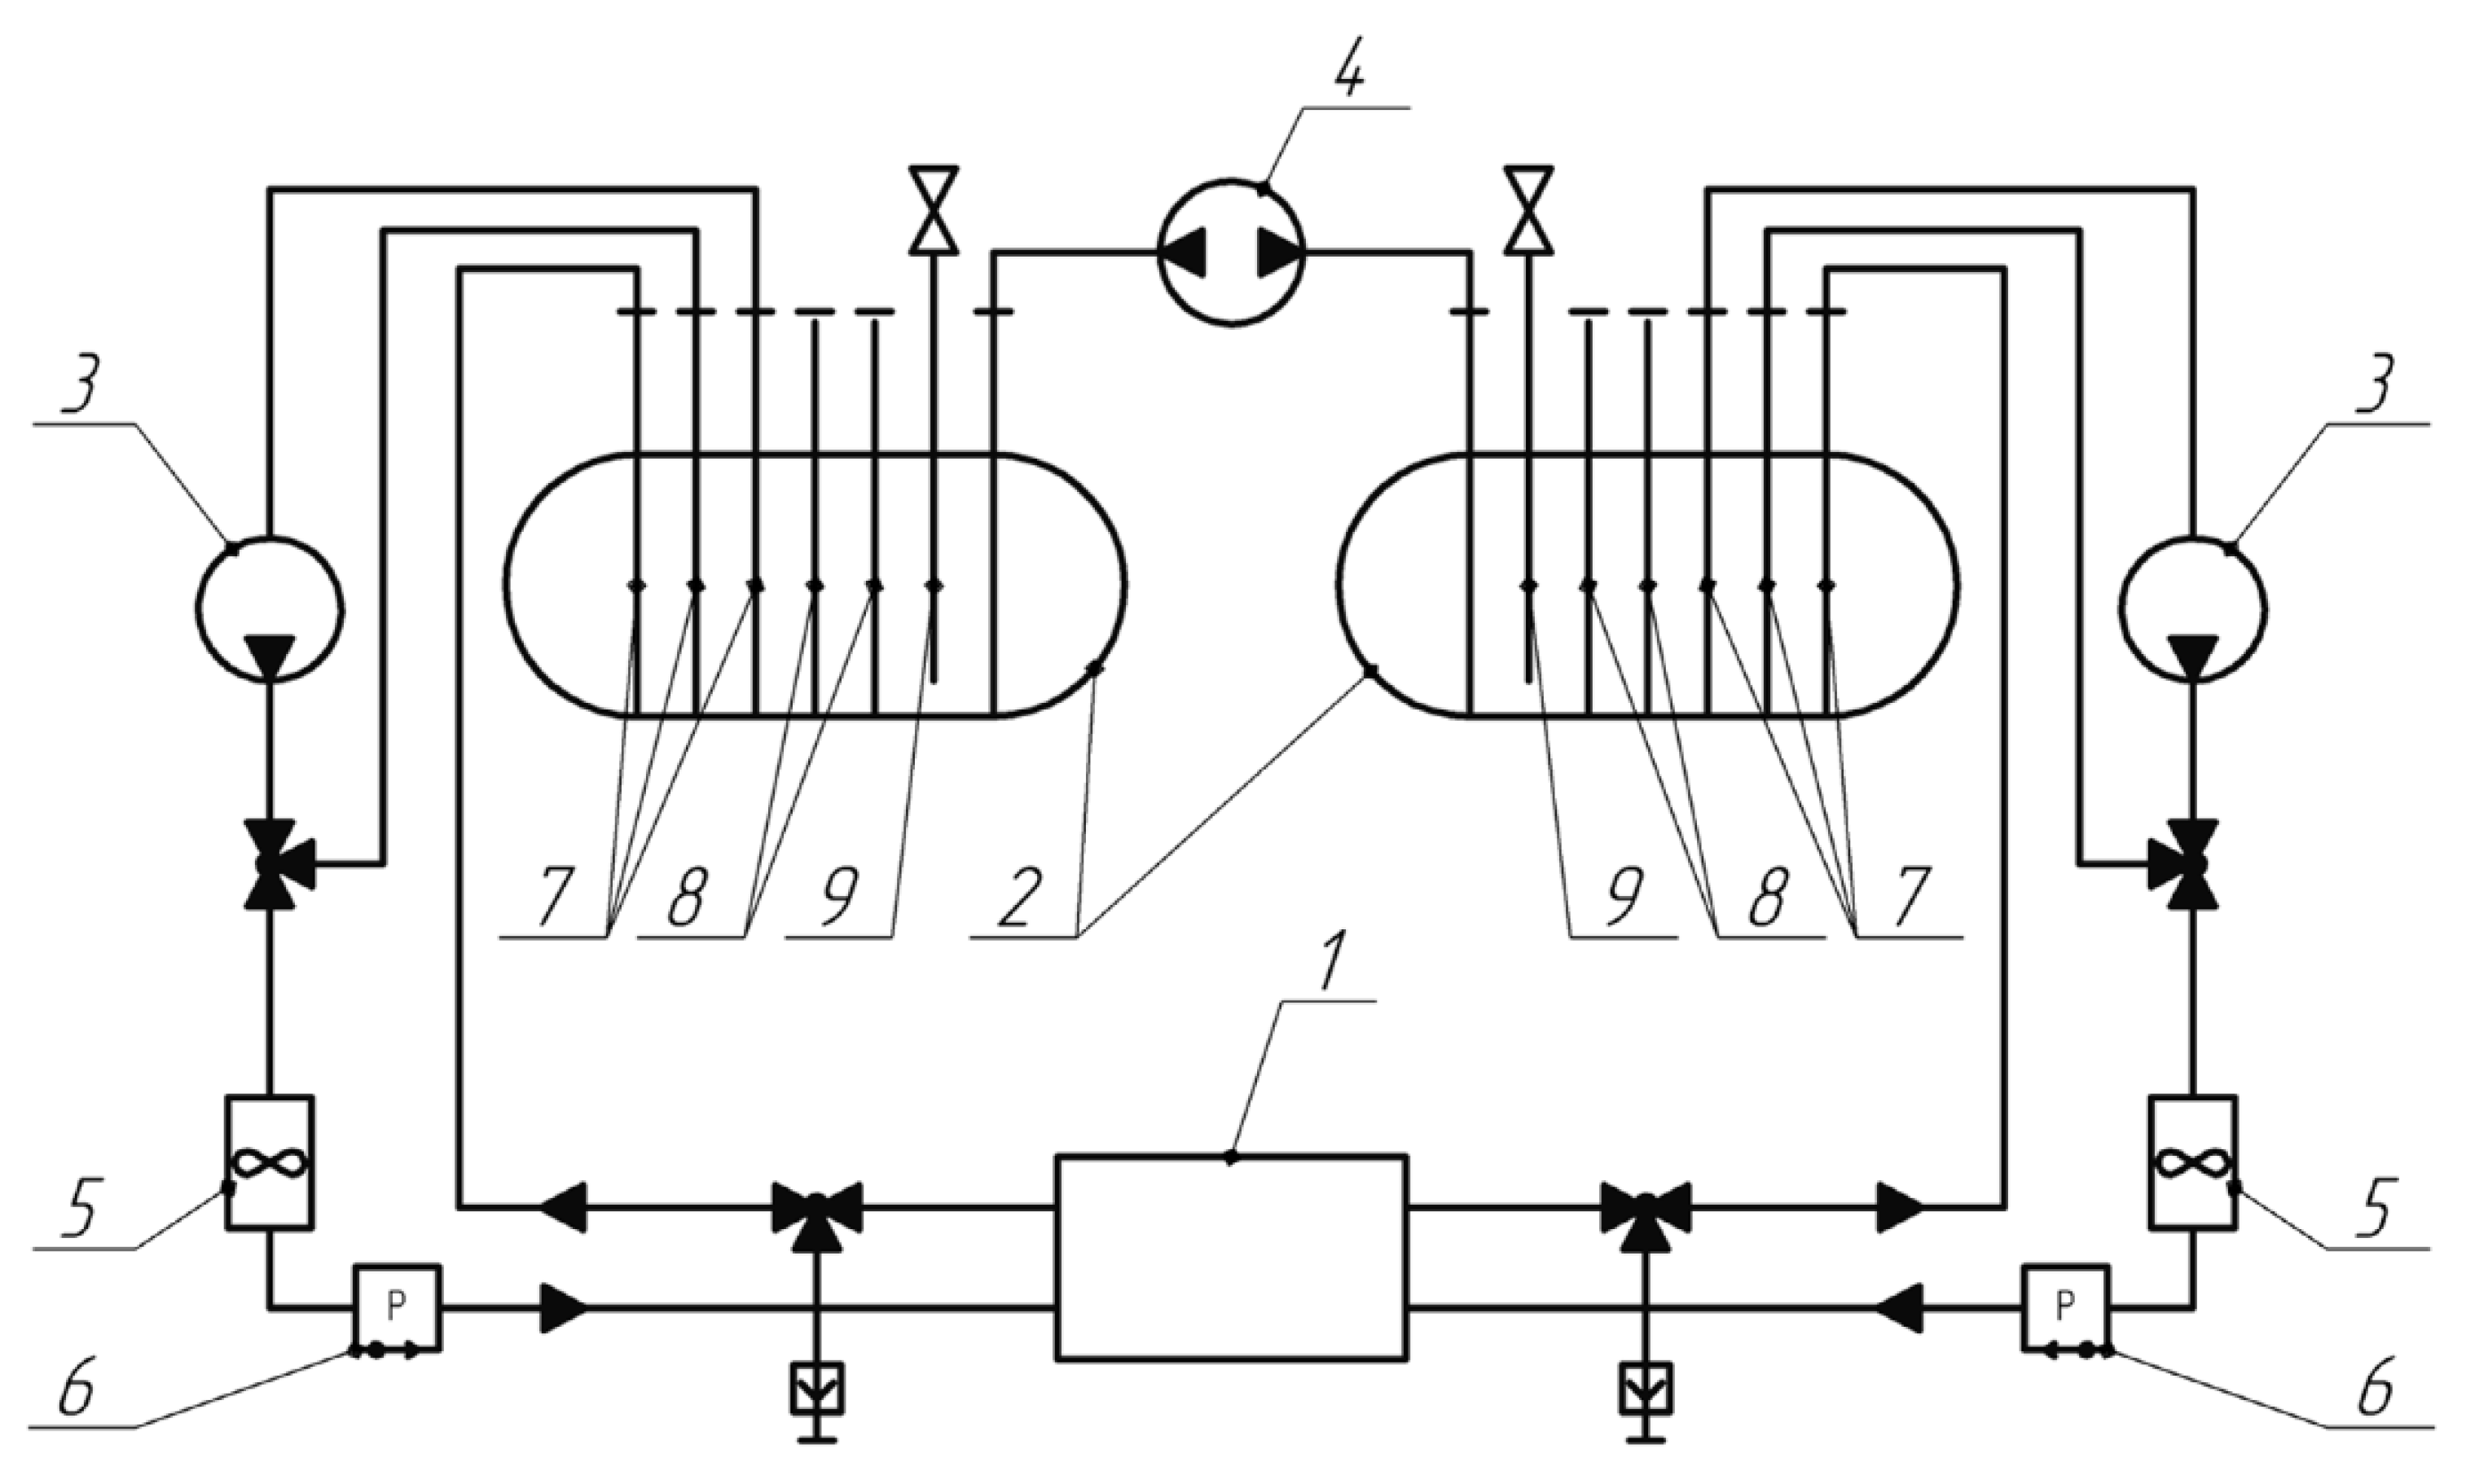
A laboratory stand was developed and manufactured for testing the VRFB. The hydrodynamic scheme of the VRFB consists of two tanks with positive and negative electrolytes, with separate pumps creating electrolyte flows (
Figure 2).
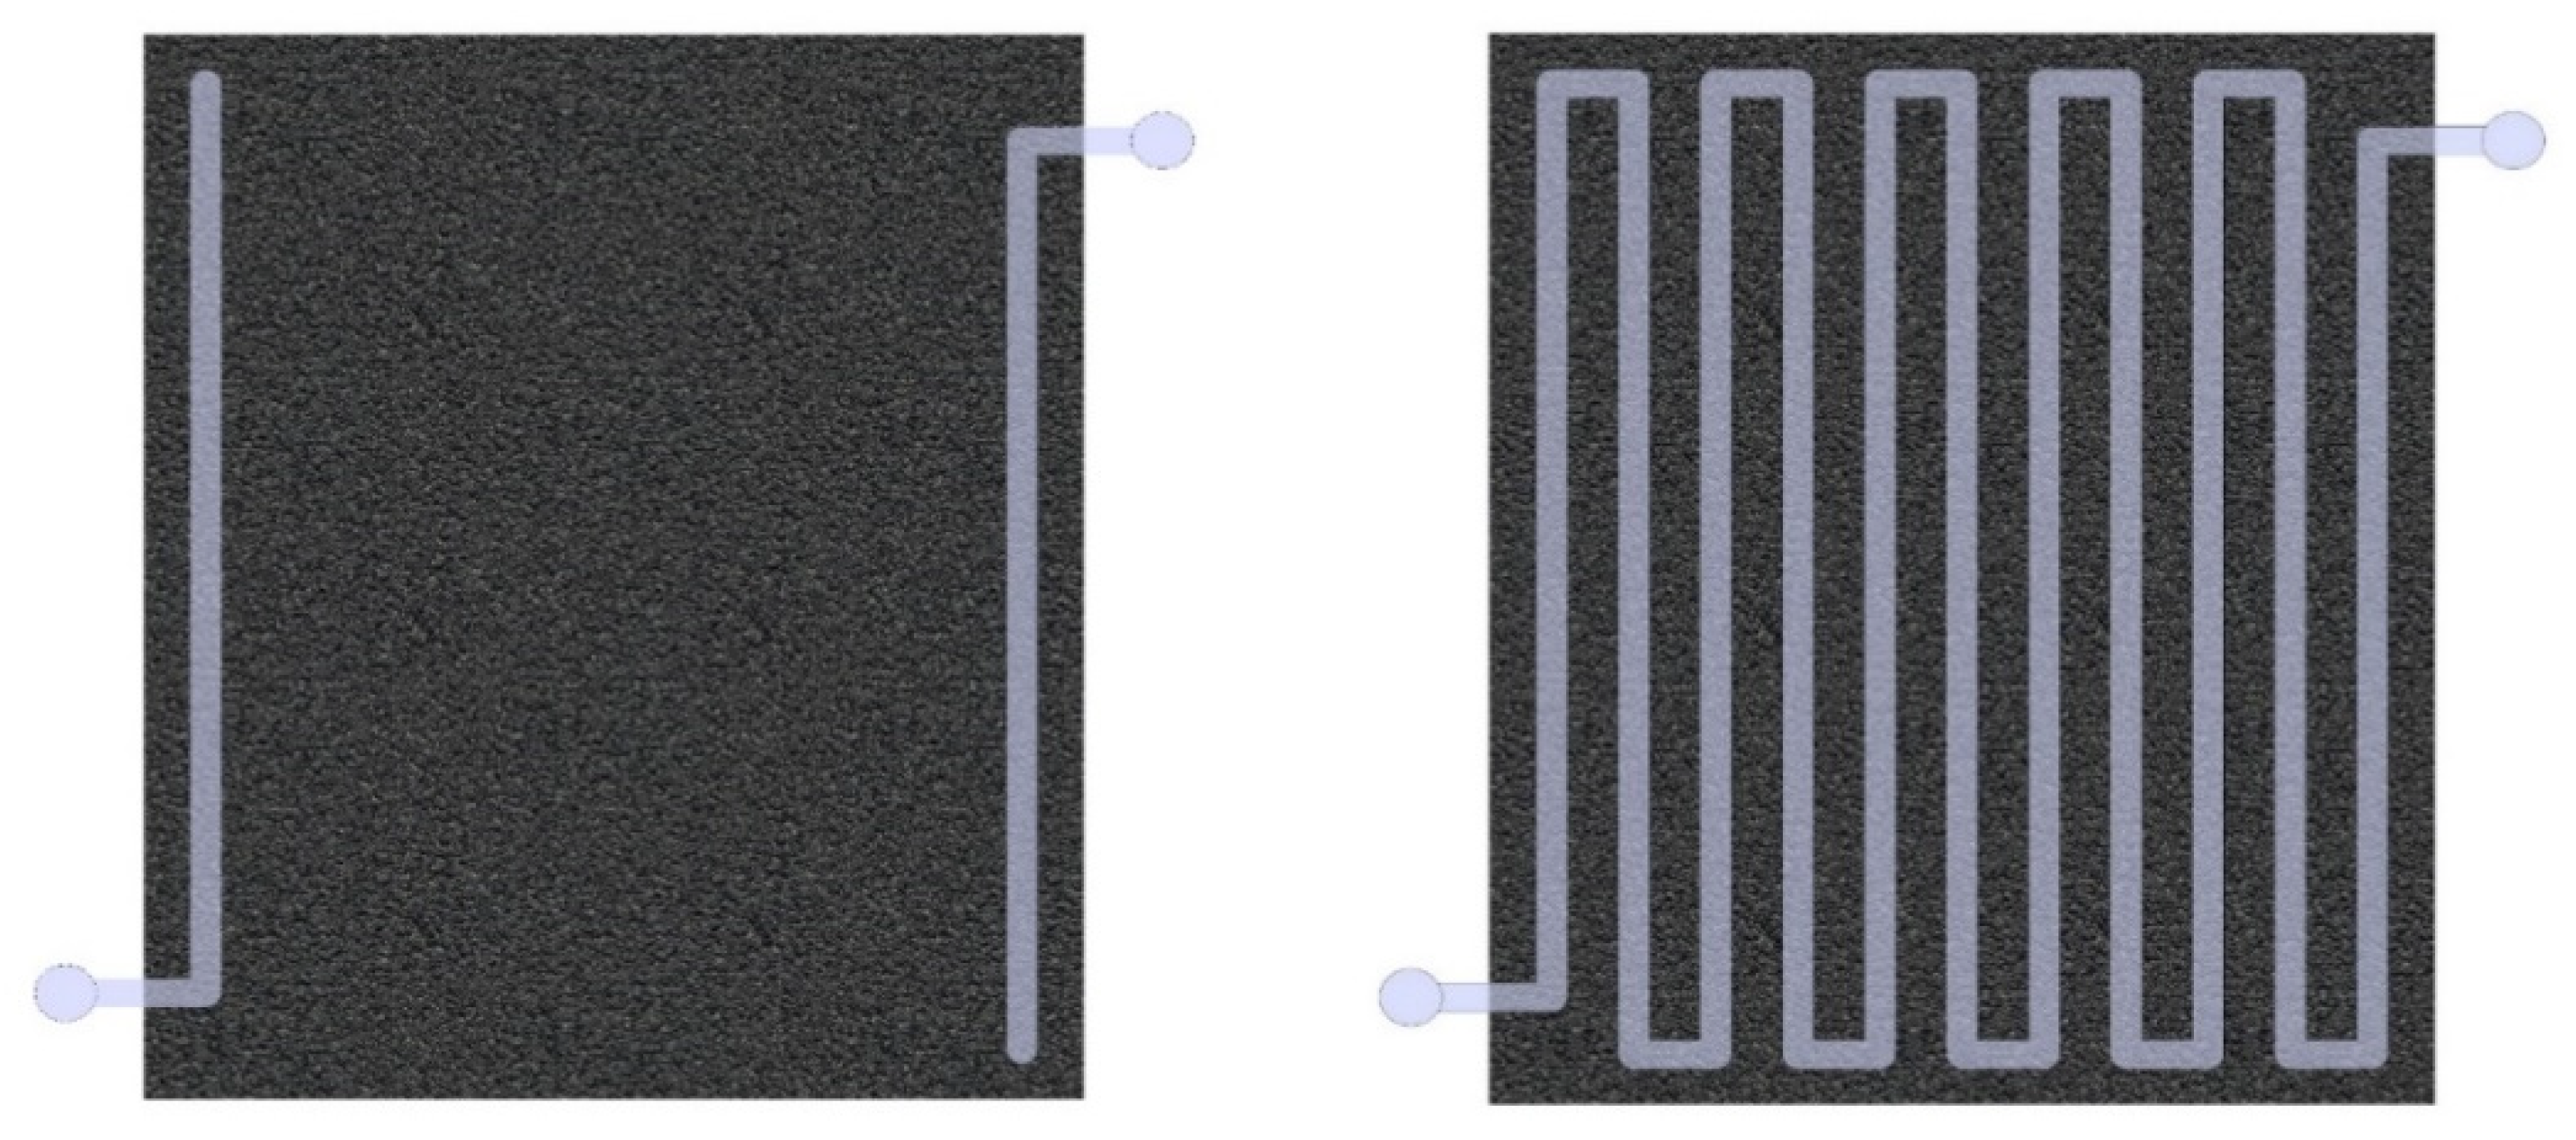
The flow cell is the main element of the flow battery, namely the vanadium acid battery (VRFB). In the flow cell, some of the power is lost due to the need to pump the electrolyte through the porous carbon electrode and the hydraulic resistance of the materials. One of the approaches to reduce hydrodynamic resistance was to change the design of bipolar plates, which, according to the proposed concept, should include a serpentine channel, and the exchange of electrolyte with a porous carbon material is carried out due to diffusion of ions, osmotic pressure, and turbulent flows at the boundary, where the electrolyte flowing through the channel is in contact with the porous carbon electrode.
Mathematical modeling of hydrodynamics was carried out in the COMSOL Multiphysics. The purpose of this model is to compare 2 different flow cell designs [
1].
Figure 3 shows models of half cells that simulate fluid flows through the channel. The size of the calculation area was 150 × 120 mm, the depth of the channels varies from 0.5 to 1.5 mm, the width of the channels varies from 3 to 8 mm, and the number of channels varies from 3 to 19. The material of the plate is graphite with a resistivity of 8 μΩ·m. The size of the porous carbon material in the case of a design with a serpentine channel is 150 × 120 × 1 mm, and the porosity is 92%. The most optimal design, i.e., Design 2, was then compared with Design 1.
The calculation of the pressure drop and the velocity field has been made by numerically solving the system of equations in the COMSOL. The electrolyte flow in the flow channel is described by the Navier–Stokes equations and the continuity equation:
where
ρ is an electrolyte density,
u is an electrolyte flow rate,
p is an electrolyte pressure, and
μ is an electrolyte viscosity.
The flow in carbon felt is described by the Brinkman model. Here, the modified Navier–Stokes [
1] equations are written for the velocity field averaged over volumes much smaller than the size of the structure, but much larger than the size of the pores (according to the comparative analysis presented in [
12,
13], this model is the most suitable for Designs 1 and 2):
where
κ is a permeability of carbon felt.
The electrolyte parameters are as follows: electrolyte density ρ = 1.355 g/cm3, dynamic viscosity μ = 2.5 MPa·s. For various combinations of parameters, the Reynolds number varied from 15 to 43. A laminar flow model was chosen for the calculation.
Figure 4 shows the power curves of the cells and their efficiency
η(
Q) depending on the electrolyte flow rate through the cell, taking into account electrical resistance losses (since the electrical contact in the case of a serpentine channel is worse than in the case of a solid plate).
It can be seen that the power depending on the electrolyte flow rate for Design 1 changes almost the same as for Design 2, but at the same time, the efficiency in the cells of Design 1 decreases with the increasing electrolyte flow rate more significantly than for the cell of Design 2, which is associated with a stronger increase in hydraulic resistance compared to a cell with a serpentine channel. Thus, the design of a flow cell with a serpentine channel is more acceptable in terms of reducing losses due to hydrodynamic resistance.
Based on the results, an algorithm was developed to determine the power of a flow cell depending on the electrolyte flow rate, and based on the results of the cell power, a comparison was made of the 2 designs of a flow cell. According to a comparative assessment, the most promising is the design of a flow cell with a serpentine channel for electrolyte flow, because in this case, the value of hydrodynamic losses is comparatively lower.
The thermal effect analysis results showed that the parameters of the charge/discharge test (flow rate and current density) affect the thermal effect of the VRFB. High current density causes a phenomenon of concentration overvoltage, and the thermal release is more serious. When the flow rate is too slow, this causes the concentration gradient and a higher ohmic resistance heat release, which reduce the efficiency.
The battery performance is significantly influenced by the flow rate of both electrolyte and coolant. Regulating the coolant flow rate is an effective approach to control the electrolyte temperature within the expected range. A comparison shows that the electrolyte flow rate has a negligible impact on electrolyte temperature within the considered range of flow rate but significantly influences the pressure drop and battery efficiencies. The increase in electrolyte flow rate improves the coulombic efficiency, voltage efficiency, and energy efficiency simultaneously. However, the system efficiency does not improve monotonically with the increase of electrolyte flow rate, because the associated pressure drop and pump power also increase. Instead, an optimal flow rate exists to maximize the system efficiency under a specific operating condition. The optimal flow rate of the electrolyte also differs when the applied current density changes [
14].
Figure 5 shows the temperature curves. The temperature for the positive electrolyte rises faster than for the negative ones. This trend is observed for all modes. As is known, in addition to the release of heat due to electrical resistance in these batteries, there is an electrolyte crossover [
8,
10]. Due to the fact that V
2+ and V
3+ have a smaller diameter than the VO
2+ and VO
2+ ions, the flow of ions from the tank with a negative electrolyte to the tank with a positive electrolyte is stronger than in the opposite direction. This, most likely, causes additional overheating of the positive electrolyte. The difference in temperature between the positive and negative electrolytes ranges from 7 to 11%.
The anion exchange membrane FAP450 showed a similar order of magnitude of permeability rates for all four vanadium ions, while in the case of the cation exchange membranes F930 and VB2, the permeability of V
2+ and VO
2+ ions was almost an order of magnitude lower than that of V
3+ and VO
2+. As expected, the thicker VRFB of the two cation exchange membranes showed the lowest permeability values. The experimental data were applied in simulation studies to investigate the effect of ion crossover on thermal behavior associated with self-discharge reactions caused by ion diffusion across the membrane. In order to reduce the rise in stack temperature when pumps were switched off during standby periods at high SOC, lower order of magnitudes of the permeability rates of V
2+ and VO
2+ ions are essential [
11,
13,
15,
16].
By comparing different electrolyte pumping speeds (
Figure 4), it can be seen that the pumping speed has practically no effect on the stack efficiency (
Table 1). This can be explained by the absence of an effect of the electrolyte pumping rate on the electrolyte crossover through the membrane and the overvoltage on the electrodes. However, increasing the pumping speed slightly increases the battery capacity, which is associated with a more complete use of the electrolyte. The optimal value of the stack pumping speed is 2 m
3/h.
As can be seen from the data (
Figure 6), a decrease in the charge voltage leads to a sharp decrease (by 24%) in battery capacity and a decrease in stack efficiency by 4.9%. The decrease in efficiency is largely due to the drop in charge efficiency. The low coulomb efficiency can be associated with a high electrolyte crossover due to the fact that this charge mode took almost 2 times more time to charge, which led to large losses and waste of excess energy during charging, and this reduced the overall efficiency. Thus, a decrease in the operating voltage steadily leads to a decrease in efficiency.
The battery not only retains its high efficiency but also practically does not lose capacity compared to the nominal modes when overloaded by 1.5 times during charging. An increase in efficiency with an increase in the discharge current, as in the previous case, is associated with a decrease in time and, as a consequence, a decrease in Coulomb losses. The decrease in capacity, although not significant, is a consequence of the incomplete charge of the battery at the initial stage. Thus, it can be seen that a VRFB can operate well in overload mode without significant loss in efficiency. This also demonstrates the good compatibility of this stack with the developed and used electrolyte.
Side reactions such as hydrogen evolution due to water decomposition and CO
2 evolution due to the oxidation of carbon-based electrode may occur during operation [
3,
5]. The battery performance is generally evaluated with three efficiencies: coulombic efficiency (CE), voltage efficiency (VE), and energy efficiency (EE).
Figure 6 shows the current and voltage curves during charging and discharging. The energy efficiency was calculated from the graphs using (6), and the charge efficiency was calculated using (7)
where
η(
E) and
η(
Q) are energy and charge efficiency, respectively, and
IDch,
UDch,
tDch, and
ICh,
UCh,
tCh are currents, voltages, and times in the discharge and charge modes, respectively.
As can be seen from
Figure 6, at a discharge voltage of 33–34 V on the stack and a current of 100 A, an inflection begins, which indicates the end of the discharge. Thus, the spread between the charge and discharge voltage is 24–25 V, which is 43% of the charge voltage. Such a voltage spread requires special designs of inverters.
5. Experimental Results
The VRFB charge/discharge tests have been carried out and the graphs of currents, voltages, and power in various modes have been obtained (
Figure 10).
According to the test data, the total charge energy was 2.94 kWh, and the discharge energy was 2.05 kWh. Thus, the energy efficiency is 69.9%. The average power dissipated at the load (4.99 kW) almost coincided with the rated power of the cell. The specific capacity of the electrolyte was 17.11 kWh/m3, which is at the level of the best results.
The flow battery heats up when the stack is charged and discharged due to the allocation of power losses on the internal resistance, which, as indicated above, is significant. At the same time, electrolyte heating above 45 °C is unacceptable because of the possibility of its decomposition. Therefore, during the tests, the temperatures of the positive and negative electrolytes and the temperature of the VRFB stack itself were constantly monitored, and in the software of the stand, overtemperature protection was implemented, which, if triggered, would turn off the stack. However, during the tests, it turned out that the temperature of the electrolyte increased by only 5.7 degrees compared to the original (27 °C), which is quite acceptable.
Additionally, tests of the VRFB operation were carried out when charging in the same IU mode and then discharging to a load with a constant power consumption (
Figure 10c). To implement the latter condition, some of the RB-315 resistive elements were switched on through a load control unit based on a transistor switch. During the discharge, the duty cycle of the control pulses of the key was automatically changed in such a way that the power released at the load was as close as possible to the specified one (5 kW). Since the PACB was charged in a similar way, only a part of the graph corresponding to the discharge mode is shown on
Figure 10c.
The presented current, voltage, and power curves illustrate the good dynamic characteristics of the VRFB in charge/discharge mode and load changes.


