Abstract
The Qiongdongnan (QDN) basin in the northwestern South China Sea has been shown to be rich in petroleum resources and has significant exploration potential for deepwater oil and gas resources. Therefore, it is of great significance to clarify the gas accumulation process in the deepwater area of the QDN basin, specifically the Y8 area. In this study, fluid inclusion analysis, including the identification and localization of fluid inclusions under a microscope, laser Raman spectrum analysis and homogenization temperature (Th) measurement, reconstruction of the thermal evolution burial history, geochemical analysis, and typical seismic section analysis were comprehensively used to interpret the gas accumulation process of the Y8 area. The laser Raman spectrum analysis results of fluid inclusions verified the existence of methane and confirmed the hydrocarbon charging event in this area. However, the Th of fluid inclusions in the reservoir, the mixed compositions of hydrothermal compositions (H2S + SO2) and hydrocarbons (methane) in the fluid inclusions, and the low Tmax values of some wells in the Y8 area comprehensively confirmed that the coincidence of hydrothermal activity with the accumulation process affected the long-distance gas accumulation of the Y8 area. The hydrothermal activity was also confirmed by the presence of fluid diapirs in seismic profiles of the Y8 area. Furthermore, the hydrocarbon accumulation process was reconstructed using the modified thermal evolution history considering the effect of hydrothermal activity. Overall, this study attributed the high Th of fluid inclusions in the reservoirs of the Y8 area to hydrothermal activity and proposed a long-distance migration model of hydrocarbon accumulation coinciding with hydrothermal activity, both of which are beneficial to understanding the accumulation process of the Y8 area.
1. Introduction
Offshore oil and gas resources have been the focus of exploration and development in recent years and are divided into three categories based on seawater depth: shallow (<500 m), deep (>500 m) and ultradeep water (>1500 m) [1]. Since 2010, the exploration of deep-water oil and gas resources has gradually become the focus of conventional oil and gas exploration and development with the development of drilling technology and the enrichment of exploration theory [2,3,4,5,6,7]. The Qiongdongnan (QDN) basin, which is in the northern part of the South China Sea, has been proven to have great exploration potential and has become a “hot spot” in recent years with abundant deepwater oil and gas resources [8].
The significant oil and gas exploration breakthroughs have been achieved in the western deepwater area of the QDN Basin. For example, the Ledong-Lingshui Sag has been proven to contain abundant oil and gas resources, which is located in the western deepwater area of the QDN Basin. And the Songnan-Baodao Sag, which is located in the eastern deepwater area of the QDN Basin, has also been proven to have great exploration prospects. The geochemical characteristics of natural gases in the Y8 area are significantly different from natural gases in the northern slope of Songdong Sag and the L17-2 gas field in the deepwater as well, which attracts the interests of many investigations [9]. The natural gas in the Y8 area was mainly generated by the terrestrial marine source rocks of the Lower Oligocene Yacheng Formation in Songnan-Baodao Sag at about 5.5 Ma. The natural gas migrated laterally along faults, structural ridges, and sandstone layers, and accumulated in the Yacheng Formation and buried hill in the Y8 area. In general, the accumulation mode of Y8 is buried-hill natural gas three-dimensional accumulation mode [9]. However, the accumulation process is still unclear and evidence of the accumulation process is limited in the Y8 area in deepwater area of the QDN Basin, which needs to be studied further.
Currently, fluid inclusion analysis is the most useful method for the study of hydrocarbon accumulation stages [10,11]. In the process of crystal growth or fracture healing, oil and gas were captured into mineral crystals to form fluid inclusions, which can be used as a direct symbol to record geological historical events in the process of oil and gas migration [12]. Petroleum inclusions can present intact and original gas and oil information in the process of geological evolution of basins containing oil and gas. Analysis of hydrocarbon inclusion and aqueous inclusions coexisting with organic inclusions with laser Raman spectroscopy and homogenization temperature (Th) measuring can be used to determine the hydrocarbon accumulation period and the formation time of oil and gas reservoirs [13].
The accumulation episodes of reservoirs in different structural parts of the QDN basin are different. For example, the Th values of aqueous inclusions coeval with gas inclusions have two peaks: 130~160 °C and 160~190 °C in the sandstone samples, indicating two stages of hydrocarbon charge in Yacheng area. The time of hydrocarbon charging had been estimated at late Miocene to early Pliocene, and the second charging time was estimated as Quaternary [14]. There may be three stages of hydrocarbon charging in the X17 gas field in the Central Canyon of the QDN Basin and the corresponding Th range, from 87.2 °C, 110~120 °C, and 140~160 °C. However, the Th of hydrocarbon inclusions is mostly higher than the current reservoir temperature (most of the formation temperature of Huangliu Formation is less than 100 °C), so the time of hydrocarbon accumulation cannot be determined. In addition, Th values of aqueous inclusions coeval with gas inclusions are higher than the present-day formation temperatures of corresponding depth in the reservoir samples from Songnan-Baodao Sag [15]. Consequently, the accumulation process of Songnan-Baodao Sag is still unclear and needs to be studied.
Several geochemical analyses and seismic interpretations have shown that there are different fluid flow structures in the central depression of the QDN basin because of hydrothermal activities, such as mud diapir, gas chimney, and hydrothermal pipes [16]. High stretching of the lithosphere and extensive hydrothermal activities (which both happened at around 5 Ma) might be responsible for the high heat flow feature in the deepwater area, and heat flow generally increases eastward and develops a high heat flow zone (>85 mW/m2) in the Songnan-Baodao Sag [17].
Hydrothermal fluid generally has a temperature higher than that of the surrounding rock formation [18], which is characterized by movement from deep to shallow layers. The origin of hydrothermal fluid is abundant, leading to various indicators of hydrothermal activity [19]. Indicators showing hydrothermal activity mainly include (1) abnormal kerogen alteration and the distribution of generated hydrocarbons, (2) abnormal heavy metal contents in mudstone and kerogen, (3) alterations of minerals in the reservoir, (4) specific compositions (such as CO2 and H2S) in the fluid inclusions, and (5) the presence of mud diapirs, fluid diapirs, and other structures in the seismic profile [20,21,22,23].
The influence of hydrothermal activity on hydrocarbon accumulation can be divided into two categories. The first category is the influence of hydrothermal fluid on the source rocks, which happens before hydrocarbon generating. Components from the hydrothermal fluid can contribute to the generation of high-quality hydrocarbon source rocks [24,25,26] and catalyze the thermal reactions of organic matter [27]. The second category is the influence of hydrothermal activity on reservoir properties and hydrocarbon components, which happens after hydrocarbon generating. The hydrothermal fluid can significantly improve the storage capacity of the reservoirs and catalyze thermal cracking of the crude oil in the reservoirs [28,29,30,31,32,33]. In summary, previous studies have mainly focused on the influence of hydrothermal activity that occurred earlier or later than the hydrocarbon migration and accumulation process. However, the influence mechanism of hydrothermal activity coinciding with hydrocarbon migration and accumulation processes in the Y8 area is still unclear and needs to be clarified [34,35,36].
This study focused on the Y8 area in the Songnan-Baodao Sag of the QDN basin as the study area. Fluid inclusion analysis, including identification and localization of fluid inclusions under a microscope, laser Raman spectrum analysis, and Th measurement were applied to study the hydrocarbon charging process. The reconstruction of the thermal evolution burial history using simulation software, geochemical analysis and typical seismic section analysis were used to interpret the influence of hydrothermal activity. The major objectives of this study are to (1) show new evidence to prove hydrocarbon accumulation process in the Y8 area; (2) provide new evidence to prove hydrothermal activity in the Y8 area; and (3) discuss the influence of hydrothermal activity on the hydrocarbon accumulation process. This work will provide a novel theoretical guidance for exploration and development in the accumulation area with hydrothermal activity, such as the Y8 area in the Songnan-Baodao Sag of the QDN basin.
2. Geological Setting
2.1. Sedimentary and Stratum Characteristics
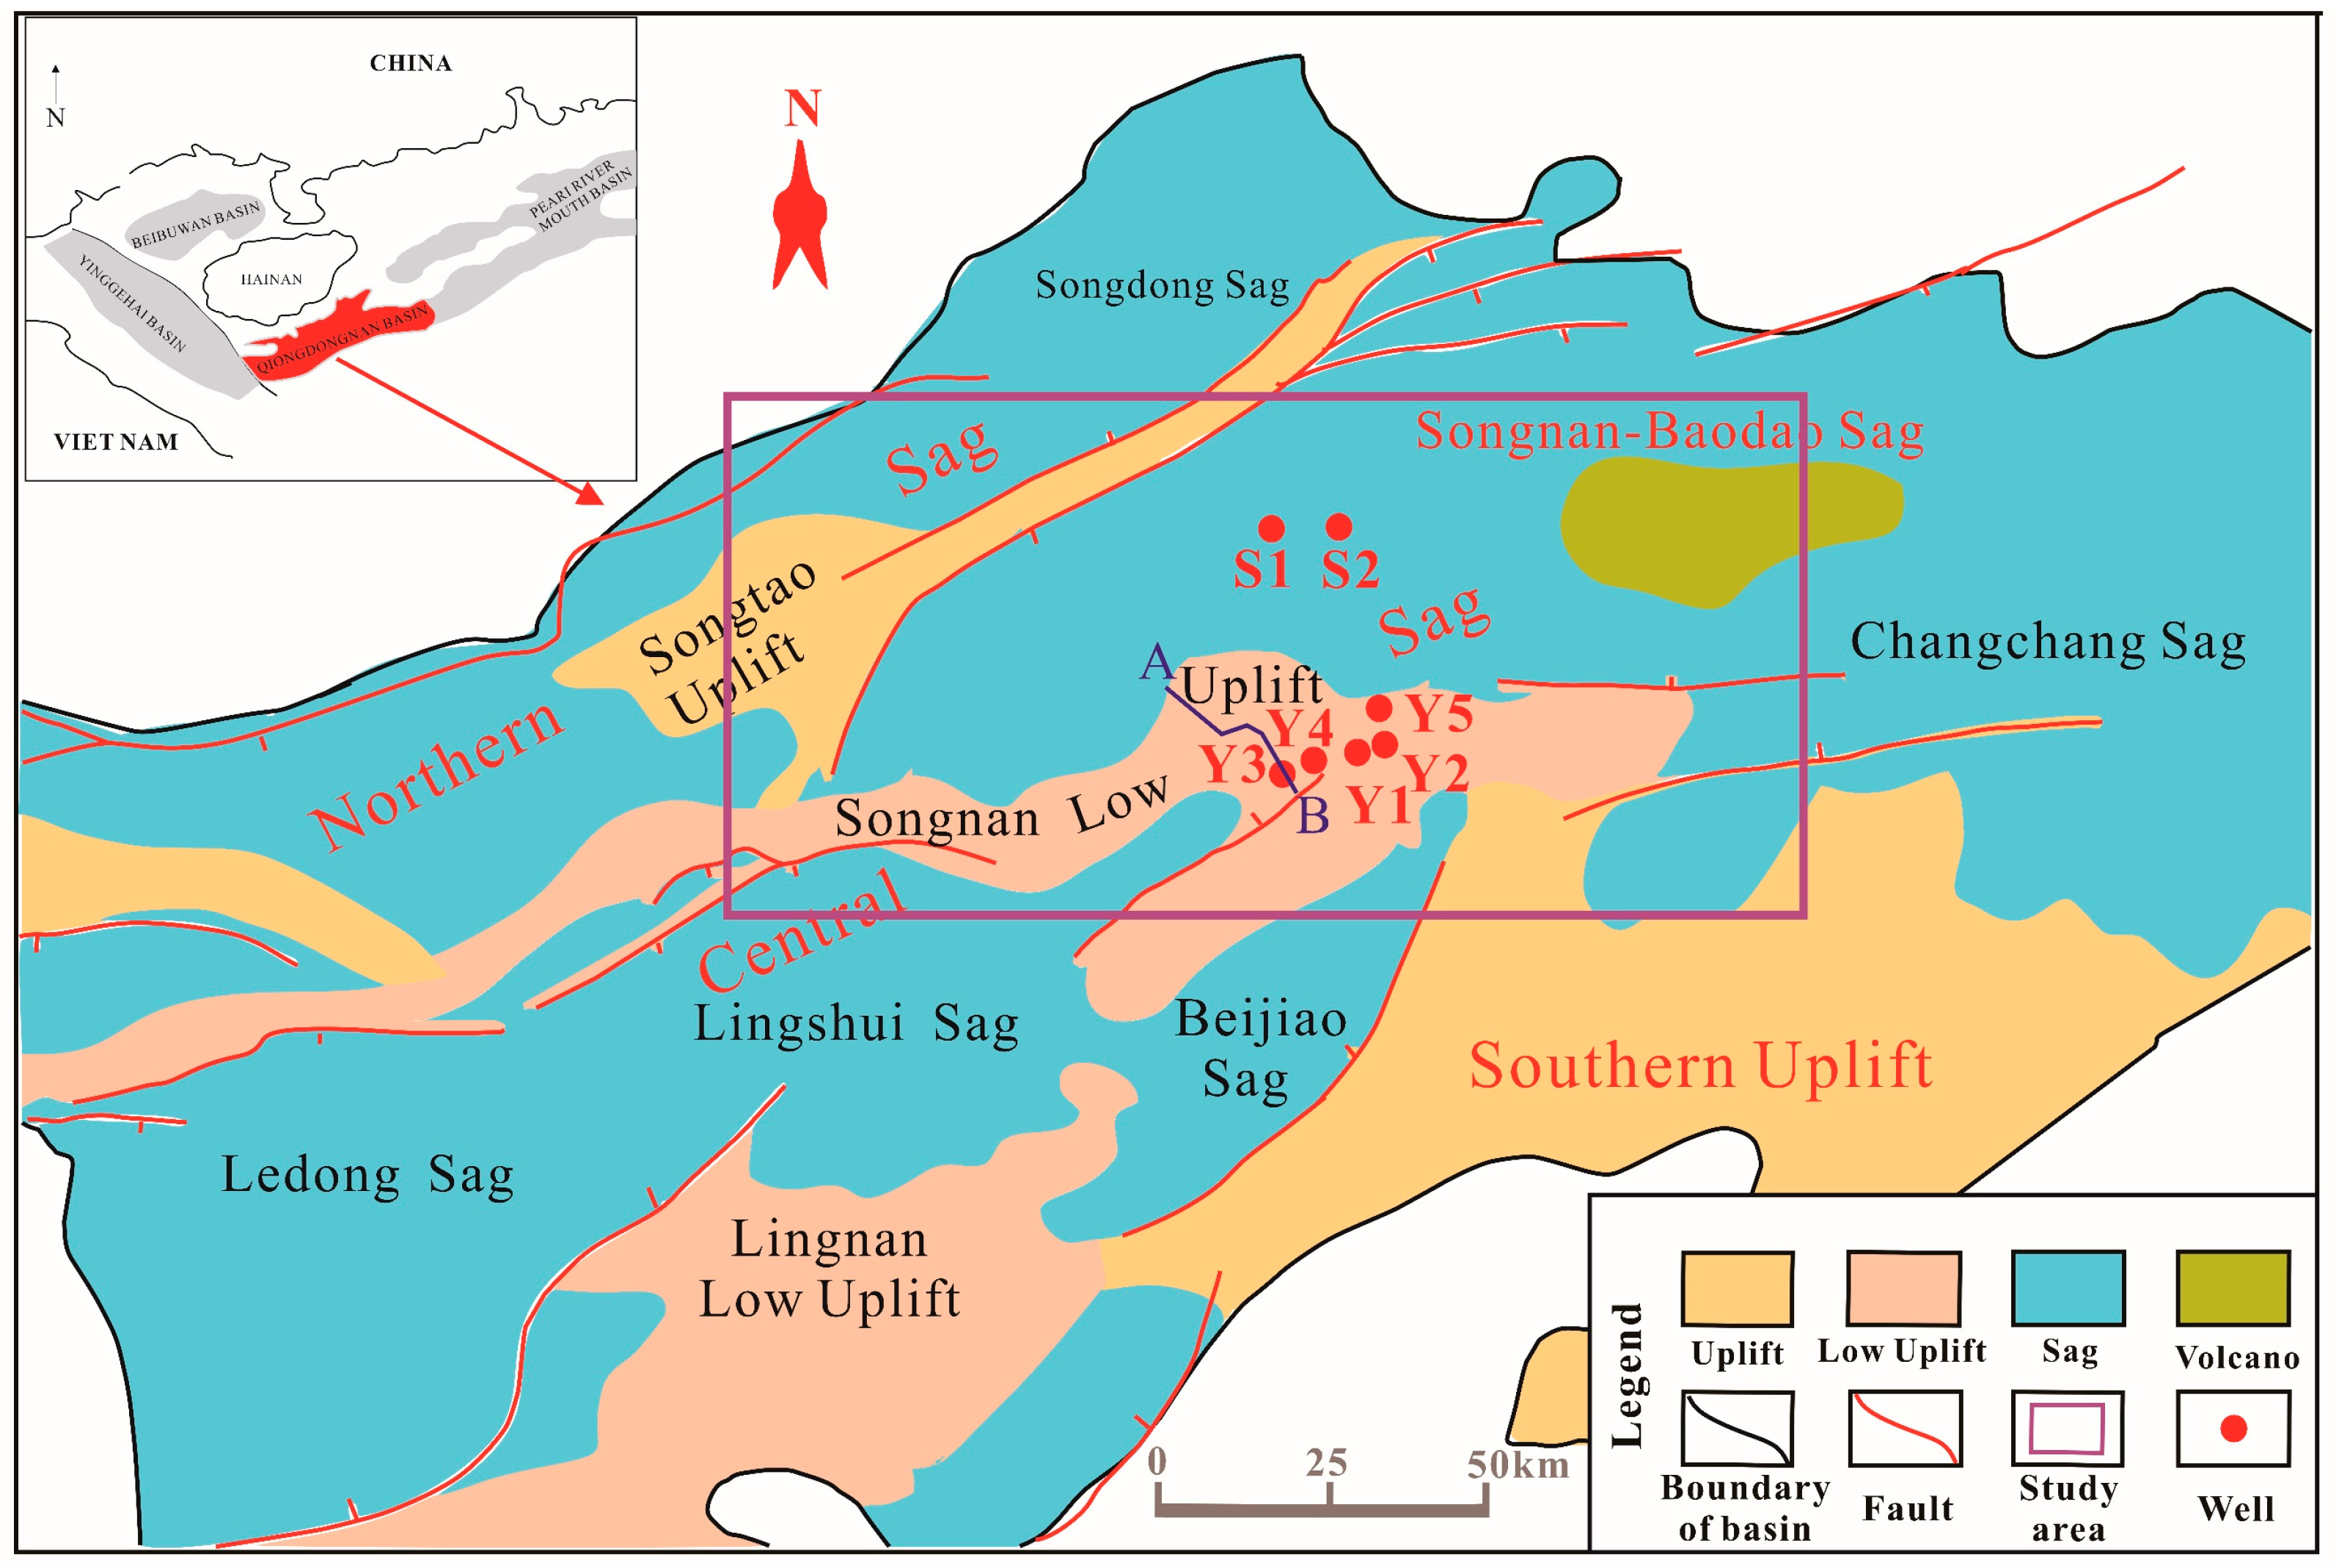
The QDN basin is a Cenozoic extensional petroliferous basin located in the northwest regions of the South China Sea [36], which can be divided into four primary tectonic units from north to south: the northern depression, central uplift, central depression, and southern uplift (Figure 1). The main part of this basin is deepwater, which is currently deeper than 300 m [37,38]. The Songnan-Baodao Sag is in the central depression belt in the east. The continuous activity of the No. 2 fault belt in the northern basin margin controls the overall tectonic framework of the basin. It is adjacent to the Songtao Uplift in the north, the Changchang Sag in the east, and the Songnan Low Uplift in the south, which is another important area with vast exploration potential for oil and gas resources [39,40].
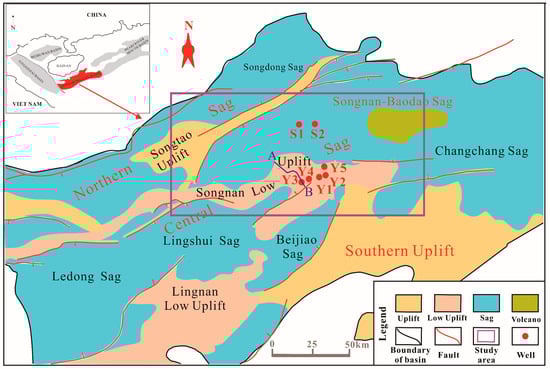
Figure 1.
Geographical location map of the QDN Basin (modified from [40]).
The basement of the QDN basin is mainly composed of sedimentary, igneous, and metamorphic rocks. The basin began to deposit in the middle of the Paleogene. With the subsidence of the basin, the Yacheng and Lingshui Formations, Sanya, Meishan, and Huangliu Formations, Yinggehai Formation, and Ledong Formation were successively formed. Due to differences in the sedimentary environment, tectonic activity and diagenesis of the formation, the sedimentary formations have different lithologies and physical properties [41].
The pre-Paleogene Formation is mainly composed of metamorphic, igneous, and sedimentary rocks. The Paleogene sedimentary system in the QDN basin mainly consists of the Eocene, Yacheng and Lingshui Formations. Eocene mainly develops lake facies and the Yacheng Formation mainly deposits coarse grains. The stratigraphic rocks of the Lingshui Formation have a normal grain sequence, gradually transitioning from sandstone to mudstone from bottom to top, and the internal segments of the Lingshui Formation contain a transitional zone of sedimentary facies: from marine–continental transitional facies to marine facies from bottom to top [42,43].
The end of the post-rift stage occurred during the Neogene. Compared with the strata developed in the syn-rift stage, the grain size of the sedimentary rocks in the Neogene is finer. From bottom to top, the main sedimentary sequences are the Sanya, Meishan, Huangliu, and Yinggehai Formations. The lithology of Sanya Formation is mainly siltstone and mudstone. The sedimentary rocks are dark, mostly gray and black. The Meishan Formation is mainly argillaceous deposits with littoral and shallow sea deposits, and most of the rocks have calcareous cementation. During the sedimentary stage of the Huangliu Formation, the basin continued to subside, and the water deepened continuously. The main deposits are sandstone and mudstone, partially containing biological debris and pyrite, and hemipelagic to pelagic deposits were developed. The Yinggehai Formation is mainly composed of mudstone and siltstone and the sediments are light in color because of the quiet sedimentary environment. The Quaternary Formation developed hemipelagic deposits and was buried shallowly, so the formation was not consolidated diagenetically and occurred in a clayey state (Figure 2) [44].
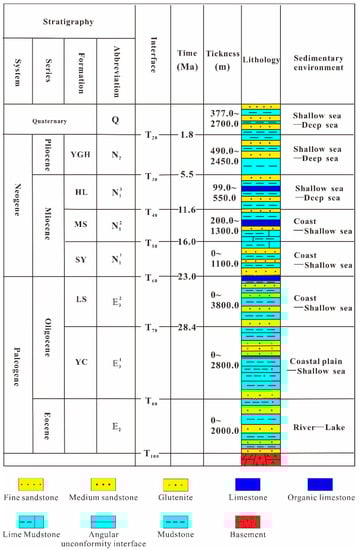
Figure 2.
Chronostratigraphic characteristics of the QDN Basin (modified from [44]).
2.2. Tectonic Characteristics
The QDN basin was formed under the background of the expansion of the South China Sea, which was restricted by the strike-slip motion of the Honghe fault and compressed by the Pacific plate. The basin was deposited in the Cenozoic and experienced complex geological evolution during the Mesozoic and Cenozoic [45,46]. The tectonic evolution of the basin since the Cenozoic is presented in this section (Table 1).

Table 1.
Tectonic evolution of the QDN Basin (modified from [47]).
The basement fault of the QDN basin was influenced by two parts of tectonic activity. The expansion of the South China Sea caused by the subduction and slab rollback of the Pacific plate led to several faults in the eastern part of the basin. The strike–slip extrusion of the Indochina plate caused by the collision of the India–Eurasia plate resulted in the development of the nearly east–west trending fault in the west of the basin. The tectonic evolution of the basin can be divided into rapid and slow subsidence. The rapid subsidence stage covered the following epochs: Eocene to middle Oligocene (65–32 Ma), late Oligocene to early Miocene (23–16 Ma), and late Miocene (11.6–5.3 Ma). The slow subsidence stage occurred during the middle Miocene (16–11.6 Ma) [47].
During the Eocene, the expansion of the East Asian continental margin caused the rapid subsidence of the QDN basin, exposing the large surrounding uplift and low uplift areas. The maximum sedimentary thickness in the Eocene was 2400 m.
From the Oligocene to the Early Miocene (32–16 Ma), the QDN basin started to subside rapidly owing to seafloor spreading in the eastern subbasin and gradual Yacheng Formation and Lingshui Formation deposition, the maximum thicknesses of which can be 2600 m and 3400 m, respectively.
From the early to Late Miocene (16–5.3 Ma), the QDN basin entered the thermal subsidence stage after the end of multistage rifting, which had a low subsidence rate and deposited the lower Miocene Sanya Formation and the middle Miocene Meishan Formation with a thickness of 1000–2000 m at this stage.
The basin has been in the neotectonic stage since the Late Miocene (5.3 Ma–now), when the Pacific Plate to the east has been subducting under the Eurasian Plate. The dextral strike-slip of the Honghe fault has made the western part of the basin expand continuously, and subsidence in the western part has gradually increased, finally becoming the subsidence center of the whole basin [48,49,50].
The Y8 area is located in the Songnan low uplift and experiences the same tectonic stage with the evolution of the QDN basin. A series of buried-hill traps and anticlinal traps developed in the Y8 area because of complicated tectonic activities [38].
3. Materials and Methods
3.1. Samples
The used samples can be divided into eight groups, all of which were taken from seven wells in the study area of the Songnan-Baodao Sag. Three groups of samples were tested for thermal evolution from Well-Y5, Well-S1, and Well-S2, while the remaining five groups were used for fluid inclusion analysis from wells in the Y8 area. The locations of the sampling wells are shown in Figure 1. The lithology and formation information of the samples used for fluid inclusion analysis are presented in Table 2.
Table 2.
Parameter table of experimental samples.
3.2. Fluid Inclusion Analysis
A Zeiss Axio Image Z1 polarizing microscope was used to observe and locate gaseous hydrocarbon inclusions at 10×, 20×, and 50× magnification. Laser Raman spectroscopy was used to determine the material composition by analyzing the spectra of molecule scattering after inelastic collisions between the laser and the material [51,52]. Laser Raman spectroscopy was also used to obtain the molecular and chemical composition of individual fluid inclusions without destroying them. Raman spectroscopy has been widely used in the analysis of fluid inclusion components and has become an important means to reconstruct the hydrocarbon accumulation process and determine the effective hydrocarbon accumulation period [53,54].
In this study, a HORIBA SAS LABRAMHR Evolution microlaser Raman spectrometer was used for fluid inclusion analysis. It was equipped with a frequency-doubled Nd:YAG laser (532.06 nm), an output of 45 mW, and a long-distance Olympus objective lens with a 0.5 numerical aperture. To maintain the accuracy of the results, the peak position correction of the microlaser Raman spectrometer was verified regularly on the ∼520.7 cm−1 band of a polished silicon wafer before each run of the experiment. The spectra obtained from the experiment were processed successively by eliminating the background and marking the peak position to provide the laser Raman spectrum analysis diagram. The identification standard of the characteristic peaks was referenced [55]. Th represented the paleotemperature when the inclusion was formed. The fluid inclusion Th of the samples was measured using the Linkam THM-600 heating–freezing stage. During the experiment, the temperature in the heating–freezing stage rose by 0.1 °C to bring it up to the Th, at which point the phase state of the inclusion returned to a homogeneous state.
3.3. Reconstruction of Thermal Burial History
The basin modeling study was used to reconstruct the burial and thermal histories of the Y8 area, which was accomplished by the software PetroMod 1D of Schlumberger. First, the geological and geochemical data (formation, stratigraphic lithology, sedimentary thickness and age, and erosion thickness and age) had to be input into the software. Due to the absence of vitrinite reflectance (Ro) data in the research well of the Y8 area, the erosion thickness was calculated using the interval transit time method [56,57]. Second, the real formation temperature had to be input to correct the simulation model. However, the initial data used in this study were the formation cable temperature measurement data of the research wells, which had the disadvantage of being significantly affected by the disturbance of the drilling depth. Previous studies have shown that the Horner empirical formula (HEF) [58] is generally used to correct the formation temperature and that the HEF has many forms according to the characteristics of the study area in practical applications. In this study, the HEF empirical formula of the QDN basin was used to correct the formation temperature [59]. Finally, the boundary parameters (paleowater depth, sediment water interface (SWI) temperature, and heat flow) were adjusted according to previous studies [60]. When the simulated formation temperature was consistent with the actual formation temperature in the Y8 area, the simulation result of the thermal burial history was calculated.
3.4. Geochemical Analysis
By comparing the photoelectric signal between the vitrinite of the sample and the standard sheet with known reflectivity under the microscope with a certain intensity of incident light, Ro measurements were conducted using vertical illumination on a Zeiss Axiophot microscope in samples from Well-S1, Well-S2, and Well-Y5. Because different components in the rock have distinct boiling points, when the temperature reaches the boiling point of an organic component, the organic matter starts to evaporate and decompose from the rock, and a significant number of pyrolysis parameters are obtained. The samples were crushed into 200 mesh powders and then heated in helium (purity greater than 99%) at a rate of 25 °C/min in a Rock-Eval 6 analyzer. Then, the S1 (amount of hydrocarbon volatiles at 300 °C), S2 (amount of hydrocarbon volatiles at a programmed temperature between 300 and 650 °C), and Tmax (temperature of S2 (maximum)) values were determined.
4. Results and Discussion
4.1. New Evidence to Prove Hydrocarbon Accumulation Process in the Y8 Area
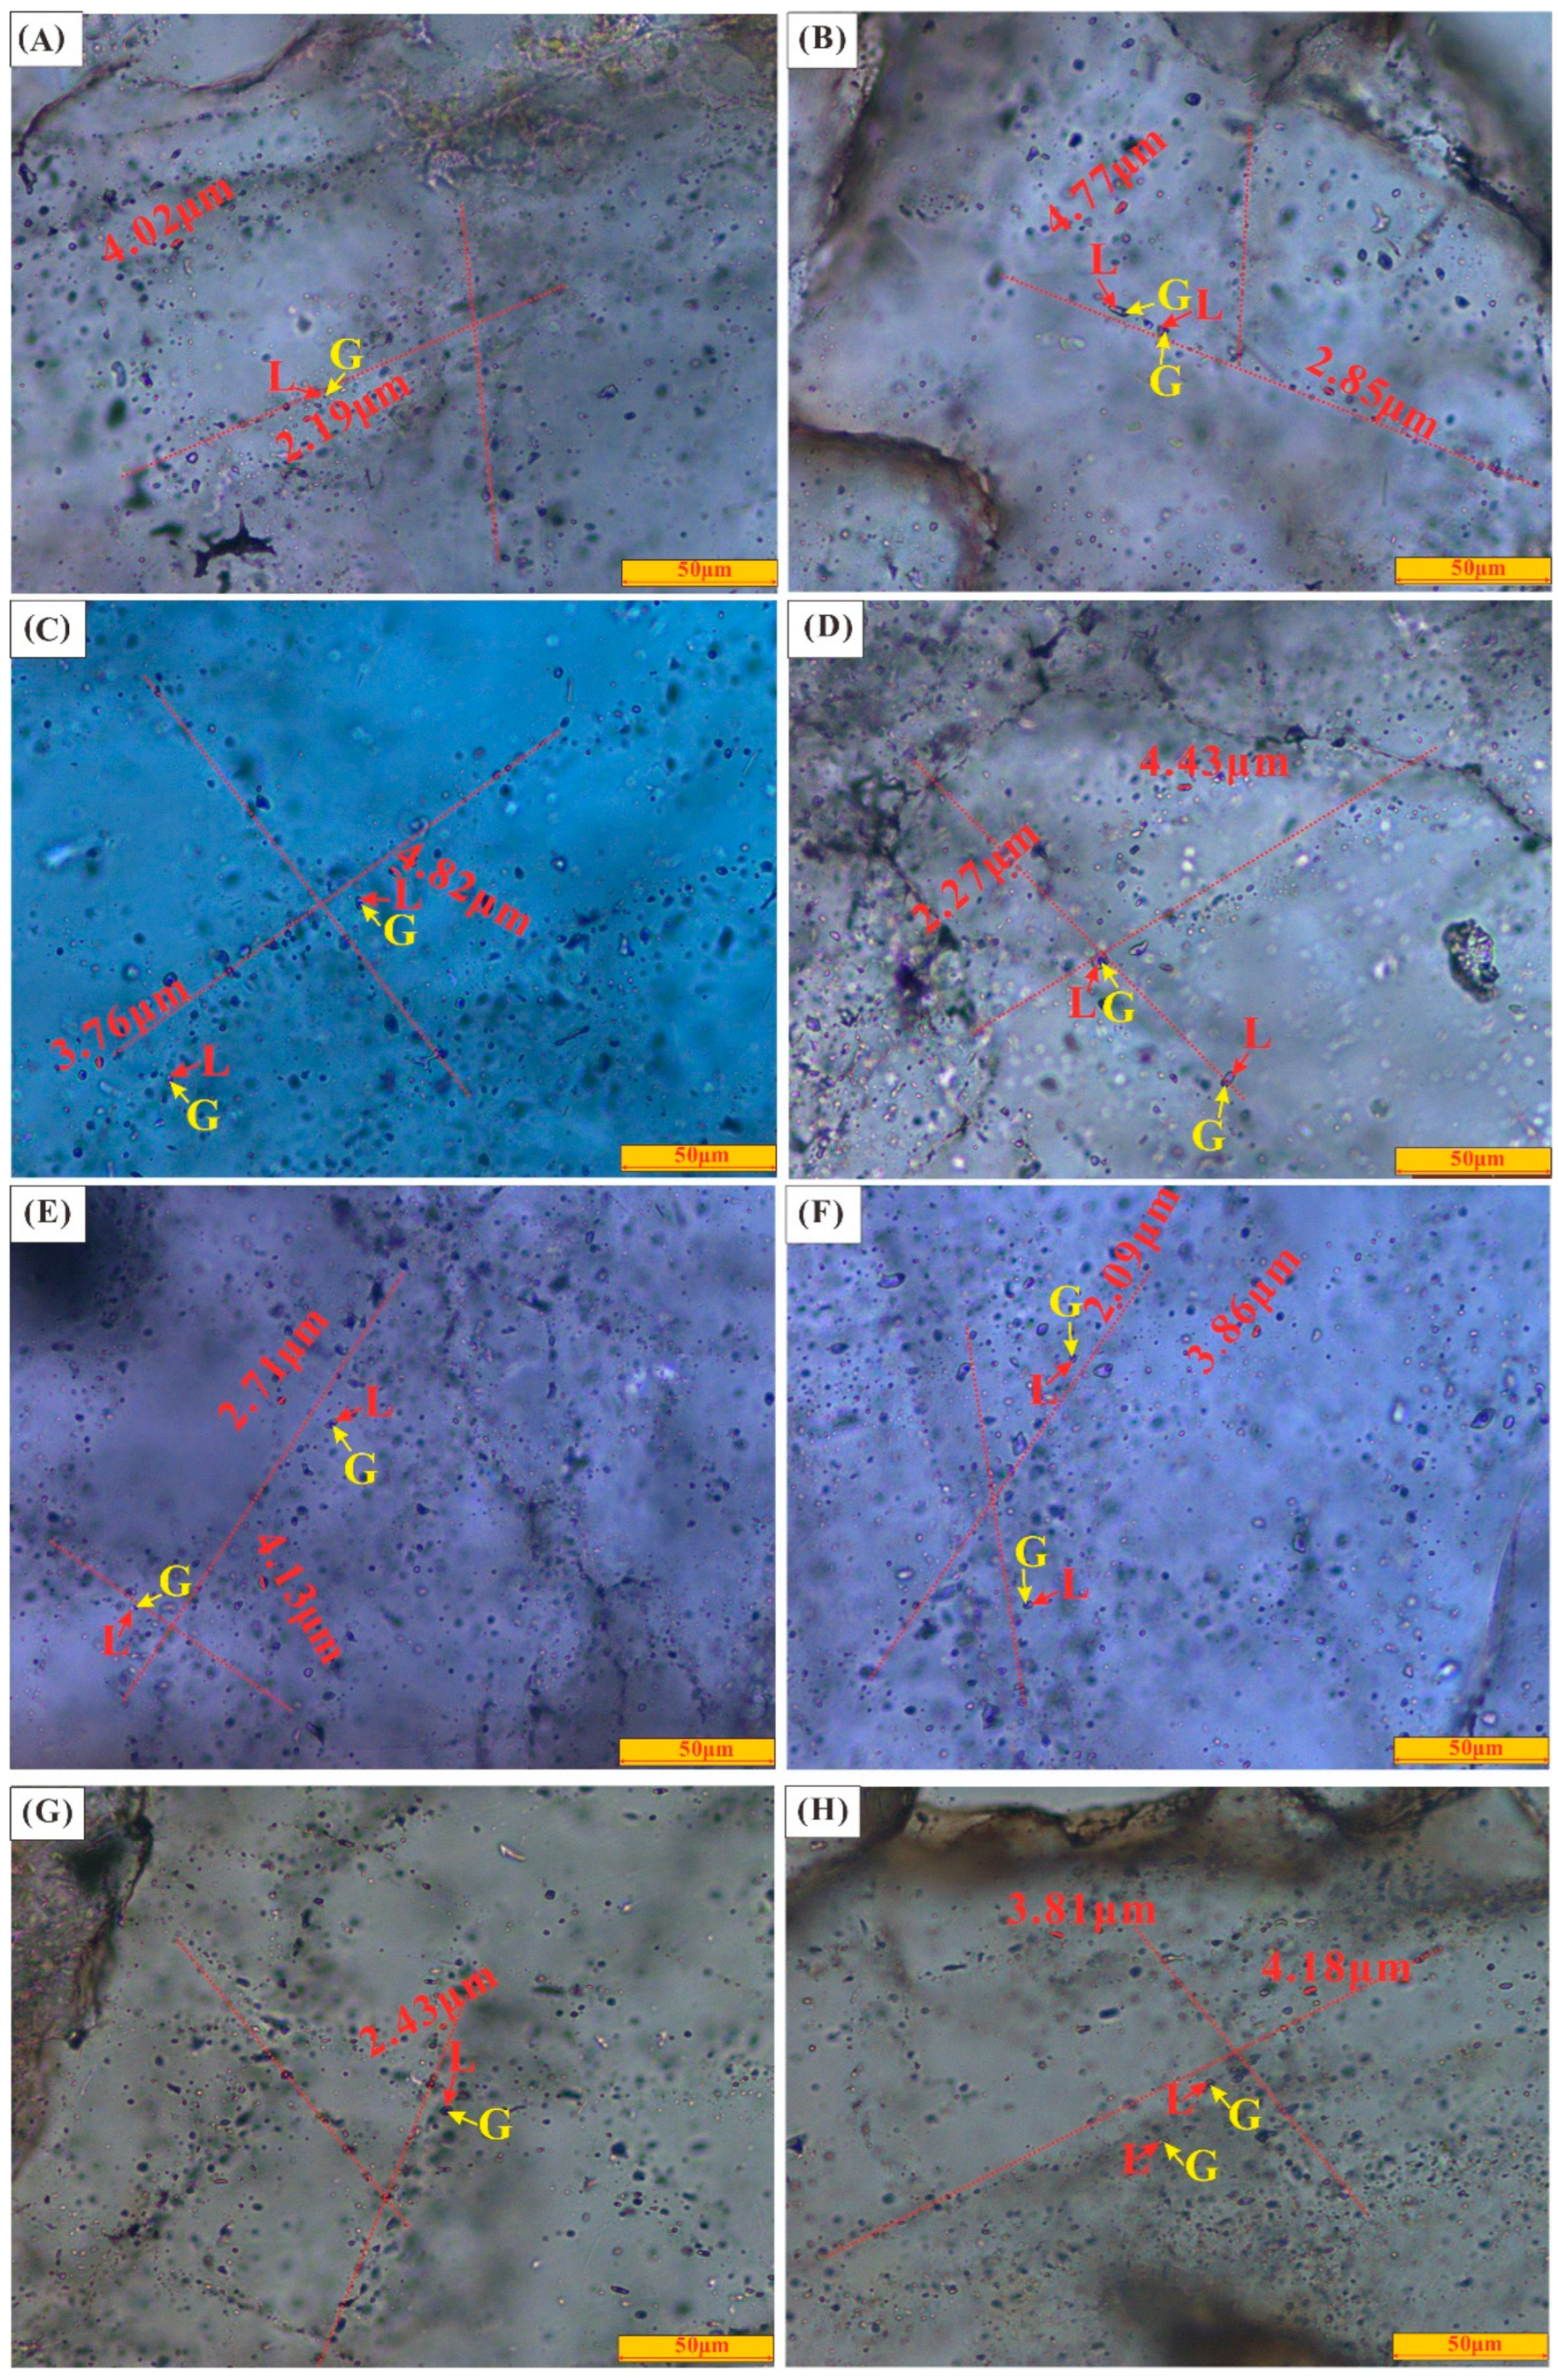
A variety of natural gas geochemical and geophysical parameters of the research wells confirmed natural gas accumulation in the Y8 area [9,61]. However, the direct hydrocarbon accumulation evidence in the Y8 area from the fluid inclusion analysis was quite limited. In this study, five samples from four research wells in the Y8 area were analyzed by laser Raman spectroscopy with more than 15 measuring points for each sample. According to the identification and localization of fluid inclusions under the microscope, the forming episodes in the reservoir samples were investigated. Gaseous hydrocarbon inclusions showing two accumulation stages developed in the four buried hill reservoir samples from the pre-Paleocene Formation (Figure 3). Gaseous hydrocarbon inclusions generally developed in fissures inside the detrital quartz grains and quartz overgrowths, indicating that they were secondary inclusions. The long axis of the fluid inclusions under the microscope was measured by HORIBA LabSpec 6, which was generally 2–5 μm. The fluid inclusions had a gas–liquid ratio of less than or equal to 5% and generally developed in an elliptic and irregular shape. The cross-distributed fluid inclusions in the microfractures indicated the development of gas–liquid two-phase inclusions. Fluid inclusions in samples X1, X3, X4, and X5 all contained CH4 according to laser Raman analysis, and the spectral peaks were 2914.02 cm−1, 2914.58 cm−1, 2917.39 cm−1 and 2917.84 cm−1, respectively. The presence of a small number of CH4 fluid inclusions in the reservoir samples (Figure 4) indicated that there were at least two natural gas accumulation events with different ages in the Y8 area.
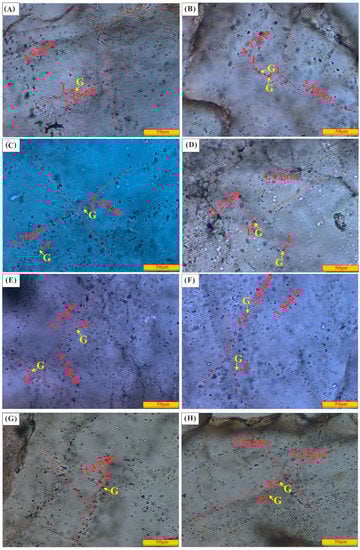
Figure 3.
Photos of fluid inclusions in the buried hill reservoir samples from the pre-Paleocene Formation of the research wells. (A) Sample X1; (B) Sample X1; (C) Sample X3; (D) Sample X3; (E) Sample X4; (F) Sample X4; (G) Sample X5; (H) Sample X5. Note: “G” means gaseous fluid inclusion. “L” means liquid fluid inclusion.
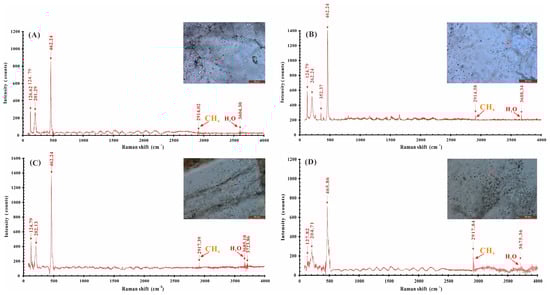
Figure 4.
Raman spectroscopic analysis results of the fluid inclusions in the buried-hill reservoir samples from the pre-Paleocene Formation of the research wells. (A) Sample X1; (B) Sample X3; (C) Sample X4; (D) Sample X5.
4.2. Evidences of Hydrothermal Activity in the Y8 Area
4.2.1. Abnormally High Th of Fluid Inclusions
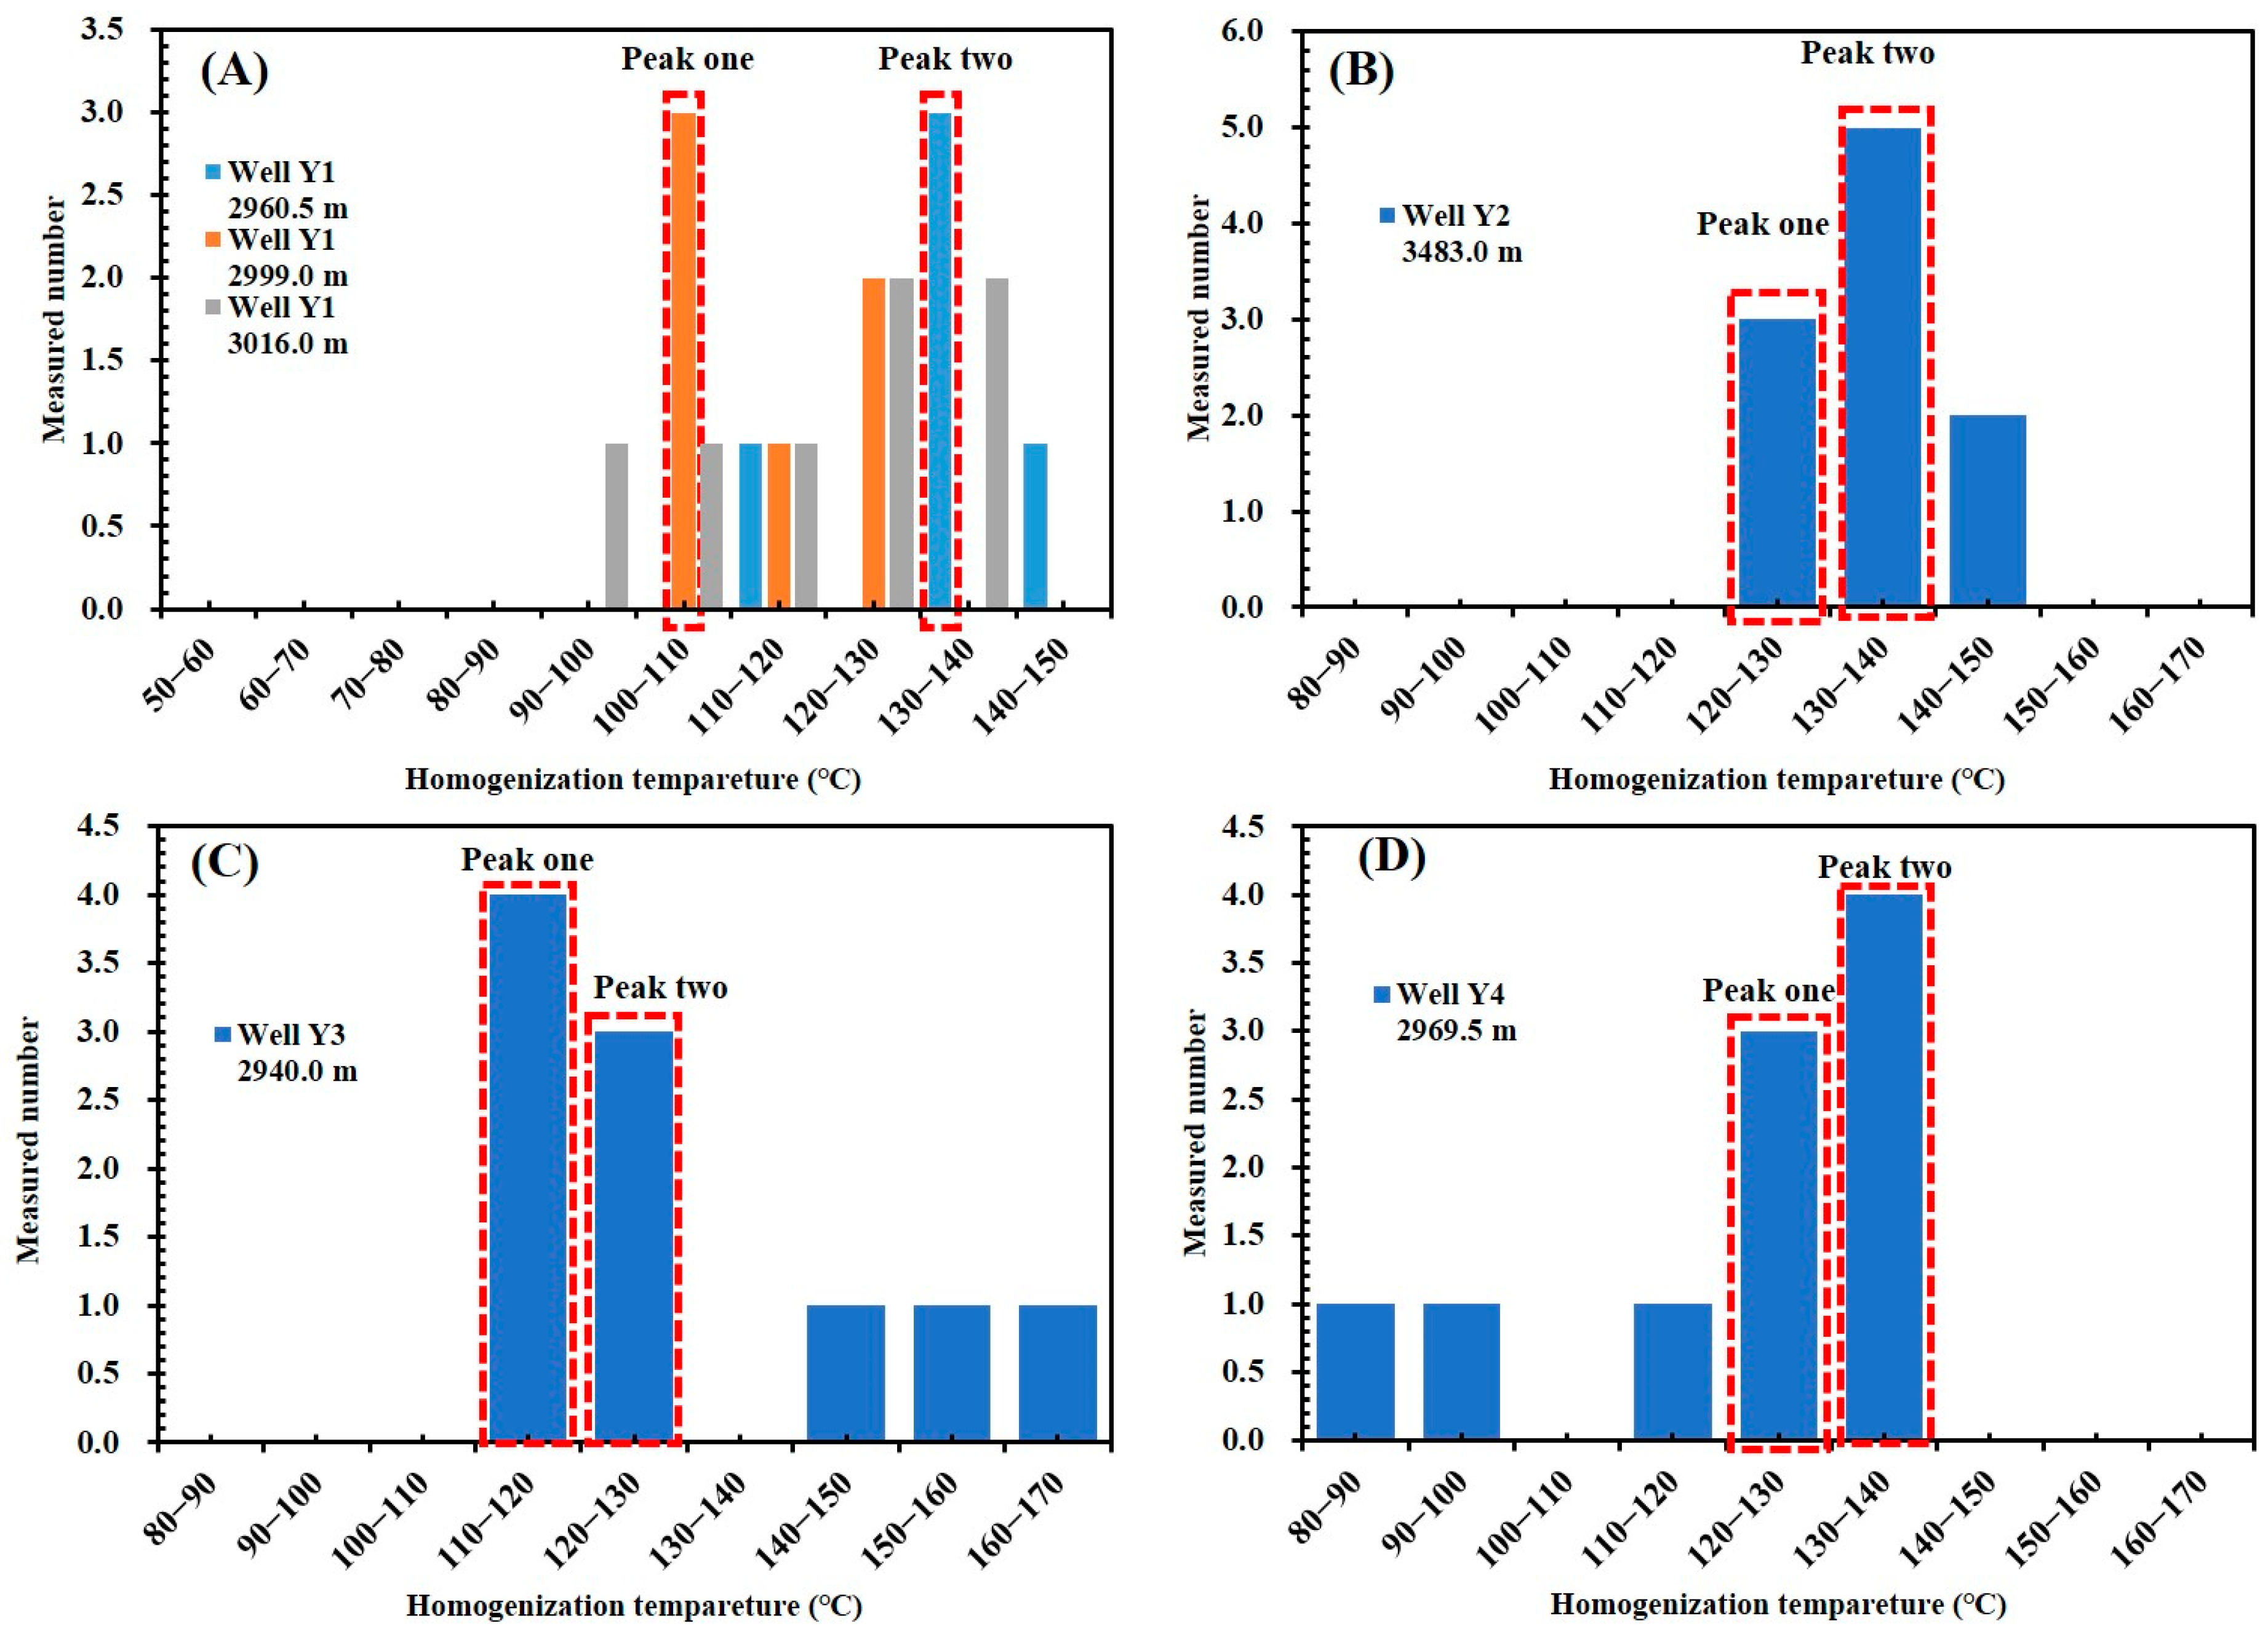
When the inclusions were formed, the hydrothermal fluid trapped in the crystals was homogeneous under high temperature and pressure. With the decrease in temperature and pressure in the later stage, the inclusions were separated into gas and liquid phases. The Th of the inclusions can represent the temperature when oil and gas were charged into the reservoir [60]. The thermal evolution and burial history of a basin mainly restore the sedimentary thickness and formation temperature of the basin in each geological period. The fluid inclusion Th of the pre-Paleogene reservoir samples in the four research wells had two main temperature distribution peaks: 100–110 °C and 130–140 °C, 120–130 °C and 130–140 °C, 110–120 °C and 130–140 °C, and 120–130 °C and 130–140 °C, respectively. The main distribution of Th was 100–140 °C. The Th (Figure 5) of these fluid inclusions supported two episodes of gas migration and accumulation in the Y8 area. The results of the thermal burial history restoration are shown in Figure 6, and the formation temperatures of the pre-Paleogene reservoir in the four research wells were 70 °C, 90 °C, 60 °C, and 70 °C.
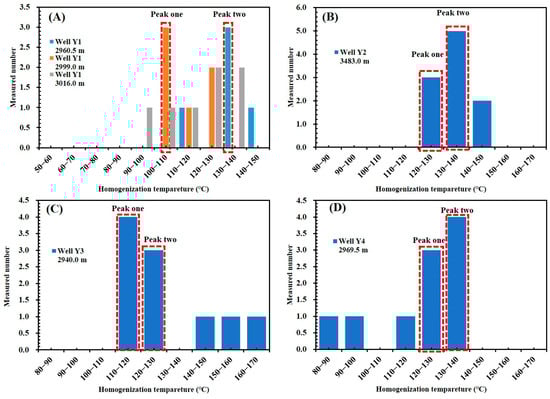
Figure 5.
Histogram of Th of fluid inclusions from the reservoirs in four wells in the Y8 area. (A) Histogram of Th of the pre-Paleogene reservoir samples in well Y1. The Th distribution has two peaks, 100−110 °C and 130−140 °C. (B) Histogram of Th of pre-Paleogene reservoir samples in well Y2. The Th distribution has two peaks, 120−130 °C and 130−140 °C. (C) Histogram of Th of the pre-Paleogene reservoir samples in well Y3. The Th distribution has two peaks, 110−120 °C and 130−140 °C. (D) Histogram of Th of the pre-Paleogene reservoir samples in well Y4. The Th distribution has two peaks, 120−130 °C and 130−140 °C.
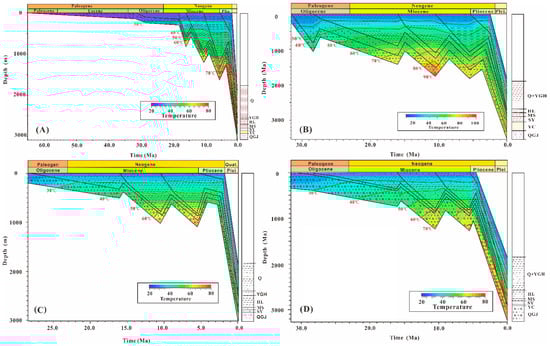
Figure 6.
Burial history and thermal evolution of sedimentary stratum in the four wells of the Y8 area. (A) The temperature of the pre-Paleogene reservoir in well Y1 was 70 °C according to geological history; (B) the temperature of the pre-Paleogene reservoir in well Y2 was 90 °C according to geological history; (C) the temperature of the pre-Paleogene reservoir in well Y3 was 60 °C according to geological history; (D) the temperature of the pre-Paleogene reservoir in well Y4 was 70 °C according to geological history.
In general, Th was input to quantify the main hydrocarbon accumulation period [62,63]. However, the Y8 area showed a different pattern. The fluid inclusion Th of the pre-Paleogene reservoir samples in the four research wells is significantly higher than the formation temperature of 60–90 °C. Therefore, the main hydrocarbon accumulation period was unclear in the Y8 area due to the abnormally high Th of fluid inclusions.
4.2.2. Compositions in the Fluid Inclusions Coincide with Hydrocarbon Accumulation
As hydrothermal fluid generally comes from deep formations, hydrothermal fluid generally contains acidic gases such as CO2, H2S, and water vapor [20]. Laser Raman spectroscopy of fluid inclusions showed that CH4 and compositions indicating hydrothermal activity were partially contained in the gas–liquid two-phase inclusions. The formation temperature was high due to hydrothermal activity. When hydrothermal activity occurred in the same period as gas charging, the components in the hydrothermal and gas fluids were mixed and filled the inclusions together, resulting in H2O being the main gas-phase constituent of a large number of inclusions (Figure 7A), with a small amount of CO2 (Figure 7B). Raman spectroscopy analysis of the fluid inclusions in reservoir samples from the Yacheng Formation of well Y8-B showed that H2S, SO2, O2, and H2O were present in the gaseous phase components of some inclusions (Figure 7C). CO32− and H2S were present in the liquid phase components (Figure 7D), which confirmed that the hydrothermal fluid charged into the reservoirs.
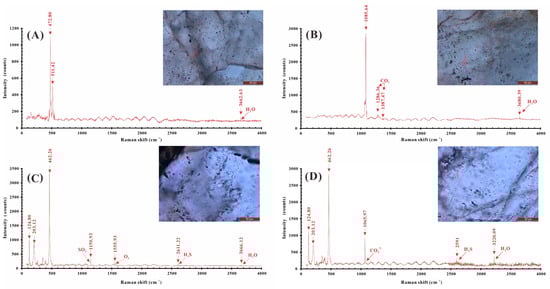
Figure 7.
Raman spectroscopic analysis results of the fluid inclusions in the buried-hill reservoir samples from the research wells. (A) The main gas phase composition of the gas–liquid two-phase inclusions in sample X3 is H2O; (B) CO2 and H2O exist in the gas phase composition of sample X4. (C) SO2, O2, H2S and H2O exist in the gas phase composition of gas–liquid two-phase inclusions in sample X2; (D) CO32−, H2S and H2O exist in the liquid phase composition of gas–liquid two-phase inclusions in sample X2.
4.2.3. Lower Tmax Values in Research Wells
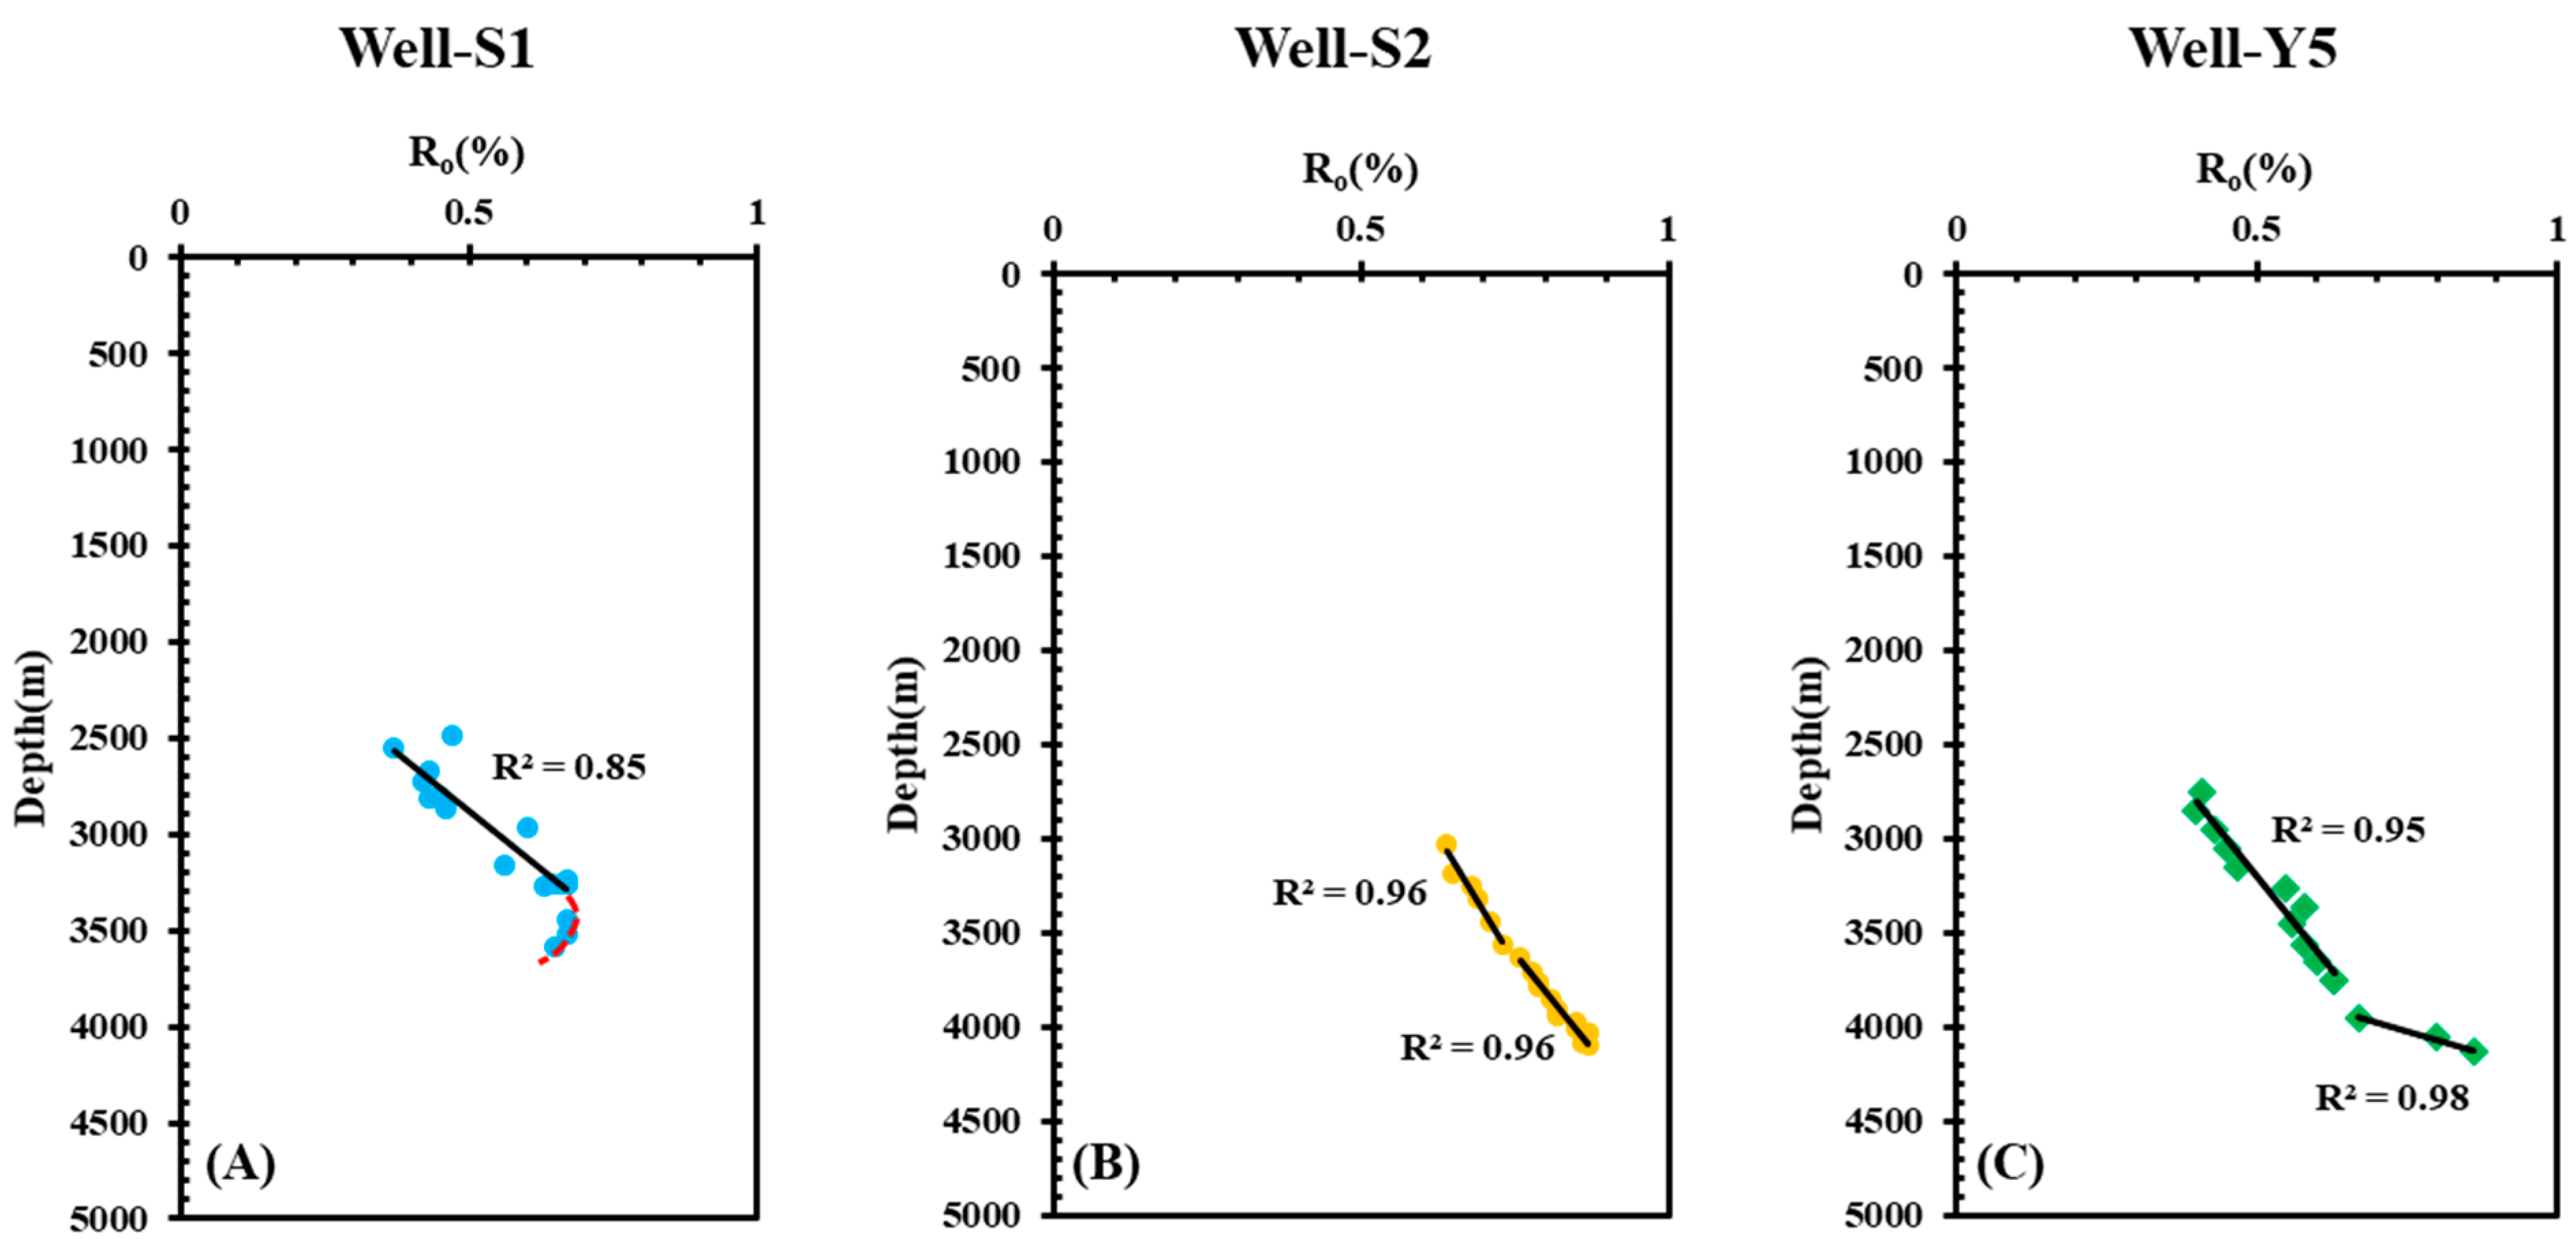
Ro is a common indicator used in the thermal reconstruction of sedimentary history. The strong linear relationship between Ro and depth indicates that the thermal evolution of the rock was controlled by the same geothermal field [64]. However, the slope of the curve between Ro and depth becomes gentle (Figure 8B,C) and the curve becomes convex (Figure 8A) in the research wells in the Y8 area. The results may have been caused by hydrothermal activity. In addition, the Tmax value of the S2 well in the Y8 area was lower than the theoretical value (Figure 9). When the formation reached the mature stage (Ro > 0.6%), the theoretical value of Tmax should have been higher than 430 °C [65,66], but the measured value was lower than 430 °C, which may have been caused by hydrothermal activity coinciding with hydrocarbon accumulation. The large amount of soluble organic matter brought up by hydrothermal activity increased the peak value of S1 (an amount of hydrocarbons already present in the sample) and the entry of soluble components into the peak of S2 (the yield of hydrocarbons formed by the thermal cracking of kerogen), which led to a lower Tmax value (the temperature corresponding to the maximum of S2).

Figure 8.
The correlation between Ro and the depth of research wells in the Y8 area. (A) The correlation between Ro and the depth in the Well-S1; (B) The correlation between Ro and the depth in the Well-S2; (C) The correlation between Ro and the depth in the Well-Y5.
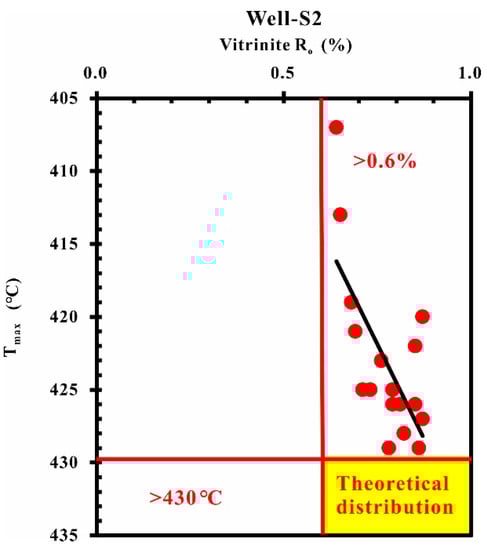
Figure 9.
The correlation between Ro and Tmax in well S2.
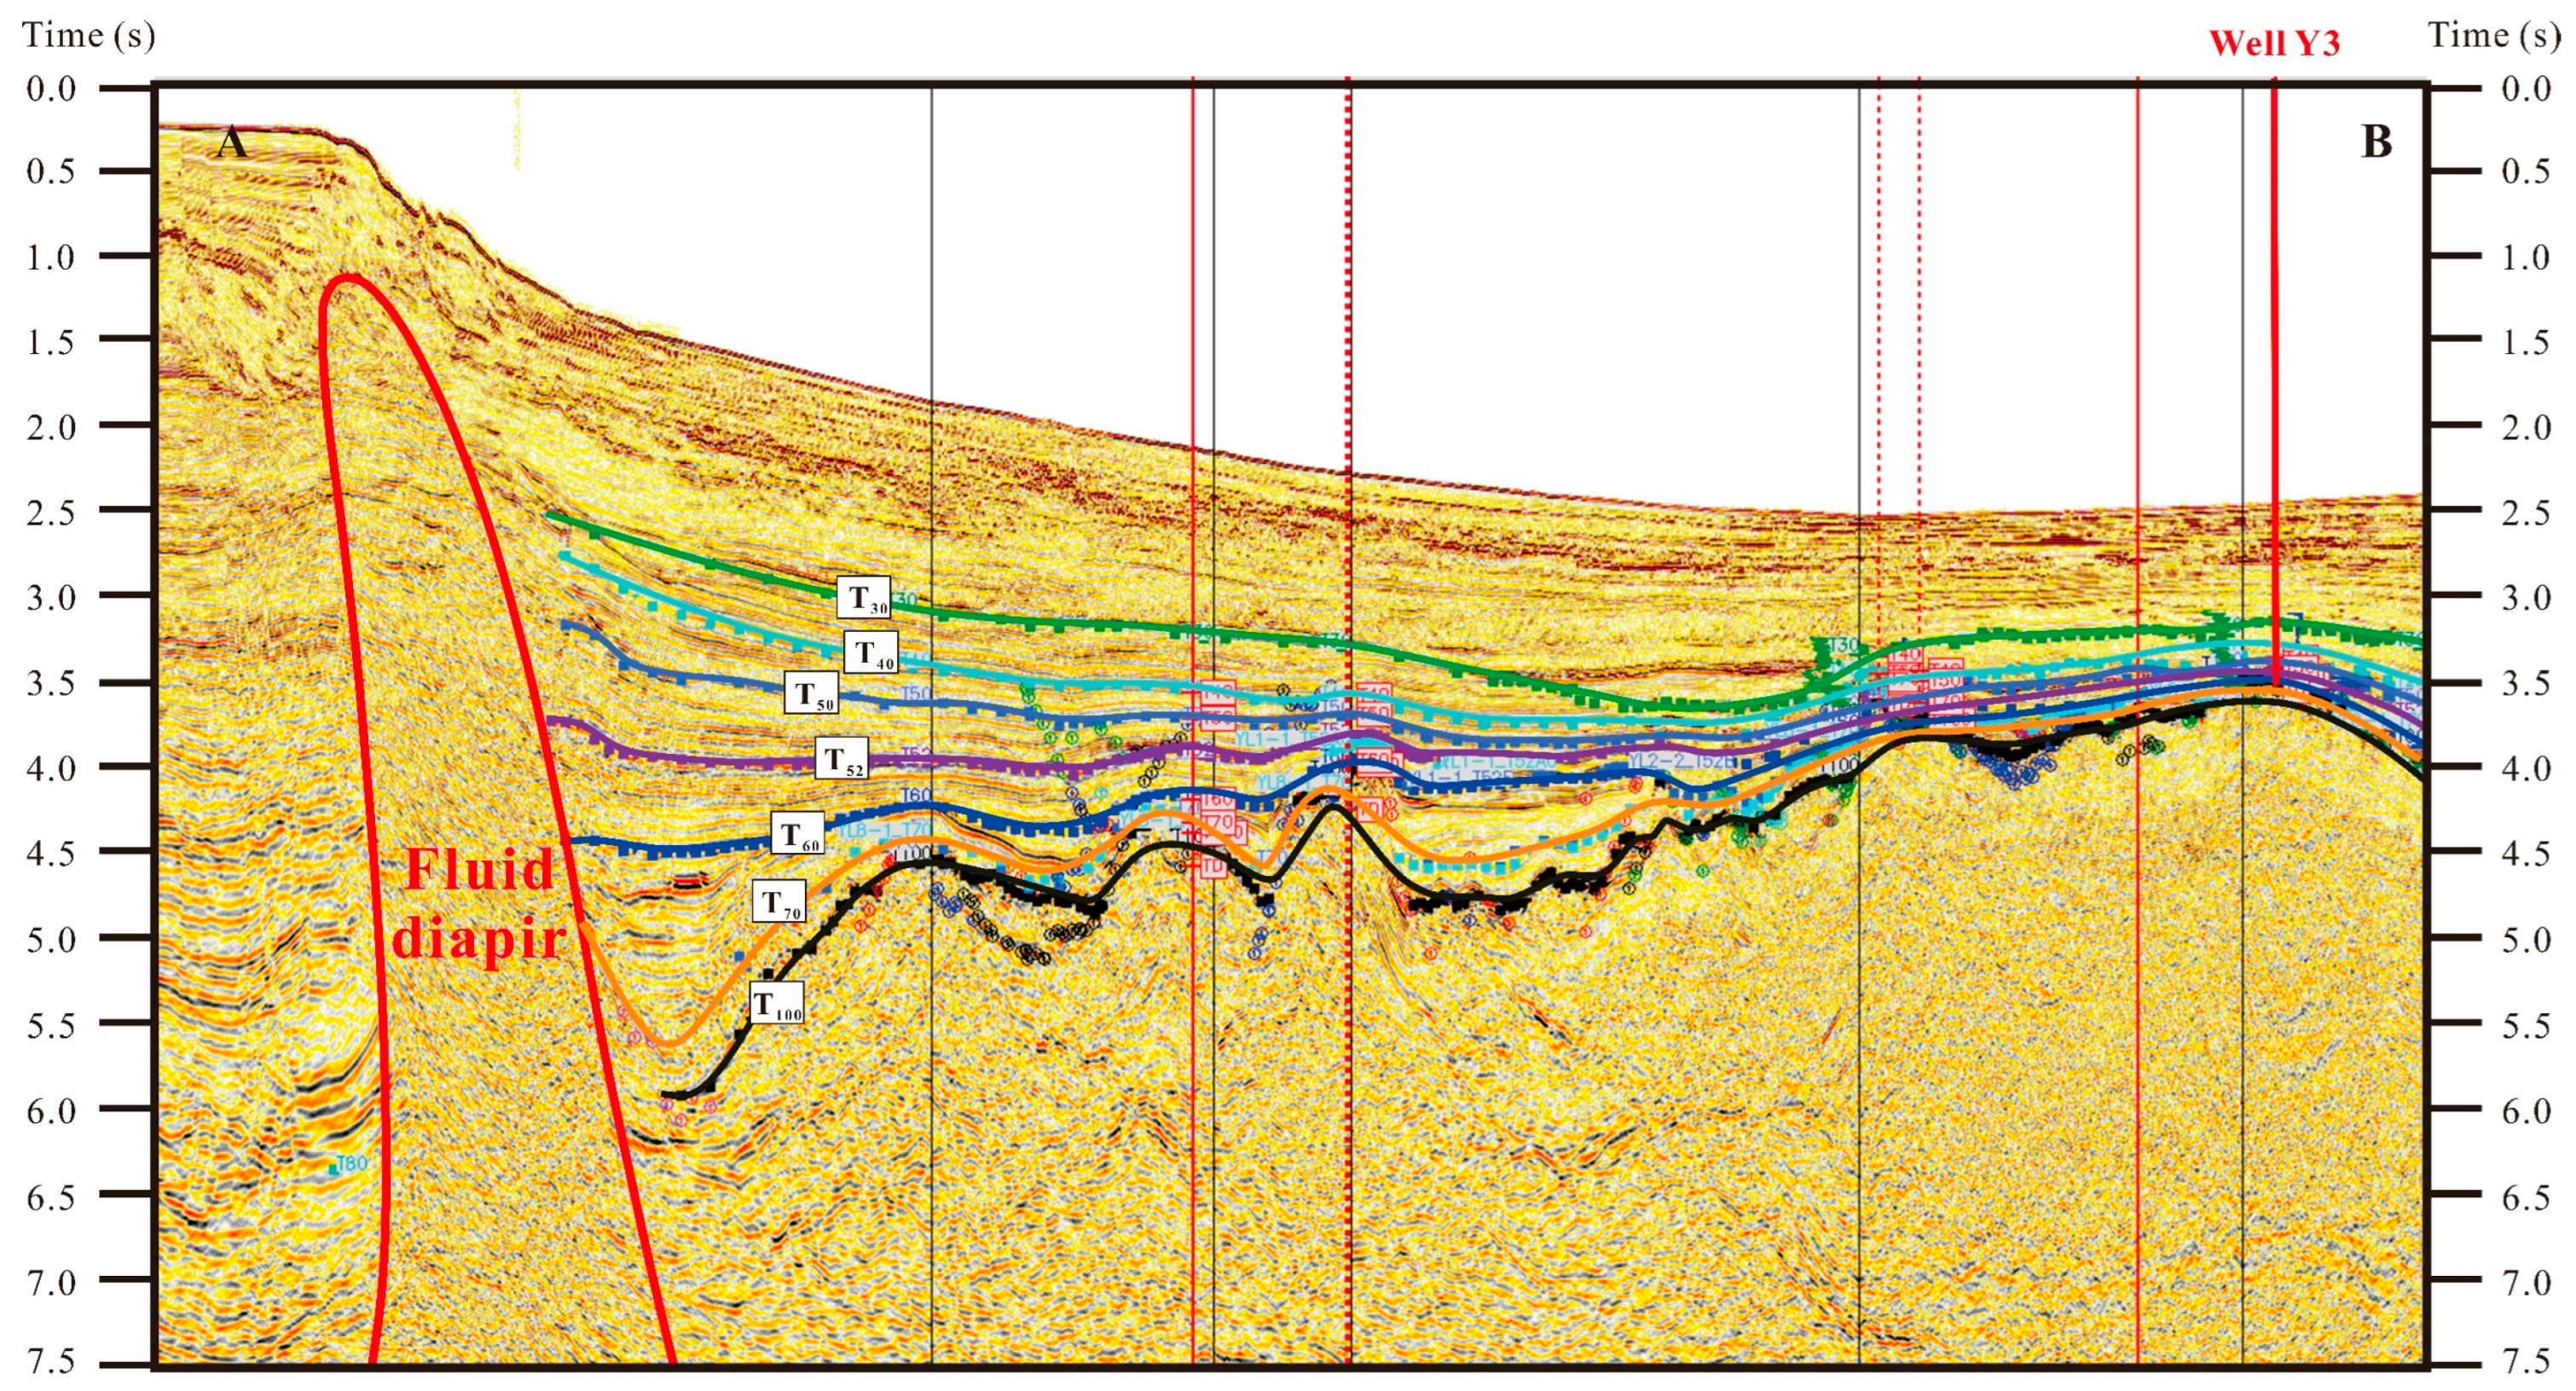
4.2.4. Presence of Fluid Diapirs in the Y8 Area
Mud diapirs were deposited rapidly and filled the mudstones with high-temperature overpressure fluid, which upwelled and broke through the weak zone of the overlying strata [22,23,67]. The seismic profile was usually characterized by a plastic upper arch of an irregular shape without a clear bottom interface. The internal reflection was often disorganized, fuzzy, or blank, and the top surface and flanks usually did not have a continuous or complete reflection phase [68]. Fluid diapirs were mainly the result of fluid migration, which showed obvious pull-down characteristics in seismic profiles and were accompanied by high temperature and pressure [69,70,71]. A fluid diapir can also act as a fast channel for hydrocarbon migration.
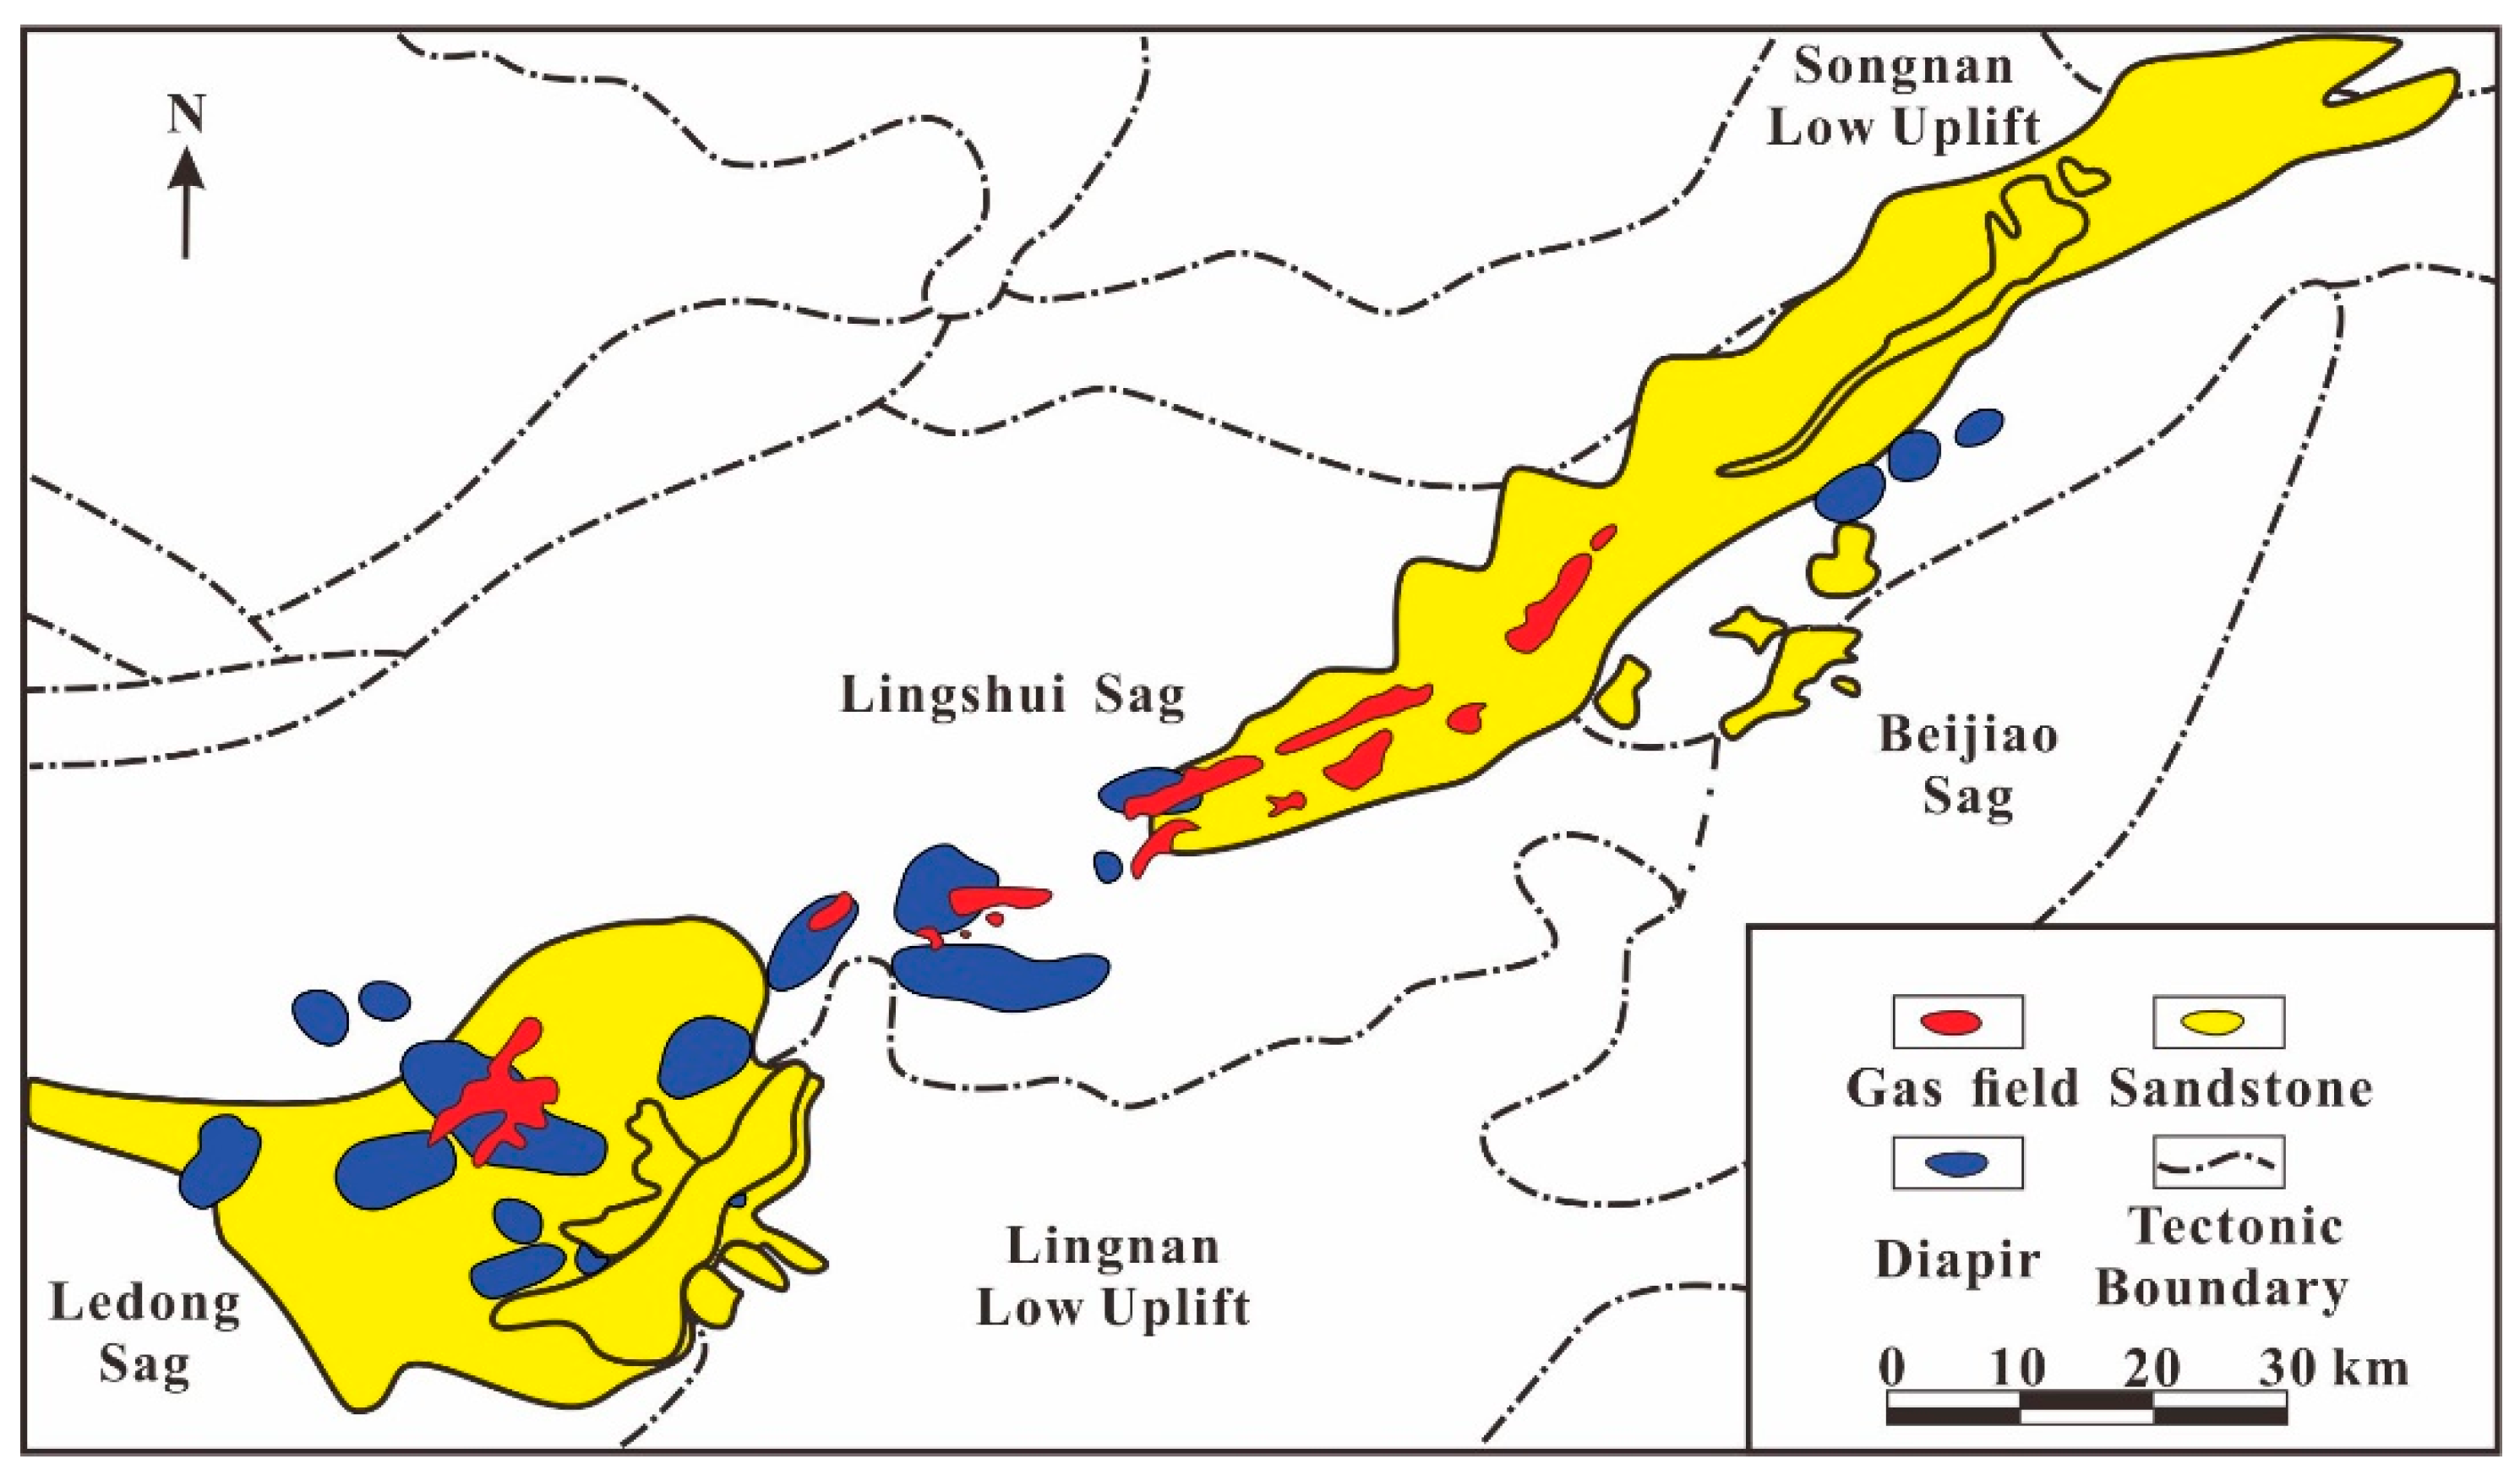
The central depression of the QDN basin was filled with large amounts of buried sediments, while high temperature and overpressure developed widely in the deep-water area. Therefore, the geological environment of high temperature and overpressure formed mud and fluid diapirs. The uplift in the north and south of the basin provided sufficient mud–fluid source materials for the development of diapirs in the central depression of the basin, and the development of structural faults and stratigraphic weak zones in the basin provided advantageous migration channels for the upward invasion of deep hydrothermal fluids with natural gas and other fluids. The Y8 area in the central depression of the QDN basin has extensive mud and fluid diapirs (Figure 10 and Figure 11) [69,72].
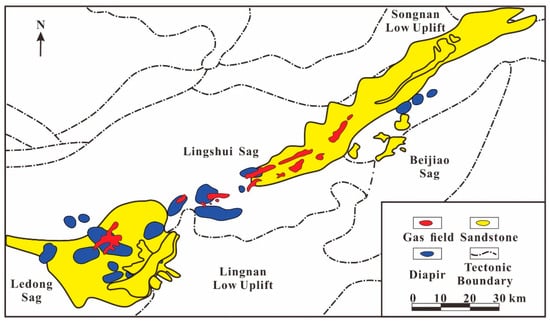
Figure 10.
The diapirs in the QDN Basin (modified from [68]).

Figure 11.
The fluid diapir distribution around the research wells in the Y8 area.
4.3. Influence of Hydrothermal Activity on Long-Distance Hydrocarbon Migration and Accumulation
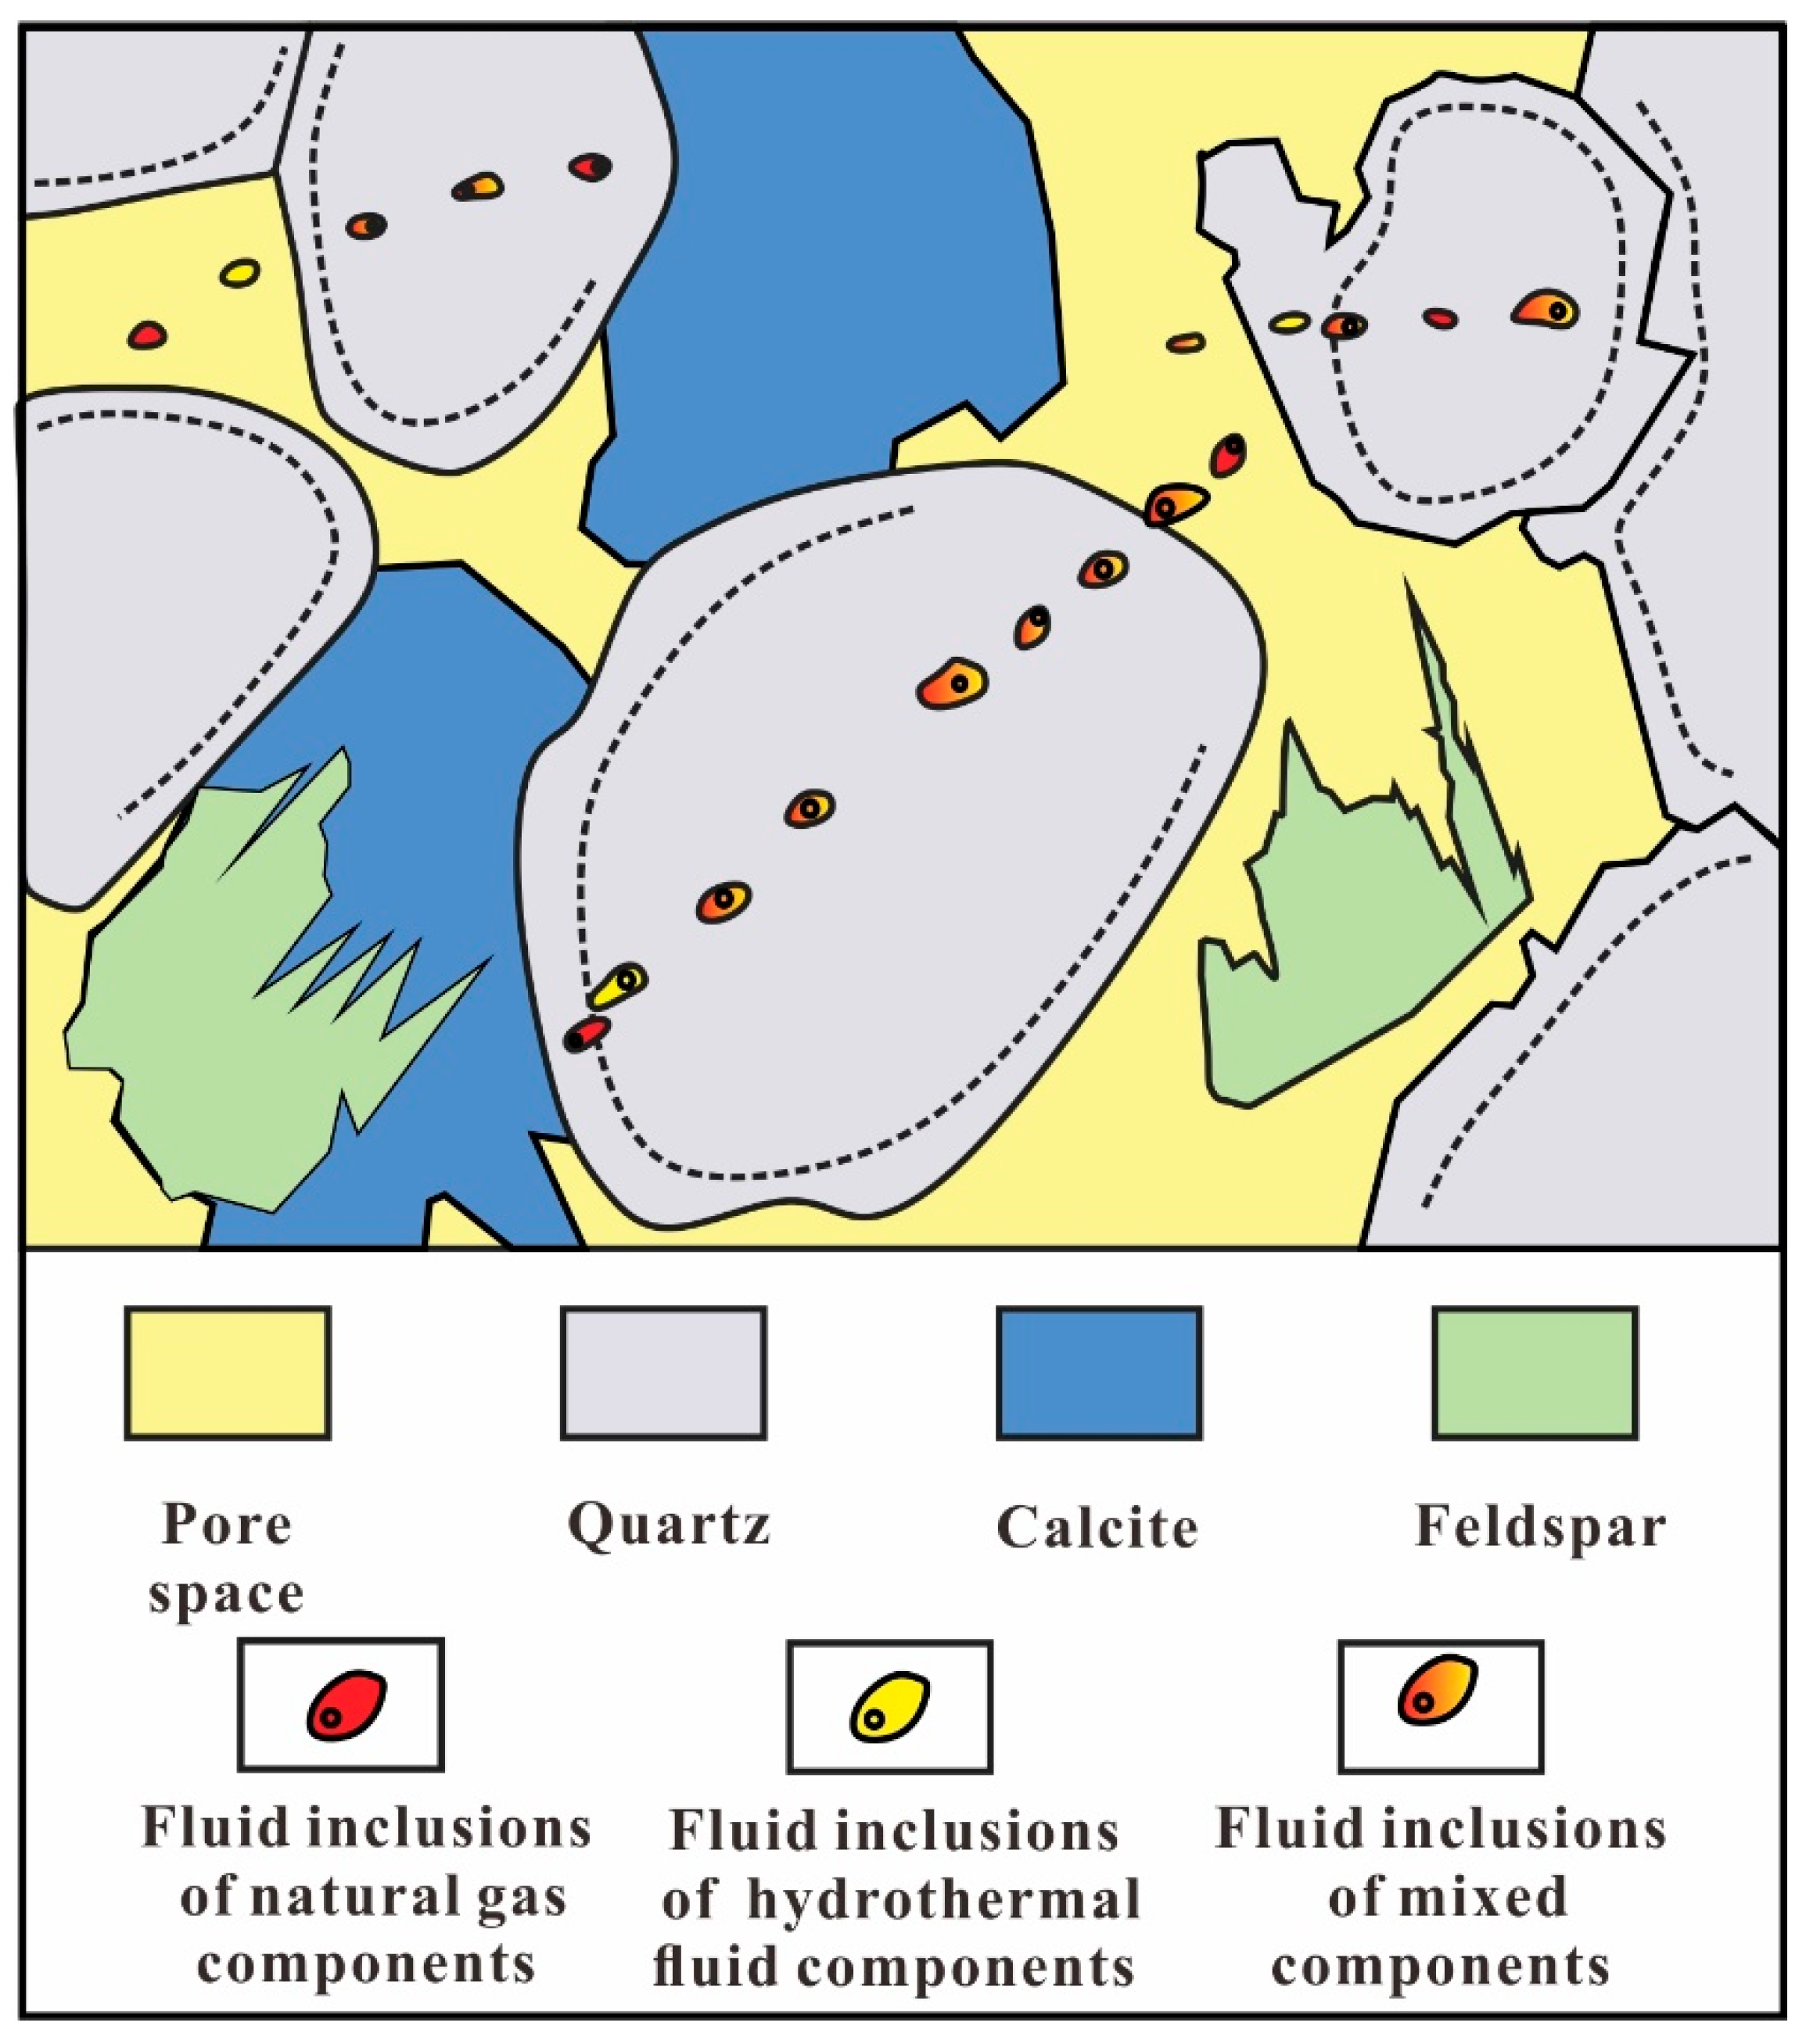
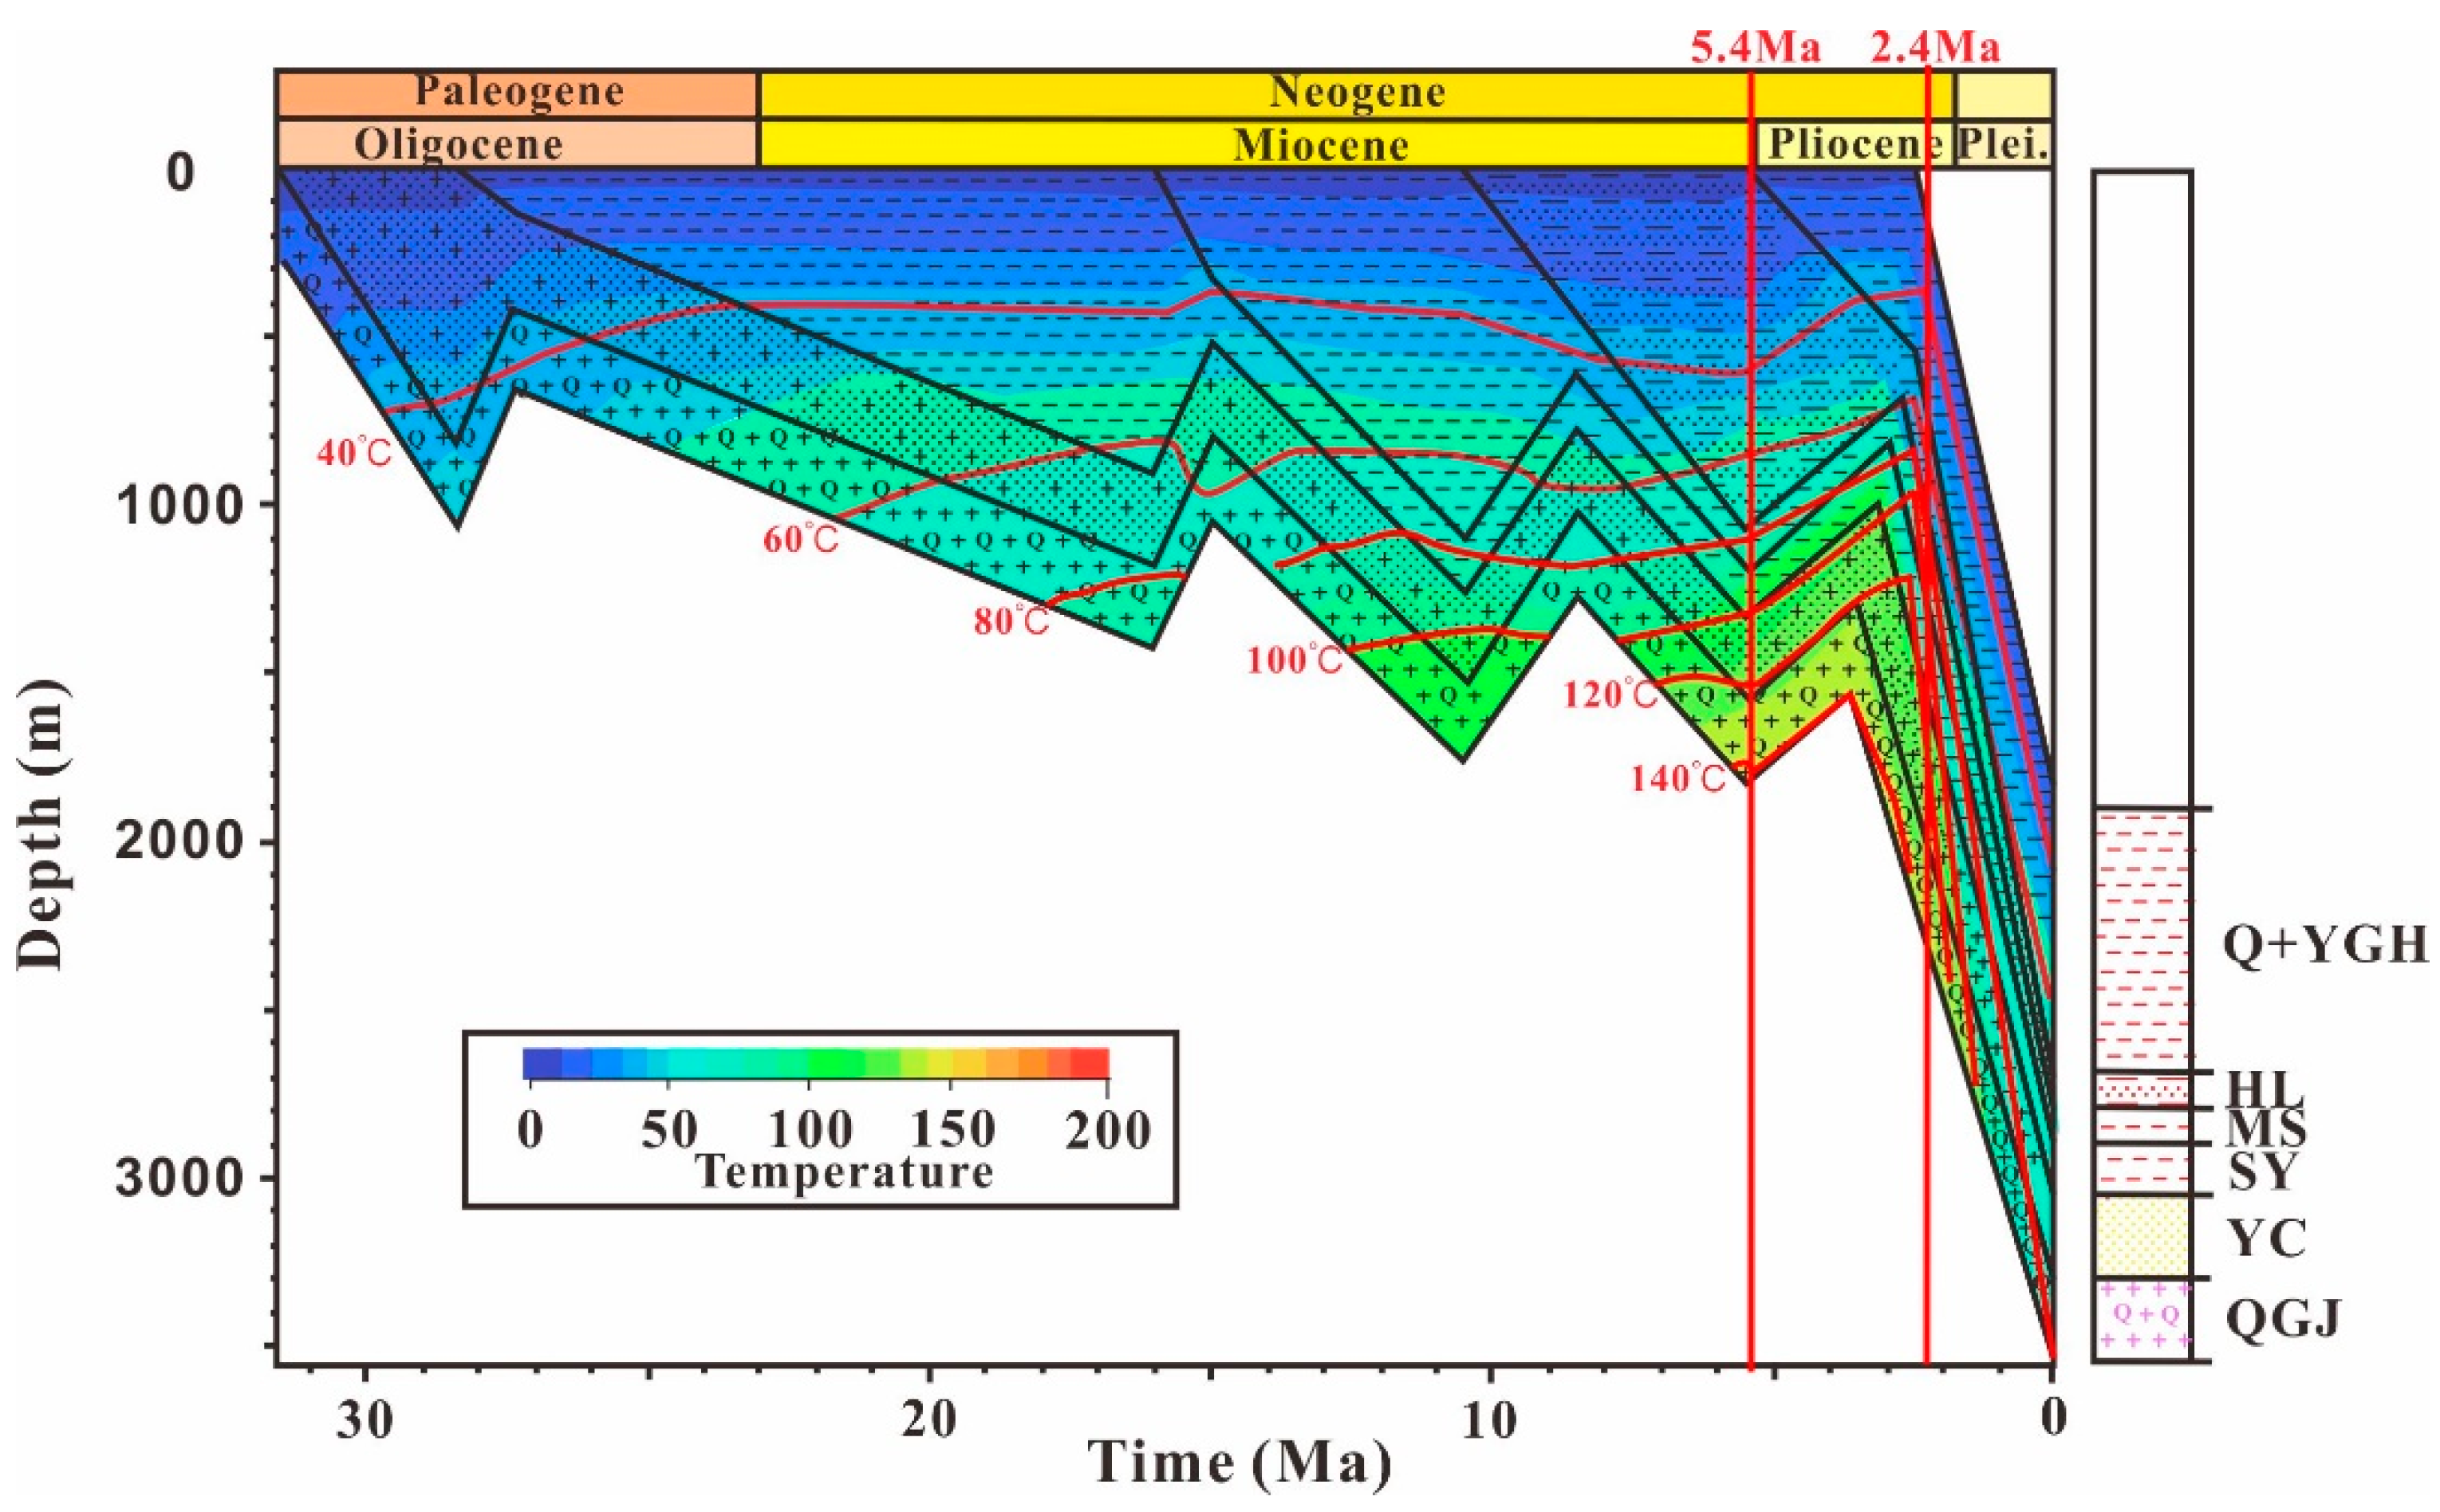
The heat flow of the Songnan-Baodao depression and its periphery increased three times. The first stage was in the Eocene (56–32 Ma), during which the heat flow of the basin increased slowly. The second stage was in the Oligocene (32–16 Ma), during which the heat flow rose rapidly before the basement began to cool and the heat flow gradually decreased. The third stage was at the end of the Miocene, when the heat flow began to rise sharply from 5.4 Ma, and finally reached the maximum at 2.4 Ma before decreasing again [73]. At 5.5 Ma, the source rocks of the Yacheng Formation entered the peak of hydrocarbon generation, and the natural gas laterally migrated into the Y8 area along the sandstone transport system over a long distance [9]. Finally, the hydrocarbon accumulation process of the Y8 area is shown in Figure 12. Hydrocarbons migrated to charge the reservoir after generation from the source rock, and hydrothermal activity occurred on the periphery of the Y8 area during this period. When hydrothermal fluids and natural gas were mixed and charged into the reservoir, hydrothermal–natural gas complexes were captured by some minerals in the reservoir to form fluid inclusions that contained both hydrothermal and natural gas components (Figure 13). Therefore, the thermal evolution and burial history of well Y2 was modified based on the hydrothermal activity, hydrocarbon expulsion period around the Y8 area, and theoretical heat flow value after 5.4 Ma (Figure 14). Finally, the hydrocarbon accumulation period in the Y8 area was determined to be 5.4–2.4 Ma.
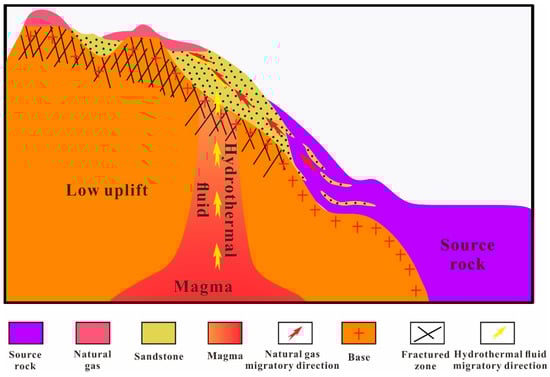
Figure 12.
Diagram of the hydrothermal activity that coincided with the hydrocarbon accumulation process.

Figure 13.
Schematic diagram of fluid inclusions in the reservoirs during the occurrence of hydrothermal activity coinciding with the hydrocarbon accumulation process.

Figure 14.
Corrected thermal evolution and burial history of well Y2.
5. Conclusions
- (1)
- Two episodes of natural gas charging developed in the Y8 area, and the main peak of the fluid inclusion Th of the four research wells was 100–140 °C, which was significantly higher than the 60–90 °C formation temperature of the pre-Paleogene reservoir. Hydrothermal activity resulted in higher Th of fluid inclusions than the temperature of the corresponding reservoir in geological history.
- (2)
- According to the laser Raman spectrum analysis of fluid inclusions in the Y8 area, the compositions of fluid inclusions in the study area contained both natural gas and hydrothermal fluid compositions. The analysis of the geochemical data of the research wells showed that a Tmax value lower than the theoretical value was caused by hydrothermal activity after diagenesis. The fluid diapirs also confirmed the presence of hydrothermal activity around the Y8 area.
- (3)
- The influence of hydrothermal activity on the long-distance natural gas accumulation process was clarified. Hydrothermal activity caused “high temperature baking” in the reservoir, which made the formation temperature rise significantly in the period of natural gas charging. In the later period, the formation temperature rapidly dropped to the present temperature without hydrothermal activity.
Author Contributions
Investigation, Writing—original draft, J.G.; Writing—review & Editing, Supervision, S.X.; Methodology, Project administration, G.L.; Investigation, Funding acquisition, Z.G.; Investigation, Methodology, X.L., W.Y., Z.J., Y.W. All authors have read and agreed to the published version of the manuscript.
Funding
This research was funded by the National Natural Science Foundation of China (No. 41972145).
Institutional Review Board Statement
This study does not involve humans or animals, and there is no ethical review and approval.
Informed Consent Statement
This study does not involve human research and does not require informed consent.
Data Availability Statement
Not applicable.
Acknowledgments
Lan Li is acknowledged for her help in data acquisition for the geochemical analysis.
Conflicts of Interest
The authors declare no conflict of interest. The funders had no role in the design of the study; in the collection, analyses, or interpretation of data; in the writing of the manuscript, or in the decision to publish the results.
References
- Pettingill, H.; Weimer, P. Worldwide deepwater exploration and production: Past, present, and future. Leading Edge 2002, 21, 371–376. [Google Scholar] [CrossRef]
- Zhang, G.; Qu, H.; Zhang, F.; Fan, Y. A basic distributional framework of global deepwater basins and hydrocarbon characteristics. Acta Pet. Sin. 2019, 40, 1–34. [Google Scholar]
- Zhang, G.; Mi, L.; Qu, H.; Zhang, H.; Xie, X.; Hu, S.; Zhang, Y. Petroleum geology of deep-water areas in offshore China. Acta Pet. Sin. 2013, 34, 1–14. [Google Scholar]
- Delgado, L.; Batezelli, A.; Luna, J. Petroleum geochemical characterization of Albian-Oligocene sequences in the Campos Basin: “Case study: Eastern Marlim oilfield, offshore, Brazil”. J. S. Am. Earth Sci. 2018, 88, 715–735. [Google Scholar] [CrossRef]
- Li, H.; Zhang, M.; Lau, H.C.; Fu, S. China’s deepwater development: Subsurface challenges and opportunities. J. Pet. Sci. Eng. 2020, 195, 107761. [Google Scholar] [CrossRef]
- Yu, Y.; Zhang, C.; Wang, L.; Li, S.; Hursthouse, A.; Huang, Y.; Cao, T. Sedimentary characteristics and genetic mechanism of a deep-water channel system in the Zhujiang Formation of Baiyun Sag, Pearl River Mouth Basin. Deep Sea Res. Part I Oceanogr. Res. Pap. 2020, 168, 103456. [Google Scholar] [CrossRef]
- Zhang, J.; Wu, S.; Hu, G.; Fan, T.-E.; Yu, B.; Lin, P.; Jiang, S. Sea-level control on the submarine fan architecture in a deepwater sequence of the Niger Delta Basin. Mar. Pet. Geol. 2018, 94, 179–197. [Google Scholar] [CrossRef]
- Wang, L.; Pan, J.; Yang, L. Present Conditions and Prospect of Global Deepwater Oil and Gas Exploration and Development. Pet. Sci. Technol. Forum 2020, 39, 31–37. [Google Scholar] [CrossRef]
- Zhang, Y.; Gan, J.; Xu, X.; Liang, G.; Li, X. The source and natural gas lateral migration accumulation model of Y8–1 gas bearing structure, east deep water in the Qiongdongnan Basin. Earth Sci. 2019, 44, 2609–2618. [Google Scholar]
- Wang, X.; Lu, Z.; Li, M.; Guo, H.; Zhu, Z.; Li, X.; Yang, C.; Zeng, B.; Wang, F.; Ran, Z. Petroleum Charging History of the Paleogene Sandstone Reservoirs in the Huangtong Sag of the Fushan Depression, South China Sea. Energies 2022, 15, 1374. [Google Scholar] [CrossRef]
- Yang, R.; Zhao, X.; Zhao, C.; Pu, X.; Liu, H.; Li, H.; Fu, L.; Tang, Y. Hydrocarbon Charging and Accumulation in the Permian Reservoirs of the Wumaying Buried Hill, Huanghua Depression, Bohai Bay Basin, China. Energies 2021, 14, 8109. [Google Scholar] [CrossRef]
- Kerkhof, A.M.V.D.; Hein, U.F. Fluid inclusion petrography. Lithos 2001, 55, 27–47. [Google Scholar] [CrossRef]
- Jing, C.; Wang, Z.; Zhang, D. Research progress on fluid inclusion applied to the determination of hydrocarbon accumulation period. Sino-Glob. Energy 2018, 23, 48–54. [Google Scholar]
- Jia, Y.; Hu, P.; Zhang, M.; Zhang, T.; Chen, K.; Cong, Y. Characteristics of fluid inclusions and their constraints on timing of hydrocarbon filling in the Yacheng area of Qiongdongnan basin, South China. Acta Sedimentol. Sin. 2001, 30, 189–196. [Google Scholar]
- Su, A.; Chen, H.; Chen, X.; Liu, H.; Liu, Y.; Lei, M. New insight into origin, accumulation and escape of natural gas in the Songdong and Baodao regions in the eastern Qiongdongnan basin, South China Sea. J. Nat. Gas Sci. Eng. 2018, 52, 467–483. [Google Scholar] [CrossRef]
- Wang, L.; Zhu, J.; Zhuo, H.; Sun, Z.; Song, A.; Zhang, H. Seismic characteristics and mechanism of fluid flow structures in the central depression of Qiongdongnan basin, northern margin of South China Sea. Int. Geol. Rev. 2020, 62, 1–23. [Google Scholar] [CrossRef]
- Wang, Z.; Shi, X.; Yang, J.; Huang, B.; Sun, Z.; Wang, Y.; Jiang, H.; Yu, C.; Yang, X. Analyses on the tectonic thermal evolution and influence factors in the deep-water Qiongdongnan Basin. Acta Oceanol. Sin. 2015, 33, 107–117. [Google Scholar] [CrossRef]
- White, D.E. Thermal waters of volcanic origin. GSA Bull. 1957, 68, 1637–1658. [Google Scholar] [CrossRef]
- Zeng, Z. Submarine Hydrothermal Geology; Science Press: Beijing, China, 2011. [Google Scholar]
- Zhu, J.; Li, S.; Sun, X.; Zhu, J.; Xin, M.; Xu, H. Discovery of early tertiary hydrothermal activity and its significance in oil/gas geology, Dongpu Depression, Henan Province, China. Chin. J. Geochem. 1994, 13, 270–283. [Google Scholar]
- Marchig, V.; Gundlach, H.; Möller, P.; Schley, F. Some geochemical indicators for discrimination between diagenetic and hydrothermal metalliferous sediments. Mar. Geol. 1982, 50, 241–256. [Google Scholar] [CrossRef]
- Kholodov, V.N. Mud Volcanoes, Their Distribution Regularities and Genesis: Communication 1. Mud Volcanic Provinces and Morphology of Mud Volcanoes. Lithol. Miner. Resour. 2002, 37, 197–209. [Google Scholar] [CrossRef]
- Kopf, A.J. Significance of mud volcanism. Rev. Geophys. 2002, 40, 1005. [Google Scholar] [CrossRef] [Green Version]
- McKibben, M.A.; Williams, A.E.; Hall, G.E.M. Solubility and transport of plantinum-group elements and Au in saline hydrothermal fluids; constraints from geothermal brine data. Econ. Geol. 1990, 85, 1926–1934. [Google Scholar] [CrossRef]
- Liu, W.; Zhang, K.; Jiang, Z.; Jiang, S.; Song, Y.; Jia, C.; Huang, Y.; Wen, M.; Liu, T.; Xie, X.; et al. Effect of the hydrothermal activity in the Lower Yangtze region on marine shale gas enrichment: A case study of Lower Cambrian and Upper Ordovician-Lower Silurian shales in Jiangye-1 well. Open Geosci. 2018, 10, 582–592. [Google Scholar] [CrossRef]
- Venkatesan, M.; Ruth, E.; Rao, P.; Nath, B.; Rao, B. Hydrothermal petroleum in the sediments of the Andaman Backarc Basin, Indian Ocean. Appl. Geochem. 2003, 18, 845–861. [Google Scholar] [CrossRef]
- Ji, L.; Li, J.; Zhang, M.; Lu, H.; He, C.; Jin, P.; Ma, B. Effects of lacustrine hydrothermal activity on the organic matter input of source rocks during the Yanchang period in the Ordos Basin. Mar. Pet. Geol. 2020, 125, 104868. [Google Scholar] [CrossRef]
- Lavoie, D.; Chi, G.; Brennan-Alpert, P.; DesRochers, A.; Bertrand, R. Hydrothermal dolomitization in the Lower Ordovician Romaine Formation of the Anticosti Basin: Significance for hydrocarbon exploration. Bull. Can. Pet. Geol. 2005, 53, 454–471. [Google Scholar] [CrossRef]
- Lü, X.; Yang, N.; Zhou, X.; Yang, H.; Li, J. Influence of Ordovician carbonate reservoir beds in Tarim Basin by faulting. Sci. China Ser. D Earth Sci. 2008, 51, 53–60. [Google Scholar] [CrossRef]
- Smith, L. Origin and reservoir characteristics of Upper Ordovician TrentonBlack River hydrothermal dolomite reservoirs in New York. AAPG Bull. 2006, 90, 1691–1718. [Google Scholar] [CrossRef] [Green Version]
- Xiao, D.; Cao, J.; Luo, B.; Tan, X.; Liu, H.; Zhang, B.; Yang, X.; Li, Y. On the dolomite reservoirs formed by dissolution: Differential eogenetic versus hydrothermal in the lower Permian Sichuan Basin, southwestern China. AAPG Bull. 2020, 104, 1405–1438. [Google Scholar] [CrossRef]
- Tian, T.; Yang, P.; Ren, Z.; Fu, D.; Zhou, S.; Yang, F.; Li, J. Hydrocarbon migration and accumulation in the Lower Cambrian to Neoproterozoic reservoirs in the Micangshan tectonic zone, China: New evidence of fluid inclusions. Energy Rep. 2020, 6, 721–733. [Google Scholar] [CrossRef]
- Horita, J.; Berndt, M.E. Abiogenic Methane Formation and Isotopic Fractionation Under Hydrothermal Conditions. Science 1999, 285, 1055–1057. [Google Scholar] [CrossRef] [PubMed]
- Shu, Y.; Sang, S.-X.; Lin, Y.-X.; Zhou, X.-Z.; Wang, H.; Wang, Z.-L. The influence of magmatic-hydrothermal activities on porosity and permeability of sandstone reservoirs in the Linxing area, Ordos Basin, Northern China. J. Southeast Asian Earth Sci. 2021, 213, 104741. [Google Scholar] [CrossRef]
- Zhang, K.; Liu, R.; Liu, Z.; Li, B.; Han, J.; Zhao, K. Influence of volcanic and hydrothermal activity on organic matter enrichment in the Upper Triassic Yanchang Formation, southern Ordos Basin, Central China. Mar. Pet. Geol. 2019, 112, 104059. [Google Scholar] [CrossRef]
- Zhou, D.; Ru, K.; Chen, H.-Z. Kinematics of Cenozoic extension on the South China Sea continental margin and its implications for the tectonic evolution of the region. Tectonophysics 1995, 251, 161–177. [Google Scholar] [CrossRef]
- Zhao, Z.; Sun, Z.; Wang, Z.; Sun, Z.; Liu, J.; Zhang, C. The high resolution sedimentary filling in Qiongdongnan Basin, Northern South China Sea. Mar. Geol. 2015, 361, 11–24. [Google Scholar] [CrossRef]
- Huang, H.; Huang, B.; Huang, Y.; Li, X.; Tian, H. Condensate origin and hydrocarbon accumulation mechanism of the deepwater giant gas field in western South China Sea: A case study of Lingshui 17-2 gas field in Qiongdongnan Basin. Pet. Explor. Dev. 2017, 44, 409–417. [Google Scholar] [CrossRef]
- Ding, W.; Hou, D.; Zhang, W.; He, D.; Cheng, X. A new genetic type of natural gases and origin analysis in Northern Songnan-Baodao Sag, Qiongdongnan Basin, South China Sea. J. Nat. Gas Sci. Eng. 2018, 50, 384–398. [Google Scholar] [CrossRef]
- Yang, J.; Yang, X.; Zhou, X.; Gan, J.; Song, A.; Jiang, F.; Yang, L. Characteristics of inversion structure belts and their hydrocarbon geological significance in the Songnan-Baodao Sag in deep water area of the Qiongdongnan Basin. Haiyang Xuebao 2019, 41, 97–106. [Google Scholar]
- Su, M.; Xie, X.; Wang, Z.; Jiang, T.; Zhang, C.; He, Y. Sedimentary evolution of the Central Canyon System in the Qiongdongnan Basin, northern South China Sea. Pet. Res. 2016, 1, 81–92. [Google Scholar] [CrossRef]
- Mi, L.; Yuan, Y.; Zhang, G.; Hu, S.; He, L.; Yang, S. Characteristics and genesis of geothermal field in deep water area of the northern South China Sea. Acta Pet. Sin. 2009, 30, 27–32. [Google Scholar]
- Zhu, W.; Xie, X.; Wang, Z.; Zhang, D.; Zhang, C.; Cao, L.; Shao, L. New insights on the origin of the basement of the Xisha Uplift, South China Sea. Sci. China Earth Sci. 2017, 60, 2214–2222. [Google Scholar] [CrossRef]
- Wang, Z.; Sun, Z.; Zhu, J.; Guo, M.; Jiang, R. Natural gas geological characteritics and great discovery of large gas fields in deep water area of the western South China Sea. Nat. Gas Ind. 2015, 35, 11–20. [Google Scholar]
- Ru, K.; Pigott, J. Episodic rifting and subsidence in the Soth China Sea. AAPG Bull. 1986, 70, 1136–1155. [Google Scholar]
- Taylor, B.; Hayes, D. Origin and History of the South China Sea Basin. In The Tectonic and Geologic Evolution of Southeast Asian Seas and Islands: Part 2; Hayes, D.E., Ed.; Geophysical Monograph Series; American Geophysical Union: Washington, DC, USA, 1983. [Google Scholar]
- Xie, W.; Zhang, Y.; Sun, Z.; Jiang, J. Characteristics and formation mechanism of faults in Qiongdongnan Basin. Mar. Geol. Quat. Geol. 2007, 27, 71–78. [Google Scholar]
- Xiao, X.M.; Xiong, M.; Tian, H.; Wilkins, R.W.T.; Huang, B.J.; Tang, Y.C. Determination of the source area of the Ya13–1 gas pool in the Qiongdongnan Basin, South China Sea. Org. Geochem. 2006, 37, 990–1002. [Google Scholar] [CrossRef]
- Huang, B.; Xiao, X.; Li, X. Geochemistry and origins of natural gases in the Yinggehai and Qiongdongnan basins, offshore South China Sea. Org. Geochem. 2003, 34, 1009–1025. [Google Scholar] [CrossRef]
- Hu, B.; Wang, L.; Yan, W.; Liu, S.; Cai, D.; Zhang, G.; Zhong, K.; Pei, J.; Sun, B. The tectonic evolution of the Qiongdongnan Basin in the northern margin of the South China Sea. J. Southeast Asian Earth Sci. 2013, 77, 163–182. [Google Scholar] [CrossRef]
- Aplin, A.; Larter, S.; Bigge, M.; Macleod, G.; Swarbrick, R.; Grunberger, D. PVTX history of the North Sea’s Judy oilfield. J. Geochem. Explor. 2000, 69, 641–644. [Google Scholar] [CrossRef]
- Parnell, J. Potential of palaeofluid analysis for understanding oil charge history. Geofluids 2010, 10, 73–82. [Google Scholar] [CrossRef]
- Frezzotti, M.L.; Tecce, F.; Casagli, A. Raman spectroscopy for fluid inclusion analysis. J. Geochem. Explor. 2012, 112, 1–20. [Google Scholar] [CrossRef]
- Mernagh, T.; Wilde, A. The use of the laser Raman microprobe for the determination of salinity in fluid inclusions. Geochim. Cosmochim. Acta 1989, 53, 765–771. [Google Scholar] [CrossRef]
- Lu, Z. Fluid Inclusions; Science Press: Beijing, China, 2004. [Google Scholar]
- Hakimi, M.H.; Al-Matary, A.M.; Hersi, O.S. Burial and thermal history reconstruction of the Mukalla-Sayhut Basin in the Gulf of Aden, Yemen: Implications for hydrocarbon generation from Paleocene potential source rock. J. Afr. Earth Sci. 2018, 144, 59–75. [Google Scholar] [CrossRef]
- El Gawad, E.A.A.; Ghanem, M.F.; Lotfy, M.M.; Mousa, D.A.; Temraz, M.G.; Shehata, A. Burial and thermal history simulation of the subsurface Paleozoic source rocks in Faghur basin, north Western Desert, Egypt: Implication for hydrocarbon generation and expulsion history. Egypt. J. Pet. 2019, 28, 261–271. [Google Scholar] [CrossRef]
- Dowdle, W.L.; Cobb, W.M. Static Formation Temperature From Well Logs—An Empirical Method. J. Pet. Technol. 1975, 27, 1326–1330. [Google Scholar] [CrossRef]
- Shi, X.; Wang, Z.; Jlang, H.; Sun, Z.; Sun, Z.; Yang, J.; Yu, C.; Yang, X. Vertial variation of geothermal parameters in rifted basins and heat flow distribution features of the Qiongdongnan Basin. Chin. J. Geophys. 2015, 58, 939–952. [Google Scholar]
- Burruss, R.; Cercone, K.; Harris, P. Time of hydrocarbon migration, evidence from fluid inclusions in calcite cements, tectonics and burial history. SEPM Spec. Publ. 1985, 36, 277–289. [Google Scholar]
- Zhu, J.; Pei, J.; Sun, Z.; Guo, M.; Yao, Z.; Yang, B.; Hu, X. Feature of neotectonism and its control on late hydrocarbon accumulation in Qiongdongnan Basin. Nat. Gas Geosci. 2011, 22, 649–656. [Google Scholar]
- Xu, Z.; Jiang, S.; Liu, L.; Wu, K.; Li, R.; Liu, Z.; Shao, M.; Jia, K.; Feng, Y. Natural gas accumulation processes of tight sandstone reservoirs in deep formations of Songliao Basin, NE China. J. Nat. Gas Sci. Eng. 2020, 83, 103610. [Google Scholar] [CrossRef]
- Yang, R.; Zhao, X.; Liu, H.; Zhao, C.; Li, H.; Pu, X.; Fu, L.; Li, C. Hydrocarbon charging and accumulation in the Permian reservoir of Wangguantun Buried Hill in Huanghua Depression, Bohai Bay Basin, China. J. Pet. Sci. Eng. 2020, 199, 108297. [Google Scholar] [CrossRef]
- Zuo, Y.; Qiu, N.-S.; Hao, Q.-Q.; Pang, X.-Q.; Gao, X.; Wang, X.-J.; Luo, X.-P.; Zhao, Z.-Y. Geothermal regime and source rock thermal evolution in the Chagan sag, Inner Mongolia, northern China. Mar. Pet. Geol. 2015, 59, 245–267. [Google Scholar] [CrossRef]
- Espitalié, J. Use of Tmax as a Maturation Index for Different Types of Organic Matter. Comparison with Vitrinite Reflectance. In Thermal Modelling in Sedimentary Basins; Burrus, J., Ed.; Publications de l'Institut Français du Pétrole/Institut Français du Pétrole, 44; Editions Technip: Paris, France, 1986; pp. 475–496. [Google Scholar]
- Baskin, D.K. Atomic H/C Ratio of Kerogen as an Estimate of Thermal Maturity and Organic Matter Conversion. AAPG Bull. 1997, 81, 1437–1450. [Google Scholar] [CrossRef]
- Wei, D.; Jinqiang, L.; Wei, Z.; Zenggui, K.; Tong, Z.; Yulin, H. Typical characteristics of fracture-filling hydrate-charged reservoirs caused by heterogeneous fluid flow in the Qiongdongnan Basin, northern south China sea. Mar. Pet. Geol. 2020, 124, 104810. [Google Scholar] [CrossRef]
- Man, X.; Zhu, J.; Yao, Z.; Wu, J.; Wang, L. The characteristic of Mud-Fluid diapir and its control on hydrocarbon accumulation in deep water area, Qiongdongnan Basin. Contrib. Geol. Miner. Resour. Res. 2018, 33, 257–263. [Google Scholar]
- Dimitrov, L. Mud volcanoes—the most important pathway for degassing deeply buried sediments. Earth-Sci. Rev. 2002, 59, 49–76. [Google Scholar] [CrossRef]
- Jia, R.; Fan, C.; Liu, B.; Fu, X.; Jin, Y. Analysis of Natural Hydraulic Fracture Risk of Mudstone Cap Rocks in XD Block of Central Depression in Yinggehai Basin, South China Sea. Energies 2021, 14, 4085. [Google Scholar] [CrossRef]
- Wu, X.; Liang, Q.; Ma, Y.; Shi, Y.; Xia, Z.; Liu, L.; Haeckel, M. Submarine Landslides and their Distribution in the Gas Hydrate Area on the North Slope of the South China Sea. Energies 2018, 11, 3481. [Google Scholar] [CrossRef] [Green Version]
- Wiedicke, M.; Neben, S.; Spiess, V. Mud volcanoes at the front of the Makran accretionary complex, Pakistan. Mar. Geol. 2001, 172, 57–73. [Google Scholar] [CrossRef]
- Song, Y.; Zhao, C.; Zhang, G.; Song, H.; Shan, J.; Chen, L. Research on tectono-thermal modeling for Qiongdongnan Basin and Pearl River Mouth Basin in the northern South China Sea. Chin. J. Geophys. 2011, 54, 057–3069. [Google Scholar] [CrossRef]


Publisher’s Note: MDPI stays neutral with regard to jurisdictional claims in published maps and institutional affiliations. |
© 2022 by the authors. Licensee MDPI, Basel, Switzerland. This article is an open access article distributed under the terms and conditions of the Creative Commons Attribution (CC BY) license (https://creativecommons.org/licenses/by/4.0/).